Responses of Winter Wheat Yields to Warming-Mediated Vernalization Variations Across Temperate Europe
 Xiuchen Wu
 Hongyan Liu
 Xiaoyan Li1,2,3
  Miguel D. Mahecha
- 1State Key Laboratory of Earth Surface Processes and Resource Ecology, Beijing Normal University, Beijing, China
- 2Joint Center for Global Change Studies, Beijing Normal University, Beijing, China
- 3Faculty of Geographical Science, Beijing Normal University, Beijing, China
- 4College of Urban and Environmental Sciences, Peking University, Beijing, China
- 5Max Planck Institute for Biogeochemistry, Jena, Germany
Rapid climate warming, with much higher warming rates in winter and spring, could affect the vernalization fulfillment, a critical process for induction of crop reproductive growth and consequent grain filling in temperate winter crops. However, regional observational evidence of the effects of historical warming-mediated vernalization variations on temperate winter crop yields is lacking. Here, we statistically quantified the interannual sensitivity of winter wheat yields to vernalization degree days (VDD) during 1975–2009 and its spatial relationship with multi-year mean VDD over temperate Europe (TE), using EUROSTAT crop yield statistics, observed and simulated crop phenology data and gridded daily climate data. Our results revealed a pervasively positive interannual sensitivity of winter wheat yields to variations in VDD (γVDD) over TE, with a mean γVDD of 2.8 ± 1.5 kg ha−1 VDD−1. We revealed a significant (p < 0.05) negative exponential relationship between γVDD and multi-year mean VDD for winter wheat across TE, with higher γVDD in winter wheat planting areas with lower multi-year mean VDD. Our findings shed light on potential vulnerability of winter wheat yields to warming-mediated vernalization variations over TE, particularly considering a likely future warmer climate.
Introduction
Increasing evidence from both historical observations and agro-land surface models generally shows that recent and future climate warming (IPCC, 2013) threatens crop growth and yield production for several major staple crops across most parts of the world despite large uncertainties (Lobell and Field, 2007; Lobell et al., 2008, 2011b, 2012; Schlenker and Roberts, 2009; Peltonen-Sainio et al., 2010; Ciscar et al., 2011; Deryng et al., 2011; Asseng et al., 2013; Lobell and Tebaldi, 2014; Rosenzweig et al., 2014; Trnka et al., 2014). Summer crops (e.g., grain maize) are reportedly vulnerable to increasing summer temperatures, particularly increased frequency of extremely high temperatures, heat waves and droughts (Ciais et al., 2005; Lobell and Field, 2007; Schlenker and Roberts, 2009; Lobell et al., 2011a; Perkins et al., 2012), which has led to marked crop yield reductions (e.g., ~20–36% decrease in the yields of grains and fruits in the 2003 heat wave over Europe) (Ciais et al., 2005; Lobell et al., 2011a; Butler and Huybers, 2013). Negative impacts of climate warming have also been observed for many kinds of temperate winter/spring crops globally (Lobell and Field, 2007). Historical climate warming as well as warming-induced increases in heat and drought stress, particularly those occurring within specific crop development stages (e.g., flowering), affect winter crop growth and consequent grain filling (e.g., high temperatures induce shortening of reproductive phases and reduced light interception over the shortened life cycle) (Butterfield and Morison, 1992; Asseng et al., 2011). Notably, climate warming during recent decades has shown great seasonal asymmetry, with much higher warming rates in winter and spring (IPCC, 2013). Winter and spring warming could potentially change the process of vernalization fulfillment (i.e., effective chilling accumulation before anthesis), an important prerequisite for induction of reproductive growth for many winter crops (e.g., winter wheat).
Vernalization is a physiological process with critical impacts on triggering reproductive growth for many winter crops (Díaz et al., 2012; Langer et al., 2014; Wang et al., 2015). Variations in vernalization fulfillment affect the number of leaves and tillers, floral initiation time, flowering phenology and spikelet formation, and thus contribute indirectly to winter crop yields (Brooking, 1996; Kim et al., 2009; Semenov and Shewry, 2011). Genetic controls of vernalization fulfillment are relatively well understood. The genetic mechanisms controlling vernalization are categorized according to their interactions with the environment (Griffiths et al., 2009). Effectiveness of crop vernalization is proposed to be closely linked to the regulation of the group of Vrn genes (Allard et al., 2011; Díaz et al., 2012), which is triggered by specific climate conditions (e.g., low temperature).
Warmer temperatures during the vernalization period could slow the chilling accumulation, and thus delay onset of the reproductive stage (Rosenzweig and Tubiello, 1996), potentially increasing the risk of high temperature exposure for winter crops (e.g., winter wheat) during anthesis and consequent grain filling. A further future warming with a fast pace of roughly 0.2 °C decade−1 is predicted over the next 2–3 decades, with substantially higher warming rates in agricultural areas (IPCC, 2013). The frequency of high temperatures occurring before and around anthesis of winter wheat is predicted to increase in Europe (Semenov and Shewry, 2011). Altogether, these raise concerns regarding the effects of warming-mediated vernalization variations on regional crop yields of vernalization-sensitive winter wheat, a crucial staple crop for humans (FAO, 2006), and the consequent impacts on regional food production. Remarkably, previous studies revealed increasing interannual variations in winter wheat yields in recent decades over central and southern Europe and showed that winter wheat yields in such regions are particularly susceptible to changing climate (Lavalle et al., 2009; Ciscar et al., 2011; Challinor et al., 2014; Wu et al., 2014). However, the effects of warming-mediated vernalization variation on winter wheat yields are poorly quantified and understood observationally at the regional scale. We hypothesize that winter wheat yields over temperate Europe (TE) are more sensitive to variations in vernalization fulfillment in warmer regions (i.e., with less/slow chilling accumulation).
Therefore, in this study, we statistically quantify the spatial pattern in interannual sensitivity of winter wheat yields to vernalization variations in TE for the period 1975–2009 and investigate its spatial relationship to multi-year mean vernalization degree days (VDD), using regional EUROSTAT [at Nomenclature of Territorial Units for Statistics (NUTS) 2 level] crop yield statistics, observed and simulated crop phenology data, and gridded daily climate data. Comprehensive understanding of the interannual sensitivity of winter wheat yields to warming-mediated vernalization variations could provide crucial insights for assessing the possible vulnerability of current winter wheat cropping systems in response to future climate warming in TE and similar regions worldwide.
Materials and Methods
EUROSTAT Crop Yield Statistics and Climate Data
The annual EUROSTAT crop yield statistics at the NUTS 2 level (i.e., basic regions for the application of regional policies) for the period 1975–2009 were obtained from the European Commission (http://appsso.eurostat.ec.europa.eu/nui/show.do?dataset=agrracsh&lang=en, downloaded September 2014). This dataset documents all primary crop types, including wheat and grain maize. The wheat yield data documented in EUROSTAT are mixed with both winter and spring wheat yield observations. Planting areas of winter wheat exceed 83% of the total planting area of wheat crops (both spring and winter wheat) over TE (Sacks et al., 2010). In this study we focus on wheat, which has relatively continuous spatiotemporal coverage (Wu et al., 2014). In the EUROSTAT database, crop yield is reported as the amount of dry matter suitable for consumption (Moors et al., 2010). We first examined the length of available wheat yield records for each NUTS 2 region, and discarded crop yield time series <10 years in length. We then rasterized the crop yield data from the regions at NUTS 2 level into gridded data with a spatial resolution of 0.5° matching the spatial resolution of the gridded climate and land cover data. The rasterizing process followed that of Wu et al. (2014). We calculated the gridded winter wheat yield, , using Equation (1):
where Ak is the area fraction of the kth NUTS 2 region meeting in one grid, Yk is the wheat yield of the kth region recorded in EUROSTAT and n is the number of regions meeting within one grid. In cases where extreme values were present in Yk (i.e., above or below three standard deviations of the crop yield series for kth region during 1975–2009), we assigned the corresponding Ak as zero to minimize possible bias introduced by unrealistic yield records prior to the rasterizing process (Wu et al., 2014).
The gridded dataset (E-OBS V11.0) of daily maximum and minimum temperature and precipitation, with a spatial resolution of 0.5°, during 1950–2014 was obtained from the European Climate Assessment project (http://www.ecad.eu/download/ensembles/download.php) (Hofstra et al., 2009). The WFDEI climate forcing for driving the ORCHIDEE_crop model (for detail see section Calculation of Growing Degree Days (GDD) and VDD) was obtained from the ISIMIP project (https://www.pik-potsdam.de/research/climate-impacts-and-vulnerabilities/research/rd2-cross-cutting-activities/isi-mip/about/isi-mip2).
Calculation of Growing Degree Days (GDD) and VDD
GDD for each grid was calculated using the daily minimum (Tmin) and maximum (Tmax) temperatures, as shown in Equation (2):
where, t and n are days from planting and the total number of days from planting to harvest for winter wheat, respectively. Degree days (DD) was calculated by Equation (3):
where Tt is the mean daily temperature, calculated as (Tmin + Tmax)/2. In this study, we set a base temperature of 0 °C for winter wheat (McMaster and Wilhelm, 1997). We determined the growing season (from planting to harvest) of winter wheat for each grid over TE, based on an observational gridded crop calendar dataset (the SAGE dataset, http://nelson.wisc.edu/sage/data-and-models/crop-calendar-dataset/index.php) (Sacks et al., 2010). This globally available crop calendar dataset has been widely used in global/regional crop yield simulations and statistical analyses of crop yield–climate interactions (Lizumi et al., 2013; Ray et al., 2015). However, this static crop calendar dataset did not allow us to consider the possibly changing planting and harvesting dates for winter wheat over TE.
Two different kinds of vernalization effectiveness functions of daily temperature (VF) were used in this study to calculate the VDD during the vernalization period (from planting to start of anthesis) and to validate each other. One VF followed a quadratic function of daily temperature used in the ORCHIDEE_crop model (Supplementary Figure S1)—the same function used in the STICS model, in detail see Brisson et al. (2008) and Wu et al. (2016)—as shown in Equation (4):
where Tt, Topt, and Tamp are the mean daily temperature, optimal vernalization temperature and thermal semi-amplitude of vernalizing effect, respectively. Topt and Tamp for winter wheat are parameterized in this study as 6.5 and 10.0 °C, respectively, according to Brisson et al. (2008). Another VF was derived from the SIMTAG model (Stapper, 1984), which is a piece-wise linear function of mean daily temperature and similar to that used in the CERES-Wheat model and that of Reinink et al. (1986). The response of VF to Tt in the SIMTAG model is illustrated in Equation (5) (Supplementary Figure S1):
We then calculated the VDD for winter wheat in each grid by multiplying Tt and the corresponding VF factors during the vernalization period. Unfortunately, spatially detailed observations of the start of anthesis for winter wheat over TE are lacking. We alternatively used a recently developed process-based agro-land surface model ORCHIDEE_crop (Wu et al., 2016) to simulate the spatial patterns in the anthesis date for winter wheat over TE during 1979–2009, driven by WFDEI climate forcing and the SAGE gridded planting dates for winter wheat.
In the ORCHIDEE_crop model, the vernalization requirement for winter wheat growth is determined by the genotype-dependent number of vernalizing days (JVC) and the vernalizing value of a given day (JVI), which are counted since germination (IGER). A minimum number of vernalizing days (JVCmin) is required for winter wheat—in our study it was parameterized as 7 according to Brisson et al. (2008). Then, the progress in winter wheat vernalization, RFVI, increases gradually after IGER until it reaches the value 1, following Equation (6):
where JVIi is the vernalizing value of a given day i since IGER, I is the day when RFVI reaches the value 1—for detail see Brisson et al. (2008). The ORCHIDEE_crop model has been validated for both phenology (e.g., harvest date) and yields of winter wheat across seven sites covering a variety of climate conditions over Europe (Wu et al., 2016). In this study, we compared the simulated anthesis dates with the limited field observations in Europe (Supplementary Table 1). Our comparison showed that the ORCHIDEE_crop model can capture the spatial pattern in anthesis dates of winter wheat across different climate conditions in Europe (y = 1.11x – 15.4, R2 = 0.69, p < 0.05) (Supplementary Figure S2). Thus, we used the simulated spatial distribution in anthesis dates from the ORCHIDEE_crop model during 1975–2009 to calculate the VDD over TE.
Interannual Sensitivity of Winter Wheat Yields to Climate Variations
Multivariate linear regression (MLR) was applied to each grid with available winter wheat yields and corresponding climate data to calculate the interannual sensitivity of winter wheat yields to variations of different climate factors over TE for the period 1975–2009, as shown in Equation (7):
where Y is the detrended time series of annual crop yields, γi is the regression coefficient for the ith predictable detrended climate variable Xi; n and ϵ is the number of independent variables and residual error, respectively. GDD, VDD and total growing-season precipitation (PRE) were included in the MLR analyses. A quadratic polynomial function of time was fitted to the wheat-yield series to account for possible non-steady changes in technical improvement, agricultural investment and human management (e.g., fertilization and pesticide use) (Wu et al., 2014). Then, Y was calculated by subtracting the fitted values from the raw yield series. Note that the non-linear effects of technical improvement and human management on winter wheat yields could not be completely eliminated even though we filtered the annual yield series (Lobell and Field, 2007; Wu et al., 2014). The GDD, VDD, and PRE were also detrended using the same method as for crop yields. The detrended time series allowed us to address the effects of interannual variations in climate factors on the interannual variations of winter wheat yields (Wu et al., 2014). We did not constrain a positive contribution of GDD to wheat yields as was done by Butler and Huybers (2013). Their study introduced another variable considering the effects of extremely high temperature on crop development and grain yields, whereas we calculated GDD as the total thermal accumulations during the whole growing season.
Solar radiation, especially during grain filling, is reported to be a very important climate factor regulating winter wheat yields (Murchie et al., 2009; Xiong et al., 2012). However, an inclusion of detrended solar radiation (derived from the ISIMIP project, see section Calculation of Growing Degree Days (GDD) and VDD) summed from the start of anthesis to harvest did not markedly improve the regression model performance, with mean R2 = 0.41 (range 0.28–0.88), indicating that the yields of winter wheat over TE were primarily regulated by variations in thermal and water conditions. To simplify our model structure we did not include solar radiation in our final analyses. To further verify the results of MLR we also performed independent ridge regression analyses to investigate the interannual sensitivity of winter wheat yields to climate variations. Ridge regression has been demonstrated to be effective for addressing collinearity among independent variables in multivariate regression (Hoerl and Kennard, 1970).
In this study, the effects of some other factors, such as photoperiod (Brooking and Jamieson, 2002), carbon dioxide fertilization (Lobell and Field, 2008) and fertilizer application (Godden et al., 1998) on winter wheat yields were not considered. The sensitivity of winter wheat yields to climate factors in six major Köppen–Geiger climate zones was also investigated. The six major climate zones, including arid (grouping BWk, BWh, BSk, and BSh), warm temperate humid (grouping Cfa, Cfb, and Cfc), warm temperate arid (grouping Csa, Csb, Csc, Cwa, Cwb, and Cwc), cold humid (grouping Dfa, Dfb, Dfc, and Dfd), cold summer dry (grouping Dsa, Dsb, Dsc, and Dsd) and tundra, were reclassified based on Köppen–Geiger climate classification (Kottek et al., 2006) over TE (for detail see Supplementary Figure S3).
Spatial Relationships between Interannual Sensitivity of Winter Wheat Yields to VDD (γVDD) and Multi-Year Mean VDD
Exponential quantile regressions at 25th, 50th, and 75th percentiles were applied to investigate the spatial relationships between γVDD and the multi-year mean VDD using the R package of quantreg (V5.21, https://cran.r-project.org/web/packages/quantreg/index.html) (Ruppert et al., 2012). Analyses were performed for data derived from different categories of regions, including all cropland of TE and cropland with significant (p < 0.05) fitted MLR models. A global land cover type data product MCD12Q1 (http://glcf.umd.edu/data/lc/) at a spatial resolution of 0.5° was used to identify cropland over TE. This dataset identifies 17 land cover classes based on the International Geosphere Biosphere Programme vegetation classification scheme (Loveland et al., 2000), which includes 11 natural vegetation classes, three developed and mosaicked land classes, and three non-vegetated land classes. We only retained grids with cropland fraction ≥5% for our final analyses.
Results
Spatial Patterns in Interannual Sensitivity of Winter Wheat Yields to Climate Variations
The MLRs between winter wheat yields and GDD during growing season (from planting to harvest), VDD (based on VF function in the ORCHIDEE crop model) from planting to start of anthesis, and total growing-season PRE for the period 1975–2009 were significant (p < 0.05) in ~61% of grids with sufficiently long records for crop yields over TE. The goodness-of-fit of MLRs had mean R2 = 0.39 (range 0.27–0.88) (Supplementary Figure S4A). The goodness-of-fit of MLR was much smaller (mean R2 = 0.28, range 0.15–0.67) when VDD was excluded from the MLR (Supplementary Figure S4B).
Generally negative interannual sensitivity of winter wheat yields to GDD (γGDD) was observed in most of TE, with a mean of −2.30 ± 1.31 kg ha−1 GDD−1 (Figure 1A). This result indicates that higher GDD accumulation during the growing season can lead to lower winter wheat yields over TE. There was more negative γGDD in parts of temperate-humid regions and cold-humid regions (e.g., eastern France and eastern Europe) of TE (Figure 1A, Supplementary Figure S3). The spatial pattern in the interannual sensitivity of winter wheat yields to total growing-season precipitation (γPRE) showed great variation across TE (Figure 1C). In general, there was negative γPRE in western TE (mainly France) and positive γPRE in parts of eastern TE (Figure 1C).
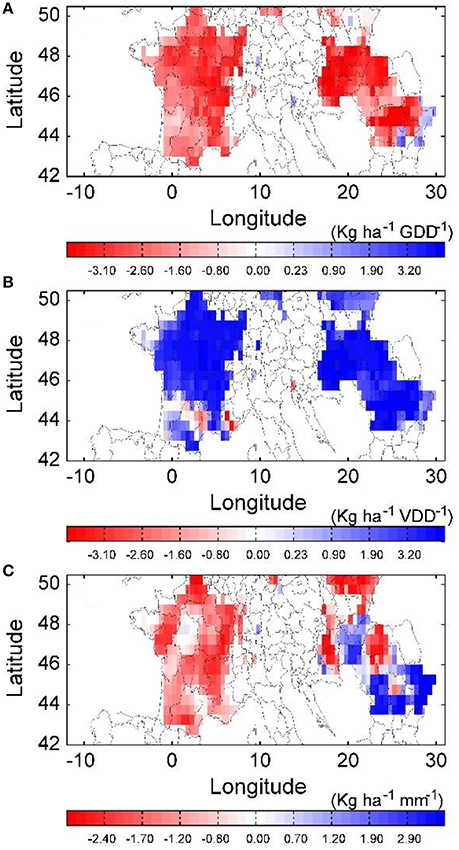
Figure 1. Spatial patterns in the interannual sensitivity of winter wheat yields to climate variations over temperate Europe during 1975–2009. The interannual sensitivity of winter wheat yields to growing-season (from planting to harvest) growing degree days (GDD), vernalization degree days (VDD, based on the quadratic function in ORCHIDEE_crop model) during vernalization period (from planting to start of anthesis, in detail see Methods) and total growing-season precipitation for each grid is estimated by adjustable multivariate linear regressions and shown in (A–C), respectively. White grids indicate that there are no/few yield statistic data available or there is no winter wheat planted. Regions shown in this figure are NUTS 2 regions for crop yield statistics (http://epp.eurostat.ec.europa.eu).
In addition to these findings, we focused on γVDD during 1975–2009. Our results showed a generally positive γVDD (based on VF function in the ORCHIDEE_crop model) in most of TE, with a mean of 2.8 ± 1.5 kg ha−1 VDD−1 (Figure 1B, Table 1). Higher γVDD was observed in continental TE (Figure 1B). To verify the spatial patterns in γGDD, γVDD and γPRE derived from MLR, we performed an independent ridge regression analysis to get a more “accurate” estimation for regression coefficients of predictor variables (Hoerl and Kennard, 1970). The independent ridge regression analysis showed consistent spatial patterns in the interannual sensitivity of winter wheat yields to variations of climate factors (Supplementary Figure S5). Notably, ridge regression analyses produced consistent spatial patterns in the interannual sensitivity of winter wheat yields with two different VDD calculations based on different response functions between vernalization effectiveness and daily temperature (for detail see section Materials and Methods) (Supplementary Figures S5, S6).
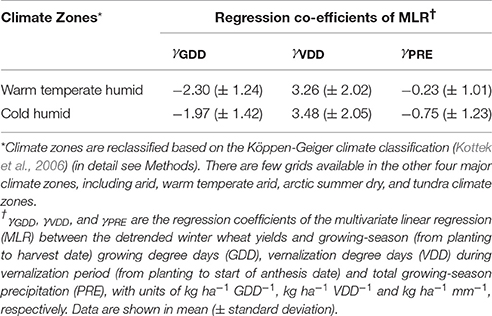
Table 1. Statistics of the regression coefficients between winter wheat yields and climate variables in major climate zones.
Spatial Relationship between γVDD and Multi-Year Mean VDD
The fitted 25th, 50th, and 75th non-linear quantile regressions consistently revealed significant (p < 0.05) negative exponential relationships between γVDD of winter wheat yields and the multi-year mean VDD for two different calculations of VDD during 1975–2009 in cropland grids with a significant fitted MLR model (y = 0.19e−0.005x and y = 0.07e−0.00083x for 50th quantile exponential fits for VDD calculated based on VF from the SIMTAG and ORCHIDEE crop models, respectively) (Figure 2). There was a higher γVDD of winter wheat yields in cropland grids with lower multi-year mean VDD (Figure 2, Supplementary Figure S7).
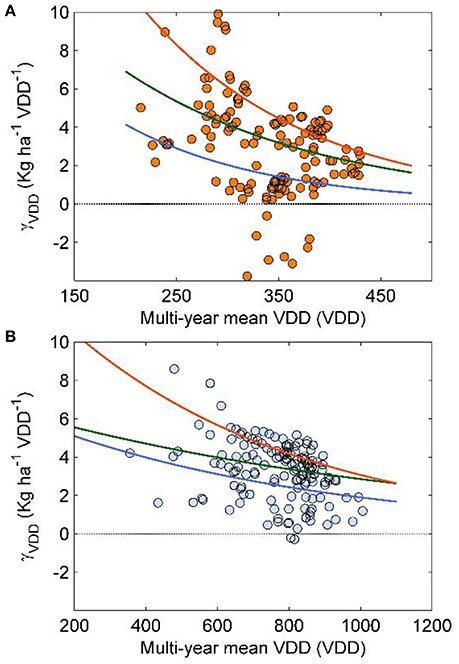
Figure 2. Relationship between multi-year mean vernalization degree days (VDD) and the corresponding interannual sensitivity of winter wheat yields to VDD (γVDD) during 1975–2009 in croplands of temperate Europe with significant fitted multivariate linear regressions. The orange and blue circles in (A,B) represent spatial relationship between γVDD and multi-year mean VDD for two different VDD calculations based on function in SIMTAG and ORCHIDEE_crop, respectively, in grids with significant fitted multivariate linear regressions. The orange, dark green and blue lines in (A) are 75th, 50th, and 25th quantile negative exponential regression lines for the spatial relationships.
Consistent patterns were also found for data derived from all cropland grids (including grids with and without a significant MLR model) over TE for two different VDD calculations (Figure 3). This verified that robustness of the increasing γVDD along with a decreasing VDD was neither susceptible to analysis regions (i.e., grids with significant MLR model vs. all grids within croplands of TE) nor to the different calculations of VDD (Figures 2, 3).
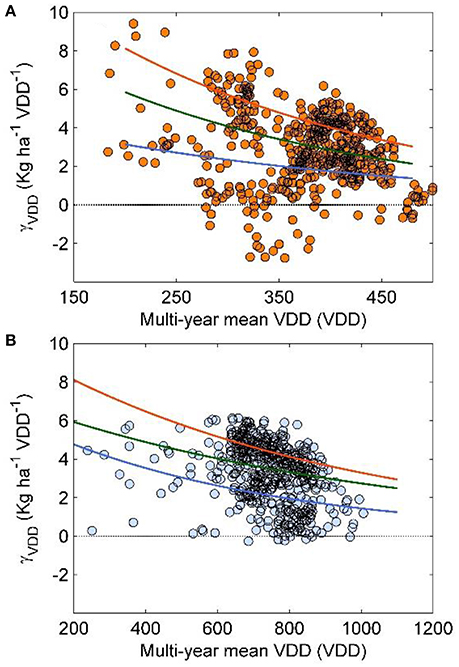
Figure 3. Relationship between multi-year mean vernalization degree days (VDD) and the corresponding sensitivity of winter wheat yields to VDD during 1975–2009 in all croplands of temperate Europe (TE). The orange and blue circles in (A,B) represent spatial relationship between γVDD and multi-year mean VDD for two different VDD calculations based on function in SIMTAG and ORCHIDEE_crop, respectively, in all grids (including grids without significant fitted multivariate linear regressions) in TE. The orange, dark green and blue lines in (A) are 75th, 50th, and 25th quantile negative exponential regression lines for the spatial relationships.
There was great spatial difference in the linear trends in VDD calculated by VF from the ORCHIDEE_crop model during 1975–2009 in TE (Supplementary Figure S8). Our analyses revealed decreasing VDD in parts of southern and continental TE during 1975–2009. Investigation of the relationships between the linear trends of VDD and multi-year mean VDD (based on VF function in the ORCHIDEE_crop model) during 1975–2009 revealed a more rapid decrease in VDD in regions with higher VDD over TE (Figure 4).
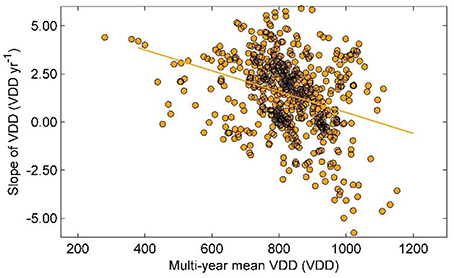
Figure 4. Relationship between multi-year mean vernalization degree days (VDD) and linear trends of VDD during 1975–2009 in croplands of temperate Europe. The orange line is the linear fit for the relationship between multi-year mean VDD (based on the quadratic function in ORCHIDEE_crop) and linear trends of VDD during 1975–2009 (y = −0.005x + 5.9, R2 = 0.13, p < 0.05).
Discussion
Interannual Sensitivity of Winter Wheat Yields to Variations in Climate Factors
The observed negative γGDD over TE is consistent with previous findings that winter wheat yields in this region are susceptible to climate warming (Porter and Semenov, 2005; Wu et al., 2014) and warmer temperatures during the growing season lead to a stagnation, or worse, decreases in crop yields (Brisson et al., 2010; Semenov and Shewry, 2011; Wu et al., 2014). We identified a much more negative γGDD in parts of temperate-humid and cold-humid regions (e.g., eastern France and eastern Europe) of TE, where crops are suffering more severe high temperature stress (Ciais et al., 2005; Wu et al., 2014). Such discernible negative effects of climate warming on the widely observed stagnation or collapse in yields of wheat have also been observed in many other regions worldwide (Calderini and Slafer, 1998; Lobell and Field, 2007; Brisson et al., 2010; Ray et al., 2012), despite the confounding effects of socio-economic and agricultural policy (Lobell, 2012). It was recently reported that the risk of high temperatures to winter wheat yields will increase further in the future, particularly around sensitive development stages, such as flowering (Semenov and Shewry, 2011).
The γPRE of winter wheat yields showed a clear spatial pattern—predominately positive and negative in regions characterized with temperate continental and oceanic climate, respectively (Figure 1C). Winter wheat grown in temperate continental regions with drier spring and summer suffers water stress during the growing season (Ciais et al., 2005; Maracchi et al., 2005; Wu et al., 2014). Thus, winter wheat yields exhibit a positive response to variations in water supply, and this conclusion was confirmed by the positive relationship between winter wheat yields and total growing-season precipitation in temperate continental regions (Figure 1C). In contrast, the positive γPRE disappeared in humid regions of TE, probably because of higher precipitation and the great spatial variations in soil water conditions among climate zones. Given the low irrigation intensity over TE, particularly for winter wheat, changes in precipitation amounts and seasonality accompanying climate warming will influence the magnitude of drought stress on winter wheat yields (Olesen and Bindi, 2002). Current trends and future scenarios depict an increase in drought stress for TE (Spinoni et al., 2015), which will potentially increase competition for water between agriculture and other sectors and uses (Lavalle et al., 2009).
Despite the great spatial variations in γPRE, it exhibited an increasing interannual sensitivity of winter wheat yields to water availability over TE during recent decades (Lavalle et al., 2009; Wu et al., 2014), illustrating an increasing effect of drought stress on winter wheat yields. Increase in water use efficiency caused by increasing carbon dioxide concentration could partly compensate for some of the negative effects of increasing water limitation. However, lower harvestable yields, higher yield variability and reduction in suitable areas for winter wheat are expected in these areas (Maracchi et al., 2005; Lavalle et al., 2009).
Responses of Winter Wheat Yields to Warming-Mediated Vernalization Variations
Positive γVDD of winter wheat yields in most of TE illustrates a crucial effect of vernalization fulfillment on winter wheat yields. We identified higher positive γVDD in regions with lower multi-year mean VDD in croplands of TE, as revealed by robust analyses of non-linear quantile regressions for two kinds of calculations of VDD. These statistical findings qualitatively point out that winter wheat yields are sensitive to variations in VDD, particularly in regions with low VDD. It can be reasonably expected that winter wheat yields will dramatically decline in response to even a subtle decrease in VDD (Figure 2). Our results highlight the possible vulnerability of winter wheat yields to warming-mediated interannual variations in vernalization fulfillment in regions with low VDD, in particular accompanying much higher warming rates in winter and spring (Cohen et al., 2012; IPCC, 2013). Warmer temperatures during the vernalization period can reshape the crop vernalization fulfillment process across diverse bioclimatic regions. Vernalization variations affect the floral initiation time, tiller and spikelet formation, onset of reproductive growth, grain numbers and consequently crop yields (Brooking, 1996; Fischer, 2011). Sufficient vernalization fulfillment before anthesis could partially compensate for the adverse effect of global warming on winter wheat heat stress (Rezaei et al., 2015; Stratonovitch and Semenov, 2015).
The predicted future warming over TE with increases in climate variability (Schär et al., 2004; Seneviratne et al., 2006; Wu et al., 2014) and in the frequency of high temperature and heat waves (Ciais et al., 2005; Perkins et al., 2012; Reichstein et al., 2013) could affect vernalization variation, especially in regions with low VDD (e.g., southern and continental TE). This in turn would reshape the sensitivity of winter wheat yields to variations of VDD in such regions. However, whether and when projected further climate warming will trigger a failure of vernalization (i.e., being unable to meet the minimum vernalization requirement) for current winter wheat cropping systems, particularly in the southern limit of winter wheat planting areas of TE, remains poorly understood. From gene perspective, vernalization process is dominantly regulated by the interactions between genes Vrn 1 and Vrn 2 (Yan et al., 2004). Previous study reported that loss of function of Vrn 2, whether by natural mutations or domestication, could result in reduction in vernalization requirement for winter wheat (Yan et al., 2004). Nevertheless, there still remains a big challenge for building an adaptive support system for sustainable agriculture, given that the breeding and adopting of new varieties is not likely to keep pace with rapid climate warming (Challinor et al., 2016). A northward shift of planting areas for vernalization-sensitive crops (e.g., winter wheat) is reasonably expected in response to the predicted future climate warming in TE (Olesen et al., 2007; IPCC, 2013). However, such shifts may not be sufficiently rapid to compensate for the negative effects of climate change on wheat yields, since virgin land for agriculture expansion is limited. Instead, the increasing γVDD in such regions could inevitably affect current food production. Note that the effects of VDD changes on winter wheat yields may have already been countered by local adaptation measures of individual farmers, such as changing sowing dates or introducing new cultivars. Any such gradual changes would not be captured by the statistical models using detrended data (for detail see section Materials and Methods). Thus, the interannual sensitivity of winter wheat yields to VDD variations reported here can be viewed as a “baseline” of the impacts of warming-mediated VDD variations on winter wheat yields.
Undoubtedly, the responses and adaptation of winter wheat systems to historical and future warming-induced changes in VDD also depend on human management practices, particularly the availability and levels of applied water and adaptive planting schemes (Wang et al., 2015). Although irrigation is seldom applied to winter wheat in Europe, it is locally used to avoid drought stress throughout the whole growing season (Rodríguez Díaz et al., 2007; Zhao et al., 2015), particularly in water-limited regions (see Figure 3A in Zhao et al., 2015). In addition, the possible difference in cultivars planted in rain-fed and irrigated croplands of TE could also bias the sensitivity of winter wheat yields to changes in VDD. However, the lack of sufficient observations of planted cultivars during recent decades across TE does not allow us to estimate the sensitivity of yields for different winter wheat cultivars to warming-induced VDD variations. Thus, to what extent reactions in such human management can modify the sensitivity of winter wheat yields to VDD changes remains unclear. Caution should be also exercised on potential biases in our conclusions that may originate from error propagation from different datasets and data processing (e.g., rasterizing of NUTS 2 crop yields). More accurate and detailed datasets for both crop yields and human management are urgently needed to constrain such uncertainty.
Conclusions
Our statistical analyses showed that past climate warming significantly modified the responses of winter wheat yields to vernalization variations over TE. The observed higher positive γVDD in response to lower VDD reveals that winter wheat yields in warmer regions of TE are particularly susceptible to warming-induced changes in VDD. Our results shed light on the potentially crucial impacts of future winter and spring warming on the vernalization fulfillment and consequent winter wheat yields across TE, one of the world's largest and most productive suppliers of food (FAO, 2006). Notably, the possible non-linear responses of winter wheat growth and yield production to warming-mediated vernalization variations and its interactions with increased occurrence of extreme high temperatures and heat waves (Meehl and Tebaldi, 2004; Stott et al., 2004; Giannakopoulos et al., 2009; Trnka et al., 2014) could interactively undermine winter wheat yields and food security across TE. However, the expected vulnerability of winter crops of TE to future climate change (Lavalle et al., 2009) will also be affected by any changes in cropping systems and human management. An adapting framework is urgently required to sustain future food security from both public and private sectors (Reidsma et al., 2010; Moore and Lobell, 2014), with a precondition of further comprehensive understanding of the responses of winter wheat yields to a warmer climate, in particular combining the regional/global observational networks, remote sensing observations and process-based agro-land surface models.
Author Contributions
XW design the study and lead the data analyses and manuscript writing. MM provides parts of data. HL, XL, and YT aids data analyses. All authors contribute to manuscript writing.
Conflict of Interest Statement
The authors declare that the research was conducted in the absence of any commercial or financial relationships that could be construed as a potential conflict of interest.
Acknowledgments
We thank Nicolas Vuichard and Philippe Ciais from Laboratoire des Sciences du Climat et de I'Environnement of France for their commentary and insights. XW is financially supported by the National Natural Science Foundation of China (41570138). HL is supported by the National Natural Science Foundation of China (NSFC 41325002). XL is financially supported by the National Science Foundation of China (NSFC 41025001, 41130640, and 41321001) and YT is supported by the National Natural Science Youth Foundation of China (Grant No. 41101076).
Supplementary Material
The Supplementary Material for this article can be found online at: https://www.frontiersin.org/articles/10.3389/fevo.2017.00126/full#supplementary-material
References
Allard, V., Veisz, O., Kõszegi, B., Rousset, M., Le Gouis, J., and Martre, P. (2011). The quantitative response of wheat vernalization to environmental variables indicates that vernalization is not a response to cold temperature. J. Exp. Bot. 63, 847–857. doi: 10.1093/jxb/err316
Asseng, S., Ewert, F., Rosenzweig, C., Jones, J., Hatfield, J., Ruane, A., et al. (2013). Uncertainty in simulating wheat yields under climate change. Nat. Clim. Change 3, 827–832. doi: 10.1038/nclimate1916
Asseng, S., Foster, I., and Turner, N. C. (2011). The impact of temperature variability on wheat yields. Glob. Change Biol. 17, 997–1012. doi: 10.1111/j.1365-2486.2010.02262.x
Brisson, N., Gate, P., Gouache, D., Charmet, G., Oury, F. X., and Huard, F. (2010). Why are wheat yields stagnating in Europe? A comprehensive data analysis for France. Field Crops Res. 119, 201–212. doi: 10.1016/j.fcr.2010.07.012
Brisson, N., Launay, M., Mary, B., and Beaudoin, N. (2008). Conceptual Basis, Formalisations and Parameterization of the STICS Crop Model. Versailles: Editions Quae.
Brooking, I., and Jamieson, P. (2002). Temperature and photoperiod response of vernalization in near-isogenic lines of wheat. Field Crops Res. 79, 21–38. doi: 10.1016/S0378-4290(02)00106-5
Brooking, I. R. (1996). Temperature response of vernalization in wheat: a developmental analysis. Ann. Bot. 78, 507–512. doi: 10.1006/anbo.1996.0148
Butler, E. E., and Huybers, P. (2013). Adaptation of US maize to temperature variations. Nat. Clim. Change 3, 68–72. doi: 10.1038/nclimate1585
Butterfield, R. E., and Morison, J. I. L. (1992). Modelling the impact of climatic warming on winter cereal development. Agric. For. Meteorol. 62, 241–261. doi: 10.1016/0168-1923(92)90017-X
Calderini, D. F., and Slafer, G. A. (1998). Changes in yield and yield stability in wheat during the 20th century. Field Crops Res. 57, 335–347. doi: 10.1016/S0378-4290(98)00080-X
Challinor, A. J., Koehler, A. K., Ramirez-Villegas, J., Whitfield, S., and Das, B. (2016). Current warming will reduce yields unless maize breeding and seed systems adapt immediately. Nat. Clim. Change 6, 954–958. doi: 10.1038/nclimate3061
Challinor, A. J., Watson, J., Lobell, D. B., Howden, S. M., Smith, D. R., and Chhetri, N. (2014). A meta-analysis of crop yield under climate change and adaptation. Nat. Clim. Change 4, 287–291. doi: 10.1038/nclimate2153
Ciais, P., Reichstein, M., Viovy, N., Granier, A., Ogee, J., Allard, V., et al. (2005). Europe-wide reduction in primary productivity caused by the heat and drought in 2003. Nature 437, 529–533. doi: 10.1038/nature03972
Ciscar, J. C., Iglesias, A., Feyen, L., Szabó, L., Van Regemorter, D., Amelung, B., et al. (2011). Physical and economic consequences of climate change in Europe. Proc. Natl. Acad. Sci. U.S.A. 108, 2678–2683. doi: 10.1073/pnas.1011612108
Cohen, J. L., Furtado, J. C., Barlow, M., Alexeev, V. A., and Cherry, J. E. (2012). Asymmetric seasonal temperature trends. Geophys. Res. Lett. 39:L04705. doi: 10.1029/2011GL050582
Deryng, D., Sacks, W. J., Barford, C. C., and Ramankutty, N. (2011). Simulating the effects of climate and agricultural management practices on global crop yield. Global Biogeochem. Cycles 25:GB2006. doi: 10.1029/2009GB003765
Díaz, A., Zikhali, M., Turner, A. S., Isaac, P., and Laurie, D. A. (2012). Copy number variation affecting the Photoperiod-B1 and Vernalization-A1 genes is associated with altered flowering time in wheat (Triticum aestivum). PLoS ONE 7:e33234. doi: 10.1371/journal.pone.0033234
FAO (2006). The State of Food Insecurity in the World 2006. Rome: Food and Agriculture Organization of the United Nations.
Fischer, R. (2011). Wheat physiology: a review of recent developments. Crop and Pasture Sci. 62, 95–114. doi: 10.1071/CP10344
Giannakopoulos, C., Le Sager, P., Bindi, M., Moriondo, M., Kostopoulou, E., and Goodess, C. (2009). Climatic changes and associated impacts in the Mediterranean resulting from a 2 C global warming. Glob. Planet. Change 68, 209–224. doi: 10.1016/j.gloplacha.2009.06.001
Godden, D., Batterham, R., and Drynan, R. (1998). Climate change and Australian wheat yield. Nature 391, 447–448. doi: 10.1038/35054
Griffiths, S., Simmonds, J., Leverington, M., Wang, Y., Fish, L., Sayers, L., et al. (2009). Meta-QTL analysis of the genetic control of ear emergence in elite European winter wheat germplasm. Theor. Appl. Genet. 119, 383–395. doi: 10.1007/s00122-009-1046-x
Hoerl, A. E., and Kennard, R. W. (1970). Ridge regression: biased estimation for nonorthogonal problems. Technometrics 12, 55–67. doi: 10.1080/00401706.1970.10488634
Hofstra, N., Haylock, M., New, M., and Jones, P. D. (2009). Testing E-OBS European high-resolution gridded data set of daily precipitation and surface temperature. J. Geophys. Res. Atmos. 114:D2110. doi: 10.1029/2009JD011799
IPCC (2013). Climate Change 2013: The Physical Science Basis. Contribution of Working Group I to the Fifth Assessment Report of the Intergovernmental Panel on Climate Change. Cambridge; New York, NY: Cambridge University Press.
Kim, D. H., Doyle, M. R., Sung, S., and Amasino, R. M. (2009). Vernalization: winter and the timing of flowering in plants. Annu. Rev. Cell Dev. Biol. 25, 277–299. doi: 10.1146/annurev.cellbio.042308.113411
Kottek, M., Grieser, J., Beck, C., Rudolf, B., and Rubel, F. (2006). World map of the Köppen-Geiger climate classification updated. Meteorol. Z. 15, 259–263. doi: 10.1127/0941-2948/2006/0130
Langer, S. M., Longin, C. F. H., and Würschum, T. (2014). Flowering time control in European winter wheat. Front. Plant Sci. 5:537. doi: 10.3389/fpls.2014.00537
Lavalle, C., Micale, F., Houston, T. D., Camia, A., Hiederer, R., Lazar, C., et al. (2009). Climate change in Europe. 3. impact on agriculture and forestry. a review. Agron. Sustain. Dev. 29, 433–446. doi: 10.1051/agro/2008068
Lizumi, T., Sakuma, H., Yokozawa, M., Luo, J.-J., Challinor, A. J., Brown, M. E., et al. (2013). Prediction of seasonal climate-induced variations in global food production. Nat. Clim. Change 3, 904–908. doi: 10.1038/nclimate1945
Lobell, D. B. (2012). The case of the missing wheat. Environ. Res. Lett. 7:021002. doi: 10.1088/1748-9326/7/2/021002
Lobell, D. B., Banziger, M., Magorokosho, C., and Vivek, B. (2011a). Nonlinear heat effects on African maize as evidenced by historical yield trials. Nat. Clim. Chang. 1, 42–45. doi: 10.1038/nclimate1043
Lobell, D. B., Burke, M. B., Tebaldi, C., Mastrandrea, M. D., Falcon, W. P., and Naylor, R. L. (2008). Prioritizing climate change adaptation needs for food security in 2030. Science 319, 607–610. doi: 10.1126/science.1152339
Lobell, D. B., and Field, C. B. (2007). Global scale climate–crop yield relationships and the impacts of recent warming. Environ. Res. Lett. 2:014002. doi: 10.1088/1748-9326/2/1/014002
Lobell, D. B., and Field, C. B. (2008). Estimation of the carbon dioxide (CO2) fertilization effect using growth rate anomalies of CO2 and crop yields since 1961. Glob. Chang. Biol. 14, 39–45. doi: 10.1111/j.1365-2486.2007.01536.x
Lobell, D. B., Schlenker, W., and Costa-Roberts, J. (2011b). Climate trends and global crop production since 1980. Science 333, 616–620. doi: 10.1126/science.1204531
Lobell, D. B., Sibley, A., and Ivan Ortiz-Monasterio, J. (2012). Extreme heat effects on wheat senescence in India. Nat. Clim. Change 2, 186–189. doi: 10.1038/nclimate1356
Lobell, D. B., and Tebaldi, C. (2014). Getting caught with our plants down: the risks of a global crop yield slowdown from climate trends in the next two decades. Environ. Res. Lett. 9:074003 doi: 10.1088/1748-9326/9/7/074003
Loveland, T., Reed, B., Brown, J., Ohlen, D., Zhu, Z., Yang, L., et al. (2000). Development of a global land cover characteristics database and IGBP DISCover from 1 km AVHRR data. Int. J. Remote Sens. 21, 1303–1330. doi: 10.1080/014311600210191
Maracchi, G., Sirotenko, O., and Bindi, M. (2005). Impacts of present and future climate variability on agriculture and forestry in the temperate regions: Europe. Clim. Change 70, 117–135. doi: 10.1007/s10584-005-5939-7
McMaster, G. S., and Wilhelm, W. (1997). Growing degree-days: one equation, two interpretations. Agric. For. Meteorol. 87, 291–300. doi: 10.1016/S0168-1923(97)00027-0
Meehl, G. A., and Tebaldi, C. (2004). More intense, more frequent, and longer lasting heat waves in the 21st century. Science 305, 994–997. doi: 10.1126/science.1098704
Moore, F. C., and Lobell, D. B. (2014). Adaptation potential of European agriculture in response to climate change. Nat. Clim. Chang. 4, 610–614. doi: 10.1038/nclimate2228
Moors, E. J., Jacobs, C., Jans, W., Supit, I., Kutsch, W. L., Bernhofer, C., et al. (2010). Variability in carbon exchange of European croplands. Agric. Ecosyst. Environ. 139, 325–335. doi: 10.1016/j.agee.2010.04.013
Murchie, E. H., Pinto, M., and Horton, P. (2009). Agriculture and the new challenges for photosynthesis research. New Phytol. 181, 532–552. doi: 10.1111/j.1469-8137.2008.02705.x
Olesen, J. E., and Bindi, M. (2002). Consequences of climate change for European agricultural productivity, land use and policy. Eur. J. Agron. 16, 239–262. doi: 10.1016/S1161-0301(02)00004-7
Olesen, J. E., Carter, T., Diaz-Ambrona, C., Fronzek, S., Heidmann, T., Hickler, T., et al. (2007). Uncertainties in projected impacts of climate change on European agriculture and terrestrial ecosystems based on scenarios from regional climate models. Clim. Change 81, 123–143. doi: 10.1007/s10584-006-9216-1
Peltonen-Sainio, P., Jauhiainen, L., Trnka, M., Olesen, J. E., Calanca, P., Eckersten, H., et al. (2010). Coincidence of variation in yield and climate in Europe. Agric. Ecosyst. Environ. 139, 483–489. doi: 10.1016/j.agee.2010.09.006
Perkins, S. E., Alexander, L. V., and Nairn, J. R. (2012). Increasing frequency, intensity and duration of observed global heatwaves and warm spells. Geophys. Res. Lett. 39:L20714. doi: 10.1029/2012GL053361
Porter, J. R., and Semenov, M. A. (2005). Crop responses to climatic variation. Philos. Trans. R. Soc. Lond. B. Biol. Sci. 360, 2021–2035. doi: 10.1098/rstb.2005.1752
Ray, D. K., Gerber, J. S., MacDonald, G. K., and West, P. C. (2015). Climate variation explains a third of global crop yield variability. Nat. Commun. 6:6989. doi: 10.1038/ncomms6989
Ray, D. K., Ramankutty, N., Mueller, N. D., West, P. C., and Foley, J. A. (2012). Recent patterns of crop yield growth and stagnation. Nat. Commun. 3:1293. doi: 10.1038/ncomms2296
Reichstein, M., Bahn, M., Ciais, P., Frank, D., Mahecha, M. D., Seneviratne, S. I., et al. (2013). Climate extremes and the carbon cycle. Nature 500, 287–295. doi: 10.1038/nature12350
Reidsma, P., Ewert, F., Lansink, A. O., and Leemans, R. (2010). Adaptation to climate change and climate variability in European agriculture: the importance of farm level responses. Eur. J. Agron. 32, 91–102. doi: 10.1016/j.eja.2009.06.003
Reinink, K., Jorritsma, I., and Darwinkel, A. (1986). Adaptation of the AFRC wheat phenology model for Dutch conditions. Netherlands J. Agricult. Sci. 34, 1–13.
Rezaei, E. E., Siebert, S., and Ewert, F. (2015). Intensity of heat stress in winter wheat—phenology compensates for the adverse effect of global warming. Environ. Res. Lett. 10:024012. doi: 10.1088/1748-9326/10/2/024012
Rodríguez Díaz, J. A., Weatherhead, E. K., Knox, J. W., and Camacho, E. (2007). Climate change impacts on irrigation water requirements in the Guadalquivir river basin in Spain. Reg. Environ. Change 7, 149–159. doi: 10.1007/s10113-007-0035-3
Rosenzweig, C., Elliott, J., Deryng, D., Ruane, A. C., Müller, C., Arneth, A., et al. (2014). Assessing agricultural risks of climate change in the 21st century in a global gridded crop model intercomparison. Proc. Natl. Acad. Sci. U.S.A. 111, 3268–3273. doi: 10.1073/pnas.1222463110
Rosenzweig, C., and Tubiello, F. N. (1996). Effects of changes in minimum and maximum temperature on wheat yields in the central USA simulation study. Agric. For. Meteorol. 80, 215–230. doi: 10.1016/0168-1923(95)02299-6
Ruppert, J. C., Holm, A., Miehe, S., Muldavin, E., Snyman, H. A., Wesche, K., et al. (2012). Meta-analysis of ANPP and rain-use efficiency confirms indicative value for degradation and supports non-linear response along precipitation gradients in drylands. J. Veg. Sci. 23, 1035–1050. doi: 10.1111/j.1654-1103.2012.01420.x
Sacks, W. J., Deryng, D., Foley, J. A., and Ramankutty, N. (2010). Crop planting dates: an analysis of global patterns. Glob. Ecol. Biogeogr. 19, 607–620. doi: 10.1111/j.1466-8238.2010.00551.x
Schär, C., Vidale, P. L., Lüthi, D., Frei, C., Häberli, C., Liniger, M. A., et al. (2004). The role of increasing temperature variability in European summer heatwaves. Nature 427, 332–336. doi: 10.1038/nature02300
Schlenker, W., and Roberts, M. J. (2009). Nonlinear temperature effects indicate severe damages to U.S. crop yields under climate change. Proc. Natl. Acad. Sci. U.S.A. 106, 15594–15598. doi: 10.1073/pnas.0906865106
Semenov, M. A., and Shewry, P. R. (2011). Modelling predicts that heat stress, not drought, will increase vulnerability of wheat in Europe. Sci. Rep. 1:66. doi: 10.1038/srep00066
Seneviratne, S. I., Lüthi, D., Litschi, M., and Schär, C. (2006). Land–atmosphere coupling and climate change in Europe. Nature 443, 205–209. doi: 10.1038/nature05095
Spinoni, J., Naumann, G., Vogt, J., and Barbosa, P. (2015). European drought climatologies and trends based on a multi-indicator approach. Glob. Planet. Change 127, 50–57. doi: 10.1016/j.gloplacha.2015.01.012
Stapper, M. (1984). SIMTAG: A Simulation Model of Wheat Genotypes. Aleppo: University of New England. Department of Agronomy and Soil Science and International Centre for Agricultural Research in the Dry Areas.
Stott, P. A., Stone, D. A., and Allen, M. R. (2004). Human contribution to the European heatwave of 2003. Nature 432, 610–614. doi: 10.1038/nature03089
Stratonovitch, P., and Semenov, M. A. (2015). Heat tolerance around flowering in wheat identified as a key trait for increased yield potential in Europe under climate change. J. Exp. Bot. 66, 3599–3609. doi: 10.1093/jxb/erv070
Trnka, M., Rotter, R. P., Ruiz-Ramos, M., Kersebaum, K. C., Olesen, J. E., Zalud, Z., et al. (2014). Adverse weather conditions for European wheat production will become more frequent with climate change. Nat. Clim. Change 4, 637–643. doi: 10.1038/nclimate2242
Wang, B., Liu, D. L., Asseng, S., Macadam, I., and Yu, Q. (2015). Impact of climate change on wheat flowering time in eastern Australia. Agric. For. Meteorol. 209, 11–21. doi: 10.1016/j.agrformet.2015.04.028
Wu, X., Babst, F., Ciais, P., Frank, D., Reichstein, M., Wattenbach, M., et al. (2014). Climate-mediated spatiotemporal variability in the terrestrial productivity across Europe. Biogeosciences 11, 3057–3068. doi: 10.5194/bg-11-3057-2014
Wu, X., Vuichard, N., Ciais, P., Viovy, N., de Noblet-Ducoudré, N., Wang, X., et al. (2016). ORCHIDEE-CROP (v0), a new process-based agro-land surface model: model description and evaluation over Europe. Geosci. Model Dev. 9, 857–873. doi: 10.5194/gmd-9-857-2016
Xiong, W., Holman, I., Lin, E., Conway, D., Li, Y., and Wu, W. (2012). Untangling relative contributions of recent climate and CO2 trends to national cereal production in China. Environ. Res. Lett. 7:044014. doi: 10.1088/1748-9326/7/4/044014
Yan, L., Loukoianov, A., Blechl, A., Tranquilli, G., Ramakrishna, W., SanMiguel, P., et al. (2004). The wheat VRN2 gene is a flowering repressor down-regulated by vernalization. Science 303, 1640–1644. doi: 10.1126/science.1094305
Keywords: crop yield, vernalization, climate warming, interannual sensitivity, winter wheat
Citation: Wu X, Liu H, Li X, Tian Y and Mahecha MD (2017) Responses of Winter Wheat Yields to Warming-Mediated Vernalization Variations Across Temperate Europe. Front. Ecol. Evol. 5:126. doi: 10.3389/fevo.2017.00126
Received: 17 April 2017; Accepted: 25 September 2017;
Published: 17 October 2017.
Edited by:
Urs Feller, University of Bern, SwitzerlandReviewed by:
Liming Ye, Ghent University, BelgiumMarcelo Helguera, Instituto Nacional de Tecnología Agropecuaria (INTA), Argentina
Copyright © 2017 Wu, Liu, Li, Tian and Mahecha. This is an open-access article distributed under the terms of the Creative Commons Attribution License (CC BY). The use, distribution or reproduction in other forums is permitted, provided the original author(s) or licensor are credited and that the original publication in this journal is cited, in accordance with accepted academic practice. No use, distribution or reproduction is permitted which does not comply with these terms.
*Correspondence: Xiuchen Wu, xiuchen.wu@bnu.edu.cn