Changes in Modern Pollen Assemblages and Soil Geochemistry along Coastal Environmental Gradients in the Everglades of South Florida
 Qiang Yao
 Kam-biu Liu
- Department of Oceanography and Coastal Sciences, College of the Coast and Environment, Louisiana State University, Baton Rouge, LA, United States
This study aims to document the changes in modern pollen assemblages and soil elemental chemistry along broad edaphic, hydrological, and salinity gradients, including a previously undocumented secondary environmental gradient, in a vast mangrove-dominated wetland region in the Everglades, South Florida. Twenty-five soil surface samples were collected along an interior wetland transect and an estuarine mangrove transect across coastal zones in the Everglades National Park and subjected to palynological and XRF analyses. Modern pollen spectra from the sampling sites were classified into five a priori groups—wet prairie, pineland, inland mangroves, coastal mangroves, and fringe mangroves, based on the five vegetation types and sub-environments from which they were collected. Discriminant analysis shows that all (100%) of the samples are correctly classified into their a priori groups. On a broad scale, the modern pollen assemblages in surface samples collected from different vegetation types reflect the primary environmental gradient in the Florida Coastal Everglades. A distinct salinity and chemical gradient is also recorded in the XRF results, and the complexity of these gradients is captured at both regional and local scales. At the regional scale, concentrations of all the elements increase from terrestrial toward coastal sites. At the local scale, XRF results show a progressive decrease in most chemical concentrations and in the Cl/Br and Ca/Ti ratios away from the Shark River Slough at each individual site, suggesting that a secondary fluvial/tidal gradient also exists locally as a function of the distance from the river, the main carrier of these chemicals. This study provides new evidence to show that tidal flooding from the Shark River Estuary is directly related to the nutrient availability in the surrounding mangrove forests. These data will deepen our understanding of the environmental drivers behind the vegetation zonation in the region, especially in the mangrove ecosystems, and fill a gap in the pollen data network for the Everglades.
Introduction
Delineating the interface between the land and the sea, the coastal zone is marked by environmental gradients as defined by elevation, soil, hydrology, and salinity. Most of the coastal ecosystems are influenced by a primary environmental gradient as a function of distance away from the sea. In some cases, particularly along estuaries, a secondary environmental gradient may also occur as a function of distance away from the river. Superimposed on these environmental gradients are biotic gradients, as defined by a land-to-sea array of vegetation communities. Pollen analysis and X-ray fluorescence (XRF) analysis have been used in paleoecological studies to reconstruct the Holocene history of vegetation changes in the coastal wetlands of the southeastern U.S. (Willard et al., 2001; Donders et al., 2005; van Soelen et al., 2010, 2012; Yao et al., 2015; Yao and Liu, 2017). However, with few exceptions (e.g., Willard et al., 2001), these reconstructions are not supported by surface samples documenting the changes in modern pollen assemblages and soil chemistry along various environmental gradients in these coastal wetland sites, particularly along the secondary environmental gradient in estuarine wetlands.
The Everglades, situated at the southern tip of the Florida peninsula, contain the largest freshwater marshes and contiguous mangrove swamps in North America drained by sloughs and estuaries along hundreds of miles of shoreline (Lodge, 2010). Since the early twentieth century, anthropogenic activities (agriculture and urbanization) have dramatically reduced the seasonality of freshwater flow (Light and Dineen, 1994) and have affected the surface and groundwater flows throughout the Everglades (Saha et al., 2012). In order to provide essential baseline data for the restoration of the hydrological conditions of the Everglades, numerous studies are being conducted along the coastal zones in the Everglades National Park (ENP) to understand the long-term ecological processes and developmental history of these natural wetlands. Recent paleoecological studies from the region suggest that the vegetation shifts in wetland communities during the middle and late Holocene are closely associated with the regional and global-scale climatic phenomena such as position of the Intertropical Convergence Zone (ITCZ) (Donders et al., 2005), the state of the North Atlantic Oscillation (NAO) (Willard and Cronin, 2007; Bernhardt and Willard, 2009), and the Holocene sea-level rise (Yao et al., 2015; Yao and Liu, 2017). To produce accurate results using fossil pollen analysis, it is important to understand how the modern vegetation and environmental gradients are represented in the modern pollen rain of the study area. In the Everglades National Park, few such studies have been conducted. Willard et al. (2001) documented the modern pollen rain from wetland sub-environments in the Florida Everglades and the results show that they have distinctive surface pollen assemblages. Their study, which focuses on the freshwater wetlands and more inland communities, also suggests that pollen record is useful for reconstructing past hydrologic and edaphic changes in the Everglades. More importantly, although estuarine mangroves are the dominant mangrove types in the Everglades, most studies only focus on the primary environmental gradient between coastal and inland sites (Chen and Twilley, 1999a,b; Willard et al., 2001; Castañeda-Moya et al., 2010, 2013). Modern pollen assemblages and soil chemistry along the secondary environmental gradient away from the river has been overlooked in the research literature from the Everglades.
Here we present the results of palynological and XRF analyses on 25 soil surface samples collected from two transects in the Everglades. Our study focuses on the mangrove-dominated, more clearly marine-influenced wetlands in the southern and southwestern tip of the Everglades, especially the primary and secondary environmental gradients along the Shark River Estuary, where the slow-flowing freshwater originated from Lake Okeechobee meets the saltwater being pushed up by tides from the Gulf of Mexico. The main research questions we seek to answer are: (1) how are coastal environmental gradients expressed in an estuarine environment that encompasses a variety of vegetation communities from pineland and wet prairie to different mangrove ecosystems? (2) As the Shark River is the main conduit in the transportation of chemical nutrients, does a secondary environmental gradient exist in mangrove dominated coastal wetlands, as a function of distance away from the river? Here we present data that relate soil salinity and geochemistry to modern pollen assemblages across that gradient. Data from this study can provide useful baselines for monitoring future environmental changes relating to ongoing disturbance from rising sea-level, hurricanes, and anthropogenic activities.
Study Region and Study Sites
The study region (~600,000 ha) lies between 25°24′06″ and 25°21′10″ N latitude, and between 80°36′02″ and 81°06′53.6″ W longitude (Figure 1). Tides are semi-diurnal with >0.5 m mean tidal amplitude (Wanless et al., 1994). During the wet season, water overflowing Lake Okeechobee from the rainfall results in a southward sheet flow along a gentle slope of ~3 cm/km into the Shark River Slough (SRS) (Lodge, 2010). The water entering SRS flows through long-hydroperiod prairie sloughs into mangrove swamps at the river estuary and then into Whitewater Bay or the Gulf of Mexico along the southwestern coast of the Everglades. However, these densely vegetated wetlands are phosphate-limited (Castañeda-Moya et al., 2010), where the limited nutrient is supplied by the Gulf of Mexico, rather than the upper watershed (Chen and Twilley, 1999a,b). The study region is also frequently impacted by hurricanes. The sedimentary record revealed that at least 6 paleo-hurricanes made direct landfall at the Shark River Estuary during the past 3000 years (Yao et al., 2015). Instrumental record documented 17 hurricanes near the study area since the nineteenth century (NOAA, 2016), the most recent one being Hurricane Wilma in 2005, a category 3 hurricane that caused massive mangrove mortality and deposited a 10-cm thick storm deposit at the mouth of the SRS (Castañeda-Moya et al., 2010; Yao et al., 2015).
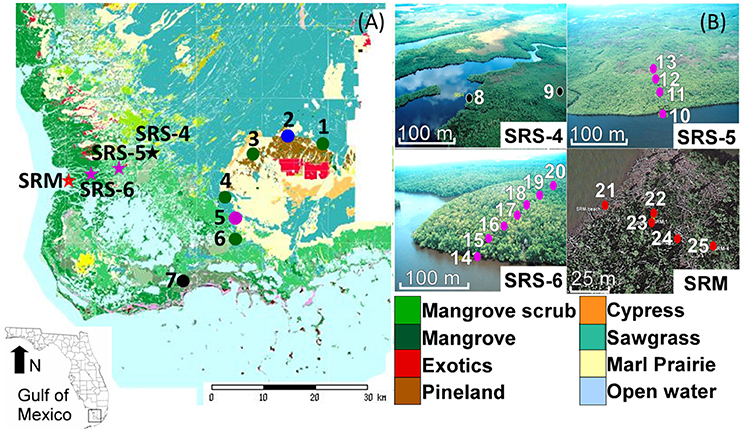
Figure 1. (A) Location of surface sample sites in the Everglades National Park, South Florida, in relation to the vegetation map according to FCE LTER (2018). Colored circles indicate locations of the individual samples along the inland-to-coast transect. Stars indicate sites along the estuarine mangrove transect where multiple samples were taken at each site. Sample numbers correspond to Site IDs described in Table 1. (B) Aerial photos of sites SRS-4, SRS-5, and SRS-6, and SRM showing locations of individual samples (colored dots). Note the massive mortality of mangroves caused by Hurricane Wilma (2005) evident at site SRM. The vegetation map and aerial photos in this figure was retrieved from FCE LTER. Copyright permission has been acquired.
At the regional scale, the coastal vegetation in the Everglades is arranged in well-defined floristic zones parallel to the coast, with mixed mangrove stands near the coast giving way to brackish marshes (graminoid-mangrove mixtures) and then freshwater marshes further inland (Ross et al., 2000). This distinct vegetation gradient is the result of varying tolerances of mangroves (Rhizophora mangle, Avicennia germinans, Laguncularia racemosa, and Conocarpus erectus—a mangrove associate) and coastal wetland plants (e.g., Cladium jamaicense and Spartina alterniflora) to environmental parameters such as substrate, hydrology, and salinity (Ross et al., 2000; Lodge, 2010; Yao et al., 2015). Within our study region, we recognize five major vegetation types that are controlled by the primary (inland-to-coast) environmental gradient according to elevation, soil, hydrology, and salinity, as follows.
Pineland
Pinelands lie in the vicinity of the wet prairie mosaic, and their substrates typically consist of sand and rocks (Willard et al., 2001). They grow in the higher grounds, thereby having short hydroperiod and burned frequently (Platt, 1999). Pine savannahs in the ENP are dominated by Pinus, Quercus, and containing Burseraceae, Poaceae, Asteraceae, and subtropical hammocks. Such areas are also present in the interior region of the Everglades (e.g., Lostman's Pines and Raccoon Point regions of Big Cypress National Preserve; Doren et al., 1993; Willard et al., 2001; Schmitz et al., 2002; Bernhardt and Willard, 2009; Hanan et al., 2010).
Wet Prairie
Wet prairies occupy most of the interior region in the Everglades and are the driest marsh type in the Everglades (Gleason and Stone, 1994; Lodge, 2010). Wet prairies typically have hydroperiods of less than 12 months and are thus dry seasonally, tending to burn more than once a decade, and even every 1–2 years if adjacent to pine savannas (Platt, 1999; Schmitz et al., 2002; Slocum et al., 2003).
Marl forming periphyton is a common component of wet prairies and is responsible for calcite marl deposits on the limestone terrain (Willard et al., 2001). Patches of well-developed cypress forests, pinelands, and inland mangroves are common sub-environments that lie within the wet prairie mosaics. Cypress forests can be found in deep depressions, thereby having a long hydroperiod resulting in thick peat accumulation (up to 2 m) (Duever et al., 1984). Such wetlands are found from the northern Everglades to the Shark River Slough, Whitewater Bay, Cape Sable, and Florida Bay (Gleason and Stone, 1994; Lodge, 2010).
Inland Mangrove Forests
The coastal area of the ENP, from Naples to Florida Bay, is covered by ~15,000 ha of dense mangrove forests consisting of R. mangle, A. germinans, L. racemosa, and C. erectus (Simard et al., 2006; Lodge, 2010). In our study area, all these mangrove species can be found and they form unique sub-mangrove habitats along the primary environmental gradient. Based on their composition and relative distance to the ocean, we categorize these mangrove forests into three groups, which are inland mangrove forests, coastal mangrove forests, and fringe mangrove forests. Inland mangrove forests occur in the innermost zone of the mangrove ecosystem and constitute a broad ecotone between the zones of marine and freshwater influences. This vegetation zone has very low salinity (<5 ppt) and is characterized by graminoid-mangrove mixtures consisting of sawgrass marsh and dwarf mixed mangrove stands (Castañeda-Moya, 2010). Conocarpus, a mangrove associate growing in slightly fresher and inland environments (Hogarth, 2007; Urrego et al., 2010), dominates inland mangrove forests.
Coastal Mangrove Forests
Across the graminoid-mangrove ecotone, areas that receive more marine influences are characterized by coastal mangrove forests. A clear zonation pattern can be observed within this vegetation zone. Rhizophora trees are found in areas closer to the shoreline, because they have unique aerial roots which allow them to colonize sites with an unstable substrate and direct tidal influence (Hogarth, 2007). Moving further inland, Avicennia typically colonizes highly saline environments. They have pneumatophores that supply oxygen to the underground roots in anaerobic sediments. Laguncularia, often lacking special root adaptations, occurs in the interior of the coastal mangrove forest, followed by Conocarpus in the upland transitional areas adjunct to inland mangrove forests (Hogarth, 2007).
Fringe Mangrove Forests
Fringe mangrove forests in the Everglades grow as a relatively thin fringe along the coasts facing directly toward the Gulf of Mexico and the Atlantic Ocean. They are directly exposed to tides and waves, as well as storm surges and strong winds. Therefore, Rhizophora is usually the dominant species in fringe mangrove forests. Typically, because the mangroves growing in fringe mangrove forests are flushed daily by tides, they are not as tall and productive as coastal mangrove forests growing in more inland and upstream areas. However, because the limited nutrients in the coastal Everglades are supplied by the Gulf of Mexico through tides, waves, and storms (Castañeda-Moya et al., 2010), fringe mangrove forests contain the tallest mangrove trees, and the tree height decreases toward coastal and inland mangrove forests (Table 1) (Chen and Twilley, 1999a,b; Simard et al., 2006).
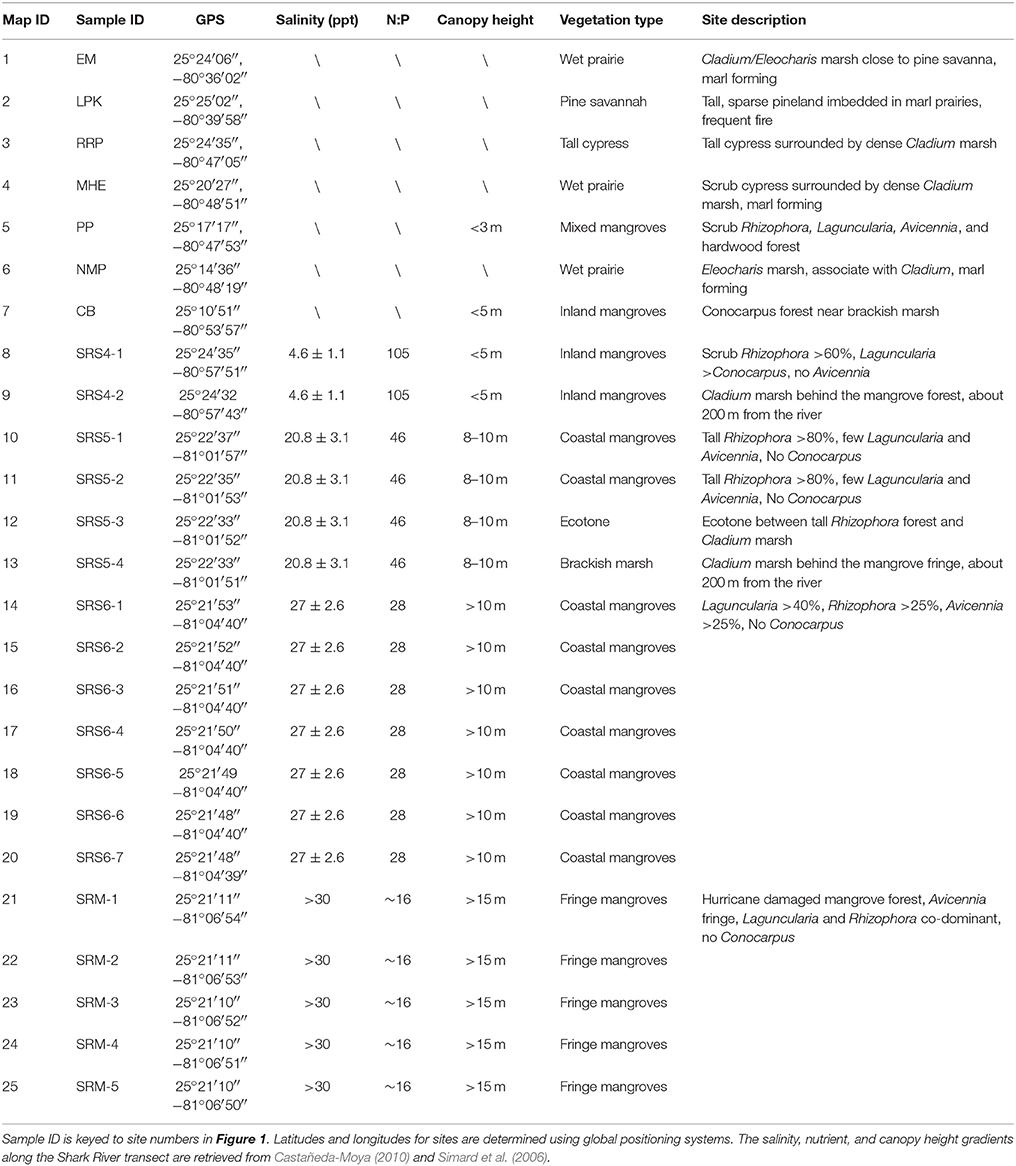
Table 1. Surface sample sites in the Everglades National Park, South Florida.
Materials and Methods
Surface Samples and Sampled Coastal Sub-environments
In this study, we collected 25 surface samples along two primary transects in the Everglades—an inland-to-coast transect across major ecosystems from pinelands to wetlands along the main road in the Everglades National Park (ENP), and an estuarine transect through mangrove-dominated communities along the Shark River Slough (Table 1, Figure 1). The two transects parallel distinct primary coastal environmental gradients and cut across major vegetation communities. The surface samples were collected by pushing a small shovel into the ground to collect up to 5 cm of upper materials. After removing plant litter, roots, and algae on the surface of the samples, the very top layer of the sediments was used for pollen and geochemical analyses.
Interior Wetland Transect (Samples 1–7)
The inland transect follows a clear edaphic and hydrological gradient from inland to coast and encompasses a variety of vegetation types. It starts from a wet prairie close to the entrance of ENP, through patches of pineland and cypress forest, and then ends in a patch of inland mangrove forest. Patches of mixed mangrove and inland mangrove forests can be found along the ecotone between wet prairies and coastal mangrove swamps.
Samples 1, 3, 4, and 6 were taken from prairies outside the woodland habitats but adjacent to the park entrance marsh (EM), Rock Reef Pass (RRP), Mohagony Hammock (MHE), and Nine Mile Pond (NMP), respectively, along the main park road (Figure 1, Table 1). Vegetation at these four sampling locations is typical of wet prairies consisting of mainly sawgrass marsh (C. jamaicense) and willow thickets (Salix), with Sagittaria and Typha in more open areas (Slocum et al., 2003). Vegetation at RRP (#3) is dominated by bald cypress (Taxodium distichum), with other bottomland hardwood species (e.g., Acer, Fraxinus, Annona) forming the subcanopy, and Utricularia, Eleocharis, ferns, and Asteraceae present in the understory.
Sample 2 was taken at Long Pine Key (LPK) within patches of pineland surrounded by wet prairies (Figure 1, Table 1). Distinctive from the herbaceous wetlands of the surrounding area, LPK sits directly on the limestone bedrock that is marginally higher than the surrounding landscape, allowing the area to drain properly and support more diverse, upland plants. Vegetation at LPK is dominated by Pinus elliottii var densa, Quercus virginiana, graminoids, and saw palmettos.
Samples 5 and 7 were taken at Paurotis Pond (PP) and Coot Bay (CB) amid patches of mixed mangrove and inland mangrove forests along the wet prairie-mangrove ecotone (Figure 1, Table 1). Vegetation at PP consists of a mixture of Rhizophora, Laguncularia, Avicennia, and some bottomland hardwood species. Vegetation at CB contains mainly Conocarpus, a mangrove associate species typically found in more inland and upland areas adjacent to coastal mangrove forests.
Estuarine Mangrove Transect (Samples 8–25)
The estuarine transect follows the channel of SRS, the largest freshwater outlet in the Everglades (Lodge, 2010), and parallels a unique hydrological and salinity gradient controlled by the interaction between tidal activities and river discharge (Castañeda-Moya, 2010). This transect consists of four main study sites (SRM, SRS-6, SRS-5, and SRS-4) extending from the mouth of the SRS to about 18 km upstream. Within each site, surface samples were taken along a secondary transect perpendicular to the river (Figure 1) to capture the secondary environmental gradients as a function of the distance away from the river, which transports not only water but also chemicals from the watershed to the sea (Chen and Twilley, 1999a,b; Castañeda-Moya et al., 2010). A total of 18 samples were collected from the four main study sites. Data for nutrient availability at all sites along the estuarine mangrove transect and salinity data for site SRS-4, SRS-5, and SRS-6 were retrieved from long-term monitoring studies conducted by our collaborators (Castañeda-Moya, 2010; Castañeda-Moya et al., 2010, 2013). Salinity data for site SRM were measured during our field expeditions. Canopy height data at all sites along this transect were retrieved from Simard et al. (2006).
Samples 8 and 9 were taken at SRS-4 (Table 1, Figure 1), located at ~18.2 km upstream from the mouth of the estuary. Due to its most inland location, site SRS-4 has the lowest salinity along the estuarine transect as it is mainly influenced by groundwater and freshwater runoff. The soil has a pore-water salinity of 4.6 ± 1.1 ppt and is very nutrient-limited (Chen and Twilley, 1999b; Castañeda-Moya, 2010). Hydrologically this site is flooded 165 days annually. The vegetation here, characterized as an inland mangrove forest, is dominated by Rhizophora (67% of total aboveground biomass) with Laguncularia and Conocarpus as co-dominant species. This is the only site along this transect where Conocarpus is found and Avicennia is absent due to low salinity. In addition, the average mangrove canopy height (<5 m) at this site is the lowest along the transect.
Samples 10–13 and 14–20 were taken at sites SRS-5 and SRS-6, which are located 9.9 km and 4.6 km from the mouth of SRS, respectively (Figure 1). Tidal influence gradually increases downstream while fluvial influence decreases; thus nutrient availability, salinity, and canopy height progressively increase from site SRS-4 toward the mouth of the estuary (Table 1). Vegetation at these two sites is both characterized as a coastal mangrove forest, although local variations in floristic composition and species abundance exist. Site SRS-5 is flooded 197 days annually. Rhizophora is the dominant species (87% of total aboveground biomass) with very few other mangrove species (Castañeda-Moya, 2010). Site SRS-6 is flooded 233 days annually. Laguncularia is the dominant species (43% of total aboveground biomass) with Rhizophora and Avicennia as co-dominant species (43% of total aboveground biomass each). In addition, site SRS-6 has the highest complexity index along the estuarine transect (Castañeda-Moya, 2010).
Samples 21–25 were taken at site SRM (Table 1, Figure 1). This site is located on the edge of Ponce de Leon Bay, at the mouths of Whitewater Bay and Shark River Estuary (Yao et al., 2015). Flooded by tides 90% of the year, site SRM has the highest salinity and the longest tidal inundation along the estuarine transect. The vegetation is characterized as a fringing mangrove forest, where Laguncularia and Rhizophora are co-dominant species (Chen and Twilley, 1999a,b; Yao et al., 2015). The average mangrove canopy height at SRM is the highest (>15 m) among all four sites (Simard et al., 2006; Yao et al., 2015). Hurricane Wilma, the most recent major hurricane to cross SRS, made landfall as a category 3 storm near site SRM in 2005. Strong winds and storm surge from this hurricane caused damage to ~1,250 ha of mangrove forest along the west coast of the ENP, resulting in 90% mortality of trees with diameters at breast height greater than 2.5 cm (Smith et al., 2009; Whelan et al., 2009). The storm surge flooded site SRM with 3–4 m of water and deposited ~10 cm of marine sediment as far as 10 km inland (Castañeda-Moya et al., 2010; Yao et al., 2015).
Laboratory Analyses
In the laboratory, all surface samples were subjected to pollen and X-ray fluorescence (XRF) analyses. XRF analysis was conducted by using a handheld Olympus Innov-X DELTA Premium XRF analyzer, which measures the elemental concentrations (ppm) of 25+ elements with an atomic number >15. Fifteen elements were detected in our samples, but six of them were in traceable amount with no systematic changes. Therefore, nine major chemical elements and Cl/Br and Ca/Ti ratios were used in this study as a proxy to present the chemical nutrient availability (Figure 3).
For palynological analysis, one commercial Lycopodium (Lc) tablet (~18,583 grains) was added to each sample (0.9 mL) as an exotic marker to calculate pollen concentration (grains/cm3) (sum = Lc added * no. of grains counted/Lc counted/volume of sample). Laboratory procedures for pollen and XRF analyses followed those described in Yao et al. (2015). Except for samples taken from wet prairies, the hydrofluoric acid treatment was omitted because samples contain mostly peat and a limited amount of silicates. The main pollen taxa, non-pollen microfossils, and charcoal were counted and photographed with an objective of 400x magnification (see Supplement Figure for photos of selected microfossils). The identification of pollen was based on published pollen illustrations by McAndrews et al. (1973) and Willard et al. (2004). Approximately 300 grains of pollen and spores were counted in most of the samples, and this pollen sum was used for the calculation of pollen percentages. The palynological results are reported in percentage (%) diagrams (Figure 2), and the common pollen grains are photographed (Supplementary Material).
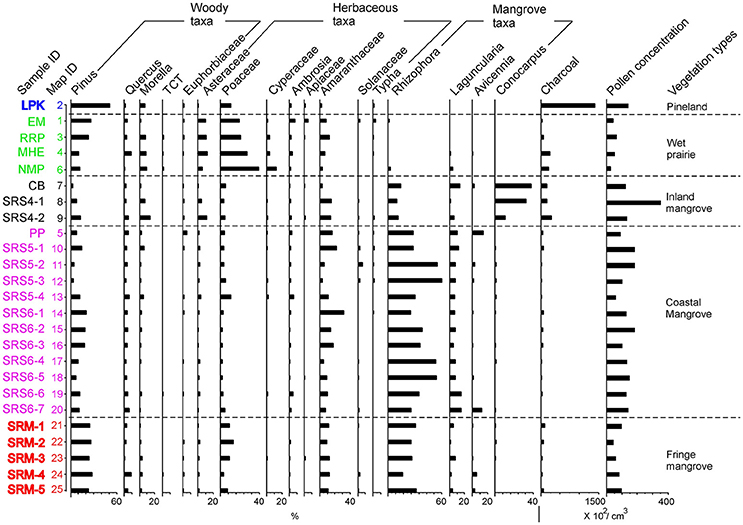
Figure 2. Pollen percentage diagram of 17 major pollen taxa for 25 surface samples. Samples are arranged into five groups based on the five vegetation types and sub-environments from which the surface samples were collected. Pollen assemblages are color coded to aid the identification. Same color coding applies to the map and all the other figures. Pollen percentages are calculated based on the sum of all pollen taxa. The pollen concentration curve is added on the right to facilitate comparison. TCT is an acronym for Cupressaceae, Taxodiaceae (papillate grains), and Taxaceae.
Statistical Analyses
Principal component analysis (PCA) was performed by using the C-2 version 1.7 on all surface samples to reveal the distribution of pollen taxa according to the environmental gradients (Figure 4). The PCA results provide a basis to classify different pollen taxa into statistically meaningful groups, which can be interpreted in terms of different wetland sub-environment. In addition, discriminant analysis (sensu Liu and Lam, 1985), an inferential statistical technique, was performed using the IBM SPSS version 22.0 to verify the pollen assemblages with reference to the inferred vegetation types. The stepwise method was used to derive the discriminant functions.
Results
Pollen Assemblages in Vegetation Sub-environments
Seventeen pollen taxa were identified in the 25 surface samples (Figure 2). Samples are arranged into five a priori groups based on the five vegetation types and sub-environments from which the surface samples were collected, i.e., pineland, wet prairies, inland mangroves, coastal mangroves, and fringing mangroves. The resultant pollen diagram shows that each vegetation type contains a characteristic modern pollen assemblage that can be distinguished from the others (Figure 2).
Pineland
The pineland group includes only sample 2 (Figure 2). Pollen concentration of this sample is ~15,000 grains/cm3. The relatively high pollen concentration of this sample is due to the fact that Pinus (>50%), the dominant pollen taxon of this sample (Figure 2), is a very prolific pollen producer. The concentration of charcoal fragments in this sample is also very high (>150,000/cm3). This result is in agreement with the short hydroperiod and frequent wildfires in pine savannas in the Everglades (Platt, 1999). Overall, the pollen assemblage of pineland is closely associated with the local vegetation and environment previously described (Doren et al., 1993; Willard et al., 2001; Schmitz et al., 2002; Bernhardt and Willard, 2009; Hanan et al., 2010).
Wet Prairies
The wet prairie group includes samples 1, 3, 4, and 6 (Figure 2). Pollen concentrations are relatively low in wet prairie assemblages, with less than 6,000 grains/cm3 sediment, compared to 15,000 grains/cm3 in mangrove and pineland assemblages. The main reason may be that Poaceae, the dominant plant group in the wet prairies, tend to be a low pollen producer (Ma et al., 2008). It may also be due to greater oxidation of sediments associated with marl (Willard et al., 2001) and relatively dry substrates. Pollen assemblages in wet prairie group (Figure 2) are characterized by high percentages of herbaceous taxa (Poaceae >20%, Asteraceae >10%, Cyperaceae 5–10%) and Pinus (10–30%), and low percentages of all other pollen taxa. Although sample 3 is taken from cypress forest surrounded by wet prairies, Taxodium is poorly represented in the pollen record. Taxodium pollen is often not well-preserved in dry substrates due to their thin walls (exine). Therefore, the pollen assemblages of cypress forest patches cannot be differentiated from the surrounding wet prairies.
Inland Mangroves
The inland mangrove group includes samples 7, 8, and 9 (Figure 2). Pollen concentrations of this group are relatively high, ranging from 15,000 to 35,000 grains/cm3. The most abundant pollen type is Conocarpus (15–35%) (Figure 2). Rhizophora and Amaranthaceae are also common at these sites, ranging from 5 to 10 and 2 to 5%, respectively, of the total pollen sum. The lower percentages of upland taxa (e.g., Pinus and Quercus) and higher pollen concentrations in these samples from Coot Bay and SRS-4 reflect the relatively longer hydroperiod at these sites than the wet prairie sites due to their closer proximity to the Gulf of Mexico and Florida Bay. The local vegetation at Coot Bay is dominated by Conocarpus, and SRS-4 is the only site along the Shark River transect where Conocarpus is found (Castañeda-Moya, 2010). Therefore, the surface pollen assemblages at these sites are a remarkably good representation of the local vegetation.
Coastal Mangroves
This group includes sample 5 taken at Paurotis Pond (PP), a mixed mangrove forest, and samples 10–20 taken from sites SRS-5 and SRS-6 (Figure 2). Pollen concentrations of these samples range from 10,000 to 20,000 grains/cm3. Pollen assemblages of this group are distinguishable by maximum percentages of Rhizophora pollen (20–55%); Laguncularia, Amaranthaceae, and Pinus are also common at these sites, ranging from 5 to 15, 5 to 30, and 10 to 30% of the total pollen sum, respectively (Figure 2). The concentration of charcoal fragments in this group is the lowest among all surface samples (<2,000/cm3). This probably reflects long hydroperiod and the absence of fires at these sites since SRS-5 and SRS-6 are 9.9 and 4.1 miles from the Gulf of Mexico and regularly receive tidal flooding (Castañeda-Moya et al., 2010; Yao and Liu, 2017).
Fringe Mangroves
The fringe mangrove fringe group includes all the samples from site SRM (samples 21–25), which is located at the mouth of the Shark River Estuary (Figure 1). Pollen concentrations of this group are all below 10,000/cm3, the lowest among mangrove sub-environments. Comparing with the coastal mangroves group, Rhizophora becomes less frequent while a distinct increase of Pinus and Poaceae is observed in the pollen diagram (Figure 2). Pinus might be wind transported or washed in from offshore by tides and waves, thereby representing a regional pollen signal. Poaceae may represent post-disturbance successional vegetation growing in gaps created by lightning or hurricanes (e.g., Hurricane Wilma).
Numerical Analysis of Modern Pollen Data
Percentage data of all 17 identified pollen taxa were used in PCA and discriminant analysis. On the PCA biplot of the 17 identified pollen taxa (Figure 4), the first two principal components (PC) account for 31.1% and 14.4% of the variance, respectively. Along PC1 axis, freshwater marsh species (Morella, Poaceae, Asteraceae, TCT, Typha, and Cyperaceae) have the highest positive loadings, whereas mangrove species (Rhizophora, Laguncularia, and Avicennia) have the highest negative loadings. It is likely that PC1 represents a salinity gradient whereby salinity increases from positive toward the negative end of the axis. On PC2, freshwater wetland species (Cyperaceae, TCT, Morella, and Poaceae) have the highest negative loadings, and Apiaceae, Typha, Pinus, and Ambrosia have the highest positive loadings. Although Apiaceae and Typha have the highest scores on PC2, they have very low percentages in the pollen assemblage, whereas Pinus is very abundant. Pinus is the dominant pollen and plant taxon in the pinelands and wet prairies, the vegetation type with the driest substrate and shortest hydroperiod in the Everglades. Thus it is reasonable to interpret that PC2 represents a hydrological gradient reflecting moisture in the substrate.
Discriminant analysis was used to validate the classification of the inferred pollen groups (Liu and Lam, 1985). All (100%) of the samples are correctly classified into their a priori groups, and 84% of cross-validated grouped cases were correctly classified (Table 2). Figure 5 shows the five groups of surface samples plotted against discriminant functions 1 and 2, which account for 46.2 and 33.8% of the variance, respectively. The five groups and their centroids are clearly distinct from each other with little overlap between groups (Figure 5). The high degree of correct classification suggests that the identification of the inferred vegetation types is statistically robust.
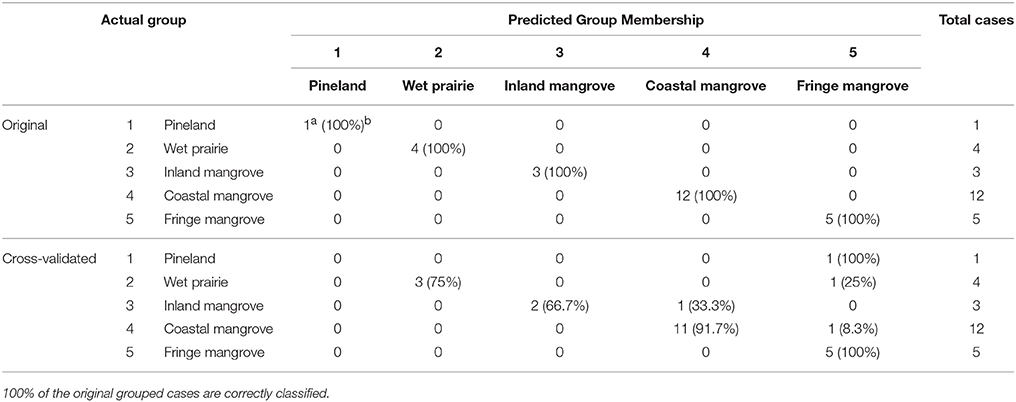
Table 2. Classification results of the discriminant analysis performed on 25 surface samples.
X-Ray Fluorescence Data
The XRF results show that the pineland sample (#2) is characterized by high contents of Ca, Fe, and Ti (Figure 3). The high Ca value is probably derived from the limestone bedrock and calcareous sandy substrates that are characteristic of the pinelands in the Everglades (Duever et al., 1984; Willard et al., 2001). Fe and Ti are indicators of terrestrial sediment source, which is consistent with the inland locations of these samples.
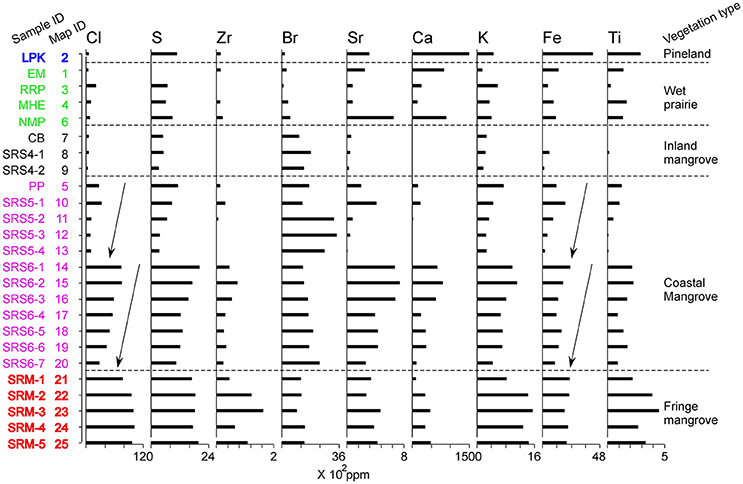
Figure 3. XRF diagram of 9 major elements for 25 surface samples. The samples are classified into the same vegetation types as in Figure 2 to facilitate comparison. Arrows are inserted next to the Cl and Fe curves within the SRS-5 and SRS-6 groups to highlight the decreasing trends of elemental concentrations for these and other elements along the secondary environmental gradient.
The overall XRF signature for samples 1, 3, 4, and 6 from the wet prairies resembles that of the pinelands, although it contains lower contents of terrestrial components (Ti, and Fe) because these samples are taken from wetland environments. High concentrations of Ca and Sr in samples 1 and 6 are likely derived from periphyton, which is a common feature in wet prairies (Willard et al., 2001). Generally, the chemical elemental assemblages still bear the overall imprint of the underlying marl substrate in the wet prairies and adjacent areas (Lodge, 2010).
Among the mangrove swamp groups, inland mangrove samples (#7–9) have the lowest concentrations of all measured elements (Figure 3), suggesting low chemical availability in these sampling locations. This is probably due to the diminished influence of the bedrock and marl substrate as the thickness of the mangrove peat increases downstream, so that the nutrient-poor freshwater carried by the Shark River Slough becomes the main source of chemicals for the soils at these inland mangrove sites.
Chemical richness increases distinctly toward the coastal mangrove sites. Samples from site SRS-5 has higher contents of all measured elements than samples from the inland mangrove group, but elemental concentrations increase even more remarkably in samples (#14–20) from site SRS-6 (Figure 3). These stepwise jumps in chemical availability downstream from sites SRS-4 to SRS-5 and SRS-6 follow the primary environmental gradient of increasing salinity from land to sea, as the marine influences increase downstream. This implies that tidal waters become an increasingly important supplier of chemicals to the mangrove forests as the distance from the coast decreases. In addition, close examination of the XRF data within each group of samples along the secondary transect at sites SRS-5 and SRS-6 (Figure 1, Table 1) reveals a striking trend of decreasing elemental concentrations away from the river (depicted by arrows in Figure 3). This trend applies to Cl/Br and Ca/Ti ratios and nearly all chemical elements including Cl, S, Zr, Sr, Ca, K, Fe, and Ti. The only exception is Br, which seems to show an opposite or mixed trend. This spatial pattern suggests that the river itself is the primary supplier of chemical elements to the coastal mangrove forests along its course.
Samples from site SRM, representing fringing mangrove forests, generally contain higher concentrations of most measured elements than samples from other mangrove sites (Figure 3). Previous studies have shown that ~10 cm of storm sediments from Hurricane Wilma was deposited on the surface of site SRM in 2005 (Castañeda-Moya et al., 2010; Yao et al., 2015). We believe that while surface samples from site SRM capture the pollen signature of local vegetation, their chemical signature was strongly influenced by the Wilma storm deposit rather than the in situ accumulation. These sediments came from the nearshore shelf of southern Florida (i.e., Ponce de Leon Bay) and are richer in chemicals than those derived from the nutrient-deficient ecosystems in the Everglades (Chen and Twilley, 1999a,b; Lodge, 2010). It is also remarkable that the trend of decreasing elemental concentrations away from the river, which was observed along the secondary transect of samples within sites SRS-5 and SRS-6 (see the last paragraph), is not apparent along the secondary transect of samples (#21–26) within the SRM group. The absence of a secondary environmental gradient away from the river further supports our interpretation that in the fringing mangrove forests chemical availability is largely controlled by geochemical release from the storm deposit on the substrate, and the river is no longer the primary source of chemical supply to sites located further away from the channel.
Discussion and Conclusion
On a broad scale, the modern pollen deposition in surface samples collected from different vegetation types reflects the regional environmental gradients in the Florida Everglades (Figures 2, 3). The pollen surface sample from the pinelands is dominated by Pinus pollen with very a high abundance of microscopic charcoal, indicating frequent fires in this upland ecosystem. The pineland sample also has a distinctive chemical elemental signature, characterized by high concentrations of Ca, Fe, and Ti. Samples from the wet prairies are characterized by high percentages of herbaceous taxa, and the chemical elemental assemblages reflect the underlying marl substrate. The surface samples from the estuarine transect show clear vegetation zonation with Conocarpus dominating the inland mangroves and Rhizophora increasing toward coastal mangrove forests. Rhizophora becomes less frequent in fringe mangrove forests while a distinct increase in regional and disturbance taxa (Pinus and Poaceae) is observed. The XRF data show very low concentrations of all elements in inland mangrove sites but concentrations increase progressively toward coastal and fringe mangrove sites.
Despite these broad-scale correspondences between regional vegetation pattern and modern pollen rain, local variations exist, partly as a result of differential pollen representation among different plant taxa. For example, along the inland transect, Cladium/Eleocharis (Cyperaceae) plants are common or dominant components in most of the wet prairie sites (Willard et al., 2001), yet Cyperaceae pollen only account for 5–10% of the total pollen sum and the predominant pollen taxa of the wet prairies group are Pinus and Poaceae. A likely explanation for this discrepancy is that Cyperaceae pollen has very thin walls (exine) and is remarkably under-represented in the pollen record due to their poor preservation. In the coastal mangrove group, although the most common plant at site SRS-6 is Laguncularia (>40% of aboveground biomass), the surface pollen assemblages from SRS-6 do not show a significant increase in Laguncularia pollen relative to those from SRS-5. This is because the pollen of Laguncularia is insect-pollinated and usually under-represented in the pollen record (Ellison, 2008). A percentage of 2–5% of Laguncularia in total pollen sum have been interpreted to represent mangrove forests dominated by white mangrove in previous studies (Behling et al., 2001; Urrego et al., 2009, 2010). Only in two (#19, 20) out of the seven samples in the SRS-6 group do Laguncularia pollen exceed 10% of the pollen sum. These low percentages, while seemingly unremarkable, are sufficient to support the inference of the predominance of Laguncularia at the study site. In addition, our pollen results also revealed an interesting point regarding the abundance of Amaranthaceae. Among the 25 surface samples retrieved from two transects, the average and maximum percentage for Amaranthaceae pollen is ~15% and ~30% of the total pollen sum, far less than the Amaranthaceae dominated environments (up to 90%) revealed by paleoecological records prior to 2,000 cal yr BP from the Shark River Slough (Willard and Bernhardt, 2011; Yao et al., 2015; Yao and Liu, 2017) and during the last two millennia from the north and central Everglades (Willard et al., 2001, 2006; Bernhardt and Willard, 2009). This discrepancy raises the possibility that the high Amaranthaceae zones in these pollen records represent no-analog vegetation communities.
As suggested by the PCA biplot, PC1 represents a salinity gradient whereby Rhizophora indicates higher salinity and freshwater wetland plants point to lower salinity (Figure 4). This salinity gradient is also clearly documented in the pollen diagram (Figure 2). At a regional scale, from wet prairies to inland mangroves and coastal mangroves, the overall percentages of herbaceous taxa gradually decrease while Rhizophora pollen becomes more abundant, indicating increasing salinity from inland toward coastal sites. This salinity gradient is even more prominent along the estuarine transect. From the inland mangrove group to the coastal mangrove group, the overall percentages of Rhizophora increase significantly. These results are consistent with previous studies indicating that tidal influences and salinity increase toward the mouth of the Shark River Estuary (Castañeda-Moya, 2010). One exception is site SRM located at the mouth of the estuary. One would expect that Rhizophora pollen would be more abundant at this site because it has the highest salinity among all sampling locations. However, surface pollen assemblages from site SRM have lower percentages of Rhizophora and lower total pollen concentrations in comparison with other mangrove sites along the estuarine transect (Figure 2). This irony is most likely related to severe disturbance from Hurricane Wilma, which caused massive mortality of mangrove trees at site SRM (Smith et al., 2009). As documented by previous studies, killing of the tall Rhizophora trees in the canopy trees lowered the population and flowering rate of Rhizophora and provided opportunities for heliophytic herbaceous plants to colonize (Smith et al., 1994, 2009; Baldwin et al., 1995, 2001; Vegas-Vilarrúbia and Rull, 2002; Piou et al., 2006; Hogarth, 2007; Thaxton et al., 2007). A distinct increase in Poaceae in the pollen diagram may represent early successional vegetation communities due to gap creation (Zhang et al., 2012). The elevated pollen percentages of Pinus in the SRM group of samples can also be partly explained by a relative increase in the wind-transported regional pollen input (of which Pinus is a major component) into the more open mangrove forest after the hurricane disturbance. Pinus is also a major component of marine-transported pollen in coastal seawater (Chmura et al., 1999) and could have been deposited in this coastal/estuarine mouth site by tidal currents or storm surge currents.
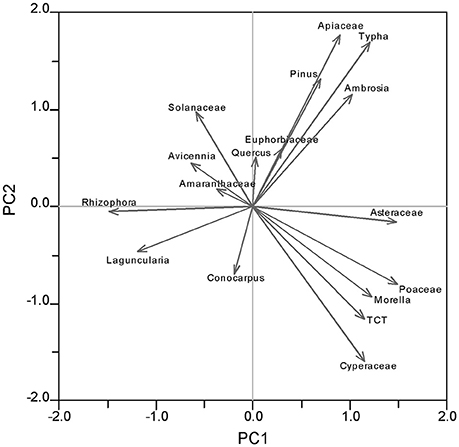
Figure 4. PCA biplot showing coordinates of charcoal and 17 pollen taxa from pollen diagram of surface samples plotted along component 1 and 2.
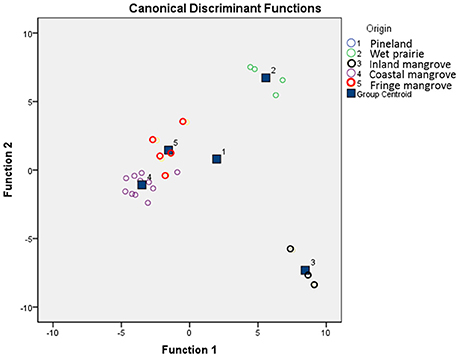
Figure 5. The 25 surface samples plotted against canonical discriminant functions 1 and 2 and their classification into five primary groups representing five coastal sub-environments.
Distinct salinity and nutrient gradients are also recorded in the XRF results, and their complexities are captured along both primary and secondary environmental gradients. At the regional scale, concentrations of all the elements increase from terrestrial toward coastal sites. Particularly along the estuarine transect, samples from site SRS-6 contain much higher contents of all measured elements than samples from site SRS-5 (Figure 3). These observations are consistent with results from previous studies, which revealed that the limited nutrients available to ecosystems along the Shark River Estuary are supplied from the Gulf of Mexico by tidal and storm activities, rather than from the upper watershed (Chen and Twilley, 1999a,b). From site SRS-4 toward site SRM, tidal influence gradually increases while river discharge asserts less control. Overall, our XRF results further elucidate the primary environmental gradient in the Everglades, which in this case, follows the tidal and chemical gradients along the Shark River Estuary. This primary environmental and biogeochemical gradient also explains the mangrove canopy height gradient along the Shark River Estuary (Table 1), with taller mangrove trees occurring at sites closer to the ocean (Castañeda-Moya et al., 2010).
At the local scale, a clear secondary environmental gradient is also demonstrated within each study site along the estuarine transect (Figure 3). Because samples were taken perpendicularly to the river at sites SRS-4, SRS-5, and SRS-6, each sample is located further away from the river than the previous sample at each individual site (Figure 1). XRF results show a progressive decrease in Ca/Ti and Cl/Br ratios and elemental concentrations toward samples farther away from the Shark River Slough at each individual site (SRS4-1 toward SRS4-2, SRS-5-1 toward SRS-5-4, and SRS-6-1 toward SRS-6-7) (Figure 3). High Ca/Ti and Cl/Br ratios have been described to indicate marine and tidal influences in previous studies (Ingram et al., 2010; Liu et al., 2014). This phenomenon of decreasing Ca/Ti and Cl/Br ratios and elemental concentrations along the secondary environmental gradient suggests that samples taken farther away from the river will receive less fluvial and tidal influence, hence less nutrients. An intriguing exception is offered by Br, which shows an opposite trend of increasing elemental concentrations away from the Shark River Slough. One possible explanation is that due to the relatively higher electron density and smaller bond strength of the bromine atom, electrophilic substitution is more favorable for aqueous bromine (HOBr/OBr−), thus making Br more preferential to react with natural organic matter and more concentrated in shallower water (Westerhoff et al., 2004). In our case, the increasing Br concentration away from the river may reflect a progressive decrease in water depth and increase in organic matter away from the Shark River Slough. However, much work is needed to better understand the behavior of Br in the environmental context of this coastal region.
Previous studies have only documented the primary environmental gradient as a function of tidal influence along the Shark River Estuary at a regional scale (i.e., upstream and downstream along the river) (Chen and Twilley, 1999a,b), but our results reveal that a secondary (fluvial/tidal and chemical) gradient exists also at the local scale, as a function of the distance from the river that is the main carrier of these chemicals. This secondary environmental gradient is perpendicular to the regional upstream-downstream gradient and is parallel to the distance from the river to the sampling site. Our results provide new and additional evidence to show that tidal flooding from the Shark River Estuary is directly related to the nutrient availability in the surrounding mangrove forests. In order to fully understand the environmental drivers along the coastal vegetation gradient, more studies are needed to document the vegetation dynamics along the environmental gradients, particularly the secondary environmental gradient, at both the regional and local scales.
Author Contributions
QY conducted fieldwork, collected the samples, and undertook palynological and XRF analyses for this study. He also drafted the manuscript and revised it in response to reviewers' comments. KL contributed to the conception and design of the work and the interpretation of the data. He also critically revised the manuscript and gave final approval of the version to be published. Both QY and KL agree to be accountable for all aspects of the work in ensuring that questions related to the accuracy or integrity of any part of the work are appropriately investigated and resolved.
Funding
This research was supported by grants from the National Science Foundation (NSF DDRI Grant No. BCS-1303114) and the Inter-American Institute for Global Change Research (IAI #SGP-CRA-2050).
Conflict of Interest Statement
The authors declare that the research was conducted in the absence of any commercial or financial relationships that could be construed as a potential conflict of interest.
Acknowledgments
We thank T. A. McCloskey, T. A. Bianchette, V. H. Rivera-Monroy, and E. Castañeda-Moya for their assistance in fieldwork, and to the two reviewers for their thoughtful reviews. Special thanks go to the Florida Coastal Everglades, Long-term Ecological Research (FCE LTER) program and Florida International University for field and logistical support during this study.
Supplementary Material
The Supplementary Material for this article can be found online at: https://www.frontiersin.org/articles/10.3389/fevo.2017.00178/full#supplementary-material
Figure S1. Common trees and shrubs: 1–2. Pinus, 3. Moraceae, 4. Burseraceae, 5. Morella, 6–7. Quercus, 8. TCT, 9–12. Euphorbiaceae, 13–15. Rubiaceae, 16–17. Salix.
Figure S2. Common herbaceous taxa: 1–2. Cyperaceae, 3–4. Poaceae, 5–6. Amaranthaceae, 7–8. Typha, 9–10. Sagittaria, 11 Ambrosia (Asteraceae short-spine), 12–16. Asteraceae (long-spine), 17–18. Solanaceae, 19–20. Batis maritima (Bataceae), 21–23. Apiaceae.
Figure S3. Mangrove taxa: 1–5. Rhizophora mangle, 6–10. Laguncularia racemosa, 11–14. Avicennia germinans, 15–20. Conocarpus erecta.
Figure S4. Other pollen taxa: 1. Alternanthera (Amaranthaceae), 2. Liquidambar, 3. Alnus, 4. Ulmus, 5. Corylus, 6. Haloragaceae, 7–8. Nyssa, 9–10. Fabaceae, 11. Hydrocotyle, 12–13. Nymphaeaceae, 14–15. Ilex.
Figure S5. Spores: 1. Lycopodium, 2–3. Salvinia minima, 4. Pteridium, 5–7. Polypodiaceae, 8. Glomus, 9–18. Unidentified fungal spores.
Figure S6. Non-pollen/spore microfossil: 1–2. Test linings of foraminifera, 3. Pediastrum (green algae), 4 and 6. cysts of Lingulodinium machaerophorum (dinoflagellates), 5. cyst of Polysphaeridinium zoharyi (dinoflagellate), 7. cyst of Spiniferites sp. (dinoflagellate), 8 and 9. possibly reworked dinoflagellate cysts.
References
Baldwin, A. H., Egnotovich, M. S., Ford, M. A., and Platt, W. J. (2001). Regeneration in fringe mangrove forests damaged by Hurricane Andrew. Plant Ecol. 57, 151–164. doi: 10.1023/A:1013941304875
Baldwin, A. H., Platt, W. J., Gathen, K. L., Lessman, J. M., and Rauch, T. J. (1995). Hurricane damage and regeneration in fringe mangrove forests of southeast Florida USA. J. Coast. Res. 21, 169–183.
Behling, H., Cohen, M. C. L., and Lara, R. J. (2001). Studies on Holocene mangrove ecosystem dynamics of the Braganc, a Peninsula in North-Eastern Pará, Brazil. Palaeogeogr. Palaeoclimatol. Palaeoecol. 167, 225–242. doi: 10.1016/S0031-0182(00)00239-X
Bernhardt, C. E., and Willard, D. A. (2009). Response of the Everglades ridge and slough landscape to climate variability and 20th-century water management. Ecol. Appl. 19, 1723–1738. doi: 10.1890/08-0779.1
Castañeda-Moya, E. (2010). Landscape Patterns of Community Structure, Biomass and Net Primary Productivity of Mangrove Forests in the Florida Coastal Everglades as a Function of Resources, Regulators, Hydroperiod, and Hurricane Disturbance. Dissertation, Louisiana State University.
Castañeda-Moya, E., Twilley, R. R., and Rivera-Monroy, V. H. (2013). Allocation of biomass and net primary productivity of mangrove forests along environmental gradients in the Florida Coastal Everglades, USA. For. Ecol. Manage. 307, 226–241. doi: 10.1016/j.foreco.2013.07.011
Castañeda-Moya, E., Twilley, R. R., Rivera-Monroy, V. H., Zhang, K. Q., Davis, S. E. III, and Ross, M. S. (2010). Sediment and nutrient deposition associated with Hurricane Wilma in mangroves of the Florida Coastal Everglades. Estuar. Coasts 33, 45–58. doi: 10.1007/s12237-009-9242-0
Chen, R., and Twilley, R. R. (1999a). A simulation model of organic matter and nutrient accumulation in mangrove wetland soils. Biogeochemistry 44, 93–118. doi: 10.1007/BF00993000
Chen, R., and Twilley, R. R. (1999b). Patterns of mangrove forest structure and soil nutrient dynamics along the Shark River Estuary, Florida. Estuaries 22, 955–970. doi: 10.2307/1353075
Chmura, G. L., Smirnov, A. N., and Campbell, I. A. (1999). Pollen transport through distributaries and depositional patterns in coastal waters. Palaeogeogr. Palaeoclimatol. Palaeoecol. 149, 257–270. doi: 10.1016/S0031-0182(98)00205-3
Donders, T. H., Wagner, F., Dilcher, D. L., and Visscher, H. (2005). Mid- to late-Holocene El Ni-o-Southern Oscillation dynamics reflected in the subtropical terrestrial realm. Proc. Natl. Acad. Sci. U.S.A. 102, 10904–10908. doi: 10.1073/pnas.0505015102
Doren, R. F., Platt, W. J., and Whiteaker, L. D. (1993). Density and size structure of slash pine stands in the everglades region of south Florida. For. Ecol. Manage. 59, 295–311. doi: 10.1016/0378-1127(93)90009-C
Duever, M. J., Meeder, J. F., and Duever, L. C. (1984). “Ecosystems of the big cypress swamp,” in Cypress Swamps, eds K. C. Ewel and H. J. Odum (Gainesville, FL: University of Florida Press), 294–303.
Ellison, J. C. (2008). Long-term retrospection on mangrove development using sediment cores and pollen analysis: a review. Aquat. Bot. 89, 93–104. doi: 10.1016/j.aquabot.2008.02.007
FCE LTER (2018). Florida Coastal Everglades LTER Mapserver Project. Available online at: http://fcelter.fiu.edu/gis/everglades-map/ (Accessed October 2, 2017).
Gleason, P. J., and Stone, P. A. (1994). “Age, origin and landscape evolution of the Everglades peatland,” in Everglades, the Ecosystem and its Restoration, eds S. M. Davis and J. C. Ogden (Delray Beach, FL: St. Lucie Press), 149–198.
Hanan, E. J., Ross, M. S., Ruiz, P. L., and Saht, J. P. (2010). Multi-scaled grassland-woody plant dynamics in the heterogeneous marl prairies of the southern everglades. Ecosystems 13, 1256–1274. doi: 10.1007/s10021-010-9386-6
Hogarth, P. J. (2007). The Biology of Mangroves and Seagrasses, 2nd Edn. New York, NY: Oxford University Press.
Ingram, W. C., Meyers, S. R., Brunner, C. A., and Martens, C. S. (2010). Late Pleistocene–Holocene sedimentation surrounding an active seafloor gas-hydrate and cold-seep field on the Northern Gulf of Mexico Slope. Mar. Geol. 278, 43–53. doi: 10.1016/j.margeo.2010.09.002
Light, S. S., and Dineen, J. W. (1994). “Water control in the Everglades: a historical perspective,” in Everglades: The Ecosystem and Its Restoration, eds S. M. Davis and J. C. Ogden (Delray Beach, FL: St. Lucie Press), 47–84.
Liu, K. B., and Lam, N. S. N. (1985). Paleovegetational reconstruction based on modern and fossil pollen data: an application of discriminant analysis. Ann. Assoc. Am. Geograph. 75, 115–130. doi: 10.1111/j.1467-8306.1985.tb00062.x
Liu, K. B., McCloskey, T. A., Ortego, S., and Maiti, K. (2014). Sedimentary signature of Hurricane Isaac in a Taxodium swamp on the western margin of Lake Pontchartrain, Louisiana, USA. Proc. Int. Assoc. Hydrol. Sci. 367, 421–428. doi: 10.5194/piahs-367-421-2015
Lodge, T. E. (2010). The Everglades Handbook: Understanding the Ecosystem, 2nd Edn. Boca Raton, FL: CRC Press.
Ma, Y., Liu, K. B., Feng, Z., Sang, Y., Wang, W., and Sun, A. (2008). A survey of modern pollen and vegetation along a south–north transect in Mongolia. J. Biogeogr. 35, 1512–1532. doi: 10.1111/j.1365-2699.2007.01871.x
McAndrews, J. H., Berti, A. A., and Norris, G. (1973). Key to the Quaternary Pollen and Spores of the Great Lakes Region. Toronto, ON: Royal Ontario Museum.
NOAA (2016). National Oceanic and Atmospheric Administration, Hurricane Center, Historical Hurricane Tracks website. Available online at: https://coast.noaa.gov/hurricanes/ (Accessed October 5, 2015).
Piou, C., Feller, I., Berger, U., and Chi, F. (2006). Zonation patterns of Belizean offshore mangrove forests 41 years after a catastrophic hurricane. Biotropica 38, 365–374. doi: 10.1111/j.1744-7429.2006.00156.x
Platt, W. J. (1999). “Southeastern pine savannas,” in The Savanna, Barren, and Rock Outcrop Communities of North America, eds R. C. Anderson, J. S. Fralish, and J. Baskin (Cambridge: Cambridge University Press), 23–51.
Ross, M. S., Meeder, J. F., Sah, J. P., Ruiz, P. L., and Telesnicki, G. J. (2000). The southeast saline Everglades revisited: 50 years of coastal vegetation change. J. Veg. Sci. 11, 101–112. doi: 10.2307/3236781
Saha, A. K., Moses, C. S., Price, R. M., Engel, V., Smith, T. J., and Anderson, G. (2012). A hydrological budget (2002-2008) for a large subtropical wetland ecosystem indicates marine groundwater discharge accompanies diminished freshwater flow. Estuar. Coasts 35, 459–474. doi: 10.1007/s12237-011-9454-y
Schmitz, M., Platt, W. J., and DeCoster, J. (2002). Substrate heterogeneity and numbers of plant species in Everglades savannas (Florida, USA). Plant Ecol. 160, 137–148. doi: 10.1023/A:1015848300802
Simard, M., Zhang, K. Q., Rivera-Monroy, V. H., Ross, M. S., Ruiz, P. L., Castañeda-Moya, M., et al. (2006). Mapping height and biomass of mangrove forests in Everglades National Park with SRTM elevation data. Photogramm. Eng. Remote Sensing 72, 299–311. doi: 10.14358/PERS.72.3.299
Slocum, M. G., Platt, W. J., and Cooley, H. C. (2003). Effects of differences in prescribed fire regimes on patchiness and intensity of fires in subtropical savannas of Everglades National Park, Florida. Restor. Ecol. 11, 91–102. doi: 10.1046/j.1526-100X.2003.00115.x
Smith, T. J., Anderson, G. H., Balentine, K., Tiling, G., Ward, G. A., and Whelan, K. R. T. (2009). Cumulative impacts of hurricanes on Florida mangrove ecosystems: sediment deposition, storm surges and vegetation. Wetlands 29, 24–34. doi: 10.1672/08-40.1
Smith, T. J., Robblee, M. B., Wanless, H. R., and Doyle, T. W. (1994). Mangroves, hurricanes, and lightning strikes. Bioscience 44, 256–263. doi: 10.2307/1312230
Thaxton, J. M., DeWalt, S. J., and Platt, W. J. (2007). Spatial patterns of regeneration after Hurricane Andrew in two south Florida fringe mangrove forests. Florida Sci. 70, 148–156.
Urrego, L. E., Bernal, G., and Polanía, J. (2009). Comparison of pollen distribution patterns in surface sediments of a Colombian Caribbean mangrove with geomorphology and vegetation. Rev. Palaeobot. Palynol. 156, 358–375. doi: 10.1016/j.revpalbo.2009.04.004
Urrego, L. E., González, C., Urán, G., and Polanía, J. (2010). Modern pollen rain in mangroves from San Andres Island, Colombian Caribbean. Rev. Palaeobot. Palynol. 162, 168–182. doi: 10.1016/j.revpalbo.2010.06.006
van Soelen, E. E., Brooks, G. R., Larson, R. A., Sinninghe Damsté, J. S., and Reichart, G. J. (2012). Mid-to late-Holocene coastal environmental changes in Southwest Florida, USA. Holocene 22, 929–938. doi: 10.1177/0959683611434226
van Soelen, E. E., Lammertsma, E. I., Cremer, H., Donders, T. H., Sangiorgi, F., Brooks, G. R., et al. (2010). Late Holocene sea-level rise in Tampa Bay: integrated reconstruction using biomarkers, pollen, organic-walled dinoflagellate cysts, and diatoms. Estuar. Coast. Shelf Sci. 86, 216–224. doi: 10.1016/j.ecss.2009.11.010
Vegas-Vilarrúbia, T., and Rull, V. (2002). Natural and human disturbance history of the Playa Medina mangrove community (Eastern Venezuela). Caribb. J. Sci. 38, 66–76.
Wanless, H. R., Parkinson, R. W., and Tedesco, L. P. (1994). “Sea level control on stability of everglades wetlands,” in Everglades: The Ecosystem and Its Restoration, eds S. M. Davis and J. C. Ogden (Delray Beach, FL: St. Lucie Press), 199–223.
Westerhoff, P., Chao, P., and Mash, H. (2004). Reactivity of natural organic matter with aqueous chlorine and bromine. Water Res. 38, 1502–1513. doi: 10.1016/j.watres.2003.12.014
Whelan, K. R. T., Smith, T. J. I., Anderson, G. H., and Ouellette, M. L. (2009). Hurricane Wilma's impact on overall soil elevation and zones within the soil profile in a mangrove forest. Wetlands 29, 16–23. doi: 10.1672/08-125.1
Willard, D. A., and Bernhardt, C. E. (2011). Impacts of past climate and sea level change on Everglades wetlands: placing a century of anthropogenic change into a late-Holocene context. Clim. Change 107, 59–80. doi: 10.1007/s10584-011-0078-9
Willard, D. A., and Cronin, T. M. (2007). Paleoecology and ecosystem restoration: case studies from Chesapeake Bay and the Florida Everglades. Front. Ecol. Environ. 5, 491–498. doi: 10.1890/070015
Willard, D. A., Bernhardt, C. E., Holmes, C. W., Landacre, B., and Marot, M. (2006). Response of Everglades tree islands to environmental change. Ecol. Monogr. 76, 565–583. doi: 10.1890/0012-9615(2006)076[0565:ROETIT]2.0.CO;2
Willard, D. A., Cooper, S. R., Gamez, D., and Jensen, J. (2004). Atlas of pollen and spores of the Florida Everglades. Palynology 28, 175–227. doi: 10.2113/28.1.175
Willard, D. A., Weimera, L. M., and Riegel, W. L. (2001). Pollen assemblages as paleoenvironmental proxies in the Florida Everglades. Rev. Palaeobot. Palynol. 113, 213–235. doi: 10.1016/S0034-6667(00)00042-7
Yao, Q., and Liu, K. B. (2017). Dynamics of marsh-mangrove ecotone since the mid-Holocene: a palynological study of mangrove encroachment and sea level rise in the Shark River Estuary, Florida. PLoS ONE 12:e0173670. doi: 10.1371/journal.pone.0173670
Yao, Q., Liu, K. B., Platt, W. J., and Rivera-Monroy, V. H. (2015). Palynological reconstruction of environmental changes in coastal wetlands of the Florida Everglades since the mid-Holocene. Q. Res. 83, 449–458. doi: 10.1016/j.yqres.2015.03.005
Keywords: surface pollen assemblages, coastal environmental gradients, shark river slough, Everglades National Park, x-ray fluorescence (XRF), mangroves
Citation: Yao Q and Liu K (2018) Changes in Modern Pollen Assemblages and Soil Geochemistry along Coastal Environmental Gradients in the Everglades of South Florida. Front. Ecol. Evol. 5:178. doi: 10.3389/fevo.2017.00178
Received: 03 October 2017; Accepted: 28 December 2017;
Published: 25 January 2018.
Edited by:
Jesse L. Morris, University of Utah, United StatesReviewed by:
Fabienne Marret, University of Liverpool, United KingdomMark Bush, Florida Institute of Technology, United States
Copyright © 2018 Yao and Liu. This is an open-access article distributed under the terms of the Creative Commons Attribution License (CC BY). The use, distribution or reproduction in other forums is permitted, provided the original author(s) or licensor are credited and that the original publication in this journal is cited, in accordance with accepted academic practice. No use, distribution or reproduction is permitted which does not comply with these terms.
*Correspondence: Qiang Yao, qyao4@lsu.edu