Wild Bee Pollen Diets Reveal Patterns of Seasonal Foraging Resources for Honey Bees
 Thomas James Wood
 Ian Kaplan2
 - 1Department of Entomology, Michigan State University, East Lansing, MI, United States
- 2Department of Entomology, Purdue University, West Lafayette, IN, United States
Western honey bees (Apis mellifera) are dominant crop pollinators, and access to summer forage is a critical factor influencing colony health in agricultural landscapes. In many temperate agricultural regions, honey bees forage extensively from non-native plants during the summer, but it is unclear whether the use of these species is due to honey bee preference for these plants or is a result of their relative abundance. The foraging choices made by native bees that have evolved with native plants can reveal the seasonal availability of native plant pollens, and so we quantified the pollen collected by 181 wild bee species native to Michigan. Pollen was also trapped from honey bee colonies during the summer to confirm the peak period of non-native pollen collection in this region. Across the state, the generic richness of native pollens collected by wild bees peaked in May before linearly declining into September. Wild social and solitary bees collected a similar proportion of their pollen from non-native plants from April to July, but during August and September social bees collected a significantly greater proportion from non-natives. At a local scale, honey bees collected the majority of their pollen from non-native plants between 4 July and 21 August, with the same trend seen in both social and solitary bees. Across the region, a significantly greater proportion of the solitary bee species that peak during this time are specialists, most of which collect from native plant species that are little utilized by social bees for pollen, such as Dasiphora, Helianthus, Physalis, and Vernonia. Our results suggest that Michigan has relatively few native flowering resources during the height of the summer, and that many of those which flower during this time are used primarily by specialized solitary bee species rather than the social bee community, including honey bees. As a result, non-native plant species with a late summer flowering phenology fill a forage gap and thus can contribute to the diet of both honey bees and generalist wild bees during this time, despite the well-documented negative impacts of these species on native plant communities.
Introduction
Western honey bees (Apis mellifera) are the single most important pollinator of most crop monocultures worldwide (Delaplane and Mayer, 2000). As social insects, honey bees live in colonies and can store food to consume during periods of resource scarcity. Whilst colonies can stockpile large quantities of honey, they tend to store only small quantities of pollen, requiring a constant inflow to achieve optimal brood production (Schmickl and Crailsheim, 2004). Access to fresh pollen from a variety of forage plants and the nutritive quality of collected pollen mediates colony growth, productively, resistance to parasites, pathogens, and other stress factors (Alaux et al., 2010, 2011; Huang, 2012; Vanbergen and the Insect Pollinator Initiative, 2013; Dolezal et al., 2016) as well as overwintering success (Mattila and Otis, 2007; Brosi et al., 2016). Comparative studies have shown the abundance of summer resources is the principle factor determining honey bee colony survival and honey production (Gallant et al., 2014; Requier et al., 2015; Smart et al., 2016; Alaux et al., 2017). Floral resource scarcity for honey bees and also for wild bees has been reported predominantly from the Northern Hemisphere summer months of July and August (Inouye, 1978; Wetherwax, 1986; Couvillion et al., 2014a,b; Scheper et al., 2014), but mostly for nectar, with relatively little known about whether there is a shortage of pollen sources at this time as well.
As part of the beekeeping season in North America, many commercial honey bee colonies are transported in the spring to the Midwestern U.S. following pollination of crops in western and southern regions (Otto et al., 2016). In the Midwest, honey bees have been recorded gathering large quantities of pollen from non-native plant species during the summer period between late June and September (Adams et al., 1978; Olsen et al., 1979; Severson and Parry, 1981; Sponsler and Johnson, 2015; Long and Krupke, 2016; Smart et al., 2016, 2017). The extensive use of non-native pollen during the summer contrasts with honey bee pollen use during the Midwestern spring, where colonies instead forage widely from native trees and shrubs (Adams et al., 1978; Olsen et al., 1979; Severson and Parry, 1981; Girard et al., 2012; Colwell et al., 2017).
In order to maximize honey bee health, a better understanding of the temporal and compositional trends of honey bee foraging habits is needed. It is currently unclear if honey bee pollen collection from non-native plants and mass flowering crops during the summer is due to a preference for these species, or if it is simply a reflection of the abundance and relative availability of these plants in intensively managed agricultural landscapes. The distinction between an inherent preference for or the relative availability of non-native plants is important, since management efforts to improve access to summer forage could focus on the creation and maintenance of semi-natural grasslands containing native plant species (e.g., Otto et al., 2016) or on specific plantings of non-native melliferous species (e.g., Alaux et al., 2017). Since honey bees are capable of flying five miles or more to forage (Beekman and Ratnieks, 2000), attempting to differentiate between an innate preference for vs. the availability of non-native species at a local scale would require extensive quantification, observational trials and potentially experimental habitat manipulation (though see Williams et al., 2011; Morandin and Kremen, 2013). However, it may be possible to infer changes in the seasonal availability of pollen from native flowering plants by quantifying the foraging choices made by the native wild bee community.
In temperate regions, the wild bee community is comprised of both social and solitary species, with the latter dominating species diversity (e.g., Gibbs et al., 2017). The colony cycle of eusocial bumble bees (Bombus spp.) or sweat bees (Halictidae) may last for several months (Michener, 1974), whilst solitary bees have short flight periods closely tied to their preferred host plants (Westrich, 1989; Larkin et al., 2008; Müller and Kuhlmann, 2008; Haider et al., 2014; Wood and Roberts, 2018). Some wild bees, particularly social species, have wider diets and can forage more opportunistically (Waser et al., 1996; Williams et al., 2011). However, most solitary bees display a close association with a narrow range of host plants, and many species collect pollen exclusively from a single plant genus or family (oligolecty). The dietary niche of wild bees can be quantified through the removal of the pollen grains they carry, which can be identified using light microscopy (Müller and Kuhlmann, 2008). Though more commonly used to characterize the diets of individual species, when used on many species, pollen analysis can be used to build a representative picture of the foraging choices of a wild bee clade or entire fauna. As pollen collection preferences are conserved within bee lineages (Larkin et al., 2008; Dellicour et al., 2014), the pollen foraging preferences of extant native species are representative of millions of years of coevolution with native plants. Consequently, the temporal patterns of native pollen collection by wild bees that evolved with the local flora is indicative of the seasonal availability of native flowering plants in a particular region.
In this study, we analyzed pollen removed from pinned wild bee specimens, field collected wild bees and pollen trapped from honey bee colonies to (1) compare seasonal changes in native and non-native pollen use by honey bees and wild bees and (2) to assess differential use of native and non-native pollens by social and solitary wild bee species to better understand pollen collection trends in honey bees. We hypothesized that if the number of native pollen types collected by the wild bee community remains constant throughout the season, then honey bee use of non-native plants in the summer is driven by an innate preference for these species; therefore, we might expect the native bee community to avoid these plants. If honey bee collection of non-native pollens is instead driven by availability, we would expect wild bees to display the same temporal trend of non-native pollen use as honey bees. Within the wild bee community, if social bees show greater utilization of non-native plant pollen than solitary bees, it could suggest that this use is driven by aspects of their biology, such as their sociality and flight period length.
Methodology
Study Location and Sample Collection
This study was conducted in Michigan, U.S.A. A total of 941 pollen loads from 152 wild solitary bee species and 551 pollen loads from 29 wild social bee species were sourced from the personal collections of TJW, the Isaacs Lab collection (Michigan State University), the A.J. Cook arthropod research collection (Michigan State University), the J.B. Wallis–R.E. Roughley Museum of Entomology (University of Manitoba) and the Museum of Zoology collection (University of Michigan). Social status categorization was based on existing literature; full species lists, categorization details, literature references, and sample sizes are included in Appendix A. Pollen was examined from specimens collected between 2006 and 2018. The total of 181 species represents just over half the native wild bee species in Michigan, excluding non-native bee species, and parasitic species that do not collect pollen (Gibbs et al., 2017, total species n = 465, excluding 15 non-native bee species and 113 parasitic species, n = 337, 53.7%). The southern part of Michigan is split by a floral tension zone (roughly corresponding to 44°N) separating broadleaf forest from northern, predominantly coniferous forest (McCann, 1991). To negate possible regional effects on the dataset and minimize wide variations in flowering phenology, wild bee specimens were selected from south of the floral tension zone (Figure 1).
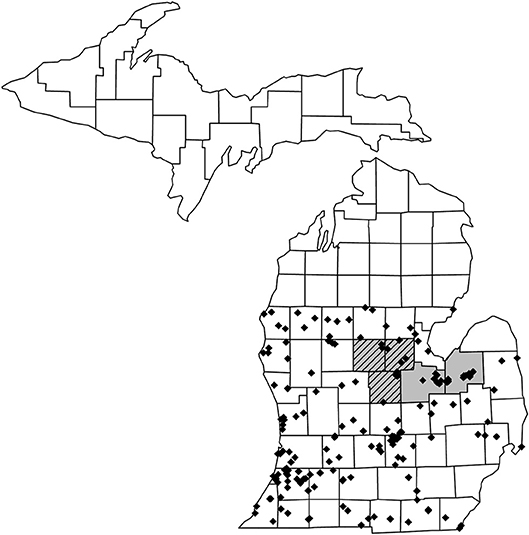
Figure 1. Map of Michigan showing the collection locations for the 1,492 wild bee specimens that were used for pollen load analysis. Specimens were taken from counties south of the floral tension zone to reduce possible regional effects. Honey bee hives for our study were placed out in counties highlighted in gray during 2017 and 2018 and in counties highlighted in hatched gray during 2018 only.
Commercial honey bee colonies adjacent to pickling cucumber fields (Cucumis sativus) were trapped for pollen during the summers of 2017 (16 fields, Saginaw and Tuscola counties) and 2018 (12 fields, Gratiot, Isabella, Midland, Saginaw, and Tuscola counties, Figure 1). These counties are typical of the eastern Michigan agricultural landscape and are major producers of maize, dry beans, soybeans, sugar beets, wheat, and pickling cucumber (US Department of Agriculture, 2016).
In 2017, colonies were placed near cucumber fields in mid-June and were sampled between 24 June and 31 August. At each site, five colonies were fitted with a front mounted pollen trap (Betterbee, Greenwich, New York), which when engaged were operated for a 48 h period. Each site was trapped twice during cucumber bloom. As cucumber fields have a staggered planting date, this resulted in a distribution of trapping dates in June, July, and August. At three of these sites, colonies were additionally trapped four times outside cucumber bloom. This resulted in a total of 212 samples from 78 unique colonies, with two hives generating no sample.
In 2018, colonies were placed near cucumber fields in late-June and were sampled between 2 July and 24 August. At each site, three colonies were fitted with a front mounted pollen trap, again operated for 48 h at a time. All sites were trapped five times, on 2 July, 10 July, 23 July, 6 August, 22 August. This resulted in a total of 145 samples from 36 unique colonies.
In addition to pollen collected by managed honey bees, the field margins of 23 pickling cucumber fields in Gratiot, Isabella, Midland, Saginaw and Tuscola counties were surveyed for wild bees in 2018. At each field, a 15-min survey was conducted in the areas immediately surrounding each field, with all wild bees seen on flowers netted and killed for laboratory identification. Five surveys were conducted between June 6th-8th, June 25th-26th, July 18th-19th, August 13th-15th, and August 28th-31st. All flowering plants at each site were also identified to species to allow for native or non-native characterization.
Pollen Species Identification and Categorization
Pollen loads from wild bee specimens were analyzed using light microscopy (Westrich and Schmidt, 1986; Wood and Roberts, 2018). Specimens were pinned to a piece of foam and rehydrated in a sealed container with boiling water for 2 h to allow for specimen relaxation. Before pollen was removed, the size of pollen loads on individual bees were visually estimated relative to the size of the bee, ranging from a full load to a one-eighth load. Pollen grains were removed from the scopa using an entomological pin and transferred to a drop of water on a microscope slide. Grains were left to absorb water for a few minutes and then the slides were gently heated to allow evaporation. Molten glycerine jelly stained with fuchsin was then added and the slide was sealed with a coverslip. The percentage of the load comprised of different plant species was estimated along three randomly selected lines across the cover slip at 400 × magnification. The percentage of the load by volume was estimated by the relative area of the slide occupied by each plant species, rather than the absolute number of grains (Cane and Sipes, 2006). Species representing <1% of the load were excluded from further analysis as their presence may have arisen from contamination. The percentages of pollen collected were corrected according to the overall size of each load to give a final weighting. Pollen loads were identified to the lowest taxonomic level possible using a reference collection assembled during the project, in most cases to genus (see Appendix B for full list of identified pollens).
Identification of pollen collected from honey bee colonies followed the same general protocol. Pollen from a single colony trapping event was homogenized and a 1 g subsample was selected. This was suspended in water, homogenized, and a 100 μl sample was removed and pipetted onto a slide where it was evaporated, fuchsin jelly was added and the slide was sealed with a coverslip. The number of grains of pollen of each type were counted on a 250 × 250 μm grid at 400 × magnification and averaged over four random locations on the slide. Due to the smaller number of honey bee collected pollens, the diameter of each pollen type was used to calculate the total volume of each pollen type. The overall percentage of each pollen type by volume was then calculated for each sample.
Plant pollens were classified as native or non-native. Because individual plant species can only rarely be reliably distinguished using morphological pollen identification, pollens were classified predominantly by plant genera. In many cases, distinguishing between native and non-native genera is straightforward, for example in the case of Trifolium, but many of the plant species introduced to North America are Eurasian in origin, and are often in the same genus as native species. For example, 13 species of Cirsium and Carduus are found in Michigan, five native species and eight introduced (Voss and Reznicek, 2012, Cirsium-type pollen). Where the majority of species represented by a pollen type were classified as non-native, the pollen type received a non-native classification. Where an equal number of native and non-native species were found in a single genus, preference was given to the more widespread species. For example, Aquilegia canadensis (native) and Aquilegia vulgaris (non-native) are both found in Michigan, but A. canadensis is much more widespread and so this pollen type was considered “native.” Plant pollens were classified according to this method for the wild bee dataset for specimens collected from across the state.
Because floral data were available from the survey locations for the local honey bee and wild bee datasets, pollens collected by these bees were categorized according to the dominant representatives of each genus in that area. For example, the only Cirsium and Carduus species recorded adjacent to cucumber fields were the introduced Cirsium vulgare and Cirsium arvense, so this pollen type was classified as non-native for these datasets. Full classification details for both techniques are reported in Appendix B. There were no differences in classification at the generic level between the two different approaches. Native and non-native classifications and species distributions were taken from the “Field Manual of Michigan Flora” (Voss and Reznicek, 2012).
Data Analysis
In Michigan, the bee foraging year lasts from April to September. For specimens collected across the state, data were separated into individual months. For each month, the average percentage of pollen collected from native and non-native plants per bee species was calculated for the solitary and social bee datasets. The number of native plant genera collected by the whole wild bee community was also calculated. Differences in the average proportion of the pollen diet collected from native plant species between social and solitary bees were tested using two sample Wilcoxon tests as the data could not be transformed to normality.
In each month, the proportion of the wild bee community displaying oligolecty was calculated. Differences between months were assessed using a Chi squared test with a pairwise comparison of proportions post-hoc test with a Holm-Bonferroni correction for multiple comparisons. Differences in the composition of native pollens collected by the wild bee community were visualized using a non-metric multidimensional scaling plot (NMDS). Wild bee species with a minimum of five analyzed pollen loads or which are well-known as pollen specialists (Appendix A) were selected (n = 120). Species were divided into social and solitary species and 95% confidence intervals for each of these groups were calculated. Solitary bee species were considered to have a significantly different pollen diet to social species when they fall outside the 95% confidence intervals for the social bee group. The proportion of the solitary bee community falling outside of this group was calculated in each month as a complimentary measure to the proportion of oligolecty at the community level. For example, in April, 20 solitary bee species were recorded collecting pollen. Three species had a significantly different pollen diet to that of social species, a 15% rate. Differences between months were assessed using a Chi squared test with a pairwise comparison of proportions post-hoc test.
Honey bee colonies were trapped in 37 unique time and location combinations during 2017 and 44 unique combinations during 2018 over an 11-weeks period. Data were combined, and in each week the average percentage of pollen collected from native and non-native plants was calculated, with unique site as the replicate. Differences in the proportion of the pollen diet collected from native and non-native sources were tested using two sample Wilcoxon tests as the data could not be transformed to normality. The contiguous weeks where a significant majority of the pollen came from non-native plants were identified and are collectively referred to as the “dearth” period from here onwards.
To identify native pollen sources collected by wild bees during the dearth period, solitary bee species with a minimum of five analyzed pollen loads in the regional analysis were selected. For each of these solitary species, the Julian day was calculated for each pollen load, and the median was selected to represent the peak of pollen collection for that species. A minimum sample size was chosen to reduce the chance that the flight period of the bee species was unrepresentative. Social bee species (e.g., bumble bees) were not included in this analysis as social bees forage for a period of many months (Michener, 1974), and so the pollens they collect over their whole flight period will be less representative of those collected during the dearth period specifically. Where the median pollen foraging day fell within the dearth period, species were considered to peak at this time. The native pollens collected by these selected species were then summarized. Differences in the proportion of pollen specialists in the community before and during the dearth period were tested using a Kruskal-Wallis test. Dietary classification and references can be found in Appendix A.
Differences in the consumption of native and non-native pollen on a week by week basis by honey bees (replicate at the site level), social bees, and wild bees (replicate at the species level) in agricultural landscapes were tested using two sample Wilcoxon tests as the data could not be transformed to normality.
All statistical analyses and figures were produced in R version 3.3.2 (R Development Core Team, 2016) using the package vegan (Oksanen et al., 2015) for the NMDS analysis.
Results
Wild Bee Pollen Collection Across Michigan
In total, 118 pollen types from 53 botanical families were identified from wild bees collected across southern Michigan between 2006 and 2018 (Appendix B). Of these, 71 were classified as native and 47 were classified as non-native in origin. The number of native pollen types collected by the whole wild bee community peaked in May at 34 types before declining in a linear manner into September with only eight types collected (Figure 2). In contrast, the number of non-native pollen types collected by the wild bee community peaked later in June and July with 28 and 27 types, respectively, before declining into September with four types collected (Figure 2).
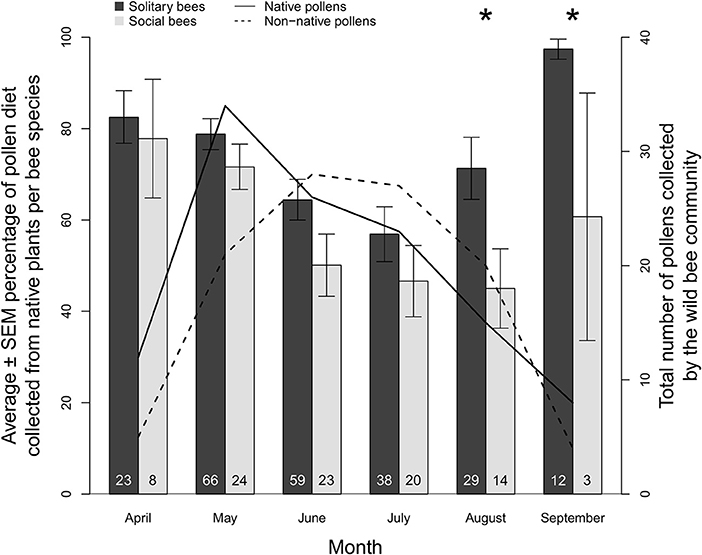
Figure 2. Average ± SEM proportion of pollen collected from native plant genera by wild solitary bee species (n = 152, black bars) and wild social bee species (n = 29, gray bars) from April to September in Michigan (2006–2018). The number of bee species for each month is indicated at the base of each bar. Asterisks indicate a significant difference in average native pollen consumption between wild solitary and social species (p < 0.05). The total number of native plant pollens collected by the whole wild bee community is shown by the solid black line, and the number of non-native pollens is shown by the dashed line.
Overall, wild bees collected most of their pollen from native plant genera, with the average solitary bee collecting 75.2% and average social bee collecting 58.6% of their pollen from this group. There was, however, variation in this trend over time and between the bee groups (Figure 2): the use of native plant pollen was greatest in April (82.5% for solitary species, 77.8% for social species), declining progressively into July (56.9% for solitary species, 46.6% for social species), before rising again in August and September. There were no differences in proportion of pollen collected from native plants between social and solitary species for April (W = 136, p = 0.680), May (W = 646, p = 0.87), June (W = 667, p = 0.078), or July (W = 581, p = 0.457), but by the end of the summer, solitary bees collected a significantly greater proportion of their pollen from native plants compared to social bees in August (71.3, 45.0%, W = 200, p = 0.027) and September (97.4, 60.7%, W = 2, p = 0.008).
The early part of the season is dominated by pollen collection from flowering trees (Acer, Prunus, and Salix) with a shift toward shrubs and smaller woody plants (Cornus, Rhus, Rubus, and Vaccinium) as the spring progresses (Figure 3). From July onwards, herbaceous plants dominate with extensive collection from Monarda, Rudbeckia-type, and Solidago-type. Whilst the April-June period is compositionally similar between solitary and social species, the July-September period diverges, particularly in August and September. Solitary bees collect pollen from a wider variety of Asteraceae (Helianthus, Vernonia) as well as other native plants, such as Dasiphora, Desmodium, and Physalis are used less often by the social bee community. This trend is driven partly by an increase in the incidence of oligolecty, with an average of 25.1% of the solitary bee community displaying oligolecty from April to July, more than doubling to 62.2% in August and 83.3% in September (Table 1a).
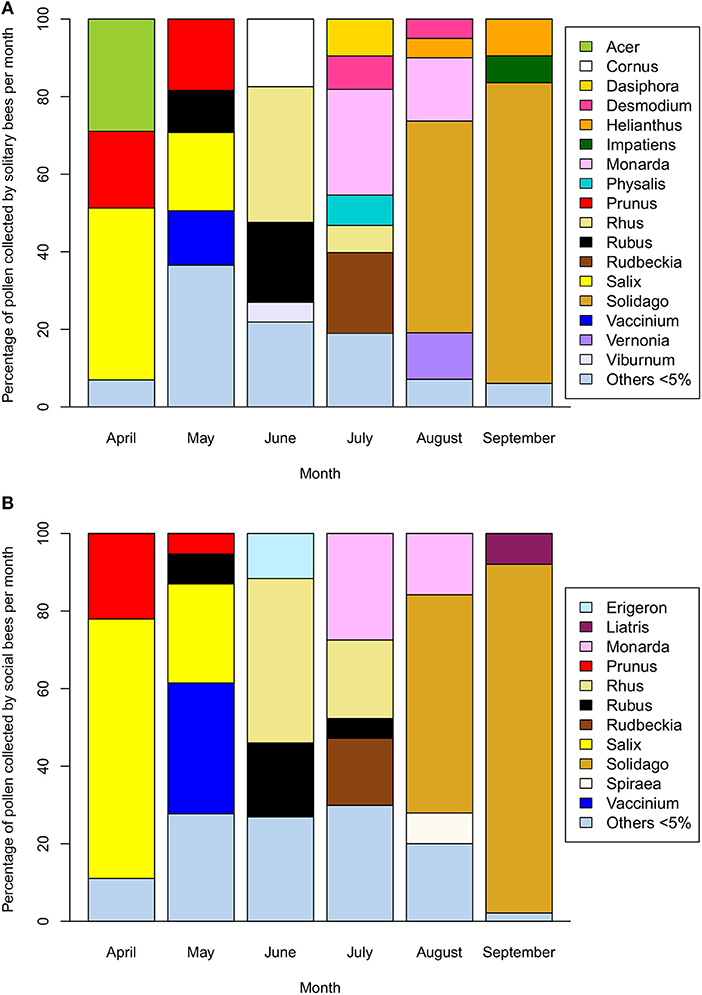
Figure 3. Percentage of pollen collected from native plant genera by (A) wild solitary bee species (n = 152) and (B) wild social bee species (n = 29) in Michigan across the April-September flowering season (2006–2018). Plant species collected at < 5% of the average monthly volume are included as “Others”.
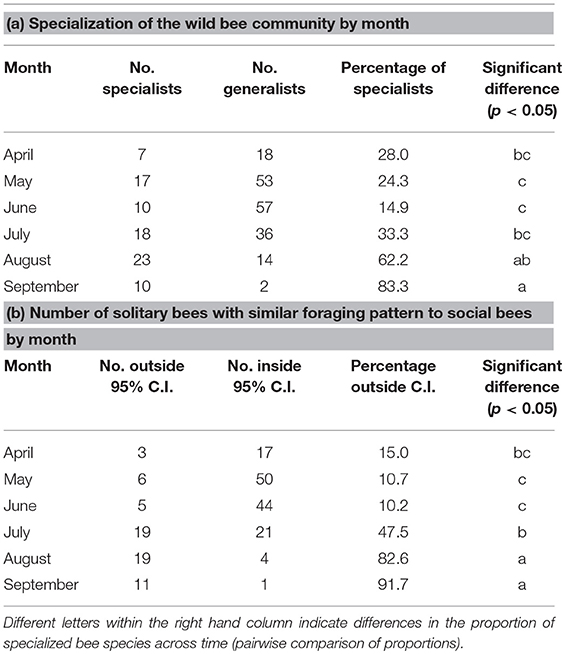
Table 1. The total number and proportion of the solitary bee community pollen foraging in Michigan (2006–2018) by month that are (a) pollen specialists and (b) show a pollen diet that is outside the 95% confidence intervals of social bee pollen diets (see Figure 4).
The trend is also driven by the pollen foraging choices of polylectic solitary bees. When considering wild bee pollen diets, the results can be visualized and diets grouped by social status (Figure 4). Collectively, solitary bees collect from a wider variety of pollen sources than social bees, in part due to the much larger number of species included in this analysis (97 solitary species, 23 social species). When looking at the solitary bee community in each month, the proportion of species showing a significantly different pollen diet to social bees was highest in the summer, with 10.2–15.0% solitary species significantly diverging from social bee diets during April-June, increasing to 47.5% in July, 82.6% in August, and 91.7% in September (Table 1b). The proportion of diverging species are higher than for the proportion of oligoleges in July, August, and September but not in April, May, and June, indicating that the diets of polylectic species must also diverge from social bees during the summer.
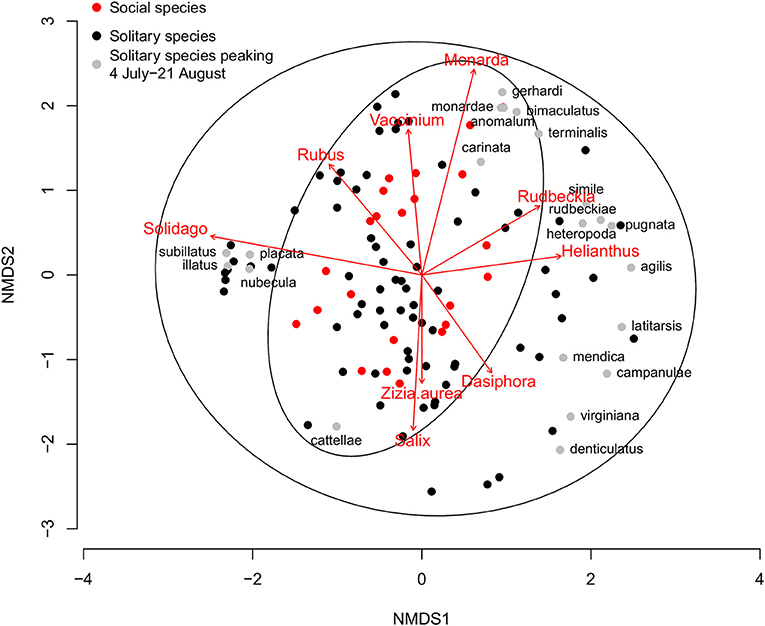
Figure 4. Non-metric multidimensional scaling (NMDS) plot of Michigan native plant pollen diets from wild solitary (n = 97, black and gray dots) and social (n = 23, red dots) bee species that have a minimum of five analyzed pollen loads or are well-known specialists. Solitary species that peak in the dearth period between 4 July and 21 August are marked with gray dots with the species epithet (n = 21, see Table 3). Ellipses represent the 95% confidence intervals for the solitary and social groupings. Arrows represent those plant pollens that are significantly correlated with specialized bee diets. For clarity, only plant groups that are significant at p < 0.01 are plotted, with the length of the arrow corresponding to the strength of the relationship.
Pollen Trapped at Honey Bee Colonies
Honey bee colonies collected a total of 41 pollen types from 22 botanical families (Appendix B). Between 24 June and 31 August 2017, colonies collected a weekly average of 30.2% of their pollen from native plants (Table 2a); 51.7 and 41.4% of this native plant total was collected from Rhus and Solidago-type. Between 4 July and 24 August 2018, colonies collected a weekly average of 13.0% of their pollen from native plants (Table 2b); 49.0, 23.7, and 23.0% of this total was collected from Rhus, Ambrosia artemisiifolia, and Solidago-type, respectively. Between 4 July and 21 August, honey bees collected a majority of their pollen each week from non-native plant species (Figure 5A, Wilcoxon test, 20–26 June, W = 8, p = 0.200, 4–10 July, W = 25, p = 0.003, 11–17 July, W = 1, p < 0.001, weeks of 18 July−14 August, all W = 0, p < 0.001, 15–21 August, W = 1, p < 0.001, 22–28 August, W = 71, p = 0.511, 29 August−4 September, W = 1, p = 1.000). The major non-native plant species used were Z. mays, Cichorium-type, and Trifolium repens. Use of Z. mays pollen was particularly pronounced, peaking at 70.8% of the weekly diet between 25 and 31 July. Very little cucumber pollen was collected, averaging 0.7 and 1.4% of the weekly average in 2017 and 2018. Honey bees are well-known to collect very little pollen from cucumber (Kauffeld and Williams, 1972).
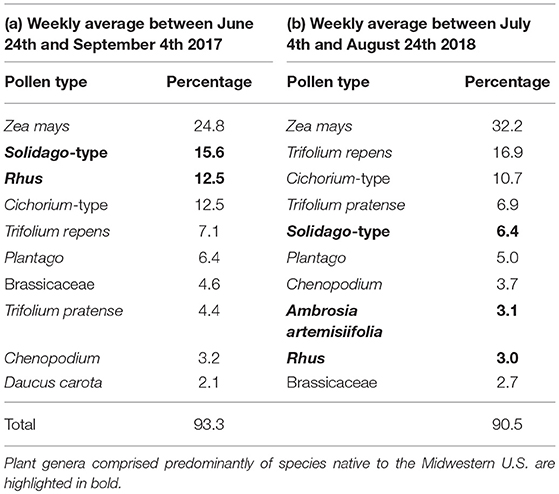
Table 2. Percentage of pollen collected from the top ten most important host plants by honey bee colonies in (a) Saginaw and Tuscola counties, 2017; (b) Gratiot, Isabella, Midland, Saginaw and Tuscola counties, 2018.
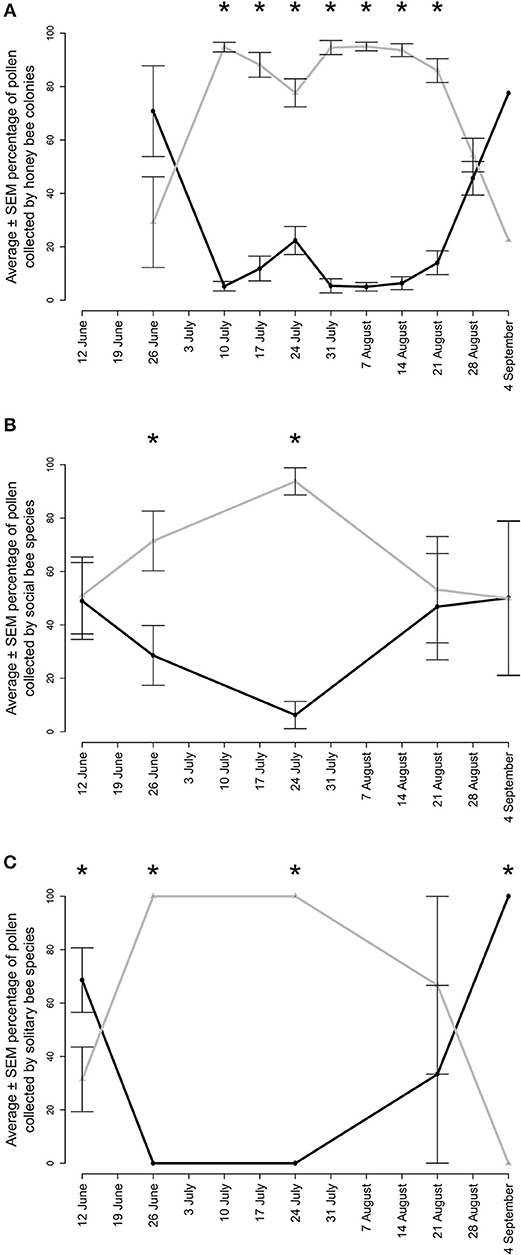
Figure 5. Average ± SEM percentage of pollen collected from non-native (gray lines) and native (black lines) plant genera by (A) honey bee colonies (B) wild social bee species and (C) wild solitary bee species in agricultural landscapes in Gratiot, Isabella, Midland, Saginaw, and Tuscola counties in Michigan. Honey bee hives were placed out in 2017 and 2018 and wild bee specimens were collected in 2018 only. Asterisks indicate significant differences within sampling periods (p < 0.05).
Pollen Collection by Wild Bees During the Dearth Period
Of the 152 characterized solitary bee species, 76 had a minimum of five pollen loads. Twenty-one of these solitary bee species peak during the most pronounced period of honey bee pollen collection from non-native plants, 4 July−21 August (Table 3). Thirteen of these species are oligolectic (61.9%), with individual species specializing on Helianthus, Monarda, Physalis, Rudbeckia-type, Solidago-type, and Vernonia as well as more broadly on Asteraceae. Fifty-one species peak before 4 July, with a significantly lower percentage exhibiting oligolecty (11/51, 21.6%, χ2 = 10.9, p < 0.001). All four species that peak after the dearth period are oligoleges. Of these 21 species, 14 (61.9%) fall outside the 95% confidence intervals of social bee pollen diets (Figure 4), a significantly greater percentage than for those species that peak before the dearth period (6/51, 11.8%, χ2 = 22.3, p < 0.001). All four species that peak after the dearth period also fall outside the social bee diet confidence intervals.
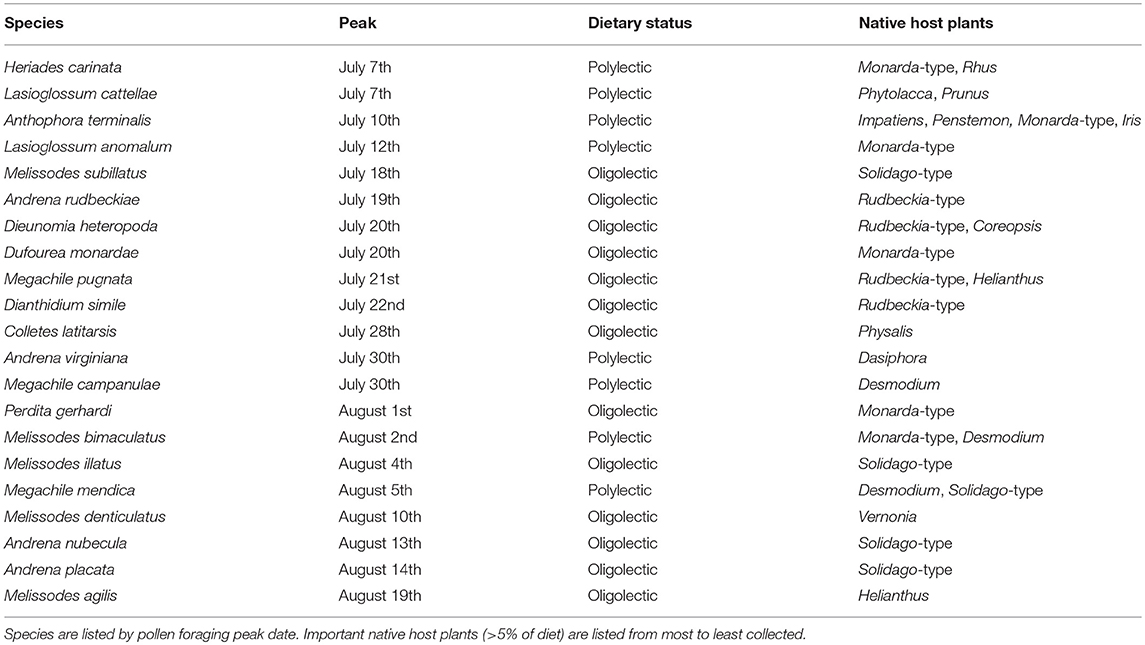
Table 3. Solitary bee species that peak during the period of non-native pollen collection by honey bees (4 July−21 August) and their pollen foraging preferences from native plant species recorded in Michigan (2006–2018).
Pollen Collected by Wild Bees in Agricultural Landscapes
Surveys recorded 94 species of bee (Appendix C). A subset retained pollen loads, with 115 pollen loads from 18 native social species and 63 pollen loads from 28 native solitary species. Both social (Figure 5B, W = 25, p = 0.019, W = 0, p < 0.001) and solitary (Figure 5C, W = 0, p = 0.001, W = 0, p = 0.001) species collected a significantly greater proportion of their pollen diet from non-native plants from 26 June to 24 July. Solitary species collected a significantly greater proportion of their pollen diet from native plants at the beginning (6–12 June, W = 141, p = 0.037) and end of the summer (25 August−4 September, W = 25, p = 0.004). There were no differences at these times for the social bee community.
A total of 115 species of flowering plant were recorded during the wild bee surveys (Appendix D). Native plants that are used often by solitary bee species but not social bee species were almost absent, with only Rudbeckia (3/23 fields) and Physalis (2/23 fields) present, with no records for Dasiphora, Desmodium, Helianthus, or Vernonia.
Discussion
Here we demonstrate for the first time that the pollen foraging choices of wild bee species can help us understand the temporal and compositional trends of honey bee foraging habits. Though compositionally similar in the spring, as native flowering plant pollen diversity decreases into the summer, the pollen diets of the solitary and social bee communities diverge markedly. These results suggest that, over evolutionary time, the solitary bee community has responded to the summer flora through increased specialization, and that there are a narrower range of native resources for both native social bees and introduced honey bees to exploit at this time. Consequently, the extensive use of non-native plants by honey bees during the summer is reflective of the more generalized foraging patterns of social bees, regardless of their own native or non-native status.
The decline in the number of native pollens collected by the wild bee community as the summer progresses suggests that the more pronounced use of non-native plants later in the season is due to their greater availability at this time. The non-native plant community has a later flowering phenology than native plants, peaking in June and with a greater number of species collected by the wild bee community in June, July and August, with no evidence of avoidance seen. Indeed, both social and solitary bees in contemporary agricultural landscapes collected nearly all of their pollen from non-native plants in July. North American agricultural landscapes are extensively disturbed through annual tilling and mowing that favor non-native weeds better adapted to disturbed environments compared to native plants (Larson, 2003; van Kleunen et al., 2009). As a result, non-native pollen sources are often more abundant than native pollen sources in agricultural areas during the summer. Other than Solidago species, native plant species that host specialized solitary bees were almost absent from contemporary agricultural fields. As a result, of the 13 oligolectic species that peak during the dearth period, only five were recorded in surveys, with four specializing on Solidago, and one on Physalis. The absence of native plants from agricultural fields may explain why wild solitary and social bees show a differential consumption of non-native pollens at the regional level but not at the local level, with more generalist species persisting in these areas.
The tripartite Midwestern bee foraging season has long been noted by previous authors, with bees collecting from trees early in the season, followed by shrubs and finally herbaceous plants (Frison, 1923; Fye and Medler, 1954). In the spring and early summer, the proportion of pollen specialists is low, but in absolute terms it is broadly similar to the summer, with comparable numbers recorded in May (n = 17), July (n = 18), and August (n = 23). There are two major groups of spring specialists, bees using Vaccinium (e.g., Andrena carolina, LaBerge, 1980), and Salix (e.g., Andrena erythrogaster, Wood and Roberts, 2018). However, both pollens are extensively used by social bee species, and so even though the solitary bees are specialists, the diets of these spring-flying species are not significantly dissimilar to the overall diets of social bees. There are spring specialists whose diets fall outside that of social bees (e.g., Geranium, Andrena distans, Wood and Roberts, 2018), but they are in the minority, and the overall proportion of specialists is low due to the large numbers of generalist polylectic species flying at this time. Consequently, the extensive pollen collection from native North American trees and shrubs in the spring by honey bees (Adams et al., 1978; Olsen et al., 1979; Severson and Parry, 1981; Girard et al., 2012; Colwell et al., 2017) is seen also in the native social bee community.
In contrast, many of the pollen sources that are collected by solitary bees during the summer have rarely been documented as being collected by honey bees or wild social bees, suggesting an aversion toward these plants. During the dearth period, solitary bees collected predominantly from Monarda, Solidago-type, Rudbeckia-type, and Helianthus. Whilst Solidago-type is collected by social bees, sometimes in great quantities, these other pollen sources do not seem to be attractive. Honey bees generally do not collect pollen from lamiaceous plants (Percival, 1947; Bilisik et al., 2008); Lamiaceae comprised < 1% of the pollen collected by Midwestern colonies (Adams et al., 1978; Severson and Parry, 1981; Long and Krupke, 2016) and only trace quantities of Monarda and introduced Mentha pollen were detected using DNA barcoding in the Northern Great Plains region (Smart et al., 2017). Rudbeckia-type and Helianthus pollens are collected by solitary species during July and August, but exclusively by oligolectic species. In contrast, these two pollens are only collected by social species in small quantities. In the Northern Great Plains region, honey bees collected 1–2% of their pollen from Helianthus, with only trace quantities from Ratibida (Smart et al., 2017), a close relative of Rudbeckia and included in that morphological pollen type. Helianthus pollen is generally considered to be a low quality food source for honey bees (Schmidt et al., 1995). The lack of collection of these two pollen sources by social bees and their predominant use by pollen specialist solitary bees may be due to inherent properties that render their digestion challenging for non-specialized bees, such as social species (Müller and Kuhlmann, 2008; Praz et al., 2008).
Prior to European colonization, Michigan was almost entirely forested, with only an estimated 6% of the state consisting of prairie and savannah (Chapman and Brewer, 2008). Despite potential pesticide exposure in agricultural landscapes (Goulson et al., 2015; Long and Krupke, 2016), some studies suggest that North American honey bee colonies perform better over the summer in agricultural areas compared to areas with a greater dominance of woodland, mature grassland and urban development, as these areas are relatively flower-poor in comparison (Sponsler and Johnson, 2015; Alburaki et al., 2017). The conversion of woodland into agricultural land with associated non-native weed communities and mass flowering crops is likely to have increased the abundance of honey bee suitable summer forage, as Midwestern woodland provides essentially no native resources after the cessation of Rhus bloom in mid-July. The dearth period seen in Michigan is very similar to that seen in other previously extensively wooded Midwestern regions, with honey bees collecting a majority of their pollen from non-native plants between 17 June and 13 August in Wisconsin (Severson and Parry, 1981), 22 June–August 23 in Indiana (Long and Krupke, 2016) and 12 July−22 August in Ontario (Adams et al., 1978), with a later start date as the study area moves eastwards. Though introduced, non-native plant species are sometimes more effective at providing beneficial ecosystem services than native plants, in this case providing foraging resources for honey bees, due to their ability to persist in areas with high disturbance (Schlaepfer et al., 2009). Because of their flowering phenology, the seasonal availability of native pollens would suggest that non-native plants are more effective than native plants at providing foraging resources palatable to generalist social bees during the late July to late August period of the Midwestern summer.
The use of native plant species in habitat restoration and manipulation has been advocated as a way to maximize the ecosystem services provided by insects and to provide appropriate resources to wild bee species (Isaacs et al., 2009), and conservation efforts that promote native plants support a greater number of wild bee species (Decourtye et al., 2010). Beekeepers are among the strongest advocates for restoration of flowering plant communities, but are typically indifferent to plant origin, leading to potential conflicts between initiatives aimed at honey bee health vs. ecosystem restoration (Geldman and González-Varo, 2017). In Michigan, for example, star thistle (Centaurea stoebe) honey is highly valued by beekeepers, despite the fact that invasive Centaurea species are considered ecologically destructive (DiTomaso, 2000), contributing toward the almost $120 billion in losses caused by invasive species in the U.S. (Pimentel et al., 2005).
Conclusions
The foraging choices made by wild bee species indicate that, despite extensive dietary overlap in the spring, the pollen diets of social and solitary bee species diverge as the number of native pollens available declines throughout the summer. The similar response between native social bees and honey bees indicates that this is a regional phenomenon tied to the ecology of social and solitary bee species, with the latter better adapted to utilizing the native plants that flower in the summer. Within this context, and given the importance of agricultural lands for honey bee stocks in the U.S. (Otto et al., 2016), non-native plant communities can play an important role in filling a gap in the summer flowering patterns of native forage sources for social bees in the Midwest. Land managers may need to decide whether to prioritize native species restoration or enhancement of honey bee forage in cases where these two endeavors are at odds with one another.
Data Availability Statement
The data used in this analysis are available to interested researchers from the corresponding author upon request.
Author Contributions
All authors conceived and designed the research. TW conducted the research. All authors wrote the paper and contributed to editing and discussion.
Funding
This project was funded by USDA NIFA grant SCRI 2016-51181-25410. TW was also funded by USDA NIFA 2012-51181-20105 and 2017-68004-26323.
Conflict of Interest Statement
The authors declare that the research was conducted in the absence of any commercial or financial relationships that could be construed as a potential conflict of interest.
Acknowledgments
We would like to thank Rufus Isaacs for access to specimens, and Christian Krupke for access to Indiana pollen data. We would also like to thank the growers and beekeepers who allowed us access to their land and hives. Finally, we are extremely grateful to the editor and three reviewers whose comments substantially improved the manuscript.
Supplementary Material
The Supplementary Material for this article can be found online at: https://www.frontiersin.org/articles/10.3389/fevo.2018.00210/full#supplementary-material
References
Adams, R. J., Manville, G. C., and McAndrews, J. H. (1978). Comparison of pollen collected with a honey bee colony with a modern wind-dispersed pollen assemblage. Can. Field Nat. 92, 359–368.
Alaux, C., Allier, F., Decourtye, A., Odoux, J.-F., Tamic, T., Chabirand, M., et al. (2017). A ‘landscape physiology’ approach for assessing bee health highlights the benefit of floral landscape enrichment and semi- natural habitats. Sci. Rep. 7:40568. doi: 10.1038/srep40568
Alaux, C., Dantec, C., Parrinello, H., and Le Conte, Y. (2011). Nutrigenomics in honey bees: digital gene expression analysis of pollen's nutritive effects on healthy and Varroa- parasitized bees. BMC Genomics 12:496. doi: 10.1186/1471-2164-12-496
Alaux, C., Ducloz, F., Crauser, D., and Le Conte, Y. (2010). Diet effects on honeybee immunocompetence. Biol. Lett. 6, 562–565. doi: 10.1098/rsbl.2009.0986
Alburaki, M., Steckel, S. J., Williams, M. T., Skinner, J. A., Tarpy, D. R., Meikle, W. G., et al. (2017). Agricultural landscape and pesticide effects on honey bee (Hymenoptera: Apidae) biological traits. J. Econ. Entomol. 110, 835–847. doi: 10.1093/jee/tox111
Beekman, M., and Ratnieks, F. L. W. (2000). Long range foraging by the honey bee, Apis mellifera L. Funct. Ecol. 14, 490–496. doi: 10.1046/j.1365-2435.2000.00443.x
Bilisik, A., Cakmak, I., Bicakci, A., and Malyer, H. (2008). Seasonal variation of collected pollen loads of honeybees (Apis mellifera L. anatoliaca). Grana 47, 70–77. doi: 10.1080/00173130801923976
Brosi, B. J., Delaplane, K. S., Boots, M., and de Roode, J. C. (2016). Ecological and evolutionary approaches to managing honey bee disease. Nat. Ecol. Evolut. 1, 1250–1262. doi: 10.1038/s41559-017-0246-z
Cane, J. H., and Sipes, S. (2006). “Characterizing floral specialization by bees: analytical methods and a revised lexicon for oligolecty,” in: Plant-Pollinator Interactions From Specialization to Generalization, eds N. M. Waser, and J. Ollerton (Chicago, IL: University of Chicago Press), 99–122.
Chapman, K. A., and Brewer, R. (2008). Praire and savanna in southern lower Michigan: history, classification, ecology. Michigan Bot. 47, 1–48.
Colwell, M. J., Williams, G. R., Evans, R. C., and Schutler, D. (2017). Honey bee-collected pollen in agro-ecosystems reveals diet diversity, diet quality, and pesticide exposure. Ecol. Evol. 7, 7243–7253. doi: 10.1002/ece3.3178
Couvillion, M. J., Fensome, K. A., Quah, S. K. L., and Schürch, R. (2014b). Summertime blues: august foraging leaves honey bees empty-handed. Commun. Integr. Biol. 7:e28821. doi: 10.4161/cib.28821
Couvillion, M. J., Schürch, R., and Ratnieks, F. W. L. (2014a). Waggle dance distances as integrative indicators of seasonal foraging challenges. PLoS ONE 9:e93495. doi: 10.1371/journal.pone.0093495
Decourtye, A., Mader, E., and Desneux, N. (2010). Landscape enhancement of floral resources for honey bees in agro-ecosystems. Apidologie 41, 264–277. doi: 10.1051/apido/2010024
Dellicour, S., Lecocq, T., Kuhlmann, M., Mardulyn, P., and Michez, D. (2014). Molecular phylogeny, biogeography, and host plant shifts in the bee genus Melitta (Hymenoptera: Anthophila). Mol. Phylogenet. Evol. 70, 412–419. doi: 10.1016/j.ympev.2013.08.013
DiTomaso, J. M. (2000). Invasive weeds in rangelands: species, impacts, and management. Weed Sci. 48, 255–265. doi: 10.1614/0043-1745(2000)048[0255:IWIRSI]2.0.CO;2
Dolezal, A. G., Carrilo-Tripp, J., Miller, W. A., Bonning, B. C., and Toth, A. L. (2016). Intensively cultivated landscape and Varroa mite infestation are associated with reduced honey bee nutritional state. PLoS ONE 11:e0153531. doi: 10.1371/journal.pone.0153531
Frison, T. H. (1923). Biological Studies of the Bremidae, or Bumblebees, With Special Reference to the Species Occurring in Illinois. Unpublished thesis, University of Illinois.
Fye, R. E., and Medler, J. T. (1954). Spring emergence and floral hosts of Wisconsin bumblebees. Wisconsin Acad.Scie. Arts Lett. 43, 75–82.
Gallant, A. L., Euliss, N. H., and Browning, Z. (2014). Mapping large-area landscape suitability for honey bees to assess the influence of land-use change on sustainability of national pollination services. PLoS ONE 9:e99268. doi: 10.1371/journal.pone.0099268
Geldman, J., and González-Varo, J. P. (2017). Conserving honey bees does not help wildlife. Science 359, 392–393. doi: 10.1126/science.aar2269
Gibbs, J., Ascher, J. A., Rightmyer, M. G., and Isaacs, R. (2017). The bees of Michigan (Hymenoptera: Apoidea: Anthophila), with notes on distribution, taxonomy, pollination, and natural history. Zootaxa 4352, 1–160. doi: 10.11646/zootaxa.4352.1.1
Girard, M., Chagnon, M., and Fournier, V. (2012). Pollen diversity collected by honey bees in the vicinity of Vaccinium spp. crops and its importance for colony development. Botany 90, 545–555. doi: 10.1139/b2012-049
Goulson, D., Nicholls, E., Botías, C., and Rotheray, E. L. (2015). Bee declines driven by combined stress from parasites, pesticides and lack of flowers. Science 347:1255957. doi: 10.1126/science.1255957
Haider, M., Dorn, S., Sedivy, C., and Müller, A. (2014). Phylogeny and floral hosts of a predominantly pollen generalist group of mason bees (Megachilidae: Osmiini). Biol. J. Linn. Soc. 111, 78–91. doi: 10.1111/bij.12186
Huang, Z. (2012). Pollen nutrition affects honey bee stress resistance. Terr. Arthropod Rev. 5, 175–189. doi: 10.1163/187498312X639568
Inouye, D. W. (1978). Resource partitioning in bumble bees: experimental studies of foraging behaviour. Ecology 59, 672–678. doi: 10.2307/1938769
Isaacs, R., Tuell, J., Fielder, A., Gardiner, M., and Landis, D. (2009). Maximising arthropod- mediated ecosystem services in agricultural landscapes: the role of native plants. Front. Ecol. Environ. 7, 196–203. doi: 10.1890/080035
Kauffeld, N. M., and Williams, P. H. (1972). Honey bees as pollinators of pickling cucumbers in Wisconsin. Am. Bee J. 112, 252–254.
LaBerge, W. E. (1980). A revision of the bees of the genus Andrena of the western hemisphere. Part X. Subgenus Andrena. Trans. Am. Entomol. Soc. 106, 395–525.
Larkin, L. L., Neff, J. L., and Simpson, B. B. (2008). The evolution of a pollen diet: host choice and diet breadth of Andrena bees (Hymenoptera: Andrenidae). Apidologie 39, 133–145. doi: 10.1051/apido:2007064
Larson, D. L. (2003). Native weeds and exotic plants: relationship to disturbance in mixed- grass prairie. Plant Ecol. 169, 317–333. doi: 10.1023/A:1026046810307
Long, E. Y., and Krupke, C. H. (2016). Non-cultivated plants present a season-long route of pesticide exposure for honey bees. Nat. Commun. 7:11629. doi: 10.1038/ncomms11629
Mattila, H. R., and Otis, G. W. (2007). Dwindling pollen resources trigger the transition to broodless populations of long-lived honeybees each autumn. Ecol. Entomol. 32, 496–505. doi: 10.1111/j.1365-2311.2007.00904.x
McCann, M. T. (1991). “Land, climate, and vegetation of Michigan”, in The Atlas of Breeding Birds of Michigan, eds R. Brewer, G. A. McPeek, J. Raymond, and J. Adams (East Lansing: Michigan State University Press), 15–31.
Morandin, L. A., and Kremen, C. (2013). Bee preference for native versus exotic plants in restored agricultural hedgerows. Restor. Ecol. 21, 26–32. doi: 10.1111/j.1526-100X.2012.00876.x
Müller, A., and Kuhlmann, M. (2008). Pollen hosts of western palaearctic bees of the genus Colletes (Hymenoptera: Colletidae): the Asteraceae paradox. Biol. J. Linn. Soc. 95, 719–733. doi: 10.1111/j.1095-8312.2008.01113.x
Oksanen, J., Blanchet, F. G., Kindt, R., Legendre, P., Minchin, P. R., O'Hara, R. B., et al. (2015). Vegan: Community Ecology Package. R package version 2.3–2. Available online at: http://CRAN.R-project.org/package=vegan
Olsen, L. G., Hoopingarner, R., and Martin, E. C. (1979). Pollen preferences of honeybees sited on four cultivated crops. J. Apic. Res. 18, 196–200. doi: 10.1080/00218839.1979.11099967
Otto, C. R. V., Roth, C. L., Carlson, B., and Smart, M. (2016). Land-use change reduces habitat suitability for supporting managed honey bee colonies in the Northern great plains. Proc. Natl. Acad. Sci. U.S.A. 113, 10430–10435. doi: 10.1073/pnas.1603481113
Percival, M. S. (1947). Pollen collection by Apis mellifera. New Phytol. 46, 142–173. doi: 10.1111/j.1469-8137.1947.tb05076.x
Pimentel, D., Zuniga, R., and Morrison, D. (2005). Update on the environmental and economic costs associated with alien-invasive species in the United States. Ecol. Econ. 52, 273–288. doi: 10.1016/j.ecolecon.2004.10.002
Praz, C., Müller, A., and Dorn, S. (2008). Specialized bees fail to develop on non-host pollen: do plants chemically protect their pollen? Ecology 89, 795–804. doi: 10.1890/07-0751.1
R Development Core Team (2016). R: A language and environment for statistical computing. Vienna: R Foundation for Statistical Computing. Available online at: http://www.R-project.org
Requier, F., Odoux, J.-F., Tamic, T., Moreau, N., Henry, M., Decourtye, A., et al. (2015). Honey bee diet in intensive farmland habitats reveals an unexpectedly high flower richness and a major role of weeds. Ecol. Appl. 25, 881–890. doi: 10.1890/14-1011.1
Scheper, J., Reemer, M., van Kats, R., Ozinga, W. A., van der Linden, G. T., Schaminée, J. H., et al. (2014). Museum specimens reveal loss of pollen host plants as key factor driving wild bee decline in The Netherlands. PNAS 111, 17552–17557. doi: 10.1073/pnas.1412973111
Schlaepfer, M. A., Sax, D. F., and Oldenm, J. D. (2009). The potential conservation value of non- native species. Conserv. Biol. 25, 428–437. doi: 10.1111/j.1523-1739.2010.01646.x
Schmickl, T., and Crailsheim, K. (2004). Inner nest homeostasis in a changing environment with special emphasis on honey bee brood nursing and pollen supply. Apidologie 35, 249–263. doi: 10.1051/apido:2004019
Schmidt, L. S., Schmidt, J. O., Rao, H., Wang, W. Y., and Xu, L. G. (1995). Feeding preference and survival young worker honey bees fed rape, sesame, sunflower pollen. J. Econ. Entomol. 88, 1591–1595. doi: 10.1093/jee/88.6.1591
Severson, D. W., and Parry, J. E. (1981). A chronology of pollen collection by honeybees. J. Apic. Res. 20, 97–103. doi: 10.1080/00218839.1981.11100480
Smart, M. D., Cornman, R. S., Iwanowicz, D. D., McDermott-Kubeczko, M., Pettis, J. S., Spivak, M. S., et al. (2017). A comparison of honey bee-collected pollen from working agricultural lands using light microscopy and ITS barcoding. Environ. Entomol. 46, 38–49. doi: 10.1093/ee/nvw159
Smart, M. D., Pettis, J. S., Euliss, N., and Spivak, M. S. (2016). Land use in the Northern great plains region of the U.S. influences the survival and productivity of honey bee colonies. Agric. Ecosyst. Environ. 230, 139–149. doi: 10.1016/j.agee.2016.05.030
Sponsler, D. B., and Johnson, R. M. (2015). Honey bee success predicted by landscape composition in Ohio, USA. PeerJ 3:e838.
US Department of Agriculture (2016). Michigan Agricultural Statistics 2015-2016. Available online at https://www.nass.usda.gov/Statistics_by_State/Michigan/Publications/Annual_ Statistical_Bulletin/stats16/agstat16.pdf (Accessed 2 April, 2018).
van Kleunen, M., Weber, E., and Fischer, M. (2009). A meta-analysis of trait differences between invasive and non-invasive plant species. Ecol. Lett. 13, 235–245. doi: 10.1111/j.1461-0248.2009.01418.x
Vanbergen, A. J. (2013). Threats to an ecosystem service: pressures on pollinators. Front. Ecol. Environ. 11, 251–259. doi: 10.1890/120126
Voss, E. G., and Reznicek, A. A. (2012). Field Manual of Michigan Flora. Ann Arbor, MI: University of Michigan Press.
Waser, N. M., Chittka, L., Price, M. V., Williams, N. M., and Ollerton, J. (1996). Generalization in pollination systems and why it matters. Ecology 77, 1043–1060. doi: 10.2307/2265575
Westrich, P., and Schmidt, K. (1986). Methoden und anwendungsgebiete der pollenanalyse bei wildbienen (Hymenoptera, Apoidea). Linzer Biol. Beiträge 18, 341–360.
Williams, N. M., Cariveau, D., Winfree, R., and Kremen, C. (2011). Bees in disturbed habitats use, but do not prefer, alien plants. Basic Appl. Ecol. 12, 332–341. doi: 10.1016/j.baae.2010.11.008
Keywords: Apis mellifera, pollen identification, agriculture, weeds, solitary bees, seasonality, non-native plants
Citation: Wood TJ, Kaplan I and Szendrei Z (2018) Wild Bee Pollen Diets Reveal Patterns of Seasonal Foraging Resources for Honey Bees. Front. Ecol. Evol. 6:210. doi: 10.3389/fevo.2018.00210
Received: 14 May 2018; Accepted: 27 November 2018;
Published: 10 December 2018.
Edited by:
Klaus Birkhofer, Brandenburg University of Technology Cottbus-Senftenberg, GermanyReviewed by:
Mark Anthony Hall, Western Sydney University, AustraliaLynn V. Dicks, University of East Anglia, United Kingdom
Adam J. Vanbergen, INRA UMR1347 Agroécologie, France
Copyright © 2018 Wood, Kaplan and Szendrei. This is an open-access article distributed under the terms of the Creative Commons Attribution License (CC BY). The use, distribution or reproduction in other forums is permitted, provided the original author(s) and the copyright owner(s) are credited and that the original publication in this journal is cited, in accordance with accepted academic practice. No use, distribution or reproduction is permitted which does not comply with these terms.
*Correspondence: Thomas James Wood, woodtho4@msu.edu