Site-Based Conservation of Terrestrial Bird Species in the Caribbean and Central and South America Under Climate Change
 Alke Voskamp
 Stuart H. M. Butchart
 David J. Baker
 Chad B. Wilsey6†
  Stephen G. Willis
- 1Senckenberg Biodiversity and Climate Research Centre, Frankfurt, Germany
- 2Conservation Ecology Group, Department of Biosciences, Durham University, Durham, United Kingdom
- 3BirdLife International, Cambridge, United Kingdom
- 4Department of Zoology, University of Cambridge, Cambridge, United Kingdom
- 5Environment and Sustainability Institute, University of Exeter, Penryn, United Kingdom
- 6National Audubon Society, San Francisco, CA, United States
Two of the principal responses of species to recent climate change have been changes in range and abundance, leading to a global reshuffling of the geographic distribution of species. Such range changes may cause species to disappear from areas they currently occupy and, given the right conditions, to colonize new sites. This could affect the ability of site networks (such as protected areas) to conserve species. Identifying sites that will continue to provide suitable conditions for focal species under future climate change scenarios and sites that are likely to become unsuitable is important for effective conservation planning. Here we explore the impacts of climate change on terrestrial bird species of conservation concern in the Neotropics, and the consequences for the network of Important Bird and Biodiversity Areas (IBAs) identified to conserve them. We modelled changes in species distributions for 3,798 species across the Caribbean and Central and South America, accounting for species-specific biological traits (natal dispersal ability and generation length), to assess species occurrences within IBAs under different future climate scenarios. Based on the projected changes in species compositions, we identified potential management strategies for the individual sites of the network. We projected that future climate change will have substantial impacts on the distribution of individual species across the IBA network, resulting in very heterogenous impacts on the individual IBAs. Mean turnover of species of conservation concern within IBAs was 17% by 2050. Nonetheless, under a medium-warming scenario, for 73% of the 939 species of conservation concern, more than half of the IBAs in which they currently occur were projected to remain climatically suitable, and for 90% at least a quarter of the sites remain suitable. These results suggest that the IBA network will remain robust under climate change. Nevertheless, 7% of the species of conservation concern are projected to have no suitable climate in the IBAs currently identified for them. Our results highlight the importance of a network-wide perspective when taking management decisions for individual sites under climate change.
Introduction
Designating protected areas to safeguard biodiversity is a cornerstone of species conservation (Hambler, 2004). Globally, the number of protected areas has grown substantially over recent decades, yet the protected area network remains far from complete, both in terms of protecting species of concern and sites of importance for their conservation (Rodrigues et al., 2004; Butchart et al., 2015; Maxwell et al., 2020). Furthermore, the effectiveness of protected areas in the longer term may be compromised by climate change, which is projected to impact protected area networks in various ways. For example, climate driven shifts in species’ distributions may alter the proportion of a species’ range covered by protected areas (Worboys et al., 2006; Hannah, 2008). Shifts in species distributions under climate change have been widely documented (Chen et al., 2011; Gillings et al., 2015; Pecl et al., 2017; Lenoir et al., 2020) and several efforts have been made to predict the consequences of these changes for the efficacy of protected area networks (Araújo et al., 2004, 2011; Coetzee et al., 2009; Hole et al., 2009; Wu et al., 2018; Wilsey et al., 2019).
Terrestrial protected areas have fixed boundaries informed by the current/recent (or sometimes historical) distribution of biodiversity (Worboys et al., 2006; but see Venter et al., 2018). The static nature of protected area networks means that they are likely to become less effective in safeguarding the species they were established to protect if these alter their ranges under climate change (Araújo et al., 2004; Avalos and Hernández, 2015). Additionally, the climate of individual sites might become less suitable for certain species over time (Dockerty et al., 2003; Warren et al., 2018). Changes in the occurrence of species affect the composition of species assemblages and could result in the creation of novel assemblages within protected areas (Hannah et al., 2007; Hole et al., 2009; Bagchi et al., 2013). Some protected areas are, however, likely to increase in their importance, becoming focal points for colonisation of species outside their current range and facilitating species’ range shifts or expansions (Thomas et al., 2012; Hiley et al., 2013; Gillingham et al., 2015).
Species distribution models (SDMs) have frequently been used to project the potential impacts of climate change on the performance of protected area networks (Bagchi et al., 2013; Baker et al., 2015). SDMs can be used to predict the current and future ranges of species based on the modelled relationship between the species’ current range and climatic conditions; the potential gains and losses of species in protected areas can then be estimated from these predictions (Araújo et al., 2004; Hannah, 2008; Hole et al., 2009). Such studies have come to differing conclusions with regards to the potentially changing value of protected area networks depending upon the study area and extent (Araújo et al., 2004, 2011; Kharouba and Kerr, 2010; Thomas et al., 2012). The conclusions drawn from these studies may vary depending on the specific taxa and network being investigated, but are also affected by the degree to which differences in species traits are accounted for in the model predictions (Holloway et al., 2016). A network of European protected areas was predicted to become less effective over time and to be no better at protecting priority species in future than a network of protected areas placed at random (Araújo et al., 2011). By contrast, protected areas in the United Kingdom and Canada have been projected to retain much of the value they currently provide into the future, or even increase in their importance for species conservation due to colonising species (Araújo et al., 2011; Thomas et al., 2012; Gillingham et al., 2015).
Important Bird and Biodiversity Areas [IBAs; Key Biodiversity Areas identified for birds (Donald et al., 2019)] are sites identified as being internationally important for the conservation of bird populations on the basis of a globally standardised set of data-driven criteria. Over 13,000 sites have been identified in more than 200 countries over the last four decades (BirdLife International, 2020b). The IBA criteria capture multiple dimensions of a site’s significance for avian biodiversity and relate to populations of globally threatened, restricted-range, biome-restricted, or congregatory species. IBAs cover approximately 6.7% of the terrestrial, 1.6% of the marine and 3.1% of the total surface area of the Earth (Donald et al., 2019). On average, 46% of the area of each IBA is covered by protected areas, but 36% of IBAs lack any protected area coverage (BirdLife International, 2020a).
Estimating the impact of climate change on species’ distributions, and the consequences for networks of sites identified to conserve them, can help to inform conservation strategies to ensure that these site networks remain effective under climate change. Here, we investigate the impacts of climate change on the IBA network across the Caribbean, and Central and South America (a region in which such impacts on IBAs have not been previously assessed) and quantify projected changes in the climatic suitability of each IBA for the species for which the network was identified. We use SDMs, accounting for species-specific biological traits, to project future changes in the potential occurrence of species across the individual sites. We then consider the management strategies required for each site in the light of these projected impacts, building on the approach of Hole et al. (2011) who defined five broad climate change adaptation strategies (CCAS) reflecting the degree of projected immigration and emigration of species. We assessed changes in climatic suitability of IBAs for 3,798 terrestrial bird species that occur across the region, including 939 species of conservation concern for which IBAs have been identified. Modelling the larger set of species allowed us to compare the impacts of climate change on the species of conservation concern with those of the regional avifauna more generally. We explored spatial patterns in changes to the set of species for which each IBA is climatically suitable. We then assigned CCASs, and tested whether location or IBA size was more important in determining changes in climatic suitability for the species for which each site was identified.
Materials and Methods
Species Data
We used polygon data on species distributions from BirdLife International and NatureServe, which represent the best understanding of the current range boundaries of species (BirdLife International and NatureServe, 2014). We sourced breeding ranges for all 3,926 species that occur in Central and South America and the Caribbean (of which we included modelling results for 3,798 species in our analyses: see below for details), including 968 species of conservation concern (of which we included modelling results for 939 species in our analyses: see below for details). These range polygons are widely used in global modelling of climate change and conservation impacts (Bagchi et al., 2013; Betts et al., 2017; Hof et al., 2018).
Initially, we gridded all species range map data to 0.5° (c. 55 × 55 km) resolution, and assumed occurrence in a cell if the range polygon overlapped with the cell by at least 10%. For 913 narrow-ranged species, defined as those occurring in fewer than 50 cells using the above method, we intersected the range polygons with a 0.25° (c. 25 × 25 km) grid and modelled their distribution at this finer resolution (adjusting the resolution of the climate data accordingly as described below). This helps to alleviate problems in model building and cross-validation (using the independent blocking approach we describe below) associated with small samples. In addition, for narrow-ranged species, it permits the use of higher resolution climatic explanatory variables, which captures finer scale variations in climatic condition (something that is less important for wide-ranging species). For the analysis presented in the main study we focused on the 968 species (of which 939 had adequate models) for which the IBAs were identified (i.e., those threatened, restricted-range, biome-restricted or congregatory species triggering the IBA criteria) (Results for all species occurring in the region are shown in Supplementary Figures S2–S7). The spatial extent of our analysis comprises the study region of the Caribbean and Central and South America as well as North America. The latter was included as the northern range margins of some Central and South American species extend into North America.
Climate Data
We used four bioclimatic variables from Worldclim v1.4 (available online at http://www.worldclim.org/) for the baseline time period 1960–1990 as explanatory variables of species distributions (Hijmans et al., 2005). These were: Temperature seasonality, Maximum temperature of the warmest period, Annual precipitation total, and Precipitation seasonality. These variables were selected following preliminary analyses, in which we tested all possible combinations of three and four variables (Supplementary Table 1), from a candidate pool of 500 species. Within combinations, we did not permit inclusion of variables with a Pearson’s correlation coefficient > 0.7, retaining only one such correlated variable (see Hof et al., 2018). This prior variable selection process was based on the ability of variable combinations to characterise ranges for a representative subset of the world’s bird species, and based on previous experience of modelling tropical and sub-tropical bird species (Hole et al., 2009; Bagchi et al., 2013; Baker et al., 2015). We restricted the number of variables to be included in the SDMs to a maximum of four, since these models become increasingly vulnerable to overfitting when more variables are included (Randin et al., 2006). Bioclimatic data are available from WorldClim v1.4 at a spatial resolution of 10 min. We aggregated these data to a spatial resolution of 0.5° to match the resolution of the gridded range polygons. To match the climate data with the gridded data for restricted range species, we aggregated a second set of the climate data to 0.25°.
We selected the following general circulation models (GCMs), available from WorldClim v1.4 (Hijmans et al., 2005), as being representative of future projections of climate change: The Community Climate System Model CCSM4 by UCAR, the Hadley Centre Global Environment Model HadGEM2 from the Met Office and the Global Climate Model GFDL-CM3 by NOAA. We selected these GCMs as they stem from different families in the model genealogy and provide a range of future projections (Knutti et al., 2013).
For each GCM, we considered three different greenhouse gas emission scenarios (termed representative concentration pathways, and labelled RCP 26, RCP 45, and RCP 85) for mid-century projections (2050). We did not consider longer time-frames since the uncertainties in the projections are known to increase by the end of the century (Baker et al., 2015). These RCP pathways are named according to their radiative forcing values in the year 2100, relative to pre-industrial values [+2.6, +4.5, and +8.5 W/m2, respectively (van Vuuren et al., 2011)]. We included different RCP pathways to be able to compare a range of potential future scenarios and to cover potential lower and upper limits of these scenarios, but it should be noted that climates similar to those projected by RCP 26 and RCP 85 are regarded being increasingly unlikely based on current adaptation trajectories (Hausfather and Peters, 2020). We avoided using an additional intermediate pathway (RCP 60), as data were not available for all GCMs for this RCP at the time.
Species Distribution Models
We modelled the relationship between recent species’ distributions and the four different bioclimatic variables using four modelling techniques: general additive models (GAM), generalized linear models (GLM), generalized boosted regression models (GBM) and random forest models (RF). These models were chosen based on their prior performance (Araújo et al., 2005; Prasad et al., 2006; Meynard and Quinn, 2007; Elith and Graham, 2009; Wenger and Olden, 2012) and to provide a contrast between parametric, semi-parametric and classification or regression tree-based models (Bagchi et al., 2013). We selected pseudo-absences for each species from beyond the species current range, and drawn from across all of the Americas. The absences were selected using a distance weighted approach following a declining probability of 1/(De)2, where De is equal to the distance, in km, from the range edge (Hof et al., 2018). The modelling was conducted in R, following the methods of Bagchi et al. (2013), and using the “gam” function from the “mgcv” package for the GAMs, the “gbm” package for the GBMs, the “randomForest” package for the RFs and the “stats” package for the GLMs (McCullagh and Nelder, 1989; Breiman, 2001; Wood, 2006; Ridgeway, 2007; R Developement Core Team, 2012).
To deal with spatial dependence of data, and to minimize overfitting, we used a blocking approach for the species distribution modelling (following the methods presented in Bagchi et al., 2013). The data were split into sampling units based on the ecoregions occurring across the Americas (Olson et al., 2001). All of the sampling units (ecoregions or parts of ecoregions) were divided across five blocks, such that each block fully represented the climate types across the region. Models were subsequently built on four blocks and tested on the one left-out block (Bagchi et al., 2013). We repeated this five times, leaving out a different block each time, then assessed model performance on each of the five left-out blocks, using Area under the ROC curve (AUC) as well as the Continuous Boyce index as implemented by the “ecospat” R-package (Swets, 1988; Boyce et al., 2002; Hirzel et al., 2006; Di Cola et al., 2017).
For 372 of the 913 species with very small ranges for which the blocking approach did not work, even at quarter degree grid cell scale, we instead used a 70:30 data split for modelling/testing, acknowledging that these models may not be as robust as models assessed on truly independent blocks of data.
For all species, in order to avoid simulating large increases in range extent in areas well beyond the potential colonization range of a species over the current century, we restricted the extent over which we projected newly suitable cells based on species-specific natal dispersal distance estimates. For example, we only projected potential future occupancy in areas within the distance, dx, of the recent range margins of a species X, where:
and where projection period is the period (in years) between the contemporary modelled occurrence and the future time period, age at first breeding is the typical time (in years) between birth and first breeding for most individuals of species X (from (Bird et al., 2020), and “natal dispersal distance” is the mean distance between hatching locality and the first breeding attempt for individuals of species X (from Santini et al., 2019).
We produced 180 projections for each species (4 × SDMs, 5 × blocks, 3 × GCM, and 3 × RCP) and took ensemble means across the different blocks, species distribution model techniques and GCMs to derive one current scenario of projected distributions and one future scenario of projected distributions per RCP. Additionally, we calculated the variability across the different SDM and GCM projections around the mean projections. We produced projections for 3,798 out of the 3,926 species occurring in the study region, excluding the remainder owing to their restricted ranges or low model performance. We applied thresholds to the projected mean suitability values to convert suitability to projections of presence/absence. Species-specific thresholds were used that optimized the fit of the resultant present-day suitability models to current observed distributions [using the threshold that maximises the kappa statistic to assess model fit (Cohen, 1960; Freeman and Moisen, 2008)]. We chose the kappa statistic to binarize the predictions, because it has been found to be less likely to overestimate the range of low prevalence species (Freeman and Moisen, 2008). But since the chosen threshold can have a significant impact on the extent of the projected species occurrences (Liu et al., 2013), we have repeated the analysis using the True Skill Statistic (TSS) for comparison (Supplementary Figures S8–S13).
Summarizing Species Range Shifts and Changes in Range Extent
We derived summary statistics for the projected range changes across all modelled species. To estimate the mean direction and distance of the projected range shifts, we first derived the current and future range centroid of the projected distribution for each species, using the packages “geosphere”, “circular,” and “CircStats” in R (Jammalamadaka and SenGupta, 2001). From these range centroids we calculated the distance and the direction of the projected range shift for each species. We then compared the distance and direction of the projected range shifts across all species. To asses changes in species range extents, we calculated the current and future range extent in km2 based on the grid cells a species was projected to occur in. The size of the individual grid cells in km2 was derived using the “area” function from the “raster” package (Hijmans and van Etten, 2012).
Applying SDMs to IBAs and Evaluating Species Occurences and Adaptation Strategies
We sourced polygon shapefiles for 1,653 IBAs across the Caribbean, and Central and South America from BirdLife International. We then simulated current and potential future occurrence of species in each IBA using the following process. We overlaid the IBAs with the gridded projections of species occurrence, i.e., the presence-absence projections produced after applying thresholds (as described above); our assumption being that an IBA within a half-degree cell would have similar climate to the cell. A species was counted as present in the IBA at a given time, if the IBA polygon overlapped with at least one grid cell the species was projected to occur in. We estimated the number of species projected to colonize (species for which the site becomes climatically suitable) or disappear (species for which the site becomes climatically unsuitable) from each IBA. To explore the potential need for different management interventions in response to projected future changes, we classified each IBA into one of five CCASs, based on the projected colonization and loss of species. The different CCAS defined by Hole et al. (2011) are: “High persistence”, “Increasing specialization”, “High turnover”, “Increasing value,” and “Increasing diversification”. Each category is associated with different management actions, including habitat restoration, translocation of species, disturbance regime management, and management of the landscape around sites (Hole et al., 2011). Our approach followed Hole et al. (2011) in that we plot the proportion of species projected to disappear from the site in future against the proportion of projected colonists. We used the median, lower quartile, and upper quartile of values along each axis to divide the area of the resulting graph into five sectors (Supplementary Figure 1). We then classified each IBA into one of five categories according to the graph sector into which it fell: high persistence, increasing specialization, high turnover, increasing value, and increasing diversification.
To further investigate the spatial heterogeneity in the distribution of IBAs classified in each of the five CCAS, we calculated the proportion of IBAs that fell under each strategy per country.
Changes in Species Richness and Species Turnover
To provide summary descriptions of the change in species in IBAs, we calculated “species turnover” as Bray Curtis dissimilarity (Bray and Curtis, 1957):
Whereas Cij is the number of species common between both points in time and Si and Sj are the total number of species counted in time periods i and j, respectively.
We summarized the projected changes in IBA occupancy for species currently and in future. We also calculated, for each IBA, the proportion of species currently projected to occur in an IBA but for which the IBA was projected to become climatically unsuitable in future. We correlated the proportion of species for which an IBAs was projected to remain climatically suitable with the size of the IBA, to determine whether larger IBAs were more likely to remain climatically suitable for a higher proportion of species.
Accounting for the Presence of Suitable Habitat
The ability of a species to become established in an IBA will depend also on the availability of suitable habitat within the site. To check how accounting for suitable habitat might impact the results of our analyses we clipped the projected climatic suitability for each species by a layer of current habitat, following species-specific habitat preferences of BirdLife International. The habitat data were derived from the ESA 2010 Global Land Cover Map, which we matched with species’ habitat preferences from BirdLife International (Supplementary Table 4). Subsequently, we clipped the projected current and future climatically suitable area by the current occurrence of primary habitats per species. We counted an IBA as having suitable habitat for the species providing any of its primary preferred habitats occurs in the IBA currently, regardless of the extent of the suitable habitat. We repeated all subsequent analyses to explore the potential impacts of accounting for habitat availability on the results (Supplementary Figures S14–S19).
All analyses were conducted in R version 3.6.1 (R Developement Core Team, 2012). Detailed methods for the SDMs can be found in Bagchi et al. (2013), all R codes to analyse the resulting species distributions can be found on GitHub1.
Results
The mean model performance of the four SDMs (GAM, GBM, GLM, and RF), based on the AUC, was high across all species (GAM = 0.97 ± 0.03, GBM = 0.96 ± 0.03, GLM = 0.96 ± 0.03, and RF = 0.97 ± 0.03) as well as across the species of conservation concern (GAM = 0.97 ± 0.03, GBM = 0.96 ± 0.04, GLM = 0.95 ± 0.03, and RF = 0.97 ± 0.03). 128 species had to be excluded from the analysis due to poor model fit (AUC < 0.7), of which 29 were species of conservation concern. This left us with model results for 3,798 species, of which 939 were of conservation concern.
We projected widespread declines in the richness of species of conservation concern (i.e., those for which IBAs have been identified) within grid cells across the Caribbean, and Central and South America, with the largest declines projected in the southern Amazon region (Figure 1). The pattern in the projected changes in the richness of species of conservation concern mirrored the projected changes in overall species richness based on all 3,798 species modelled across the region. For the majority of the species of conservation concern, range extent was projected to decrease by the mid-century (2050) under climate warming, with a mean decrease of 20 ± 49 (SD) percent. Species’ range centroids were projected to shift 113 ± 111 (SD) km, but with no consensus in the direction of shift, although more species were projected to move to lower latitudes (192 species, 20%, Supplementary Table 3) than were projected to move to higher latitudes (334 species, 35%, Supplementary Table 3). The spatial pattern of the projected changes in the species richness of species of conservation concern was similar when using TSS as a threshold to binarize the projected occurrences, although overall species richness values were higher for both points in time.
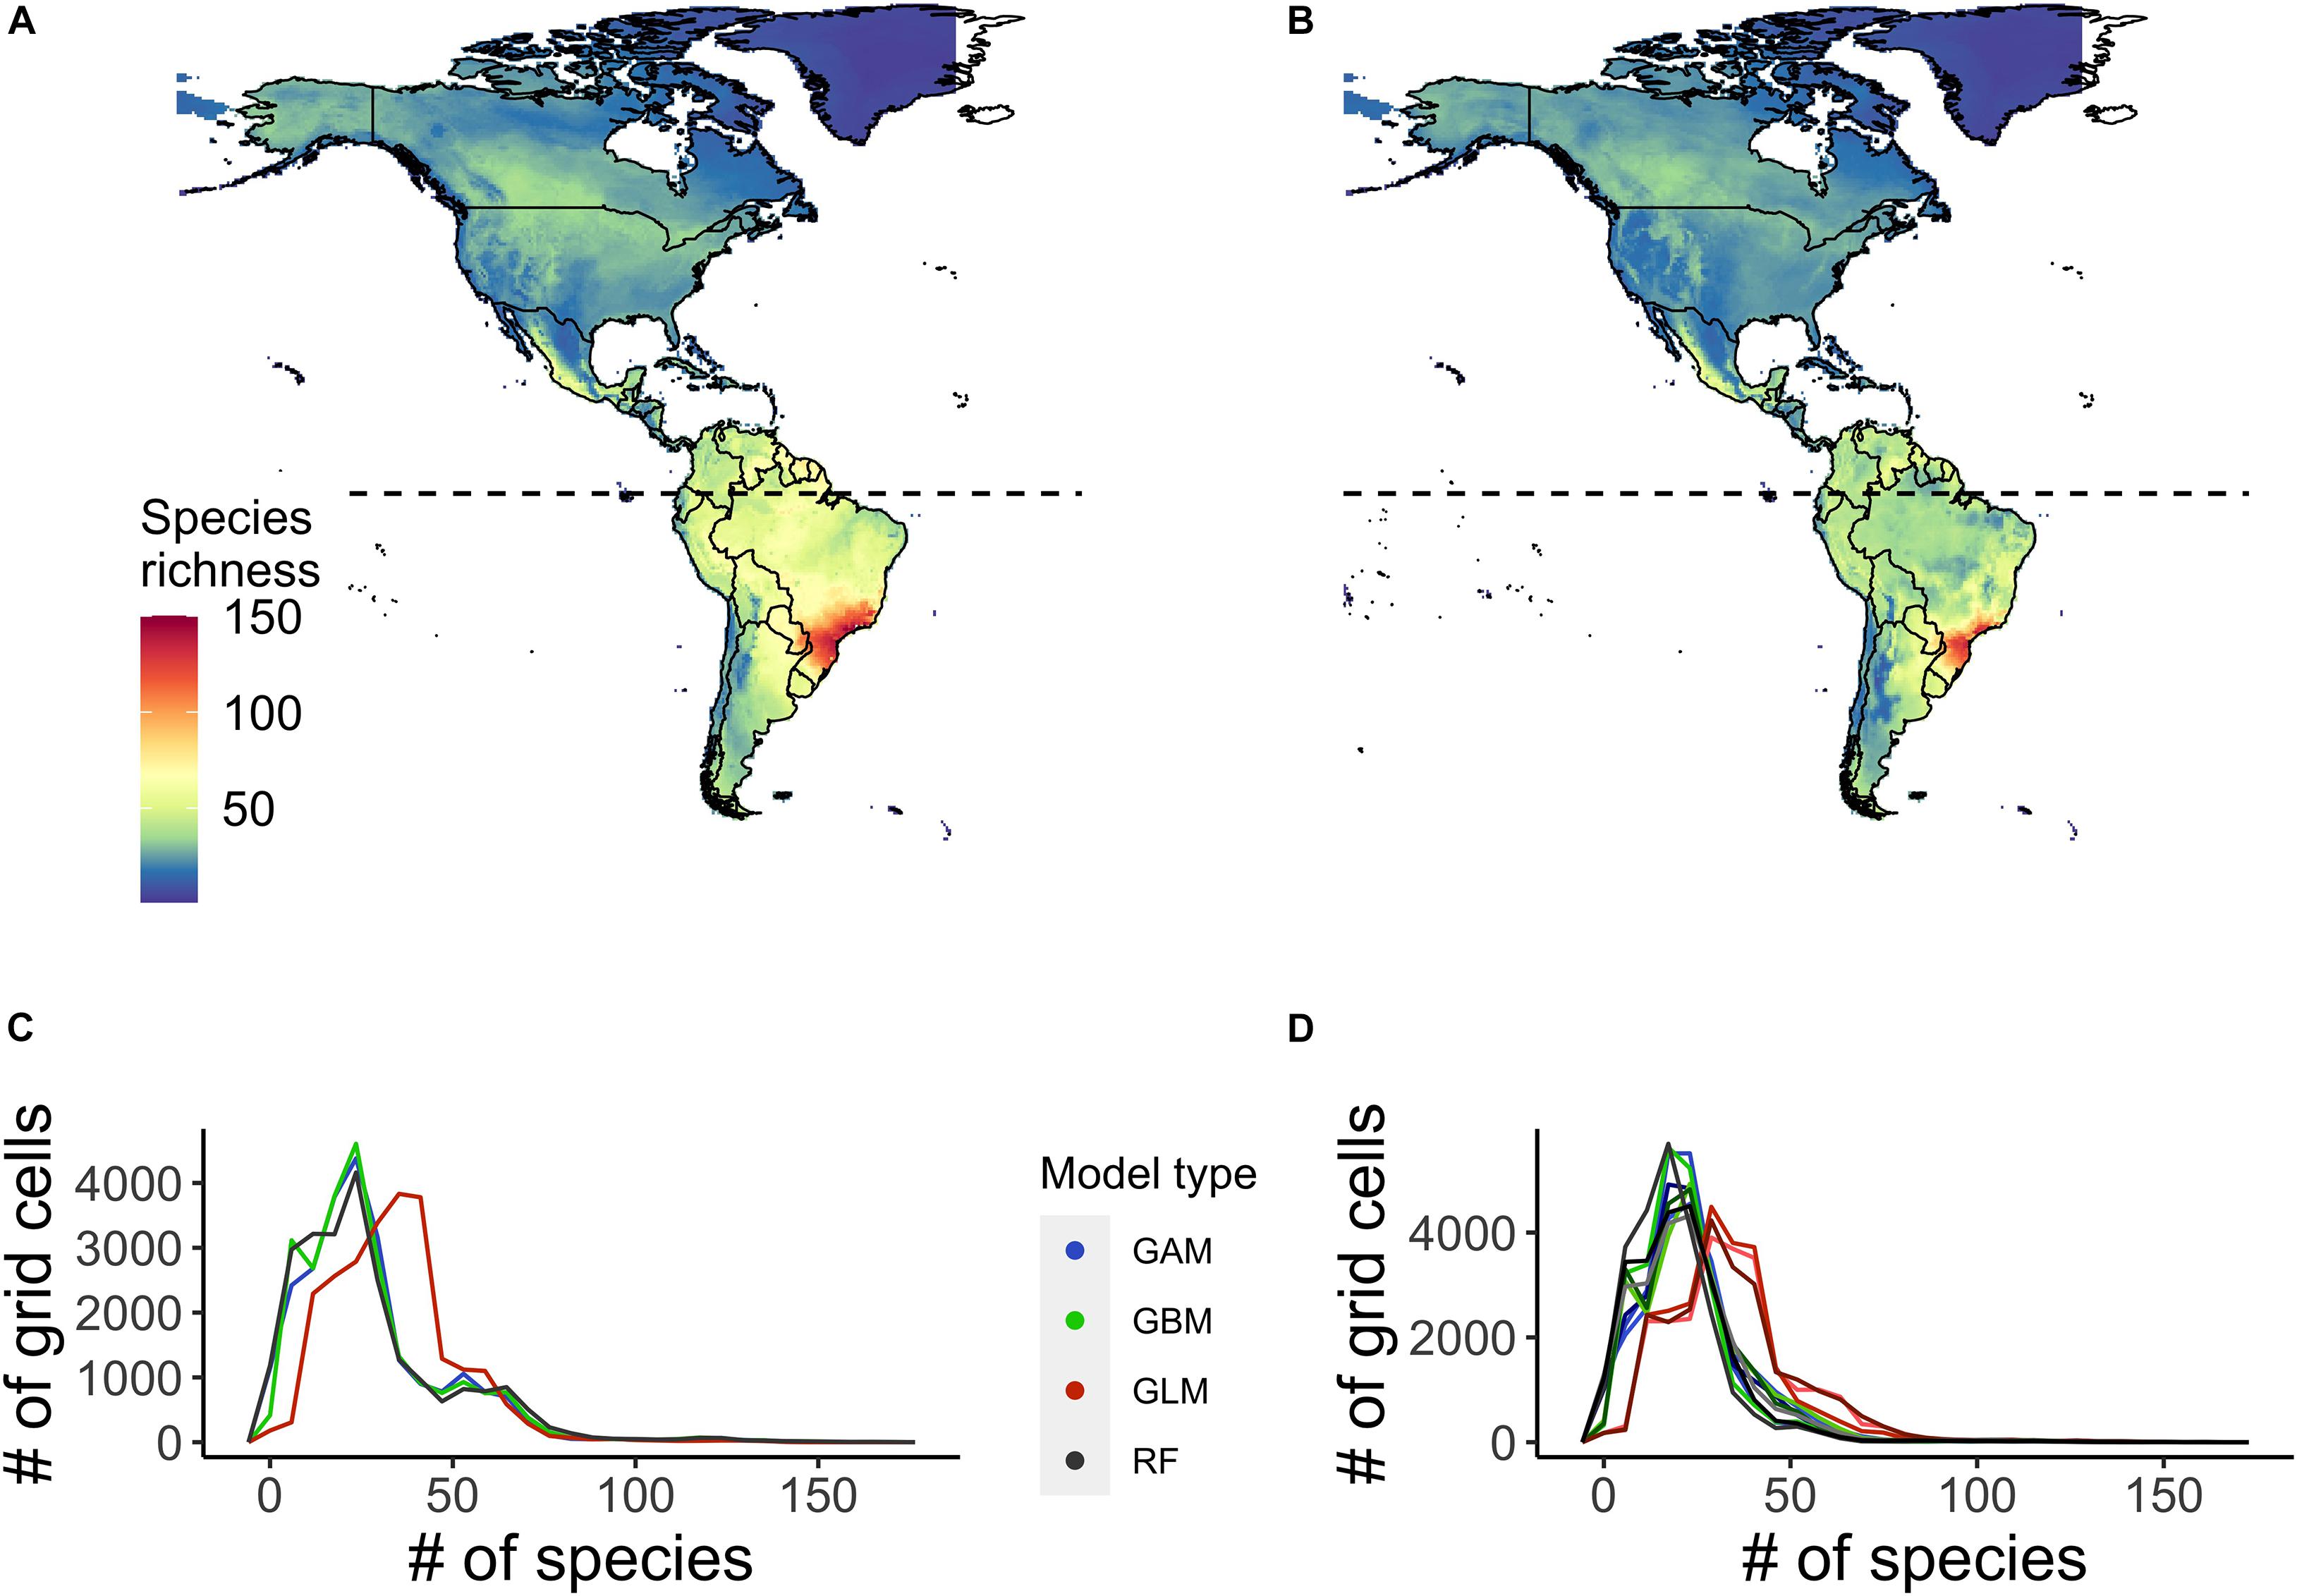
Figure 1. Ensemble projected richness of species of conservation concern, i.e., those for which Important Bird and Biodiversity Areas (IBA) have been identified across the Caribbean, Central and South America, based on climatic suitability of the grid cells. Projected richness is shown (A) currently and (B) under a medium warming scenario (RCP 45) by 2050. (C,D) show the variation in projected current (C) and future (D) species richness of cells among individual species distribution models (SDM) scenarios. The projected future species richness has three lines per SDM scenario representing the different general circulation models (GCMs) (CCSM4, HadGEM2, and GFDL-CM3).
The projected range contractions and shifts have a substantial impact on the projected species compositions in the individual IBAs across the Caribbean, and Central and South America, as well as on the projected occurrence of individual species in IBAs. The mean turnover for species of conservation concern across the individual IBAs was 17 ± 9% (RCP 45). The IBAs with the highest projected species turnover values are located in the southern region of the Amazon. IBAs with the lowest projected turnover are mainly located in Chile and Argentina, but are also scattered across Central America (Figure 2). The turnover was similar across all modelled species 17 ± 8%. Using TSS to binarize the species distributions resulted in a considerably lower turnover 8 ± 6%.
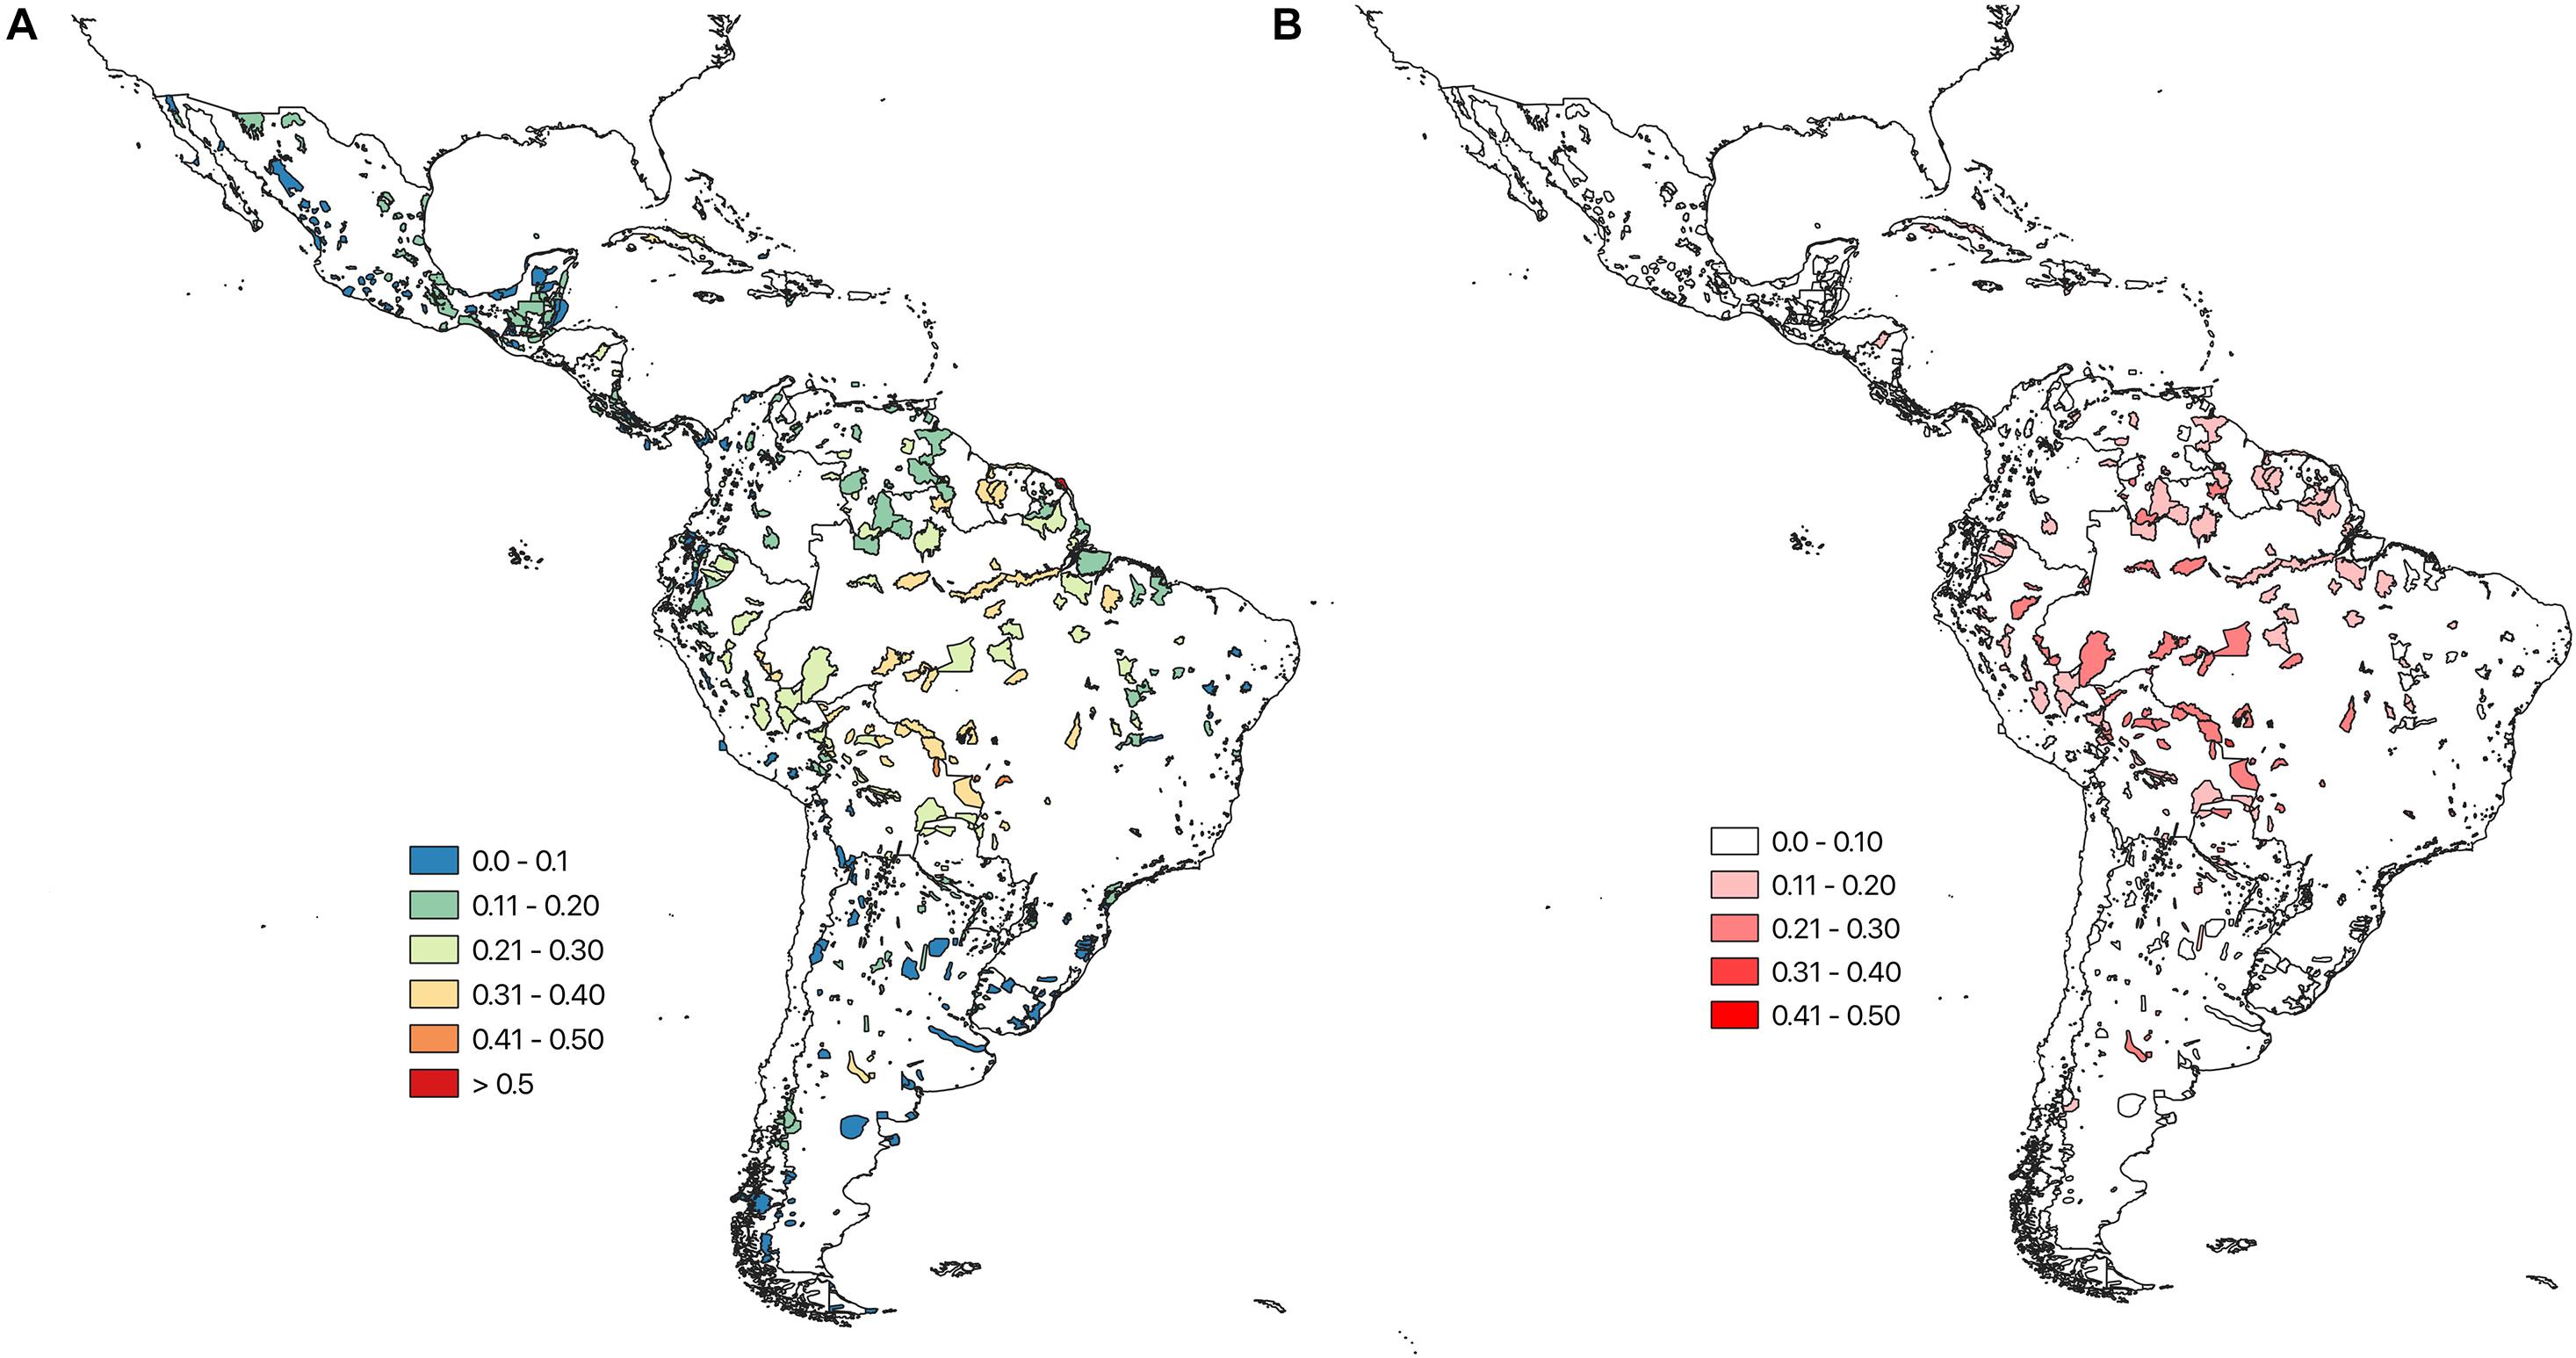
Figure 2. (A) Bray Curtis species turnover for each IBA, calculated between the projected current assemblage of species of conservation concern (based on the climatic suitability) and the projected future (2050) assemblage. Turnover values range between 0 and 1, where 0 indicates low turnover and one high turnover. (B) Uncertainty (SD) around the projected ensemble IBA turnover values, based on the four SDMs and three GCMs, ranging from white, indicating low uncertainty, to red, indicating high uncertainty. Results are shown for a medium warming scenario (RCP 45).
Classifying the IBAs into the five CCASs (Figure 3A), demonstrates marked variability in the extent of change in bird communities across the neotropical IBA network. IBAs projected to lose many of the species for which they were identified and gain few additional species of concern are mainly distributed across the Amazon region. IBAs that are projected to lose many of the species for which they were identified but also to gain many novel species of concern (i.e., high turnover) are located mainly at the periphery of the Amazon region. Sites that have relatively low numbers of projected emigrants and colonists (i.e., stable sites) are mainly distributed across Central America and the southern part of South America including Argentina and Chile. Finally, the IBAs that are projected to become increasingly important (with high numbers of projected colonists and comparably few emigrants), and those with moderate numbers of projected emigrant and colonist species, are widely distributed across Central America and the northern South America, as well as across the Andes and the southern part of South America (Figures 3B,C). Visualizing the distribution of the different CCASs across the Central and South American countries provides more detail on the spatial heterogeneity in the distribution of the projected climate change impacts (Figure 4). Not all countries contain IBAs in each of the CCASs. For example, Suriname has only IBAs that fall into the CCAS “high turnover” and “increasing specialization”. By contrast, Panama and Uruguay have most IBAs classified as “high persistence” and only a small percentage or none of the IBAs classified as “high turnover.”
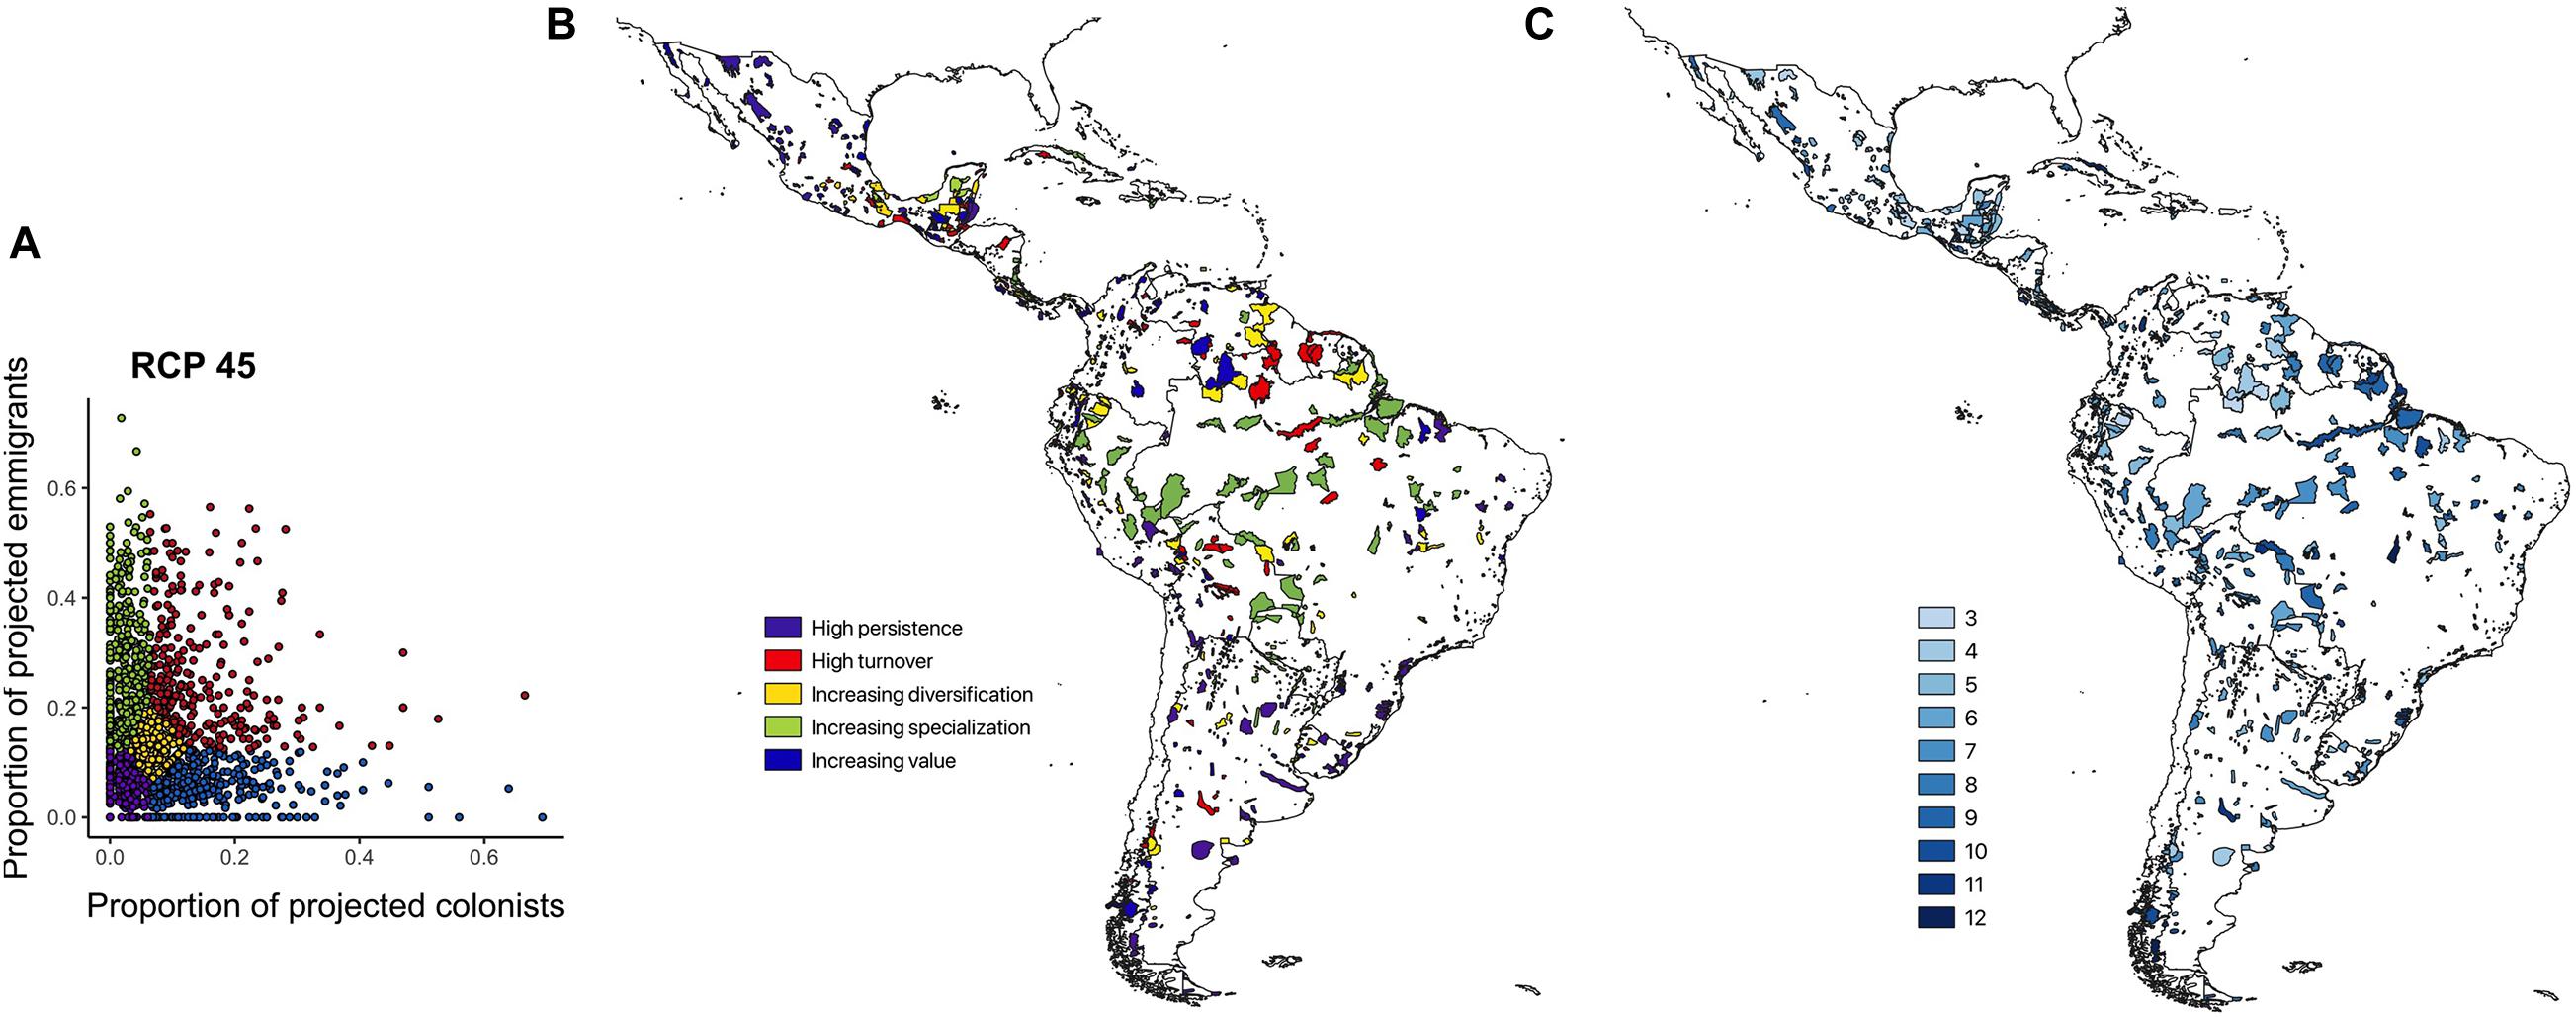
Figure 3. (A) Proportion of projected emigrants relative to the proportion of projected colonists (log scales) by 2050 shown for 1,653 IBAs across the Caribbean, and Central and South America. The IBAs were classified into five Climate Change Adaptation Strategies (CCASs) as proposed by Hole et al. (2011) (see legend and Supplementary Figure S1). (B) Spatial distribution of the CCAS categories for individual IBAs. (C) Consistency in CCASs allocated, reflecting the number of times an IBA is allocated to the same category as the ensemble model [used in (A,B)] when projections are subdivided into the matrix of four SDMs and three GCMs. Values range from 3 (low consistency, i.e., only in the ensemble category in 3 of 12 combinations of SDM and GCM) to 12 (high consistency, i.e., in the same category in all combinations). Results for (A–C) are for RCP 45 by 2050.
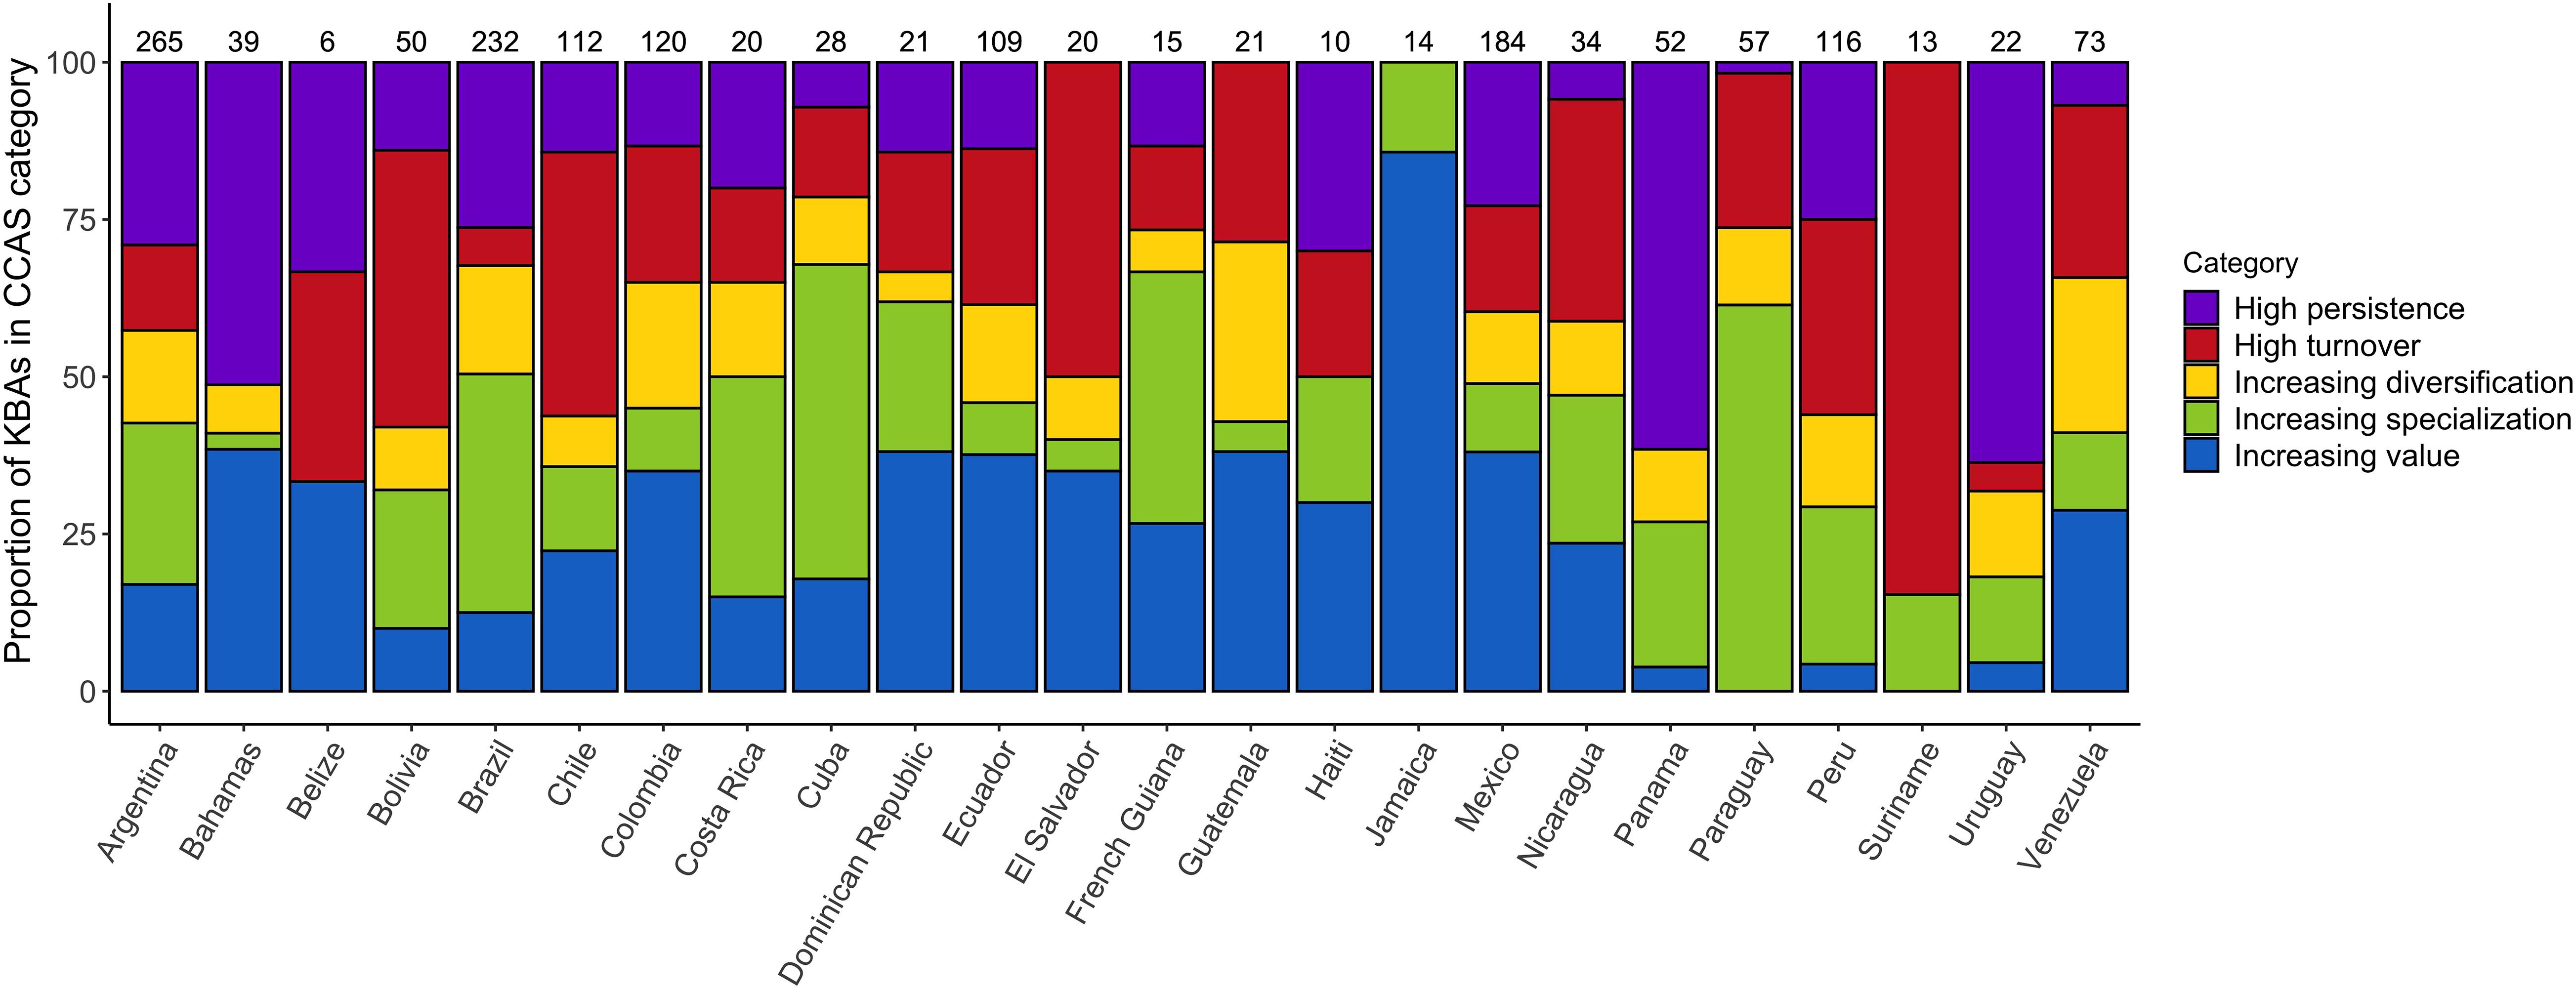
Figure 4. Proportion of IBAs projected to fall into each of the five CCAS as proposed by Hole et al. (2011), shown per country under a medium warming scenario (RCP 45) by 2050 (see legend and Supplementary Figure S1). Values above the bars show the total number of IBAs included in the analysis for the respective country. The presented results are based on the ensemble mean across the four SDMs and three GCMs.
Overall, a high proportion of the species for which IBAs have been identified are projected to retain suitable climate in future within more than 50% of the IBAs in which they currently occur: 73% under a medium emission scenario (RCP 45, Figure 5). The future coverage of suitable climate space for species of conservation concern is slightly higher compared to all species occurring in the region (65%) (Supplementary Table 2). The high retention of suitable climate in at least 50% of the IBAs for which species of conservation concern are projected to currently occur in was consistent across RCP scenarios, but decreased with increasing emissions (RCP 26 = 77%, RCP 85 = 66%, Supplementary Table 2). The mean proportion of IBAs retained per species was 64% and 84% for species of conservation concern and for all modelled species, respectively (Figure 6A). Applying the TSS threshold resulted in an even higher projected coverage of 86% for species of conservation concern. We found that larger IBAs were not more likely to retain species of conservation concern in future than were smaller IBAs (Figure 6B; [rs (1617) = −0.004, p = 0.87)].
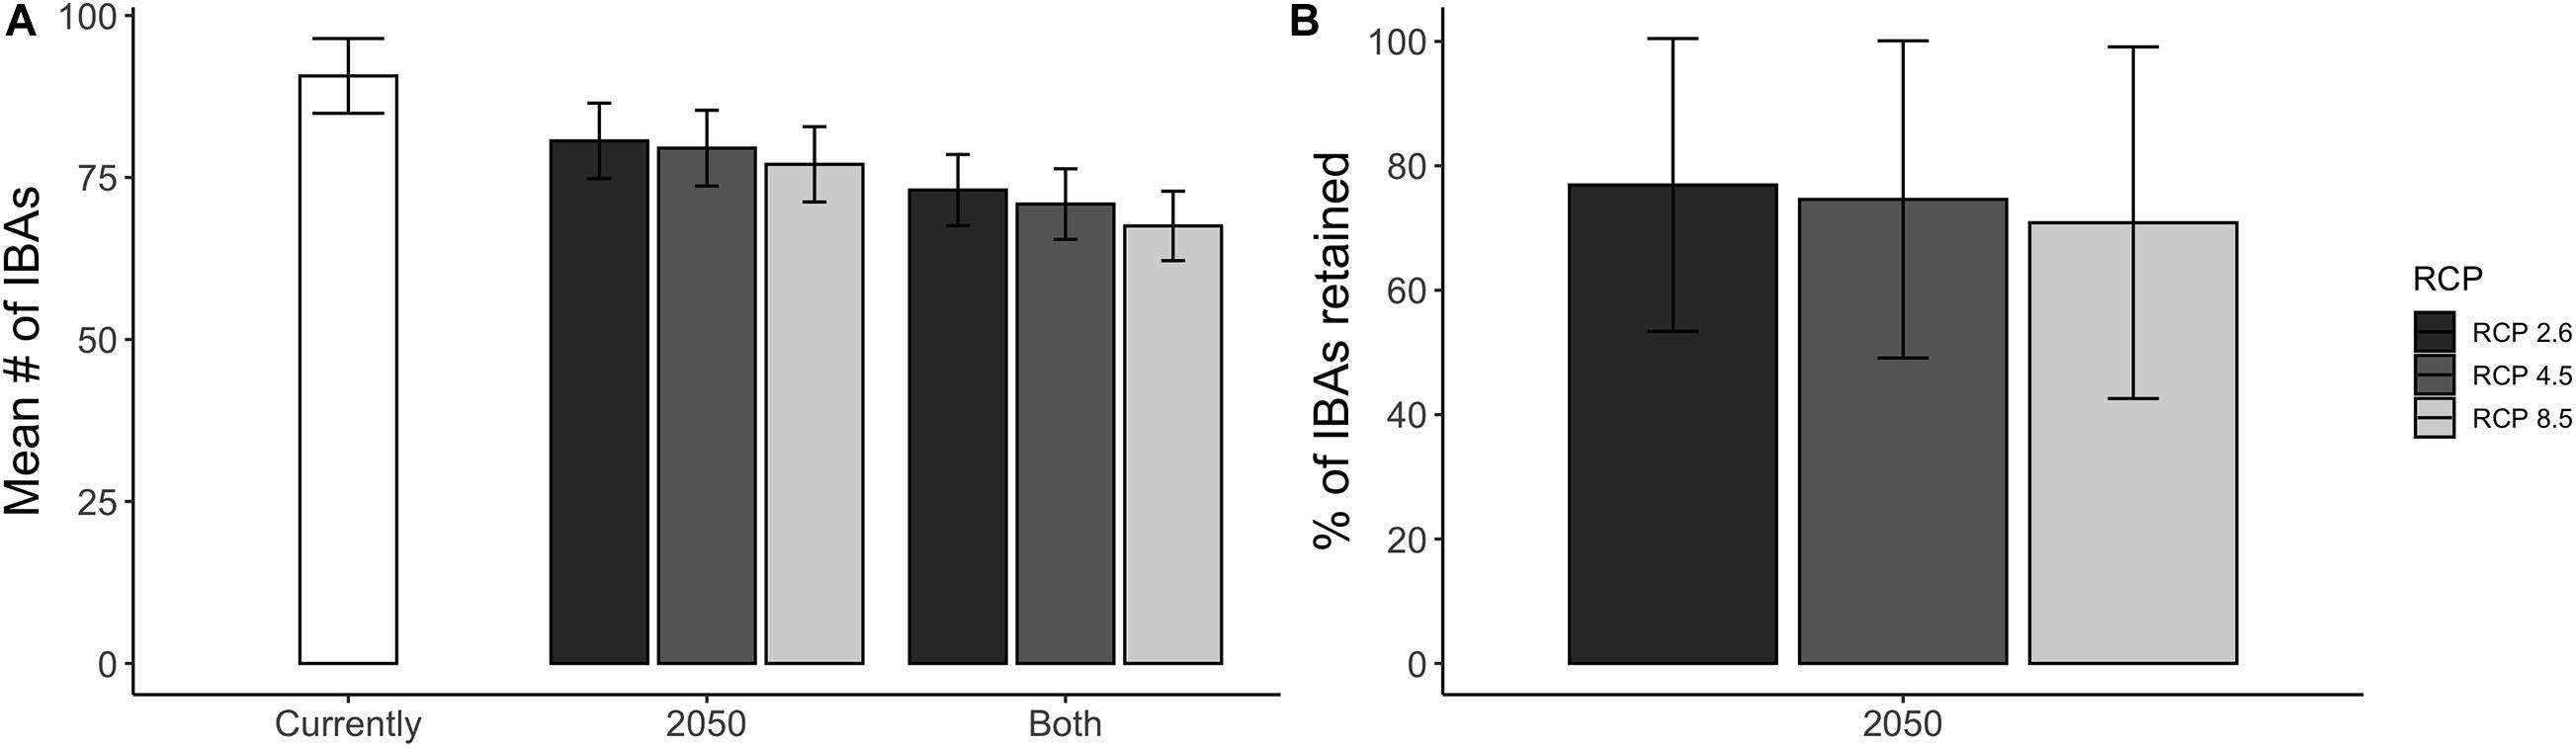
Figure 5. (A) The mean number of IBAs that are projected to be climatically suitable for species of conservation concern and within reach of the species considering natal dispersal ability, shown for the current climatic conditions and the projected future (2050) climatic conditions under three different warming scenarios (RCP 2.6, RCP 4.5, and RCP 8.5). The category “Both” indicates the number of IBAs that are projected to be climatically suitable both currently and in 2050. (B) The mean percentage of IBAs that are projected to remain climatically suitable by 2050 across all species of conservation concern, under the three different warming scenarios. The error bars show the SD around the mean. The presented results are based on an ensemble mean across four SDMs and three GCMs. *Note that not all of the species are projected to be currently covered by a climatically suitable IBA (880 out of 939).
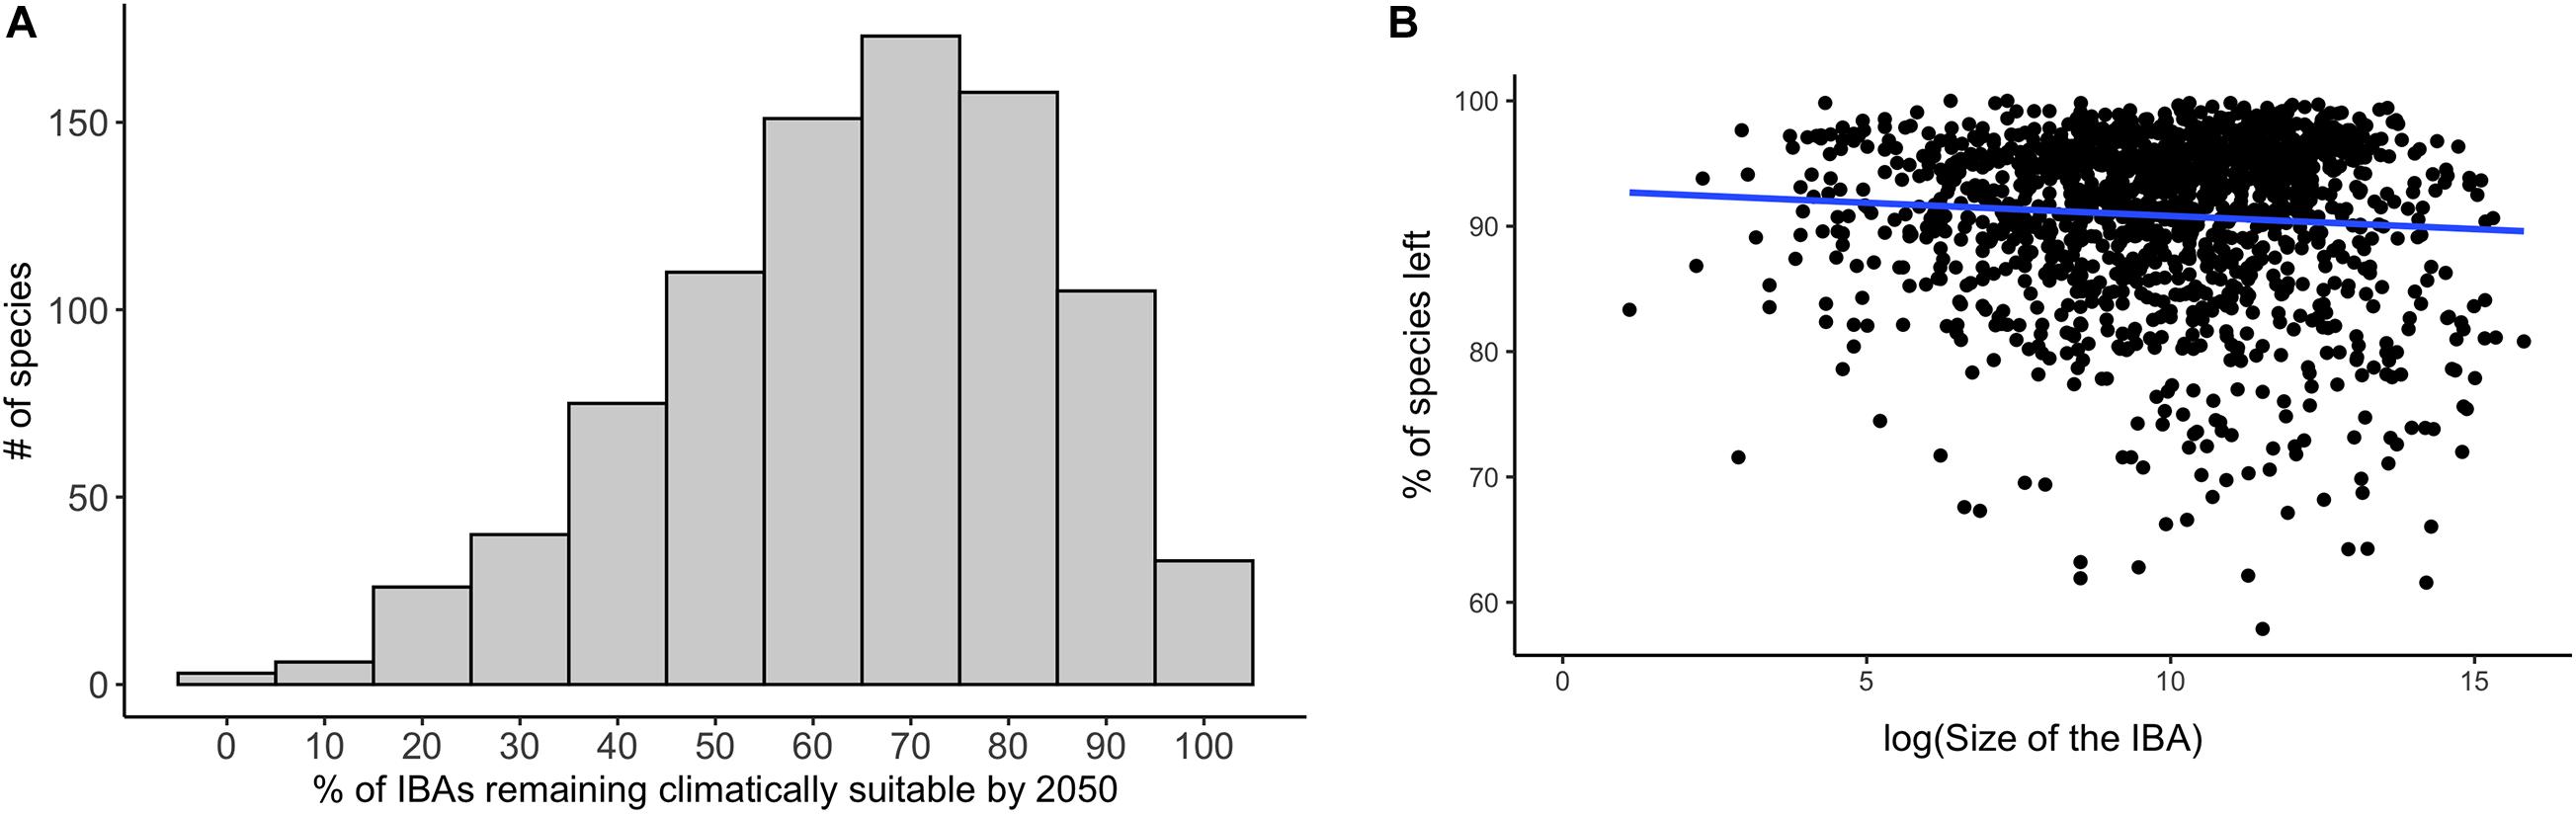
Figure 6. (A) The percentage of IBAs that are projected to be climatically suitable currently and remain climatically suitable in future for each species of conservation concern. (B) The proportion of currently occurring species of conservation concern for which the IBA stays climatically suitable plotted against the size of the IBA. Blue indicates the smoothed regression line between the two variables. Data in both (A,B) are based upon projections using RCP 45 for the period 2050, and are based on an ensemble mean across the four SDMs and three GCMs.
Finally, to explore whether the availability of suitable habitat for species in IBAs might affect our projections, we intersected projected current and future climatic suitability for each species with a current habitat layer, based on species-specific habitat preferences. Although we found slight changes in the number of species that would retain suitable conditions within the IBA network, and in the number of IBAs that remain or become suitable for individual species, the spatial patterns remained robust [i.e., accounting for habitat preferences made little difference to which IBAs were projected to become suitable for an increased number of species (i.e., a high proportion of colonists) relative to other IBAs].
Discussion
The geographic distribution of areas that are most important for conservation is likely to change under climate change (Lee and Jetz, 2008). Earlier studies have predicted changes in the importance of sites across networks, with some sites gaining value and others becoming less important for species conservation in the long term. These projected temporal changes highlight the importance of understanding how site networks are affected by projected species’ range changes under climate change. By modifying conservation strategies accordingly, the effectiveness of the site network to conserve species of concern can be optimised (Hannah et al., 2002; Hannah and Hansen, 2005; Hole et al., 2011). Here, we show that the changes in the climatic suitability of Caribbean, Central and South American IBAs are projected to be spatially very heterogeneous. We focused on the projected impacts on species of conservation concern (i.e., those for which the IBA network has been identified), but also assessed projected impacts on the wider set of species occurring in the Caribbean, and Central and South America (939 species of conservation concern plus 2859 additional species). The results for the complete set of species are very similar to the results for the focal species presented in the main manuscript. This indicates that the impacts of climate change on the species of conservation concern, for which the IBAs were identified, largely mirror the impacts on the wider community of terrestrial bird species. While overall climatic suitability is projected to decrease across the network, some sites are projected to experience an increase in the number of species for which they are climatically suitable. Twenty out of the twenty-four countries we analysed had at least some sites that were projected to undergo an increase in the number of species of conservation concern for which they are climatically suitable. In Belize, Guatemala and Jamaica, the number of sites that were projected to become climatically suitable for a larger number of species in future outweighed the number of sites that were projected to become climatically suitable for fewer species in future (Figure 5). Identifying the sites that are projected to become climatically suitable for an increasing number of species over time is important because these sites might be crucial to facilitate species range shifts under climate change (Lehikoinen et al., 2019). Since species’ ranges are dynamic and prone to change under climate change, facilitating species’ range shifts might become an increasingly important conservation strategy to reduce biodiversity loss (Heller and Zavaleta, 2009; Littlefield et al., 2017).
We projected that for 73% of the species of conservation concern, more than half of the IBAs in which they currently occur remain climatically suitable for them by the middle of the century, and for 90% at least a quarter of sites remain suitable (while for 93% at least one IBA remains suitable). This suggests that, even though there are changes in the climatic suitability of individual IBAs, the network as a whole remains robust. In comparison, Hole et al. (2009) projected that 88–92% of species of conservation concern across Sub Saharan IBA network had at least one IBA remaining climatically suitable by the end of the century. The challenge of how to manage and maintain a viable network of sites under climate change has been widely discussed in the literature. Possible management strategies range from maintaining or expanding the protected area networks to conserve biodiversity (Adams et al., 2019; Dinerstein et al., 2019) to replacing or downgrading individual sites that have become less effective over time (Fuller et al., 2010; Mascia and Pailler, 2011). Previous studies on different networks have suggested that they are likely to remain effective under climate change (Hole et al., 2011; Dunlop et al., 2012; Bagchi et al., 2013; Beale et al., 2013; Johnston et al., 2013). Our findings suggest that the IBA network across the Caribbean, and Central and South America will remain robust but should be managed dynamically, with the conservation objectives of individual sites changing over time. This lends weight to arguments that protected area network expansion (called for under current drafts of a post-2020 Global Biodiversity Framework being negotiated through the Convention on Biological Diversity) should be targeted at sites of biodiversity importance such as IBAs and other Key Biodiversity Areas (Butchart et al., 2015; BirdLife International, 2020a). For the 7% of species of conservation concern that are projected to have no climatically suitable IBA available by the middle of the century, new sites will need to be added to the network, and adaptation actions will be needed to maximise persistence in the sites in which they currently occur.
Our analysis showed that there is a lot of variance in the numbers of species of conservation concern for which sites are projected to decrease, increase or remain stable in climatic suitability, across the different countries in the Caribbean, and Central and South America (Figures 4, 5). Based on the changes in climatic suitability of the IBAs we allocated each site to one of the five CCASs developed by Hole et al. (2011). These different CCASs are associated with different recommendations for the future management of the site, ranging from habitat restoration and management to maintain viable populations of currently occurring species in sites that are projected to be of “high persistence” in their climatic suitability, to modifying habitats through management to support species for which the site is projected to become suitable in future. We show that the distribution of IBAs associated with each CCAS is spatially very heterogeneous across the Caribbean, and Central and South America, which illustrates the need for a continental or global perspective when setting strategies for individual sites. To ensure the network remains effective, sites need to be managed as a regionally or globally coherent network, not just individually or even in a nationally coordinated way. In contrast to studies that focus on the management of individual sites under climate change (Dutra et al., 2018), this approach aims to maintain the effectiveness of networks of sites (Hole et al., 2011).
The size of a protected area is often regarded as being of high importance for their conservation value. Larger sites are less vulnerable to edge effects and other external threatening processes (Laurance et al., 2002; Cantú-Salazar and Gaston, 2010), they have lower rates of extinctions (Brashares et al., 2001), can support larger species and higher trophic level species that need larger home ranges (Woodroffe and Ginsberg, 1998), and such sites often provide a higher return on investment (Cho et al., 2019). We found that for IBAs across the Caribbean, and Central and South America, the likelihood of a site retaining suitable climate for species of conservation concern did not increase with the size of the site. The number of species for which the site was predicted to remain climatically suitable by the middle of the next century was more dependent on the location of the site than its size. Sites that were predicted to become climatically suitable for an increased number of species were concentrated in the Andes, while those projected to remain climatically suitable for a reduced number of species are mainly located in the central Amazon region, and in the foothills of the Andes in Peru. The negative relationship between climatic suitability and the size of the IBA also highlights the importance of particular small sites for the conservation of species. An important factor that impacts the resilience of sites under climate change is the microclimatic heterogeneity of the site, which buffers against the impacts of climate change and may provide local climate refugia for species (Anderson et al., 2014; Suggitt et al., 2018). Due to the resolution of our analysis we can cannot directly link the ability of sites to remain climatically suitable for species of conservation concern to the microclimates occurring in the site, but our results show that the location of the site plays an important role in climate resilience.
There are several limitations owing to the scale and resolution of the study that need to be kept in mind when interpreting our results. Firstly, our analysis is based on range maps showing polygons of distributional boundaries gridded to a resolution of 0.5 × 0.5 degrees as input data for the SDMs. Using polygon range maps as an input (as opposed to point locality data or presence/absence data) allowed us to include a much larger proportion of species, but it is important to recognise that such maps have associated omission and commission errors, and therefore potential mismatches with the underlying climate (Rondinini et al., 2006). Similarly, many of the included IBAs are small, which may lead to mismatches between the underlying climate used in the analysis and the actual microclimate within the IBA. Therefore, while our network-scale results should be robust, the results for individual IBAs or species need to be interpreted carefully. Our finding that the Andes contain a concentration of IBAs with increasing value (i.e., a high number of colonizing species) needs to be treated cautiously given how many montane species might be expected to be incapable of traversing lower-elevations between mountains (Wilson et al., 2005; Sekercioglu et al., 2008; La Sorte and Jetz, 2010). In this region, summed dispersal distances might exceed the distances over which range shifts are plausible, given the need to potentially traverse unsuitable lowland elevations. Producing an iterative, annual dispersal model might be a useful approach in these areas, to account for natural barriers that species are unlikely to cross. Additionally, our analysis is based only on changes in climate suitability, and does not consider potential species interactions. Biotic interactions are likely to have an impact on projected future ranges (Godsoe and Harmon, 2012; Engelhardt et al., 2020) and may determine whether a species will be able to colonise an IBA that is projected to become climatically suitable (Mitchell et al., 2006). Furthermore, the availability of suitable habitat will have an impact of the establishment of species for which an IBA becomes climatically suitable. There have been promising advances to integrate habitat suitability into these types of studies (Rondinini et al., 2011; Methorst et al., 2017), but this still remains a challenge for a continental-scale study and one that projects into the future. Incorporating the availability of species’ primary habitat into the analysis, using a layer of the current habitat, did not substantially change the results. Nevertheless, incorporating habitat preferences as well as habitat dynamics into the models and including future habitat projections as they become available will increase our ability to project potential impacts on site networks under climate change (Regos et al., 2016; Titeux et al., 2017). Notwithstanding these caveats, we consider our study to be robust when it comes to assessing broad trends in climatic suitabilities for species of concern across the IBA network.
Conclusion
Our results confirm that a continental-scale network of sites identified according to their current importance for species is likely to remain effective under future climate change, despite many species shifting their distributions. Although there is high spatial variation in the projected turnover of species within individual IBAs, based on climatic suitability, and individual sites may increase or decrease in the number of species they are climatically suitable for, the network as a whole is projected to still support the majority of species of conservation concern. This highlights the importance of taking a network-scale perspective and of considering site-specific objectives and management decisions based on both projected local impacts and consideration of the context of the site within the wider network.
Data Availability Statement
Publicly available datasets were analyzed in this study. This data can be found here: http://datazone.birdlife.org/home and https://www.worldclim.org/data/bioclim.html.
Author Contributions
CW, SB, and SW designed the study. AV and DB performed the analysis with input from SW, SB, and CW. AV wrote the manuscript with contributions from all authors. All authors approved the submitted version.
Funding
This work was supported by the John D. and Catherine T. Macarthur Foundation.
Conflict of Interest
The authors declare that the research was conducted in the absence of any commercial or financial relationships that could be construed as a potential conflict of interest.
Supplementary Material
The Supplementary Material for this article can be found online at: https://www.frontiersin.org/articles/10.3389/fevo.2021.625432/full#supplementary-material
Footnotes
References
Adams, V. M., Iacona, G. D., and Possingham, H. P. (2019). Weighing the benefits of expanding protected areas versus managing existing ones. Nat. Sustain. 2, 404–411. doi: 10.1038/s41893-019-0275-5
Anderson, M. G., Clark, M., and Sheldon, A. O. (2014). Estimating climate resilience for conservation across geophysical settings. Conserv. Biol. 28, 959–970. doi: 10.1111/cobi.12272
Araújo, M. B., Alagador, D., Cabeza, M., Nogués-Bravo, D., and Thuiller, W. (2011). Climate change threatens European conservation areas. Ecol. Lett. 14, 484–492. doi: 10.1111/j.1461-0248.2011.01610.x
Araújo, M. B., Cabeza, M., Thuiller, W., Hannah, L., and Williams, P. H. (2004). Would climate change drive species out of reserves? An assessment of existing reserve-selection methods. Glob. Change Biol. 10, 1618–1626. doi: 10.1111/j.1365-2486.2004.00828.x
Araújo, M. B., Pearson, R. G., Thuiller, W., and Erhard, M. (2005). Validation of species–climate impact models under climate change. Glob. Change Biol. 11, 1504–1513. doi: 10.1111/j.1365-2486.2005.01000.x
Avalos, V. D. R., and Hernández, J. (2015). Projected distribution shifts and protected area coverage of range-restricted Andean birds under climate change. Glob. Ecol. Conserv. 4, 459–469. doi: 10.1016/j.gecco.2015.08.004
Bagchi, R., Crosby, M., Huntley, B., Hole, D. G., Butchart, S. H. M., Collingham, Y., et al. (2013). Evaluating the effectiveness of conservation site networks under climate change: accounting for uncertainty. Glob. Change Biol. 19, 1236–1248. doi: 10.1111/gcb.12123
Baker, D. J., Hartley, A. J., Burgess, N. D., Butchart, S. H. M., Carr, J. A., Smith, R. J., et al. (2015). Assessing climate change impacts for vertebrate fauna across the West African protected area network using regionally appropriate climate projections. Divers. Distribut. 21, 991–1003. doi: 10.1111/ddi.12337
Beale, C. M., Baker, N. E., Brewer, M. J., and Lennon, J. J. (2013). Protected area networks and savannah bird biodiversity in the face of climate change and land degradation. Ecol. Lett. 16, 1061–1068. doi: 10.1111/ele.12139
Betts, M. G., Wolf, C., Ripple, W. J., Phalan, B., Millers, K. A., Duarte, A., et al. (2017). Global forest loss disproportionately erodes biodiversity in intact landscapes. Nature 547, 441–444. doi: 10.1038/nature23285
Bird, J. P., Martin, R., Akçakaya, H. R., Gilroy, J., Burfield, I. J., Garnett, S. T., et al. (2020). Generation lengths of the world’s birds and their implications for extinction risk. Conserv. Biol. 34, 1252–1261. doi: 10.1111/cobi.13486
BirdLife International (2020a). Birds and Biodiversity Targets: What Do Birds Tell Us About Progress to the Aichi Targets and Requirements for the Post 2020 Biodiversity Framework? A State of the World’s Birds Report. Cambridge: BirdLife International.
BirdLife International (2020b). Important Bird and Biodiversity Area factsheets. Cambridge: BirdLife International.
BirdLife International, and NatureServe. (2014). Bird Species Distribution Maps of the World. Cambridge: BirdLife International.
Boyce, M. S., Vernier, P. R., Nielsen, S. E., and Schmiegelow, F. K. A. (2002). Evaluating resource selection functions. Ecol. Model. 157, 281–300. doi: 10.1016/S0304-3800(02)00200-4
Brashares, J. S., Arcese, P., and Sam, M. K. (2001). Human demography and reserve size predict wildlife extinction in West Africa. Proc. R. Soc. Lond. Ser. B Biol. Sci. 268, 2473–2478. doi: 10.1098/rspb.2001.1815
Bray, J. R., and Curtis, J. T. (1957). An ordination of the upland forest communities of southers Wisconsin. Ecol. Monogr. 27, 326–349.
Butchart, S. H. M., Clarke, M., Smith, R. J., Sykes, R. E., Scharlemann, J. P. W., Harfoot, M., et al. (2015). Shortfalls and solutions for meeting national and global conservation area targets. Conserv. Lett. 8, 329–337. doi: 10.1111/conl.12158
Cantú-Salazar, L., and Gaston, K. J. (2010). Very large protected areas and their contribution to terrestrial biological conservation. BioScience 60, 808–818. doi: 10.1525/bio.2010.60.10.7
Chen, I.-C., Hill, J. K., Ohlemüller, R., Roy, D. B., and Thomas, C. D. (2011). Rapid range shifts of species associated with high levels of climate warming. Science 333, 1024–1026. doi: 10.1126/science.1206432
Cho, S.-H., Thiel, K., Armsworth, P. R., and Sharma, B. P. (2019). Effects of protected area size on conservation return on investment. Environ. Manag. 63, 777–788. doi: 10.1007/s00267-019-01164-9
Coetzee, B. W. T., Robertson, M. P., Erasmus, B. F. N., Van Rensburg, B. J., and Thuiller, W. (2009). Ensemble models predict important bird areas in southern Africa will become less effective for conserving endemic birds under climate change. Glob. Ecol. Biogeogr. 18, 701–710. doi: 10.1111/j.1466-8238.2009.00485.x
Cohen, J. (1960). A coefficient of agreement for nominal scales. Educ. Psychol. Meas. 20, 37–46. doi: 10.1177/001316446002000104
Di Cola, V., Broennimann, O., Petitpierre, B., Breiner, F. T., D’Amen, M., Randin, C., et al. (2017). ecospat: an R package to support spatial analyses and modeling of species niches and distributions. Ecography 40, 774–787. doi: 10.1111/ecog.02671
Dinerstein, E., Vynne, C., Sala, E., Joshi, A. R., Fernando, S., Lovejoy, T. E., et al. (2019). A global deal for nature: guiding principles, milestones, and targets. Sci. Adv. 5:eaaw2869. doi: 10.1126/sciadv.aaw2869
Dockerty, T., Lovett, A., and Watkinson, A. (2003). Climate change and nature reserves: examining the potential impacts, with examples from Great Britain. Glob. Environ. Change 13, 125–135. doi: 10.1016/S0959-3780(03)00010-4
Donald, P. F., Fishpool, L. D. C., Ajagbe, A., Bennun, L. A., Bunting, G., Burfield, I. J., et al. (2019). Important Bird and Biodiversity Areas (IBAs): the development and characteristics of a global inventory of key sites for biodiversity. Bird Conserv. Int. 29, 177–198. doi: 10.1017/S0959270918000102
Dunlop, M., Hilbert, D. W., Ferrier, S., House, A., Liedloff, A., Prober, S. M., et al. (2012). “The implications of climate change for biodiversity conservation and the national reserve system: final Synthesis,” in A Report Prepared for the Department of Sustainability, Environment, Water, Population and Communities, and the Department of Climate Change (Canberra: CSIRO Climate Adaptation Flagship).
Dutra, L. X. C., Bayliss, P., McGregor, S., Christophersen, P., Scheepers, K., Woodward, E., et al. (2018). Understanding climate-change adaptation on Kakadu National Park, using a combined diagnostic and modelling framework: a case study at Yellow Water wetland. Mar. Freshw. Res. 69, 1146–1158. doi: 10.1071/MF16166
Elith, J., and Graham, C. H. (2009). Do they? How do they? WHY do they differ? On finding reasons for differing performances of species distribution models. Ecography 32, 66–77. doi: 10.1111/j.1600-0587.2008.05505.x
Engelhardt, E. K., Neuschulz, E. L., and Hof, C. (2020). Ignoring biotic interactions overestimates climate change effects: the potential response of the spotted nutcracker to changes in climate and resource plants. J. Biogeogr. 47, 143–154. doi: 10.1111/jbi.13699
Freeman, E. A., and Moisen, G. G. (2008). A comparison of the performance of threshold criteria for binary classification in terms of predicted prevalence and kappa. Ecol. Model. 217, 48–58. doi: 10.1016/j.ecolmodel.2008.05.015
Fuller, R. A., McDonald-Madden, E., Wilson, K. A., Carwardine, J., Grantham, H. S., Watson, J. E. M., et al. (2010). Replacing underperforming protected areas achieves better conservation outcomes. Nature 466, 365–367.
Gillingham, P. K., Bradbury, R. B., Roy, D. B., Anderson, B. J., Baxter, J. M., Bourn, N. A. D., et al. (2015). The effectiveness of protected areas in the conservation of species with changing geographical ranges. Biol. J. Linnean Soc. 115, 707–717. doi: 10.1111/bij.12506
Gillings, S., Balmer, D. E., and Fuller, R. J. (2015). Directionality of recent bird distribution shifts and climate change in Great Britain. Glob. Change Biol. 21, 2155–2168. doi: 10.1111/gcb.12823
Godsoe, W., and Harmon, L. J. (2012). How do species interactions affect species distribution models? Ecography 35, 811–820. doi: 10.1111/j.1600-0587.2011.07103.x
Hannah, L. (2008). Protected areas and climate change. Ann. N. Y. Acad. Sci. 1134, 201–212. doi: 10.1196/annals.1439.009
Hannah, L., and Hansen, L. A. (2005). Designing Landscapes and Seascapes for Change. Climate Change and Biodiversity.
Hannah, L., Midgley, G. F., Andelman, S. J., Araújo, M. B., Hughes, G., Martinez-Meyer, E., et al. (2007). Protected area needs in a changing climate. Front. Ecol. Environ. 5:131–138. doi: 10.1890/1540-929520075[131:PANIAC]2.0.CO;2
Hannah, L., Midgley, G. F., Lovejoy, T., Bond, W. J., Bush, M., Lovett, J. C., et al. (2002). Conservation of Biodiversity in a changing climate. Conserv. Biol. 16, 264–268. doi: 10.1046/j.1523-1739.2002.00465.x
Hausfather, Z., and Peters, G. P. (2020). Emissions – the business as ususal story is misleading. Nature 577, 618–620. doi: 10.1038/d41586-020-00177-3
Heller, N. E., and Zavaleta, E. S. (2009). Biodiversity management in the face of climate change: a review of 22 years of recommendations. Biol. Conserv. 142, 14–32. doi: 10.1016/j.biocon.2008.10.006
Hijmans, R. J., Cameron, S. E., Parra, J. L., Jones, P. G., and Jarvis, A. (2005). Very high resolution interpolated climate surfaces for global land areas. Int. J. Climatol. 25, 1965–1978.
Hijmans, R. J., and van Etten, J. (2012). raster: Geographic Analysis and Modelling with Raster Data. R package.
Hiley, J. R., Bradbury, R. B., Holling, M., and Thomas, C. D. (2013). Protected areas act as establishment centres for species colonizing the UK. Proc. R. Soc. B Biol. Sci. 280:20122310. doi: 10.1098/rspb.2012.2310
Hirzel, A., Le Lay, G., Helfer, V., Randin, C. F., and Guisan, A. (2006). Evaluating the ability of habitat suitability models to predict species presences. Ecol. Model. 199, 142–152. doi: 10.1016/j.ecolmodel.2006.05.017
Hof, C., Voskamp, A., Biber, M. F., Böhning-Gaese, K., Engelhardt, E. K., Niamir, A., et al. (2018). Bioenergy cropland expansion may offset positive effects of climate change mitigation for global vertebrate diversity. Proc. Natl. Acad. Sci. U.S.A. 115:13294. doi: 10.1073/pnas.1807745115
Hole, D. G., Huntley, B., Arinaitwe, J., Butchart, S. H. M., Collingham, Y. C., Fishpool, L. D. C., et al. (2011). Toward a management framework for networks of protected areas in the face of climate change. Conserv. Biol. 25, 305–315. doi: 10.1111/j.1523-1739.2010.01633.x
Hole, D. G., Willis, S. G., Pain, D. J., Fishpool, L. D., Butchart, S. H. M., Collingham, Y. C., et al. (2009). Projected impacts of climate change on a continent-wide protected area network. Ecol. Lett. 12, 420–431. doi: 10.1111/j.1461-0248.2009.01297.x
Holloway, P., Miller, J. A., and Gillings, S. (2016). Incorporating movement in species distribution models: how do simulations of dispersal affect the accuracy and uncertainty of projections? Int. J. Geogr. Inform. Sci. 30, 2050–2074. doi: 10.1080/13658816.2016.1158823
Jammalamadaka, S. R., and SenGupta, A. (2001). “Topics in circular statistics,” in Series on Multivariate Analysis, Vol. 5, ed. M. M. Rao (Singapore: World Scientific), doi: 10.1142/4031
Johnston, A., Ausden, M., Dodd, A. M., Bradbury, R. B., Chamberlain, D. E., Jiguet, F., et al. (2013). Observed and predicted effects of climate change on species abundance in protected areas. Nat. Clim. Change 3, 1055–1061. doi: 10.1038/nclimate2035
Kharouba, H. M., and Kerr, J. T. (2010). Just passing through: global change and the conservation of biodiversity in protected areas. Biol. Conserv. 143, 1094–1101. doi: 10.1016/j.biocon.2010.02.002
Knutti, R., Masson, D., and Gettelman, A. (2013). Climate model genealogy: generation CMIP5 and how we got there. Geophys. Res. Lett. 40, 1194–1199. doi: 10.1002/grl.50256
La Sorte, F. A., and Jetz, W. (2010). Projected range contractions of montane biodiversity under global warming. Proc. Biol. Sci. 277, 3401–3410. doi: 10.1098/rspb.2010.0612
Laurance, W. F., Lovejoy, T. E., Vasconcelos, H. L., Bruna, E. M., Didham, R. K., Stouffer, P. C., et al. (2002). Ecosystem decay of amazonian forest fragments: a 22-year investigation. Conserv. Biol. 16, 605–618. doi: 10.1046/j.1523-1739.2002.01025.x
Lee, T. M., and Jetz, W. (2008). Future battlegrounds for conservation under global change. Proc. R. Soc. B Biol. Sci. 275, 1261–1270. doi: 10.1098/rspb.2007.1732
Lehikoinen, P., Santangeli, A., Jaatinen, K., Rajasärkkä, A., and Lehikoinen, A. (2019). Protected areas act as a buffer against detrimental effects of climate change–evidence from large-scale, long-term abundance data. Glob. Change Biol. 25, 304–313. doi: 10.1111/gcb.14461
Lenoir, J., Bertrand, R., Comte, L., Bourgeaud, L., Hattab, T., Murienne, J., et al. (2020). Species better track climate warming in the oceans than on land. Nat. Ecol. Evol. 4, 1044–1059. doi: 10.1038/s41559-020-1198-2
Littlefield, C., McRae, B., Michalak, J., Lawler, J., and Carroll, C. (2017). Connecting today’s climates to future climate analogs to facilitate movement of species under climate change. Conserv. Biol. 31, 1397–1408. doi: 10.1111/cobi.12938
Liu, C., White, M., and Newell, G. (2013). Selecting thresholds for the prediction of species occurrence with presence-only data. J. Biogeogr. 40, 778–789. doi: 10.1111/jbi.12058
Mascia, M. B., and Pailler, S. (2011). Protected area downgrading, downsizing, and degazettement (PADDD) and its conservation implications. Conserv. Lett. 4, 9–20. doi: 10.1111/j.1755-263X.2010.00147.x
Maxwell, S. L., Cazalis, V., Dudley, N., Hoffmann, M., Rodrigues, A. S. L., Stolton, S., et al. (2020). Area-based conservation in the twenty-first century. Nature 586, 217–227. doi: 10.1038/s41586-020-2773-z
McCullagh, P., and Nelder, J. A. (1989). “Generalized linear models,” in Monograph on Statistics and Applied Probability, Vol. 37, (London: Chapman and Hall).
Methorst, J., Böhning-Gaese, K., Khaliq, I., and Hof, C. (2017). A framework integrating physiology, dispersal and land-use to project species ranges under climate change. J. Avian Biol. 48, 1532–1548. doi: 10.1111/jav.01299
Meynard, C. N., and Quinn, J. F. (2007). Predicting species distributions: a critical comparison of the most common statistical models using artificial species. J. Biogeogr. 34, 1455–1469. doi: 10.1111/j.1365-2699.2007.01720.x
Mitchell, C. E., Agrawal, A. A., Bever, J. D., Gilbert, G. S., Hufbauer, R. A., Klironomos, J. N., et al. (2006). Biotic interactions and plant invasions. Ecol. Lett. 9, 726–740. doi: 10.1111/j.1461-0248.2006.00908.x
Olson, D. M., Dinerstein, E., Wikramanayake, E. D., Burgess, N. D., Powell, G. V. N., Underwood, E. C., et al. (2001). Terrestrial ecoregions of the world: A new map of life on earth. Biosci. 51, 933–938. doi: 10.1641/0006-3568(2001)051[0933:TEOTWA]2.0.CO;2
Pecl, G. T., Araújo, M. B., Bell, J. D., Blanchard, J., Bonebrake, T. C., Chen, I.-C., et al. (2017). Biodiversity redistribution under climate change: Impacts on ecosystems and human well-being. Science 355:eaai9214. doi: 10.1126/science.aai9214
Prasad, A. M., Iverson, L. R., and Liaw, A. (2006). Newer classification and regression tree techniques: bagging and random forests for ecological prediction. Ecosystems 9, 181–199. doi: 10.1007/s10021-005-0054-1
R Developement Core Team (2012). R: A Language and Environment for Statistical Computing. Vienna: R Foundation for Statistical Computing.
Randin, C. F., Dirnböck, T., Dullinger, S., Zimmermann, N. E., Zappa, M., and Guisan, A. (2006). Are niche-based species distribution models transferable in space? J. Biogeogr. 33, 1689–1703.
Regos, A., D’Amen, M., Titeux, N., Herrando, S., Guisan, A., and Brotons, L. (2016). Predicting the future effectiveness of protected areas for bird conservation in Mediterranean ecosystems under climate change and novel fire regime scenarios. Divers. Distribut. 22, 83–96. doi: 10.1111/ddi.12375
Rodrigues, A. S. L., Andelman, S. J., Bakarr, M. I., Boitani, L., Brooks, T. M., Cowling, R. M., et al. (2004). Effectiveness of the global protected area network in representing species diversity. Nature 428, 640–643.
Rondinini, C., Di Marco, M., Chiozza, F., Santulli, G., Baisero, D., Visconti, P., et al. (2011). Global habitat suitability models of terrestrial mammals. Philos. Trans. R. Soc. B Biol. Sci. 366, 2633–2641. doi: 10.1098/rstb.2011.0113
Rondinini, C., Wilson, K. A., Boitani, L., Grantham, H., and Possingham, H. P. (2006). Tradeoffs of different types of species occurrence data for use in systematic conservation planning. Ecol. Lett. 9, 1136–1145. doi: 10.1111/j.1461-0248.2006.00970.x
Santini, L., Butchart, S. H. M., Rondinini, C., Benítez-López, A., Hilbers, J. P., Schipper, A. M., et al. (2019). Applying habitat and population-density models to land-cover time series to inform IUCN Red List assessments. Conserv. Biol. 33, 1084–1093. doi: 10.1111/cobi.13279
Sekercioglu, C. H., Schneider, S. H., Fay, J. P., and Loarie, S. R. (2008). Climate change, elevational range shifts, and bird extinctions. Conserv. Biol. 22, 140–150. doi: 10.1111/j.1523-1739.2007.00852.x
Suggitt, A. J., Wilson, R. J., Isaac, N. J. B., Beale, C. M., Auffret, A. G., August, T., et al. (2018). Extinction risk from climate change is reduced by microclimatic buffering. Nat. Clim. Change 8, 713–717. doi: 10.1038/s41558-018-0231-9
Swets, J. A. (1988). Measuring the accuracy of diagnostic systems. Science 240, 1285–1293. doi: 10.1126/science.3287615
Thomas, C. D., Gillingham, P. K., Bradbury, R. B., Roy, D. B., Anderson, B. J., Baxter, J. M., et al. (2012). Protected areas facilitate species’ range expansions. Proc. Natl. Acad. Sci. U.S.A. 109, 14063–14068. doi: 10.1073/pnas.1210251109
Titeux, N., Henle, K., Mihoub, J.-B., Regos, A., Geijzendorffer, I. R., Cramer, W., et al. (2017). Global scenarios for biodiversity need to better integrate climate and land use change. Divers. Distribut. 23, 1231–1234. doi: 10.1111/ddi.12624
van Vuuren, D. P., Edmonds, J., Kainuma, M., Riahi, K., Thomson, A., Hibbard, K., et al. (2011). The representative concentration pathways: an overview. Clim. Change 109:5. doi: 10.1007/s10584-011-0148-z
Venter, O., Magrach, A., Outram, N., Klein, C. J., Possingham, H. P., Di Marco, M., et al. (2018). Bias in protected-area location and its effects on long-term aspirations of biodiversity conventions. Conserv. Biol. 32, 127–134. doi: 10.1111/cobi.12970
Warren, R., Price, J., VanDerWal, J., Cornelius, S., and Sohl, H. (2018). The implications of the United Nations Paris Agreement on climate change for globally significant biodiversity areas. Clim. Change 147, 395–409. doi: 10.1007/s10584-018-2158-6
Wenger, S. J., and Olden, J. D. (2012). Assessing transferability of ecological models: an underappreciated aspect of statistical validation. Methods Ecol. Evol. 3, 260–267. doi: 10.1111/j.2041-210X.2011.00170.x
Wilsey, C. B., Wu, J. X., Taylor, L., Voskamp, A., Willis, S. G., Linares-Romero, L. G., et al. (2019). Proyectando el impacto del cambio climaìtico sobre la avifauna de aìreas protegidas: el caso del Parque Nacional Natural Chingaza, Colombia. Yu’Am 3, 4–21.
Wilson, R. J., Gutiérrez, D., Gutiérrez, J., Martínez, D., Agudo, R., and Monserrat, V. J. (2005). Changes to the elevational limits and extent of species ranges associated with climate change. Ecol. Lett. 8, 1138–1146. doi: 10.1111/j.1461-0248.2005.00824.x
Woodroffe, R., and Ginsberg, J. R. (1998). Edge effects and the extinction of populations inside protected areas. Science 280, 2126–2128. doi: 10.1126/science.280.5372.2126
Worboys, G. L., Winkler, C., and Lockwood, M. (2006). “Threats to protected areas,” in Managing Protected Areas: A Global Guide, eds M. Lockwood, G. L. Worboys, and A. Kothari (London: Earthscan).
Keywords: species distribution models, important bird and biodiversity areas, species turnover, ecological forecasting, IUCN red list, threatened species, climate change
Citation: Voskamp A, Butchart SHM, Baker DJ, Wilsey CB and Willis SG (2021) Site-Based Conservation of Terrestrial Bird Species in the Caribbean and Central and South America Under Climate Change. Front. Ecol. Evol. 9:625432. doi: 10.3389/fevo.2021.625432
Received: 03 November 2020; Accepted: 26 March 2021;
Published: 04 May 2021.
Edited by:
Evan R. Buechley, Smithsonian Migratory Bird Center, United StatesReviewed by:
Marco Girardello, Joint Research Centre, ItalyAdrián Regos, Universidade Santiago de Compostela, Spain
Copyright © 2021 Voskamp, Butchart, Baker, Wilsey and Willis. This is an open-access article distributed under the terms of the Creative Commons Attribution License (CC BY). The use, distribution or reproduction in other forums is permitted, provided the original author(s) and the copyright owner(s) are credited and that the original publication in this journal is cited, in accordance with accepted academic practice. No use, distribution or reproduction is permitted which does not comply with these terms.
*Correspondence: Alke Voskamp, alke.voskamp@senckenberg.de; Stephen G. Willis, s.g.willis@durham.ac.uk
†ORCID: Alke Voskamp, orcid.org/0000-0002-9528-6317; Chad B. Wilsey, orcid.org/0000-0002-1448-1445; Stephen G. Willis, orcid.org/0000-0002-8656-580; David J. Baker, orcid.org/0000-0002-0466-8222