 Xiangfeng Wang1,2* X. Shirley Liu2*
- 1 School of Plant Sciences, University of Arizona, Tucson, AZ, USA
- 2 Department of Biostatistics and Computational Biology, Dana-Farber Cancer Institute and Harvard School of Public Health, Boston, MA, USA
MicroRNAs (miRNAs) are a class of 20–23 nucleotide small RNAs that regulate gene expression post-transcriptionally in animals and plants. Annotation of miRNAs by the miRNA database (miRBase) has largely relied on computational approaches. As a result, many miRBase entries lack experimental validation, and discrepancies between miRBase annotation and actual miRNA sequences are often observed. In this study, we integrated the small RNA sequencing (smRNA-seq) datasets in Caenorhabditis elegans and Drosophila melanogaster and devised an analytical pipeline coupled with detailed manual inspection to curate miRNA annotation systematically in miRBase. Our analysis reveals 19 (17.0%) and 51 (31.3%) miRNAs entries with detectable smRNA-seq reads have mature sequence discrepancies in C. elegans and D. melanogaster, respectively. These discrepancies frequently occur either for conserved miRNA families whose mature sequences were predicted according to their homologous counterparts in other species or for miRNAs whose precursor miRNA (pre-miRNA) hairpins produce an abundance of multiple miRNA isoforms or variants. Our analysis shows that while Drosophila pre-miRNAs, on average, produce less than 60% accurate mature miRNA reads in addition to their 5′ and 3′ variant isoforms, the precision of miRNA processing in C. elegans is much higher, at over 90%. Based on the revised miRNA sequences, we analyzed expression patterns of the more conserved (MC) and less conserved (LC) miRNAs and found that, whereas MC miRNAs are often co-expressed at multiple developmental stages, LC miRNAs tend to be expressed specifically at fewer stages.
Introduction
MicroRNAs (miRNAs) are a class of small RNA molecules that mediate post-transcriptional regulation of gene expression by pairing with complementary sites on mRNA transcripts (reviewed by Carthew and Sontheimer, 2009). The typical size of mature miRNA sequences ranges from 20 to 23 nucleotides, produced from precursor miRNAs (pre-miRNAs) containing characteristic hairpin structures. For the past 8 years, the public miRNA database (miRBase) has been dedicated to collecting and annotating miRNAs for all biological species (Griffiths-Jones, 2004; Griffiths-Jones et al., 2006, 2008). During the past 2 years, the total number of registered miRNAs in miRBase has increased from 6,306 in release 11.0 to 14,197 in the current release 15.0 (http://www.mirbase.org). This dramatic expansion of newly discovered miRNAs is largely a benefit of the adoption of next-generation high-throughput sequencing technology. Hence, there are currently three main sources of miRNA collection: experimentally cloned miRNAs with functional validation collected from the published literature; homologous miRNAs identified from sequence alignment but lacking experimental verification; and miRNAs directly captured by small RNA sequencing (smRNA-seq) platforms. In fact, the majority of miRNA entries recently added to miRBase have been identified by the latter two methods, which principally rely on computational predictions of stem-loop structures for candidate miRNA loci screened from sequence alignments or smRNA-seq results (Hofacker et al., 1994). A fundamental concern raised by miRBase users is the reliability of computationally predicted miRNAs, especially the accuracy of their mature sequences. For example, sequence alignment-based prediction is unable to determine precisely the mature sequences because subtle differences in one or two nucleotides usually exist between miRNA homologs. For example, the mature sequence of let-7, a highly conserved miRNA in animal species, is one nucleotide longer in Caenorhabditis elegans than in Drosophila melanogaster (Figure S1 in Supplementary Material).
Discrepancies between predicted and actual miRNA sequences were frequently found among miRNA families containing multiple members, whose mature sequences may be either identical (denoted by a numbered suffix) or slightly different (denoted by a lettered suffix). For instance, according to the miRBase annotation D. melanogaster mir-2a-1 and mir-2a-2 have identical mature sequences derived from the exact same 27 consecutive nucleotides of the miRNA arm from each pre-miRNA sequence. However, the actual mir-2a-1 and mir-2a-2 mature sequences obtained from smRNA-seq results were found to be different (reviewed by Liu et al., 2008). Another critical issue is to define the miRNA arm (guide strand) and miRNA* arm (passenger strand) when a stem-loop structure for a candidate pre-miRNA is predicted (Ahmed et al., 2009). In special cases, both miRNA and miRNA* strands are functional (denoted with -5p and -3p based on their locations in the pre-miRNA), such as mir-iab-4-5p and mir-iab-4-3p in D. melanogaster. In fact, a potential function of non-degraded miRNA* has recently garnered attention because significantly enriched miRNA* strands for certain miRNAs were found in association with Ago2 in D. melanogaster (Okamura et al., 2009).
Small RNA sequencing data also present a realistic picture of how mature miRNAs are processed from a single pre-miRNA hairpin, in which a heterogeneous combination of miRNA isoforms or variants are produced in addition to the accurate miRNA and miRNA* sequences (Langenberger et al., 2009). These include the three types of observed reads: (1) reads derived from the loop region of pre-miRNA hairpins; (2) isoform variants of the accurate miRNA and miRNA* with positional variations at 5′ and 3′ ends; and (3) miRNA reads containing non-templated nucleotides at their 3′ ends (Seitz et al., 2008; Langenberger et al., 2009; Ibrahim et al., 2010). The variety of heterogeneous miRNA isoforms collectively reflects the complexity of the miRNA biogenesis and metabolism pathways.
The use of high-throughput sequencing provides a way not only to promptly interrogate miRNA expression and discover new miRNAs, but also to inspect miRNA processing patterns. Nevertheless, appropriately processing and interpreting the smRNA-seq data is still a challenge. Because discrepancies between miRBase and actual miRNA sequences are frequently observed, concerns have been raised that analysis of miRNA expression patterns might be biased when using miRBase sequences directly as a reference to count smRNA-seq reads. Therefore, our primary aim is to develop a computational pipeline to curate the miRBase annotation systematically using the integrated smRNA-seq datasets and, upon careful manual inspection, to rebuild the miRNA expression atlas for C. elegans and D. melanogaster development.
Results
A Single Pre-miRNA Sequence Usually Produces Heterogeneous miRNA Isoforms
The 14th release of miRBase contains 174 and 157 miRNAs in C. elegans and D. melanogaster, respectively. Based on the mature miRNA sequences annotated in miRBase, the typical sizes of animal and plant miRNAs peak at 22- and 21-nt, respectively, while an equal frequency of 22- and 23-nt miRNAs is observed in C. elegans. Because authentic miRNAs are usually conserved among closely related species, we first classified miRNA families into two groups according to their relative conservation (a method previously described in Ma et al., 2010). miRNAs that have homologies outside Hexapoda or Nematoda were termed more conserved (MC), while those extant only in Hexapoda or Nematoda were termed less conserved (LC). By this classification, miRBase R14.0 contains 38 MC families and 98 LC families in D. melanogaster and 11 MC families and 146 LC families in C. elegans.
We integrated the smRNA-seq data produced by the modENCODE consortium (GEO accessions and sample descriptions are shown in Table S1 in Supplementary Material). In D. melanogaster, we compiled a dataset covering developmental stages from early embryos, late embryos, larvae and pupae as well as the bodies and heads of male and female adults (Chung et al., 2008; Czech et al., 2008). For C. elegans we used two datasets, one covering different stages of embryonic development and the other covering the main developmental stages including mixed embryos, L1–L4 larvae, adult hermaphrodites and adult males (Kato et al., 2009; Stoeckius et al., 2009). After mapping the smRNA-seq reads to the D. melanogaster and C. elegans genomes and allowing no mismatches by seqmap (Jiang and Wong, 2008), we examined the genomic regions of pre-miRNA sequences and found that a miRNA arm usually produced various small RNA sequences instead of one mature miRNA sequence, as is found for let-7 (Figure S1 in Supplementary Material). For miRNA families whose members possess identical miRNA arm sequences, such as dme-281-1 and dme-281-2, their miRNA reads are multiply mapped, and it is difficult to distinguish their correct original pre-miRNAs (Figure S2 in Supplementary Material).
To give an overall picture of how many miRBase annotated miRNAs show discrepancies with actual sequencing data, we first calculated the proportion of smRNA-seq reads with different sizes that map to pre-miRNA sequences, categorized by the sizes of their mature miRNA sequences annotated in miRBase (Figure 1A). We next examined if the size of the most abundant miRNA isoform from a pre-miRNA was consistent with its miRBase size and found that 39.6% of miRNAs in the MC group and 35.6% in the LC group exhibit differences in D. melanogaster. In contrast, in C. elegans the discrepancy is only 0% in the MC group and 10.9% in the LC group. In terms of the 5′ nt, 71.1 and 67.5% of the predominant miRNA isoforms start with U in D. melanogaster and C. elegans, respectively (Figure 1B).
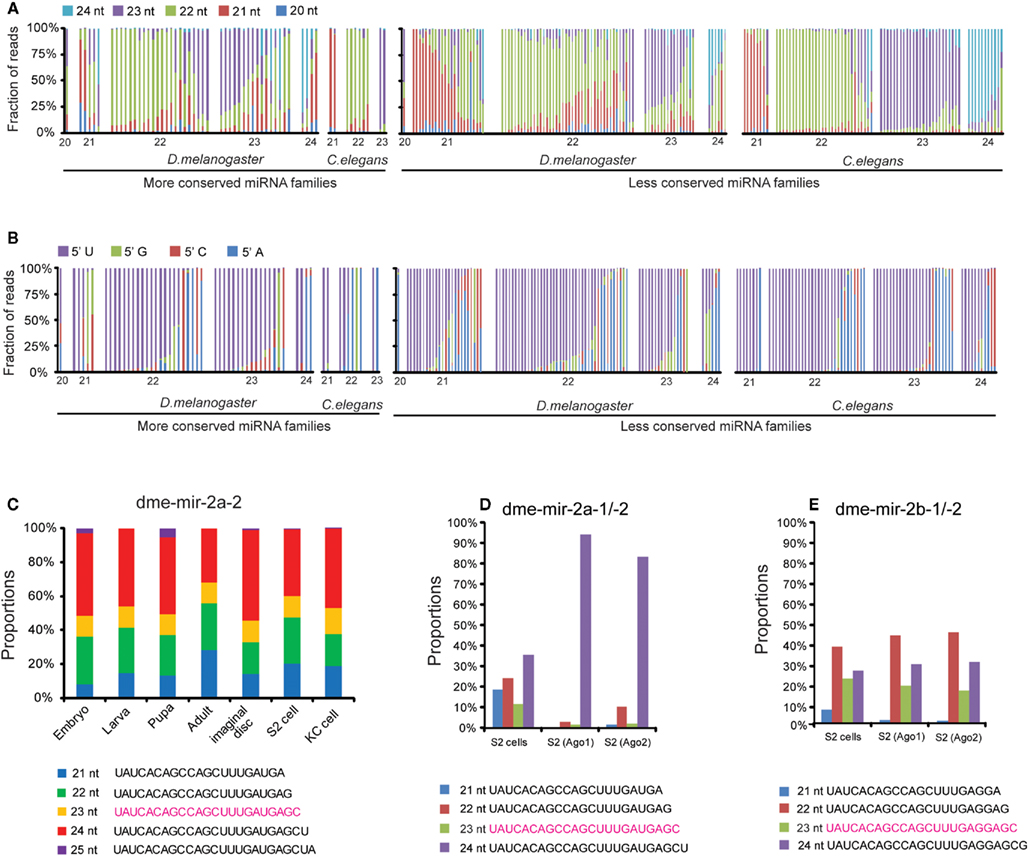
Figure 1. Discrepancies between miRBase annotation and the actual miRNA sequences obtained from smRNA-seq data. (A) Fractions of different sizes of smRNA-reads mapped on each pre-miRNA sequence. Each column represents one miRNA sorted by its size based on miRBase annotated mature miRNA sequence. (B) Fractions of different 5′ nucleotides of smRNA-reads mapped on each pre-miRNA sequence. (C) Proportions of five dme-mir-2a-2 miRNA isoform sequences were consistent in different developmental stages. (D) The 24-nt dme-mir-2a is the preferential isoform associated with Ago proteins. (E) The 22-nt dme-mir-2b is the preferential isoform associated with Ago proteins.
To exclude the possibility that the observed discrepancies and miRNA variants are caused by sequencing errors, we examined if those miRNA variants can be consistently detected in all samples. We found that these miRNA variants are not only abundant but also their proportions remain unchanged at different developmental stages. For instance, the top five isoforms of dme-mir-2a-2 exhibit relatively unchanged proportions, even though the absolute counts of the five sequences display differences of one or two orders of magnitude during Drosophila development (Figure 1C; Figure S3 in Supplementary Material). Additionally, after studying the abundances of 22-, 23-, and 24-nt isoforms of mir-2a and mir-2b in the 14 samples, we found that their miRBase annotated miRNA sequences (23-nt isoforms) were always the lowest at all developmental stages (Figure S4 in Supplementary Material). This suggests that none of these four miR-2 members was correctly annotated by miRBase, which prompted us to examine the Ago-associated miR-2 isoforms for support. As we expected, while roughly 90% of the reads inside Ago1 and Ago2 were the 24-nt isoform of dme-mir-2a, the most abundant isoform of mir-2b inside Ago proteins is 22-nt long (Figures 1D,E). Because such discrepancies are frequently observed between the miRBase annotation and actual miRNA reads, we realized the importance of systematically curating the miRBase miRNA sequences and identifying the authentic mature miRNA isoforms using the combined smRNA-seq datasets.
Using Combined smRNA-seq Data to Curate miRBase miRNA Sequences Coupled with Necessary Manual Inspection of Pre-miRNA Hairpin Structures
The most common analysis of sequencing-based miRNA expression profiles relies on miRBase annotation, which directly counts the smRNA-seq reads that match a reference miRNA sequence identically. Yet our analysis indicates that existing mistakes in miRBase might have biased previous miRNA expression analyses. An additional complexity is whether miRNA 3′ variants should be included in them iRNA expression since the 3′ variants possess the intact 5′ seed regions as well. We therefore sought first to curate the miRBase miRNA annotation using combined smRNA-seq data and then to rebuild the miRNA expression profile using revised miRNA sequences.
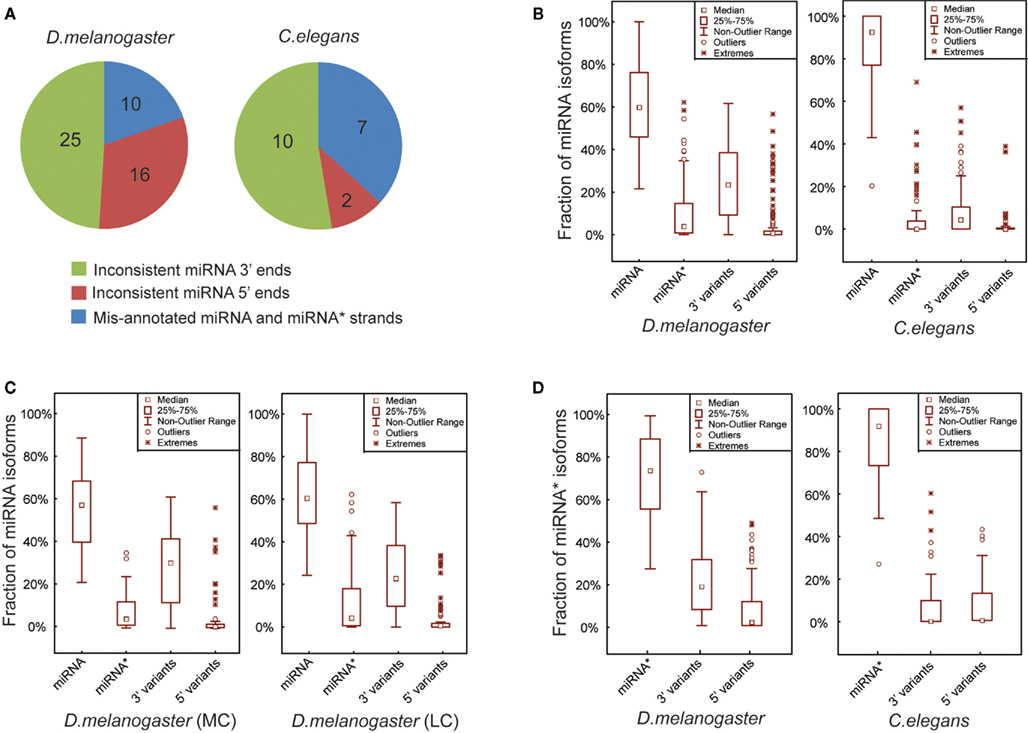
Figure 2. Mature miRNA sequences are more precisely defined in C. elegans than in D. melanogaster. (A) Three groups of the corrected miRNAs based on the types of mis-annotated 5′ ends, 3′ ends and the strands of miRNA and miRNA*. (B) Box plots of the percentages of exact miRNA reads, miRNA* reads, miRNA 3′ and 5′ variant reads mapped on the pre-miRNA sequences in D. melanogaster and C. elegans. (C) Percentages of miRNA, miRNA*, miRNA 3′ and 5′ variant reads in D. melanogaster MC and LC miRNAs. (D) Percentages of exact miRNA* reads, miRNA* 3′ and 5′ variant reads in D. melanogaster and C. elegans.
To increase the efficiency of analyzing the vast amount of integrated smRNA-seq data, we bypassed genome-wide mapping of all reads. We first generated all possible 15-mer to 30-mer short sequences from a given pre-miRNA sequence in miRBase and then searched for their reads from the combined smRNA-seq datasets. Simultaneously, the repetitive frequencies in those 15-mer to 30-mer sequences were indexed by mapping them to the reference genomes. The output of the search is a full report of all miRNA isoform sequences arising from each pre-miRNA hairpin, with the abundance of smRNA-seq reads and the number of mappable locations in the genome (exemplified in Figure S2 and Supplementary Material). Usually, the short sequence with the highest sum of reads is considered the authentic mature miRNA sequence, while subsidiary sequences with lower sums are defined as isoform variants. In cases where pre-miRNAs contain identical miRNA arms, further manual inspection of their hairpin structures was required. For example, two dme-miR-281 isoforms (5,689 reads and 1,630 reads) were mapped on both mir-281-1 and mir-281-2 pre-miRNAs, whose miRNA arms are identical but miRNA* arms are different (Figure S2 in Supplementary Material). By matching the two miR-281 isoforms with the two miR-281* sequences, we found that the isoform with 5,680 reads paired with the mir-281-1* sequence to form the correct miRNA/miRNA* duplex with a characteristic two-nucleotide overhang at its 3′ ends, while the isoform with 1,630 reads paired with the mir-281-2* sequence (Figure S5 in Supplementary Material). By such means we recognized that the mature sequences of dme-mir-281-1 and dme-mir-281-2 are actually not identical, as annotated in miRBase, but have a single nucleotide shift in their mature sequences. This single nucleotide variation at the 5′ ends may cause dme-mir-281-1 and dme-mir-281-2 to target different genes because of the difference in their seed sequences.
Mature miRNA Sequences are More Precisely Defined in C. elegans than in D. melanogaster
Overall our analytical pipeline, coupled with detailed manual inspection to curate miRBase sequences, led to the identification of 51 and 19 miRNAs showing discrepancies with actual miRNA sequences obtained using combined smRNA-seq data from D. melanogaster and C. elegans, respectively (based on miRBase Release 15.0 in April 2010). In D. melanogaster, the corrected miRNAs consist of 10 entries with inconsistent 5′ ends, 25 entries with inconsistent 3′ ends, and 16 entries with mis-annotated miRNA and miRNA* strands (Figure 2A; Table S2 in Supplementary Material). In C. elegans, among the 19 miRNAs in disagreement with miRBase, 2 contained inconsistent 5′ ends, 7 had mis-annotated miRNA and miRNA* strands, and the remaining 10 were inconsistent at their 3′ ends (Figure 2A; Table S2 in Supplementary Material). In fact, among the three types of corrected miRNAs, mis-annotations occurring at 5′ ends and swapped miRNA and miRNA* strands are likely real mistakes that arose during computational predictions form iRBase annotation. The third type of discrepancy, namely miRNA with mis-annotated 3′ ends, may partially result from intrinsic miRNA biogenesis mechanisms such as miRNA remodeling, which involves either “trimming” or “tailing” (removing or adding nucleotides at the 3′ ends)of mature miRNAs after their loading into Ago1 (Ameres et al., 2010).
It was recently reported for Drosophila that the 5′ ends of both miRNA and miRNA* sequences are more precisely defined than their 3′ ends (Seitz et al., 2008). To investigate whether the miRNA isoforms result from inaccurate Dicer processing or downstream miRNA remodeling, we compared the proportions of smRNA-seq reads for miRNAs, miRNA* and their corresponding 5′ and 3′ variants in D. melanogaster and C. elegans. In D. melanogaster, pre-miRNA hairpins on average produced 61% accurate miRNAs, 9.5% miRNA*s, 25% 3′ variants, and 4.5% 5′ variants (Figure 2B). In contrast, C. elegans pre-miRNA hairpins produce more accurate miRNAs, which on average are 86.2% miRNAs, 4.8% miRNA*s, 7.8% 3′ variants, and 1.2% 5′ variants (Figure 2B). We also compared the proportions of those miRNA isoforms between MC and LC pre-miRNAs in D. melanogaster, but did not find any significant differences (Figure 2C). Additionally, we examined if the 5′ ends of miRNA*s were better determined than their 3′ ends and found that, while on average 71.3% of reads were accurate miRNA* sequences, 20.7 and 8% were 3′ variants and 5′ variants of miRNA*s, respectively (Figure 2D). In C. elegans, the miRNA* sequences were well defined with a very small proportion of either 3′ or 5′ variants (Figure 2D).
It is noteworthy that mature miRNA sequences are more precisely defined in C. elegans than in D. melanogaster, perhaps due to differences in their miRNA biogenesis pathways. However, because both miRNA and miRNA* strands are more precisely defined at 5′ than at 3′ ends, it is not conclusively evident that production of miRNA 3′ variants is the result of better recognition by Dicer at 5′ than at 3′ ends. Nevertheless, the abundant 3′ variants are more likely produced after release of miRNA/miRNA* duplexes from pre-miRNA hairpins. Therefore, a more reasonable hypothesis is that the excision accuracy of Dicer has no preference for either 5′ or 3′ ends, but the better defined miRNA 5′ ends are likely attributable to downstream pathways. First, the identity of the 5′ nucleotide (usually 5′ U) facilitates loading of miRNAs with accurate 5′ ends into Ago1 (Mi et al., 2008; Zhou et al., 2008; Czech et al., 2009), or alternatively, after the miRNA/miRNA* duplexes disassociate within Ago1, trimming or tailing of mature miRNA 3′ ends contributes to production of miRNA 3′ variants (Ameres et al., 2010).
Drosophila miR-2 Family Members Contain Different 5′ End Seed Regions
Among the corrected miRNAs, we found that conserved miRNA families containing multiple members have higher rates of mis-annotation because the homologous members were usually identified by sequence alignment. For example, miR-2 is the largest miRNA family in D. melanogaster with eight members (Table S3 in Supplementary Material) and is involved in apoptosis regulation during embryogenesis (Leaman et al., 2005). However, our analysis showed that none of the eight members was correctly annotated in miRBase. For the pre-miRNA sequences of dme-mir-2a-1 and dme-mir-2a-2, two dominant isoforms of 22- and 24-nt (117,209 reads and 114,924 reads, respectively) were both mapped on their identical miRNA arms, while the reads mapped on miRNA* arms are different (Figure 3A). Manual inspection of the two hairpins revealed that the 22-nt isoform and mir-2a-1* can properly form a duplex with a 2-nt overhang, while the 24-nt isoform should pair with mir-2a-2* (Figure 3B). We therefore recognized that the authentic mature miRNAs for dme-mir-2a-1 and dme-mir-2a-2 are the 24- and the 22-nt isoforms, respectively, instead of the identical 23-nt isoforms annotated in miRBase (Table S2 in Supplementary Material). Our analysis confirmed a similar conclusion regarding the authentic mature sequences of dme-mir-2a-1 and dme-mir-2a-2 using a similar method (Liu et al., 2008).
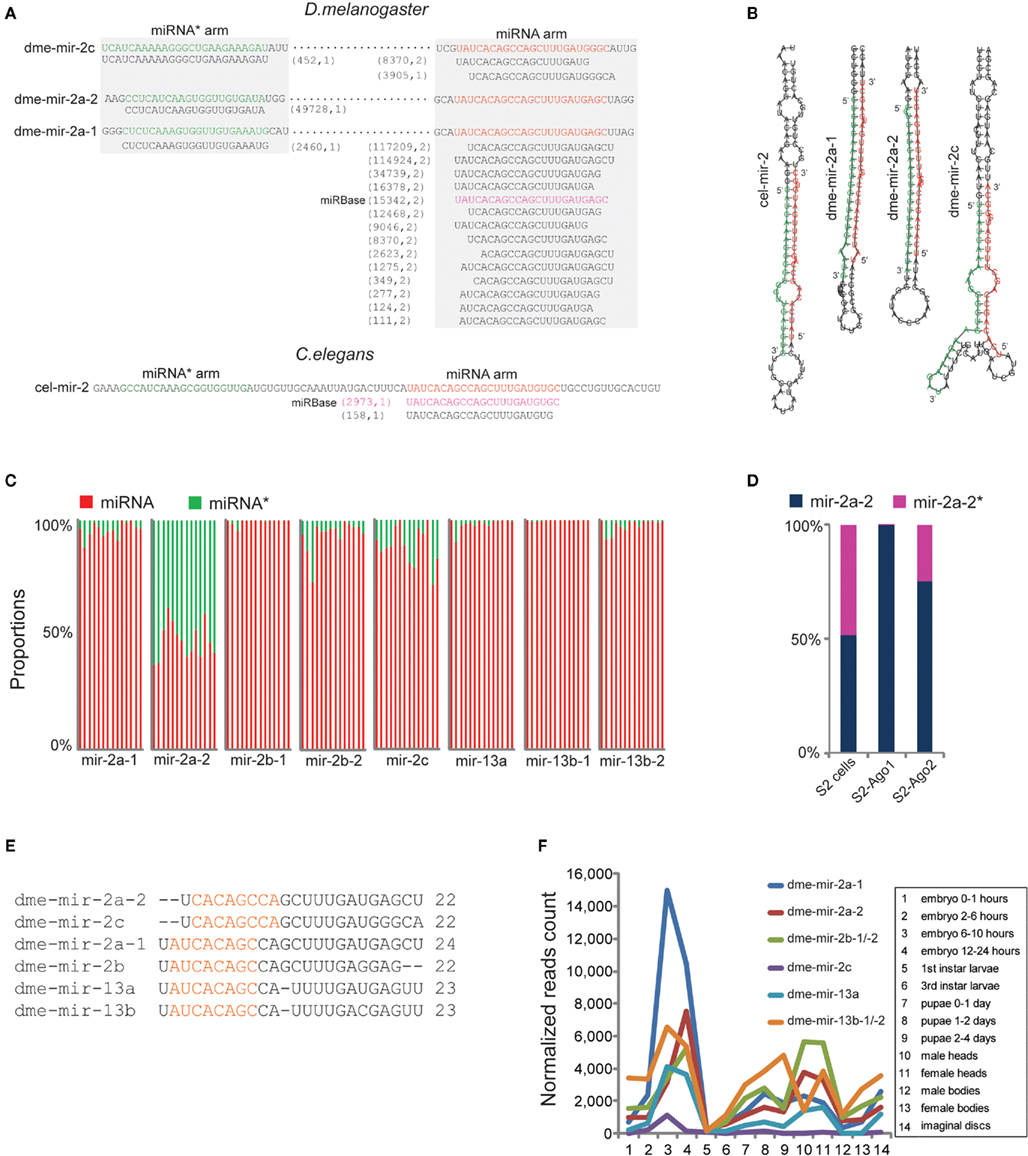
Figure 3. Correction of dme-miR-2 family needs manual inspection of their miRNA/miRNA* duplexes. (A) The dme-mir-2a-1, dme-mir-2a-2, and dme-mir-c possess identical miRNA arms, on which the smRNA-seq reads were multiply mapped. The two numbers in the brackets are the count of smRNA-seq reads and the count of mapped locations in the genome for each isoform. (B) For the hairpin structures, we found that the 24-nt mir-2a isoform paired with mir-2a-1*, the 22-nt mir-2a isoform paired with mir-2a-2*, and 22-nt mir-2c isoform paired with mir-2c* to form the correct miRNA/miRNA* duplexes with 2-nt overhang at 3′ ends. (C) The proportions of the corrected miRNA and miRNA* strands for each miR-2 member across 14 samples. Each column represents one sample. The mir-2a-2 is the only exception that have equal amount of miRNA and miRNA* strands across all the samples. (D) Even mir-2a-2 and mir-2a-2* both existed in S2 cells, only the guide strands were associated with Ago proteins. (E) The alignment of corrected miR-2 family members. (F) The rebuilt developmental expression profile of D. melanogaster miR-2 family using the corrected miR-2 family sequences.
Identification of the authentic dme-mir-2c sequence also required manual inspection. While the most abundant sequence (8,370 reads) for mir-2c pre-miRNAs was a 20-nt sequence, the second most abundant was a 22-nt sequence (3,905 reads). Yet, if we pair mir-2c* (452 reads) with the two sequences to form a correct duplex, the 22-nt sequence turns out to be the correct mir-2c sequence, while the 20-nt sequence is actually a 3′ variant of mir-2a-1 (Figures 3A,B). For the second pair of miR-2 members sharing identical miRNA arms, namely dme-mir-2b-1 and dme-mir-2b-2, manual inspection showed that they indeed have the same mature sequence but are one nucleotide longer than the miRBase annotated dme-mir-2b sequences (Figure S6 in Supplementary Material). The third pair of miR-2 members, dme-mir-13b-1 and dme-mir-13b-2 that have two abundant isoforms (22-nt with 69,880 reads and 23-nt with 85,868 reads) both mapped to identical miRNA arms. However, only the 22-nt isoform can correctly form a duplex with mir-13b* (Figure S7 in Supplementary Material). We hypothesized that the 22-nt sequence might be the original miR-13b/miR-13b* duplex, while the 23-nt isoform with an extra U might be a product of miRNA tailing, possibly caused by miRNA 3′ end uridylation (Ramachandran and Chen, 2008; Seitz et al., 2008; Ibrahim et al., 2010). Finally, we found that the miRNA* strand of dme-mir-2a-2 exists in relatively equal amounts with the mir-2a-2 miRNA strand across all developmental stages, which is the only exception among miR-2 family members (Figure 3C). To determine if dme-mir-2a-2* is functional, we examined its association with AGOs. Surprisingly, although both miRNA and miRNA* are equally retained in S2 cells, very few mir-2a-2* were associated with Ago1, but a small fraction with Ago2 (Figure 3D).
Thus, the sequence alignment of the revised D. melanogaster miR-2 family members shows that mir-2a-2 and mir-2c share the same 7-mer “seed region,” while the remaining miR-2 members share a different seed sequence (Figure 3E). Based on the corrected miRNA sequences, we rebuilt the D. melanogaster miR-2 family expression profile and found that dme-mir-2a-1 is most abundant during embryonic development when compared to other members (Figure 3F). Then, we predicted the targets of mir-2a-1 and mir-2a-2 using PITA (Kertesz et al., 2007).The prediction showed that not only mir-2a-1 and mir-2a-2 have different top target genes with strong 5′ end pairing, but also mir-2a-2* has a target predicted with strong 17-mer complementarity at its 5′ ends (Figure S8 in Supplementary Material), indicating that mir-2a-2* associated with Ago2 may have a regulatory function in a similar fashion to siRNAs (Iwasaki et al., 2009).
Analysis of the miR-6 Family Indicates that Conserved Strands are Not Necessarily Functional Guide Strands
In general, definition of miRNA and miRNA* strands is based on their relative abundances because miRNA strands are retained in Ago1 but miRNA* strands are usually degraded. In our analysis, we found that another type of error in miRBase is mis-annotated miRNA and miRNA* strands. D. melanogaster miR-6 is a miRNA family specifically conserved in Hexapoda that has three members annotated with identical mature sequences in miRBase. However, our analysis showed very few smRNA-seq reads arising from miRBase annotated miRNA arms, but abundant reads produced from the opposite miRNA* arm (Figure 4A). Because the MC strands are usually assumed to be guide strands, while the LC are passenger strands, we suspected that the miRNA and miRNA* strands of miR-6 were mis-annotated (Figure 4B). Our analysis revealed that the authentic mir-6-1, mir-6-2, and mir-6-3 miRNA sequences are actually derived from the LC arms of miR-6 hairpins, which contained 5′ seed sequences differing at the seventh and eighth nucleotide (Figure 4A). The rebuilt expression profile based on the corrected miR-6 sequences shows that the D. melanogaster miR-6 family is specifically expressed in early embryos, but the levels of dme-mir-6-3 are significantly elevated at 2–6 h (Figure 4C).
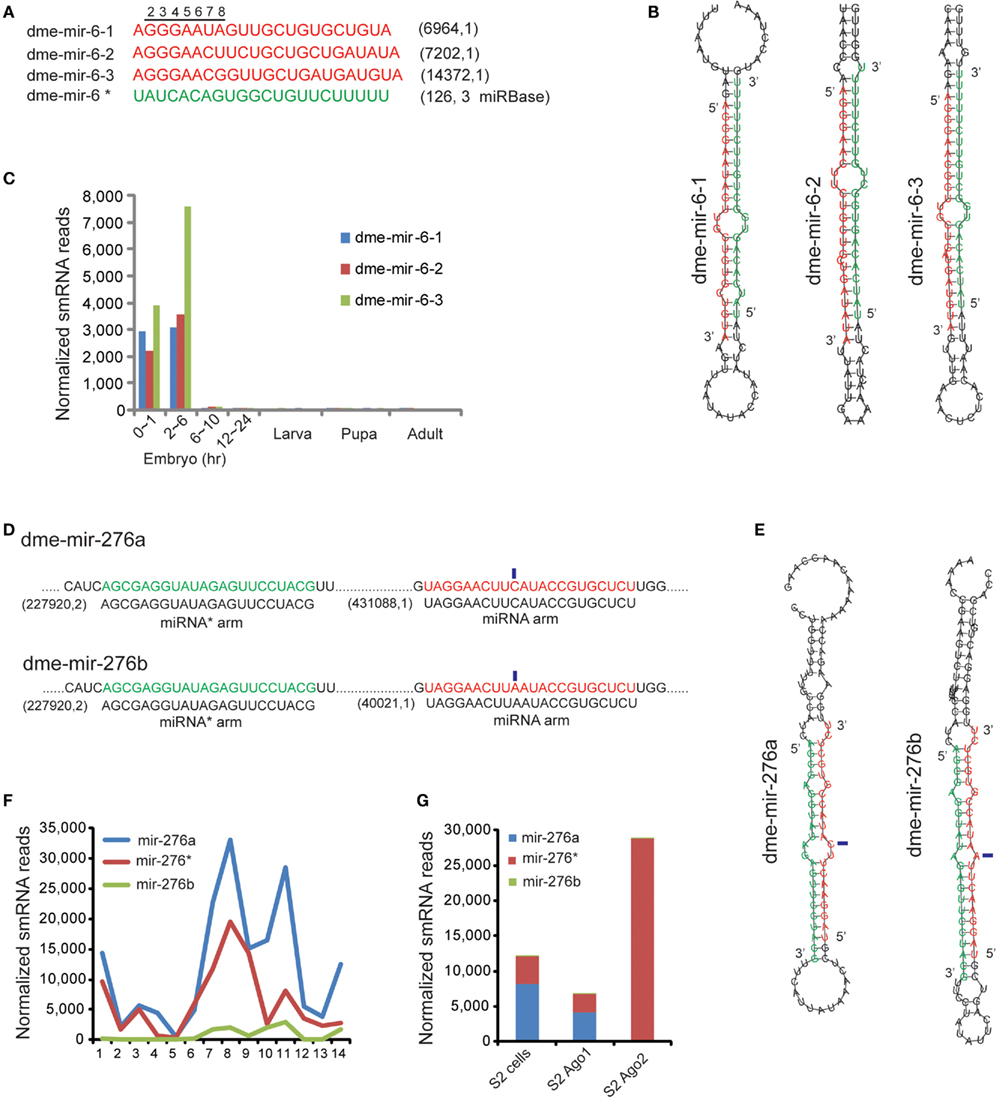
Figure 4. Correction of miR-6 family demonstrates the mis-annotated miRNA and miRNA* strands. (A) The corrected D. melanogaster miR-6 family sequences (red). The miRBase annotated miR-6 mature sequence is actually the miRNA* sequence (green).The corrected miR-6 members have distinct 5′ seed sequences differing at seventh and eighth nucleotides. (B) The hairpin structures of the three members of dme-miR-6 family show the miRNA* strands are conserved. (C) The expression profile rebuilt based on corrected mature sequences of miR-6 family. (D) The dme-mir-276a and 276b contain identical miRNA* arms but different miRNA arms with one nucleotide variation (marked by blue rectangles). (E) Hairpin structures of dme-mir-276a and 276b with highlighted miRNA* arm and miRNA arm. (F) Expression abundance of dme-mir-276a, mir-276b, and their passenger strand mir-276* in Drosophila development. (G) Mir-276* are preferentially associated with Ago2, while higher proportion of mir-276a was found in Ago1.
Since the dme-miR-6 family is not expressed in S2 cells, we were unable to examine its preferential association with Ago proteins. Alternatively, we tested whether the revised miR-6 sequences have any potential to target genes. The target genes of dme-miR-6-1/-2/-3 were predicted by PITA, and the top sites for each miR-6 member were demonstrated. First, mir-6-1 and mir-6-2 share the same top target gene (fab1), but localize to different sites of its 3′ UTR (Figure S9 in Supplementary Material). The target site for mir-6-2 in fab1 exhibits a canonical pattern of miRNA interaction with its binding site (Figure S9 in Supplementary Material).
Another case showing abundant miRNA* reads is D. melanogaster miR-276a and miR-276b, whose miRNA strands have a single nucleotide variation but whose miRNA* strands are identical (denoted as miR-276*). While the abundances of mir-276a and mir-276b are significantly different (431,088 reads vs. 40,021 reads), the highly abundant miR-276*s (227,920 reads) were the same for the two pre-miRNAs (Figure 4D). Additionally, because the variation between miR-276a and miR-276b occurs in the center, both can pair with miR276* to form correct duplexes with 2-nt overhangs (Figure 4E). However, examining the proportion of mir-276a, mir-276b, and mir-276* revealed a dramatic change during pupal and adult stages, which differs from the miR-2 family for which the proportion of miRNA and miRNA* usually remains unchanged (Figure 4F). More interestingly, we found that the mir-276a reads were preferentially associated with Ago1, but the mir-276* reads were only found with Ago2 (Figure 4G). Therefore, a bold hypothesis is that for the mir-276a hairpin, mir-276a and miR-276* are the respective guide and passenger strands, while for the mir-276b hairpin the roles of the two strands are likely reversed.
Examination of miR-34 Indicates that Production of miRNA 3′ Variants is Not Necessarily Caused by Terminal Mismatches of miRNA Duplexes
Since miRNA 3′ variants were more frequently observed than 5′ variants, we then focused on explaining the cause of the 3′ variants. An individual miR-34 family member in D. melanogaster and C. elegans, whose pre-miRNA hairpin produced numerous 3′ variants, was carefully dissected (Figure 5A). For dme-mir-34 pre-miRNA, the top two isoforms were the 21-nt (350,667 reads) and 22-nt (148,900 reads) sequences, while the third (24-nt; 102,882 reads) is the miRBase annotated miR-34 sequence. In fact, among these three most abundant isoforms, only the 24-nt miR-34 can form the correct duplex with highest abundant miR-34*(79,572 reads). Additionally, when we examined miR-34 in other animal species, D. melanogaster miR-34 is the only exception whose length is 24-nt (Figure S10 in Supplementary Material). At first, assuming that the 3′ variants are products of inaccurate Dicer processing, we wondered if the hairpin structure, especially the terminal mismatches at the miR-34/miR-34* duplex, influences the accuracy of cutting by Dicer. We then compared the hairpins for dme-mir-34 and cel-mir-34. In D. melanogaster, a large bubble was indeed found at the 3′ end of the miRNA arm, but only the 25th nucleotide extended into the bubble, while in the C. elegans miR-34 hairpin the 3′ end of the miRNA arm is two nucleotides away from the bubble (Figure 5B). Thus, we can hardly conclude that terminal mismatches of miRNA duplexes cause inaccurate recognition by Dicer at 3′ ends.
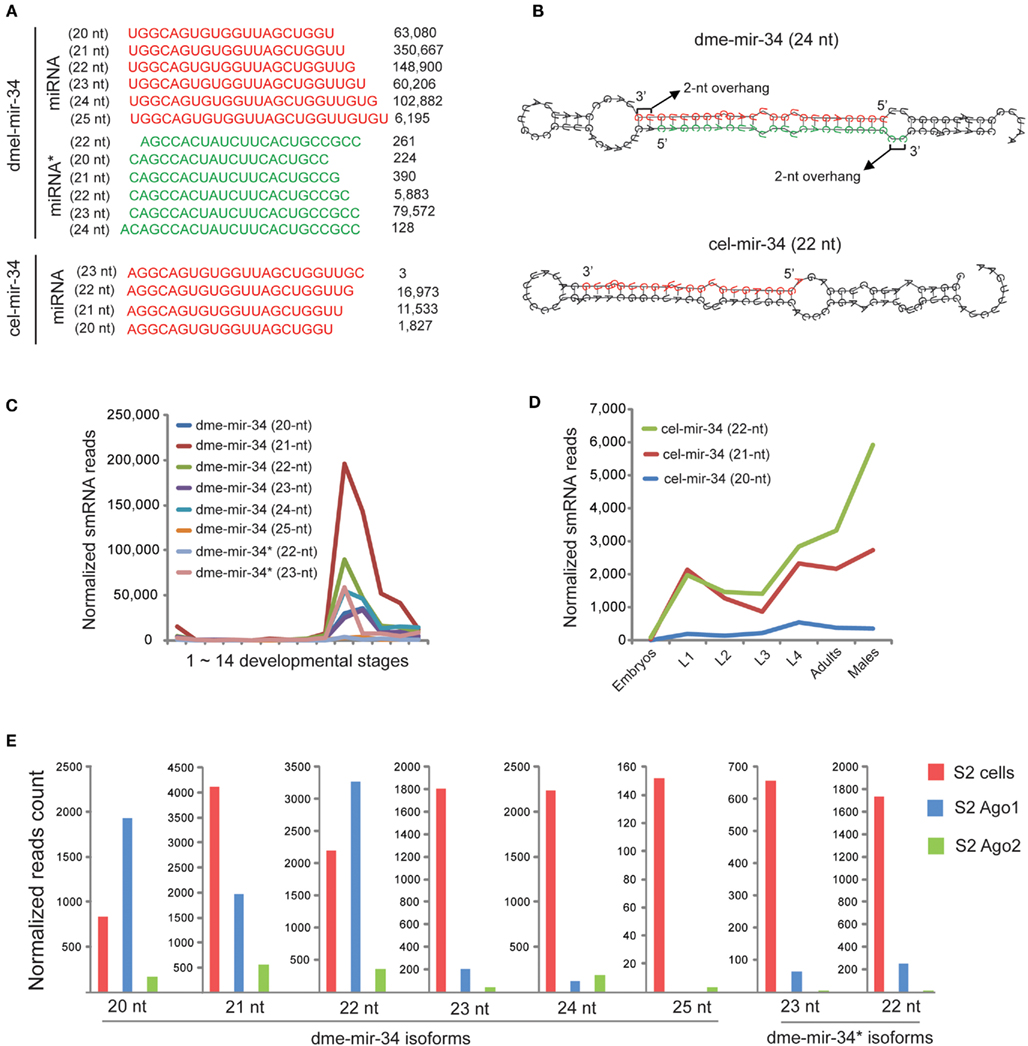
Figure 5. The 24-nt dme-miR-34 isoform is probably remodeled to shorter isoforms after its loading to Ago1. (A) The miR-34 pre-miRNA produces huge amount of miR-34 isoforms in D. melanogaster, and the 24-nt isoform is the miRBase annotated mature sequence. (B) The hairpin structure of dme-mir-34 shows that only the 24-nt isoform can form the correct duplex with miR-34*. (C) The miR-34 isoforms co-express during D. melanogaster development, but the 21-nt isoform is the highest one. (D) The expression patterns of two miR-34 isoforms in C. elegans are not significantly different. (E) Only 20- to 22-nt dme-mir-34 isoforms are associated with Ago proteins.
We subsequently examined if miR-34 and its 3′ variants are co-expressed or expressed at different developmental stages. In D. melanogaster, all mir-34 isoforms are co-expressed at adult stages, but the 21-nt isoform of dme-mir-34 is always the most abundant (Figure 5C). In C. elegans, the 21- and 22-nt mir-34 isoforms are expressed at equivalent levels from embryonic to adult stages, but the 22-nt isoform is significantly more abundant than its 3′ variant in adult males (Figure 5D). Furthermore, examining the association of various dme-mir-34 isoforms with Ago proteins showed that the shorter isoforms of 20- to 22-nt were enriched with Ago1, while the longer isoforms as well as mir-34* were not found with any Ago proteins even though they are all abundant in S2 cells (Figure 5E). In fact, our observation of the dominant 21-nt miR-34 isoform might be explained by a recent hypothesis that the 24-nt miR-34/miR-34* duplex is originally produced by Dicer, but after loading into Ago1, three nucleotides are trimmed from the 3′ end of the 24-nt miR-34 (Ameres et al., 2010).
Analysis of miRNAs Containing Non-templated Nucleotide Extension
Another class of miRNA variants found in the smRNA-seq reads that are unable to be perfectly mapped in the genome are miRNAs containing non-templated nucleotides. In plants, the extended non-templated nucleotides are usually one or two Us occurring at miRNA 3′ ends, which is thought to be the result of uridylation that subsequently triggers degradation of dysfunctional miRNAs (Ramachandran and Chen, 2008; Ibrahim et al., 2010). In animals, uridylation of pre-miRNAs and mature miRNAs is reported to be a pathway for attenuating post-transcriptional repression (Heo et al., 2008; Jones et al., 2009). High-throughput smRNA-seq analysis also discovered the universal existence of miRNAs with non-templated nucleotides in C. elegans and D. melanogaster (Ruby et al., 2006; Seitz et al., 2008).
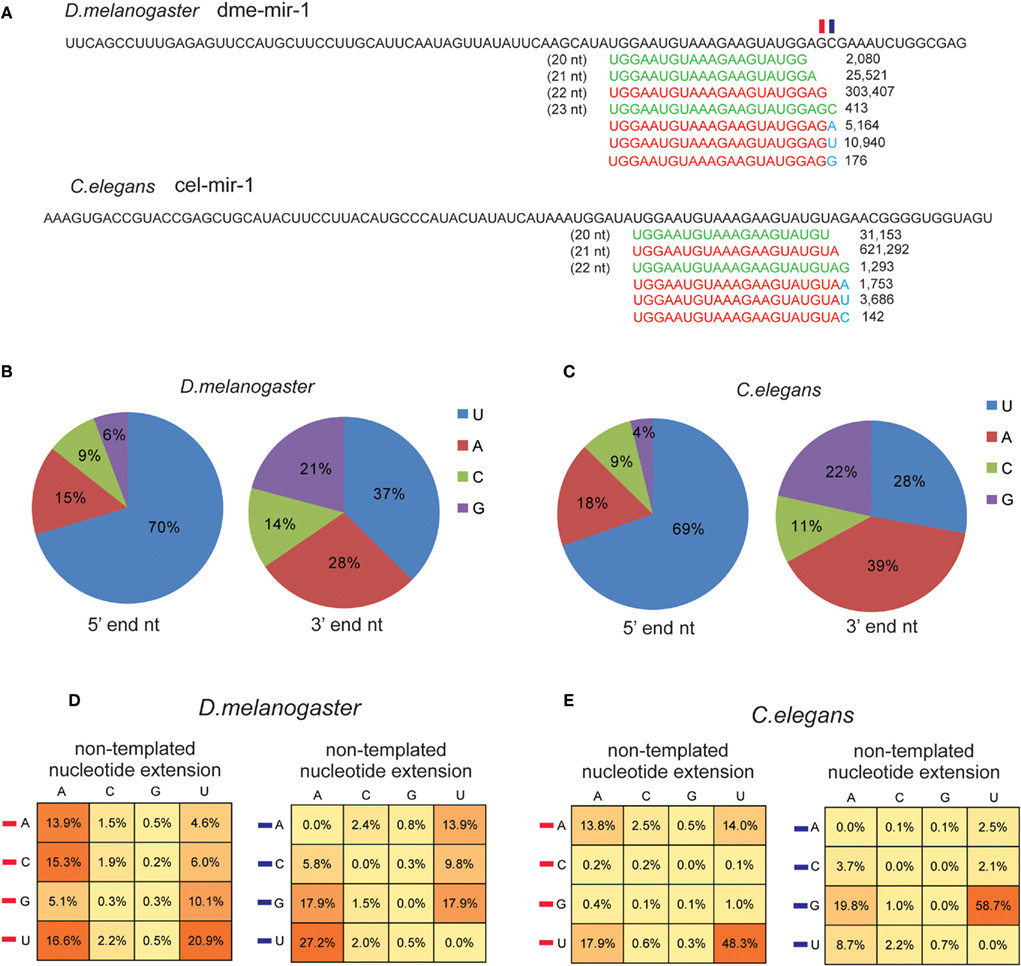
Figure 6. U and A are the preferential non-templated nucleotides added to mature miRNAs. (A) Both D. melanogaster and C. elegans miR-1 miRNAs contain non-templated nucleotide (marked in blue) extension at 3′ end. The frequency of the four types of 5′ and 3′ nucleotides based on corrected authentic miRNA sequences in D. melanogaster(B) and C. elegans (C). Frequency of the extended non-templated nucleotide based on the type of the last nucleotide (denoted by a red rectangle in miR-1 example) and the following nucleotide (denoted by a blue rectangle in miR-1 example) in D. melanogaster (D) and in C. elegans (E).
Inspired by those findings, we recycled the unmapped reads to identify miRNAs containing non-templated 3′ end nucleotides, such as miR-1 in D. melanogaster and C. elegans (Figure 6A). The non-templated nucleotide was not seemingly caused by sequencing mistakes because the smRNA-seq reads for miR-1 with an additional U (10,940 reads) or A (5,164 reads) were significantly more abundant than those with an additional G (176 reads) or a longer dme-mir-1 variant with 3′ C (413 reads; Figure 6A). We were then interested in examining if the last and following nucleotide of mature miRNAs influence the preferential type of the extended non-templated nucleotide. We first checked the distribution of miRNA 5′ and 3′ end nucleotides based on our corrected mature miRNA sequences. The frequencies of the four nucleotides at 5′ and 3′ ends are very similar between D. melanogaster and C. elegans; 70% of the miRNAs begin with a U at their 5′ end and on average 66% begin with either U or A at their 3′ end (Figures 6B,C).
We then examined the correlation between the last nucleotide type and the non-templated nucleotides. In D. melanogaster, there is no significant difference in terms of adding a non-templated A when the last nucleotide is any of the four nucleotides, but when the last nucleotide is U, a higher chance of adding U was observed (Figure 6D). We then examined if the following nucleotide at the 3′ end might influence the type of added, non-templated nucleotide because the extended identical nucleotide might not be distinguishable if it has the same sequence as the miRNA variants. Our analysis showed that if the following nucleotide is U, it has a higher chance to add an A, while if it is G the chance of adding a U is higher than adding an A (Figure 6D). In C. elegans, a similar analysis showed that U is always the dominant nucleotide to be added to miRNA 3′ ends, and the secondary preference is A (Figure 6E). Overall, C. elegans miRNAs have a higher trend toward adding non-templated U (64%) than A (32%), while in D. melanogaster the rate of non-templated A (51%) is slightly higher than U (42%; Figure S11 in Supplementary Material).
More Conserved miRNAs Tend to be Co-Expressed at Multiple Developmental Stages in D. melanogaster in Contrast to Less Conserved miRNAs
Our previous analysis shows that MC and LC miRNAs have no significant differences in terms of precision at the 5′ and 3′ ends of miRNA processing. We then wondered if any difference might exist in their expression patterns using the corrected miRNA sequences. Because it has been reported that MC miRNAs are usually expressed at higher abundance in plants, but LC miRNAs are usually transiently expressed (Fahlgren et al., 2010; Ma et al., 2010), we first examined the absolute expression levels of MC and LC miRNAs at mixed embryonic stages of D. melanogaster and C. elegans. We found that all MC miRNAs were expressed at least at minimum levels during embryonic stages, while many LC miRNAs were not detectable, even though the absolute expression levels are not significantly different between MC and LC miRNAs (Figure 7A). We next examined if MC and LC miRNAs are differentially expressed during D. melanogaster development. We first calculated cumulative percentages of MC and LC miRNAs with at least 100 reads (minimum expression level) in several developmental samples. Interestingly, we found nearly 80% of MC miRNAs are co-expressed during at least 11 developmental stages, while the same proportion of LC miRNAs are co-expressed during at least four developmental stages (Figure 7B). The heat maps of miRNA absolute expression levels and the binary expression statuses also illustrated the trend that MC miRNAs are prone to be co-expressed at most developmental stages but LC miRNAs tend to be specifically expressed at certain stages (Figures 7C,D). In C. elegans, for which 10 of 11 MC miRNAs showed obvious co-expression at multiple developmental stages, we did not observe significant developmentally specific expression patterns among LC miRNAs (Figure S12 in Supplementary Material).
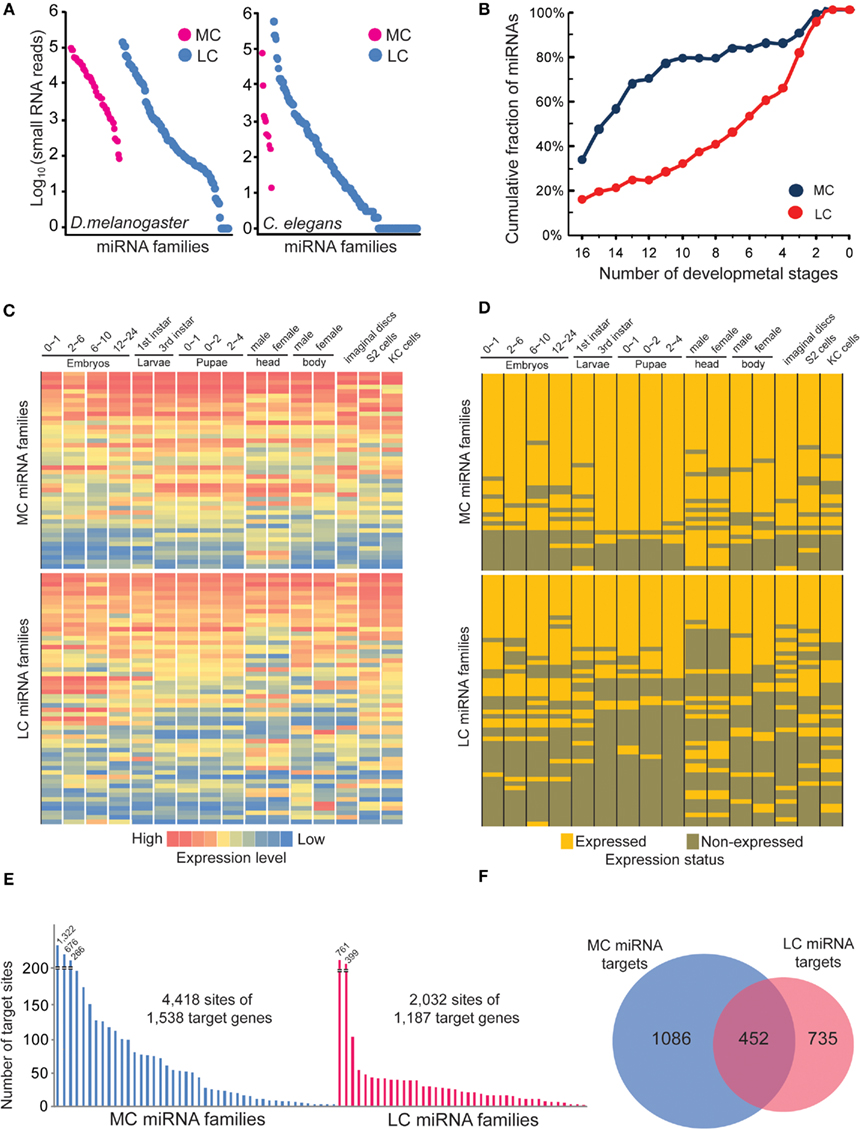
Figure 7. The more conserved miRNAs tend to co-express in multiple developmental stages. (A) Absolute expression abundance of MC and LC miRNA families in D. melanogaster and C. elegans mixed embryo samples. Each spot is a miRNA. (B) The cumulative fraction of D. melanogaster MC and LC miRNA families in the number of developmental stages. (C) The heat map of D. melanogaster MC and LC miRNA families across different developmental stages. The absolute miRNA expression abundances were normalized. (D) The binary expression status of D. melanogaster MC and LC miRNA families across different developmental stages. (E) The MC miRNAs in D. melanogaster have more predicted target sites than LC miRNAs. In this analysis, we selected the top 30 MC and top 30 LC miRNAs whose abundances are over 1,000 smRNA-seq reads. (F) Only 20% of the total targets of MC and LC miRNAs are overlapped.
Finally, we compared genes targeted by D. melanogaster MC and LC miRNAs with a stringent cutoff (−20 kJ/mol) for the interaction energy between miRNAs and target sites as predicted by PITA (Kertesz et al., 2007). Interestingly, we found that MC miRNA families target more genes than LC miRNAs, and MC miRNA targets contain 2.9 sites on average, while LC miRNA targets contain 1.7 sites on average (Figure 7E). Furthermore, only 20% of genes are commonly targeted by MC and LC miRNAs (Figure 7F). Our analysis indicates that expression of the more ancient, conserved miRNAs spans most developmental stages to establish tissue identity, while evolutionarily young miRNAs are usually expressed transiently and target fewer genes (Christodoulou et al., 2010; Fahlgren et al., 2010; Ma et al., 2010).
Materials and Methods
Small RNA Sequencing Datasets
A full list of the D. melanogaster and C. elegans smRNA-seq datasets produced by the modENCODE project with GEO accession is provided in Table S1 in Supplementary Material. The adaptor-trimmed smRNA-seq reads were assigned unique IDs and numbers being sequenced. Each dataset for a sample was converted into the FASTA format and is accessible from our website at http://liulab.dfci.harvard.edu/miRNA.
The Analytical Pipeline to Identify Authentic miRNA Mature Sequences
The D. melanogaster and C. elegans miRNA hairpin sequences were downloaded from http://miRBase.org. Because analysis of miRNAs requires perfect matches to the reference genome, we therefore adopted an alternative way to increase speed and efficiency. First, for each hairpin sequence we generated all possible 15- to 30-nt short sequences and mapped them to the D. melanogaster and C. elegans reference genome sequences by bowtie (Langmead et al., 2009) to index their genome-wide repeat frequency. We then searched the 15- to 30-nt short sequences generated against the smRNA-seq FASTA files and calculated the sum of the smRNA-reads counted from all samples. Hence, for each pre-miRNA sequence, we output a full report of the miRBase annotated miRNA and miRNA* sequences, the actual miRNA sequence and the corresponding variant isoform sequences derived from the miRNA and miRNA* arms. The isoform with the highest sum of smRNA-seq reads was considered the authentic mature miRNA sequence, while subsidiary isoforms were considered 5′ or 3′ end variants. The smRNA-seq reads located opposite the identified miRNA arm were considered miRNA*s.
Curation of the miRBase Annotation and Rebuilding the miRNA Expression Profile
As illustrated by the analysis of the miR-2 and miR-6 families, the sum of the smRNA-seq read counts is not sufficient for identifying correct miRNA sequences. After excluding any potential influence from the index of repeat frequency, we utilized RNA fold to predict hairpin structures of ambiguous miRNA precursors and then matched miRNA and miRNA* sequences with smRNA-seq reads of highest abundance to identify the duplex with a 2-nt overhang. Based on the structural information for the correct miRNA/miRNA* duplex, we finally determined the correct form of the mature miRNA sequences.
Based on the corrected miRNA sequences, we rebuilt the miRNA expression profiles during D. melanogaster and C. elegans development after normalizing the absolute smRNA-seq read counts to 4 million for each sample. Due to the latest update of miRBase in April 2010, we applied our pipeline to the 15th release of miRBase and the corresponding results are accessible from our website at http://liulab.dfci.harvard.edu/miRNA.
Discussion
As part of the Analysis Working Group (AWG) of the modENCODE consortium, we integrated and reanalyzed the smRNA-seq data for D. melanogaster and C. elegans. Using the combined smRNA-seq dataset, we systematically curated the miRBase miRNA annotation and rebuilt unbiased miRNA expression profiles for D. melanogaster and C. elegans. We provide two sets of miRNA expression profiles calculated in two ways: first, the expression level for each miRNA is the smRNA-seq read abundance for the corrected mature sequence itself; second, the expression level is the sum of both the mature sequence and its 3′ variants derived from the corrected miRNA arm. Abundances were normalized to the standard sequencing productivity of 4 million reads per sample. The corrected miRNA sequences and recalculated expression abundances are available for download from our website at http://liulab.dfci.harvard.edu/miRNA.
Through our efforts to curate miRNA annotation in C. elegans and D. melanogaster, the importance of global verification for miRBase annotation in all organisms using smRNA-seq data is highlighted for the miRNA community. Because curation of miRNA sequences require both computational analysis of large smRNA-seq datasets and manual inspection of pre-miRNA hairpin structures, it is necessary to develop a more automatic and efficient platform to minimize human efforts. The platform should integrate the smRNA-seq analysis pipeline, RNA structure visualization and miRNA target prediction tools and will be implemented as a flexible interface so that users may customize their own analysis for different species and submit feedback to miRBase in real-time if mis-annotated miRNAs are found. In addition, the complexity of miRNA biogenesis and metabolism pathways necessitated incorporation of smRNA-seq information with miRBase miRNA sequence annotation to satisfy the broader research interests in the miRNA community.
Conflict of Interest Statement
The authors declare that the research was conducted in the absence of any commercial or financial relationships that could be construed as a potential conflict of interest.
Acknowledgments
We thank Dr. Frank Slack and Dr. Masaomi Katoat, Yale University for providing access to the processed small RNA sequencing data in C. elegans. We thank the members in the laboratories of Weng and Zamore at UMASS Medical School for helpful discussion and suggestion. Dr. Xiangfeng Wang is a research fellow supported by Sloan Research Fellowship. This work is supported by the modENCODE grant U01-HG004270 and RC2-HG005639.
Supplementary Material
The Supplementary Material for this article can be found online at http://www.frontiersin.org/Genomic_Assay_Technology/10.3389/fgene.2011.00025/abstract
References
Ahmed, F., Ansari, H., and Raghava, G. (2009). Prediction of guide strand of microRNAs from its sequence and secondary structure. BMC Bioinformatics 10, 105. doi: 10.1186/1471-2105-10-105
Ameres, S. L., Horwich, M. D., Hung, J. H., Xu, J., Ghildiyal, M., Weng, Z., and Zamore, P. D. (2010). Target RNA-directed trimming and tailing of small silencing RNAs. Science 328, 1534–1539.
Carthew, R. W., and Sontheimer, E. J. (2009). Origins and mechanisms of miRNAs and siRNAs. Cell 136, 642–655.
Christodoulou, F., Raible, F., Tomer, R., Simakov, O., Trachana, K., Klaus, S., Snyman, H., Hannon, G. J., Bork, P., and Arendt, D. (2010). Ancient animal microRNAs and the evolution of tissue identity. Nature 463, 1084–1088.
Chung, W. J., Okamura, K., Martin, R., and Lai, E. C. (2008). Endogenous RNA interference provides a somatic defense against Drosophila transposons. Curr. Biol. 18, 795–802.
Czech, B., Malone, C. D., Zhou, R., Stark, A., Schlingeheyde, C., Dus, M., Perrimon, N., Kellis, M., Wohlschlegel, J. A., Sachidanandam, R., Hannon, G. J., and Brennecke, J. (2008). An endogenous small interfering RNA pathway in Drosophila. Nature 453, 798–802.
Czech, B., Zhou, R., Erlich, Y., Brennecke, J., Binari, R., Villalta, C., Gordon, A., Perrimon, N., and Hannon, G. J. (2009). Hierarchical rules for Argonaute loading in Drosophila. Mol. Cell 36, 445–456.
Fahlgren, N., Jogdeo, S., Kasschau, K. D., Sullivan, C. M., Chapman, E. J., Laubinger, S., Smith, L. M., Dasenko, M., Givan, S. A., Weigel, D., and Carrington, J. C. (2010). MicroRNA gene evolution in Arabidopsis lyrata and Arabidopsis thaliana. Plant Cell 22, 1074–1089.
Griffiths-Jones, S., Grocock, R. J., van Dongen, S., Bateman, A., and Enright, A. J. (2006). miRBase: microRNA sequences, targets and gene nomenclature. Nucleic Acids Res. 34, D140–D144.
Griffiths-Jones, S., Saini, H. K., van Dongen, S., and Enright, A. J. (2008). miRBase: tools for microRNA genomics. Nucleic Acids Res. 36, D154–D158.
Heo, I., Joo, C., Cho, J., Ha, M., Han, J., and Kim, V. N. (2008). Lin28 mediates the terminal uridylation of let-7 precursor microRNA. Mol. Cell 32, 276–284.
Hofacker, I. L., Fontana, W., Stadler, P. F., Bonhoeffer, S. L., Tacker, M., and Schuster, P. (1994). Fast folding and comparison of RNS secondary structures. Monatsh. Chem. 125, 167–188.
Ibrahim, F., Rymarquis, L. A., Kim, E.-J., Becker, J., Balassa, E., Green, P. J., and Cerutti, H. (2010). Uridylation of mature miRNAs and siRNAs by the MUT68 nucleotidyltransferase promotes their degradation in Chlamydomonas. Proc. Natl. Acad. Sci. U.S.A. 107, 3906–3911.
Iwasaki, S., Kawamata, T., and Tomari, Y. (2009). Drosophila argonaute1 and argonaute2 employ distinct mechanisms for translational repression. Mol. Cell 34, 58–67.
Jiang, H., and Wong, W. H. (2008). Seqmap: mapping massive amount of oligonucleotides to the genome. Bioinformatics 24, 2395–2396.
Jones, M. R., Quinton, L. J., Blahna, M. T., Neilson, J. R., Fu, S., Ivanov, A. R., Wolf, D. A., and Mizgerd, J. P. (2009). Zcchc11-dependent uridylation of microRNA directs cytokine expression. Nat. Cell Biol. 11, 1157–1163.
Kato, M., de Lencastre, A., Pincus, Z., and Slack, F. (2009). Dynamic expression of small non-coding RNAs, including novel microRNAs and piRNAs/21U-RNAs, during Caenorhabditis elegans development. Genome Biol. 10, R54.
Kertesz, M., Iovino, N., Unnerstall, U., Gaul, U., and Segal, E. (2007). The role of site accessibility in microRNA target recognition. Nat. Genet. 39, 1278–1284.
Langenberger, D., Bermudez-Santana, C., Hertel, J., Hoffmann, S., Khaitovich, P., and Stadler, P. F. (2009). Evidence for human microRNA-offset RNAs in small RNA sequencing data. Bioinformatics 25, 2298–2301.
Langmead, B., Trapnell, C., Pop, M., and Salzberg, S. (2009). Ultrafast and memory-efficient alignment of short DNA sequences to the human genome. Genome Biol. 10, R25.
Leaman, D., Chen, P. Y., Fak, J., Yalcin, A., Pearce, M., Unnerstall, U., Marks, D. S., Sander, C., Tuschl, T., and Gaul, U. (2005). Antisense-mediated depletion reveals essential and specific functions of microRNAs in Drosophila development. Cell 121, 1097–1108.
Liu, N., Okamura, K., Tyler, D. M., Phillips, M. D., Chung, W.-J., and Lai, E. C. (2008). The evolution and functional diversification of animal microRNA genes. Cell Res. 18, 985–996.
Ma, Z., Coruh, C., and Axtell, M. J. (2010). Arabidopsis lyrata small RNAs: transient MIRNA and small interfering RNA loci within the Arabidopsis genus. Plant Cell 22, 1090–1103.
Mi, S., Cai, T., Hu, Y., Chen, Y., Hodges, E., Ni, F., Wu, L., Li, S., Zhou, H., Long, C., Chen, S., Hannon, G. J., and Qi, Y. (2008). Sorting of small RNAs into Arabidopsis argonaute complexes is directed by the 5+ terminal nucleotide. Cell 133, 116–127.
Okamura, K., Liu, N., and Lai, E. C. (2009). Distinct mechanisms for microRNA strand selection by Drosophila Argonautes. Mol. Cell 36, 431–444.
Ramachandran, V., and Chen, X. (2008). Small RNA metabolism in Arabidopsis. Trends Plant Sci. 13, 368–374.
Ruby, J. G., Jan, C., Player, C., Axtell, M. J., Lee, W., Nusbaum, C., Ge, H., and Bartel, D. P. (2006). Large-scale sequencing reveals 21U-RNAs and additional microRNAs and endogenous siRNAs in C. elegans. Cell 127, 1193–1207.
Seitz, H., Ghildiyal, M., and Zamore, P. D. (2008). Argonaute loading improves the 5+ precision of both microRNAs and their miRNA* strands in flies. Curr. Biol. 18, 147–151.
Stoeckius, M., Maaskola, J., Colombo, T., Rahn, H.-P., Friedlander, M. R., Li, N., Chen, W., Piano, F., and Rajewsky, N. (2009). Large-scale sorting of C. elegans embryos reveals the dynamics of small RNA expression . Nat. Methods 6, 745–751.
Keywords: microRNA, deep sequencing, database curation
Citation: Wang X and Liu XS (2011) Systematic curation of miRBase annotation using integrated small RNA high-throughput sequencing data for C. elegans and Drosophila. Front. Gene. 2:25. doi: 10.3389/fgene.2011.00025
Received: 09 April 2011; Paper pending published: 30 April 2011;
Accepted: 16 May 2011; Published online: 26 May 2011.
Edited by:
Zhiyu Peng, Beijing Genomics Institute, ChinaReviewed by:
Xizeng Mao, Peking University, China; An-Yuan Guo, Huazhong University of Science and Technology, ChinaCopyright: © 2011 Wang and Liu. This is an open-access article subject to a non-exclusive license between the authors and Frontiers Media SA, which permits use, distribution and reproduction in other forums, provided the original authors and source are credited and other Frontiers conditions are complied with.
*Correspondence: Xiangfeng Wang, Department of Biostatistics and Computational Biology, Dana-Farber Cancer Institute and Harvard School of Public Health, Boston, MA 02115, USA. e-mail: xwang1@cals.arizona.edu;
X. Shirley Liu, Department of Biostatistics and Computational Biology, Dana-Farber Cancer Institute and Harvard School of Public Health, Boston, MA 02115, USA. e-mail: xsliu@jimmy.harvard.edu