 Brad Steven Coates1* Darrell O. Bayles2 Kevin W. Wanner3 Hugh M. Robertson4 Richard L. Hellmich1,5 Thomas W. Sappington1,5
- 1 Corn Insects and Crop Genetics Research Unit, Agricultural Research Service, United States Department of Agriculture, Ames, IA, USA
- 2 National Center for Animal Health, Agricultural Research Service, United States Department of Agriculture, Ames, IA, USA
- 3 Plant Sciences and Plant Pathology, Montana State University, Bozeman, MT, USA
- 4 Department of Entomology, University of Illinois, Champaign, IL, USA
- 5 Department of Entomology, Iowa State University, Ames, IA, USA
Microsatellite markers are difficult to apply within lepidopteran studies due to the lack of locus-specific PCR amplification and the high proportion of “null” alleles, such that erroneous estimations of population genetic parameters often result. Herein single nucleotide polymorphism (SNP) markers are developed from Ostrinia nubilalis (Lepidoptera: Crambidae) using next generation expressed sequence tag (EST) data. A total of 2742 SNPs were predicted within a reference assembly of 7414 EST contigs, and a subset of 763 were incorporated into 24 multiplex PCR reactions. To validate this pipeline, 5 European and North American sample sites were genotyped at 178 SNP loci, which indicated 84 (47.2%) were in Hardy–Weinberg equilibrium. Locus-by-locus FST, analysis of molecular variance, and STRUCTURE analyses indicate significant genetic differentiation may exist between European and North American O. nubilalis. The observed genetic diversity was significantly lower among European sites, which may result from genetic drift, natural selection, a genetic bottleneck, or ascertainment bias due to North American origin of EST sequence data. SNPs are an abundant source of mutation data for molecular genetic marker development in non-model species, with shared ancestral SNPs showing application within closely related species. These markers offer advantages over microsatellite markers for genetic and genomic analyses of Lepidoptera, but the source of mutation data may affect the estimation of population parameters and likely need to be considered in the interpretation of empirical data.
Introduction
Species from the insect Order Lepidoptera play crucial ecological roles and impact human welfare due to feeding on cultivated food, fiber, and biofuel crops. The genetic response of lepidopteran species to habitat changes supports their use as sentinels for climate change, models for adaptation and speciation, and evolution of insecticide resistance traits. The investigation of lepidopteran population genetics has been hindered largely by the lack of locus-specific molecular genetic markers. Molecular variation in the number of tandem repeat among alleles at microsatellite arrays has been widely applied for genetic mapping and population genetic applications (Tautz, 1989; Weber and May, 1989; Estoup et al., 1995). Despite the apparent ease of use, few microsatellite markers have successfully been developed for species of Lepidoptera due to the inability to attain locus specificity or to minimize the frequency of non-PCR amplifying “null” alleles (Meglécz et al., 2004; Van’t Hof et al., 2007). Although not fully understood, recent studies suggest that these difficulties in application of microsatellite marker assays may be the result of an association of lepidopteran microsatellites with transposable elements (Coates et al., 2009a, 2010, 2011; Yamamoto et al., 2006; Tay et al., 2010). This phenomenon has hindered the genetic study of endangered butterfly and agricultural pest species worldwide, and highlights a need to develop alternative genetic markers (Coates et al., 2008).
Sequence by synthesis technologies (Ronaghi et al., 1998; Simon et al., 2009) have been adapted to run on high-throughput platforms (Bennett, 2004; Marulies et al., 2005), and provide millions of de novo DNA nucleotide calls (Ellegren, 2009). Expressed sequence tags (ESTs) are derived from complementary DNA (cDNA) using sequence sampling on high-throughput platforms (Vera et al., 2008), and are representative of transcripts sampled from specific tissues, growth stages, or treatment conditions for a species (Adams et al., 1991). Genetic variation within EST libraries is a source of allelic data, from which single nucleotide polymorphisms (SNPs) can be readily predicted (Pavy et al., 2006; Hayes et al., 2007) and detected by automated genotyping assays (Tang et al., 1999; Tsuchihashi and Dracopoli, 2002). Although existing sequence databases are attractive sources for the development of SNP-based genetic markers, accessions are sometimes representative of selected individuals or genetically constrained populations that may not correspond to the true allelic variation within a species. Sequence data from libraries with low allelic variation often are biased toward sampling rare SNP alleles, whereas sample libraries with elevated levels of sequence divergence tend to be biased for intermediate- and high-frequency SNPs (Kern, 2009). Insufficient sequence coverage or stringent criteria used to predict putative SNPs may also lead to the omission of allelic variation, such that low-frequency SNPs may fail to be sampled within the downstream genetic markers assay. Resulting population genetic data obtained from biased SNPs can produce inaccurate estimates of genotypic diversity, FST, disequilibrium, and Tajima’s D (Kuhner et al., 2000; Nielsen, 2000; Nielsen and Signorovitch, 2003; Clark et al., 1998).
These apparent drawbacks are not unique to SNP markers, where analogous user selection of long arrays and partial sampling of potential loci within a genome interjects ascertainment to microsatellite markers (Ellegren et al., 1995; Ellegren, 2000). Compared to microsatellites, SNPs have higher genome densities, lower genotyping error rates, are adaptable to high-throughput assays (Williams et al., 2010), and are transportable among platforms (Helyar et al., 2011). The mutation rates at SNP loci are lower compared at microsatellite repeats, which results in SNPs being mostly biallelic (Wilson and Sorant, 2000) and defining allele lineages that are comparatively less prone to homoplasy (Brumfield et al., 2003). These attributes make SNP markers attractive for large population genetic or genome scanning studies, especially in light of recent evidence which indicates SNP markers are highly informative and accurately reflect human population demographics (Lao et al., 2006; Paschou et al., 2007). An analogous understanding of the population genetic structure, diversity, and gene flow among lepidopteran species is important for conservation genetic efforts as well the management of insecticide resistance traits. In the following, SNP markers are applied toward the estimation of population structure for the lepidopteran species, Ostrinia nubilalis. These methods outline a readily available gateway for the investigation for a non-model species, but the application of SNP-based genotypic assays likely require correction of sampling bias in the inference of population genetic parameters. The following research is the initial report of genetic variation between the native and introduced range of O. nubilalis. This is also one of the first reports of SNP marker application for population genetic inference in a lepidopteran species, which imparts valuable information in developing single locus marker alternatives to microsatellites for the genetic study of this large group of animal species.
Materials and Methods
Sample Collection and DNA Extraction
DNA was extracted from O nubilalis larvae collected on corn at Cussey-Sur-L’Ognon and Huegas as described by Bourguet et al. (2000). Adults from Kanawha, IA were collected in a light trap adjacent to corn fields in 2004. Two O. nubilalis collections from Pennsylvania were of adult males from E- or Z-pheromone baited traps in 2008 (Table 1). Total genomic DNA was extracted from adult thoracic tissue as described by Coates et al. (2009b), quantified on a NanoDrop 2000c spectrophotometer (Thermo Scientific, Wilmington, DE, USA), concentrations adjusted to 10 ng/μl with deionized nuclease free water, and stored at −20°C prior to use. DNA from O. furnacalis and O. scapulalis samples were respectively provided by Dr Zhenyying Wang and Dr Denis Bourguet.
Table 1. Ostrinia sample locations.
Contig Assembly and Read Mapping
A reference assembly of ESTs from O. nubilalis larval midgut (Coates et al., 2008; GenBank dbEST accessions EL928389–EL930130) and adult antennae (Wanner et al., 2010) was created using the Roche GS De Novo Assembler (i.e., Newbler assembler). Adaptor sequences were identified and the trim positions were changed into .sff files using the Cross-match1, sff tools from Roche2, and custom-built Java scripts. Sequences shorter than 50 nucleotides or containing homopolymers (in which 60% over the entire length of the read is represented by one nucleotide) were not included for assembly. Raw sequence data were obtained from sff files, and assembled into contigs using the Roche GS De Novo Assembler (i.e., Newbler Assembler) using default parameters (seed step: 12, seed length: 16, min. overlap length: 40, min. overlap identity: 90%, alignment identity score: 2, and alignment difference score: −3), and all of the non-redundant contigs were exported to a file in FASTA format.
By design, the de novo assembler collapses the SNPs at a position into a single base call using majority rules. High confidence differences, including but not limited to SNPs, were detected with the Roche GS Reference Mapper by mapping the sequencing reads to the reference assembly (see Newbler Assembler parameters). High confidence differences were output to a flat file specifying full descriptions for the detected mutations and a custom script was used to parse the high confidence difference file, and output the data in both FASTA and tabular formats. Output SNPs were required to have at least 150 bp of flanking sequence on both sides of the SNP to support our requirements for assay development.
Validation of SNP Assays
Ostrinia nubilalis SNP assays were developed using Sequenom MassARRAY® Designer software (Sequenom, San Diego, CA, USA), and unmodified oligonucleotides ordered from Integrated DNA Technologies (Coralville, IA, USA). Each SNP detection assay consists of an initial multiplex PCR step that amplifies genome regions containing mutations, followed by a single base extension reaction that incorporates mass-modified dideoxynucleotides complementary to the allele at each polymorphic locus using the iPLEX-Gold mastermix (Sequenom; Tang et al., 1999). These reactions were carried out upon DNA samples from O. nubilalis (n = 190), O. furnacalis (n = 18), and O. scapulalis (n = 24). The 178 SNP markers within multiplex reactions W0 to W4 were separated by Matrix-assisted laser desorption/ionization–Time of flight (MALDI–TOF) mass spectrometry (Gabriel et al., 2009) on a Sequenom MassARRAY® located at the Iowa State Center for Plant Genomics (ISU-CPG; Ames, IA, USA). Allele calling and subsequent genotyping was performed using the SEQUENOM System Typer 4.0 software package.
Effect of Biological Sample Number Upon SNP Frequency Estimations
The probabilities of not sampling an allele at a given frequency within the population from a sample size of n (P−) was estimated using the parameter P− = (1 − q)2n (Swofford and Berlocher, 1987). Subsequent predictions of minimal sample sizes required to accurately estimate allele frequencies ≤0.05 were calculated as described by Sjögren and Wyöni (1994).
Analyses of O. nubilalis Population Genetic Structure
The significance of deviations between observed heterozygosity (HO) and expected heterozygosity (HE) assuming Hardy–Weinberg equilibrium (HWE) was tested within individual O. nubilalis populations using Markov chain exact tests using the Arlequin software package (v. 3.1; Excoffier et al., 2005). Exact tests of differentiation among pairwise FST estimates, and locus-by-locus FST, FIS, and FIT estimates were performed with Arlequin v. 3.1 (see references therein for all tests). Hierarchical population structure was assessed by analysis of molecular variance (AMOVA) with global genotypes and averaging across all loci (see references within Excoffier et al., 2005) for two groups; North American and European. Hierarchical population structure was also tested between O. nubilalis E- and Z-pheromone ecotypes within North America. The observed level of heterozygosity (HO) and expected heterozygosity (HE) assuming HWE were tested for the O. furnacalis and O. scapulalis genotypes using Arlequin (v. 3.1; Excoffier et al., 2005).
STRUCTURE 2.3.2.1 (Pritchard et al., 2000; Falush et al., 2007) was used to estimate the number of distinct populations (K). Runs were carried out for each value of K from 1 to 10. Each run consisted of 9 × 10⁶ iterations, preceded by a burn-in of 105 iterations that used an admixture model of individual ancestry. The median value of the estimated log probability of the data, conditional on K, (ln Pr(X|K)), was used to compute the posterior probability of K, Pr(K|X), assuming a uniform prior distribution for K. STRUCTURE 2.3.2.1 was also used to estimate the number of distinct populations (K; Kmax = 10) given the a priori information of K = 5 (LOCPRIOR command; Hubisz et al., 2009), with all other parameters identical as the first run except location information included in a separate LocData column.
Results
Contig Assembly, Read Mapping, and SNP Assay Development
The Newbler Assembler generated a de novo reference assembly of 7414 contigs that is comprised of O. nubilalis midgut and antennal EST reads (mean length 359.5 ± 251.4 bp; range 157–2886 bp), and data is present at LepDB.org. Polymorphic nucleotide positions were observed among constituent reads from each contig, which was used to predict 2742 putative SNPs using the Newbler Mapping suite. The application of quality score criteria (minimum read depth = 10; MAF ≥ 10%) and removal of SNP positions ≤150 bp from 5′ and 3′ ends of respective contigs resulted in the removal of 1191 SNPs (43.4%) from the pool of candidate loci, and the 1551 remaining loci were used for SNP marker development.
Validation of SNP Assays
Single base extension assays were designed using Sequenom MassARRAY Designer Software to detect 763 of 1551 predicted SNP loci (49.2%) within 443 O. nubilalis EST contigs (1.73 ± 0.95 SNPs per contig; mean size of contigs containing SNPs was 637 ± 125 bp), and PCR co-amplified by 24 multiplex reactions (multiplexes W0 to W23; 32.48 ± 4.95 markers per multiplex). For this study, SNP loci from multiplex PCR reactions W0 to W4 (markers OnSMA-0001 to -0178; Table S1 in Supplementary Material) were used to genotype 192 samples on the Sequenom MassARRAY® (Table 1). Results showed that 29 SNP markers generated no nucleotide signal (~15.3% assay failure rate), and 31 SNPs were not variable within the samples we tested (~17.4% false discovery rate). The remaining 118 polymorphic SNPs (66.3% of total; Figure 1), produced 175.1 ± 13.7 SNP calls per locus from 189 successfully genotyped individuals.
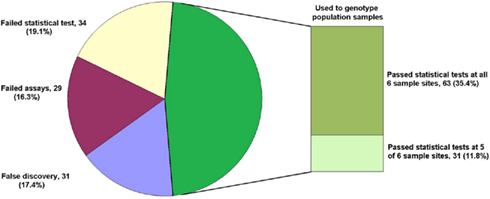
Figure 1. Fate of 178 SNP marker assays. The total number of assays (percentage of the whole) are given for each category: False discovery (monomorphic in all samples), Failed assays (no nucleotide signal from Sequenom MassARRAY®), Failed statistical test (Hardy–Weinberg Equilibrium, HWE), and those used for genotyping population samples passing HWE tests in all instances and passing HWE tests in all but one instance.
Effect of Biological Sample Number Upon SNP Frequency Estimations
The SNP minor allele frequencies (MAF) observed across all sites within the entire O. nubilalis population sample ranged from 0.017 ± 0.016 to 0.5434 ± 0.1187 (median = 0.1741 ± 0.0625), of which 13 SNP MAFs were ≤0.05. Although polymorphic across the entire sample, 12 of these 13 SNPs were monomorphic in ≥1 of 5 sample sites, and the number of monomorphic SNPs estimated in European sites (~8.9%) was significantly higher than in North America (~2.7%; F-statistic < 0.001, P < 0.0001, df = 5, 498). Allelic variation may be lost by random genetic drift, differential selection, or the effects of insufficient biological sampling. The probability of not sampling a SNP (P−) for each sample size (n) was calculated for all O. nubilalis SNP loci with a MAF (q) ≤ 0.05 Table S2 in Supplementary Material). Results indicate that P− ranged from 0.0099 (q = 0.05) to 0.6369 (q = 0.005) for French populations, and 3.84 × 10⁻⁷ (q = 0.05) to 0.2361 (q = 0.005) for North American populations. A critical value of (1 − P−) was set for P− = 0.05 as an approximate 95% confidence interval (CI), whereby SNPs with a MAF and sample sizes (n) insufficient to cross the 95% CI were identified (Figure 2). This indicated SNPs with MAF ≥ 0.063 may be accurately estimated at n = 23, whereas an n = 144 shows a 95% probability of estimating a SNP with a MAF ~ 0.010. Due to potential influence of sampling error, SNPs with a MAF ≤ 0.06 were omitted from analyses of population genetic structure for all O. nubilalis sample sites.
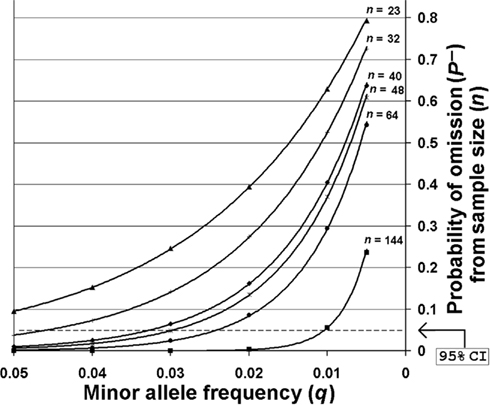
Figure 2. The probabilities of not sampling SNPs with minor allele frequencies ≤0.05. Sampling probabilities were calculated for minor allele frequencies across biological sample sizes (n) that were used for empirical Ostrinia nubilalis data collection. The predicted sample size required to obtain accurate minor allele frequencies with 95% probability [~95% confidence interval (CI)] is shown for Cus d’leon and Huegas, France (▲), Landisville, PA (○), all French subpopulations (♦), Kanawha, IA (□), Rockspring, PA (●), and all North American subpopulations (■). The probability of not sampling a rare allele from a population that was genotyped (P−) was calculated using P− = (1 − q)2n as described by Swofford and Berlocher (1987).
Analyses of Population Genetic Structure
The observed heterozygosity at 63 of 118 SNP loci (53.4%) was estimated to be in HWE at all O. nubilalis sample sites, and 84 (71.2%) loci were in HWE within ≥5 of 6 samples (P ≥ 0.050; Table S3 in Supplementary Material). Pairwise FST estimates were significant between 4 of 15 comparisons (Bonferroni-adjusted threshold α = 0.05/15 = 0.003; Table 2). In contrast, Fisher’s Exact Tests for subpopulation differentiation among the estimated haplotype frequencies were not significant among any sample sites (P = 1.000; data not shown). Locus-by-locus FST estimates ranged from –0.009 (marker OnSMA-0022) to 0.252 (OnSMA-0108) across loci when European and North American sites were compared, and were not significant for all loci (P ≥ 0.050) except for 15 markers (P ≤ 0.038; Table 3). Locus-by-locus FST estimates between E- vs. Z-pheromone strains ranged from –0.013 to 0.073, and four SNPs showed significant differentiation (P ≤ 0.050), and a single SNP accounted for >6.81% of the total genetic variation (OnSMA-0073). Fisher’s Exact Tests indicated that no significant differentiation in genotypic frequencies were detected among pheromone strains (P = 1.000; data not shown).
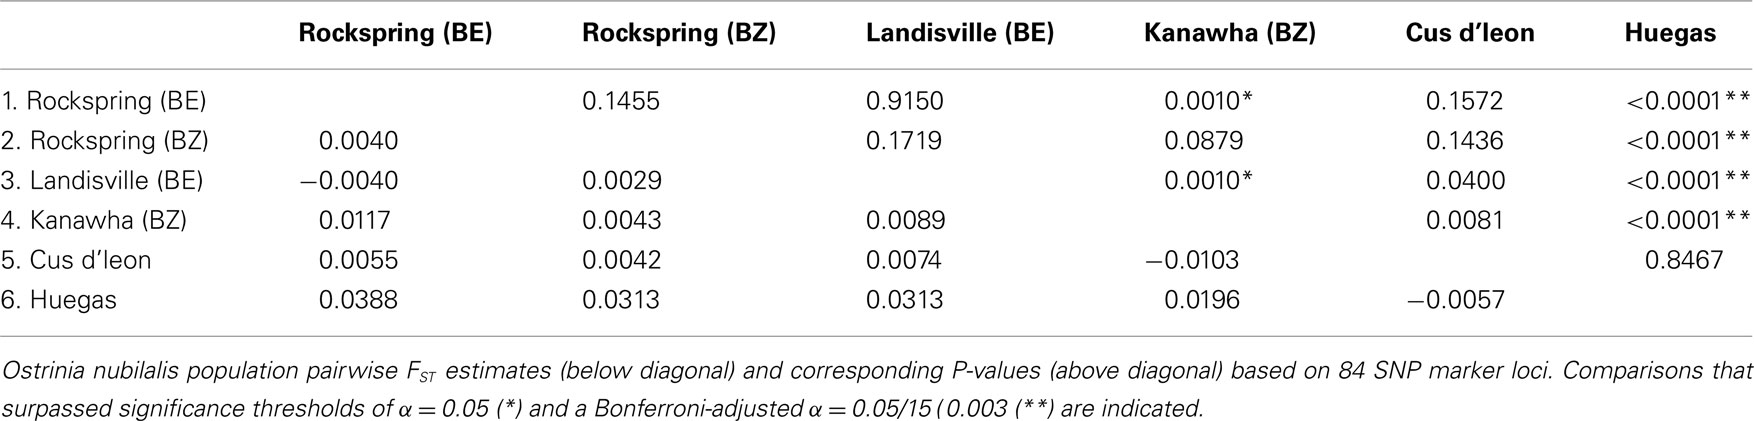
Table 2. Ostrinia nubilalis population pairwise FST estimates.
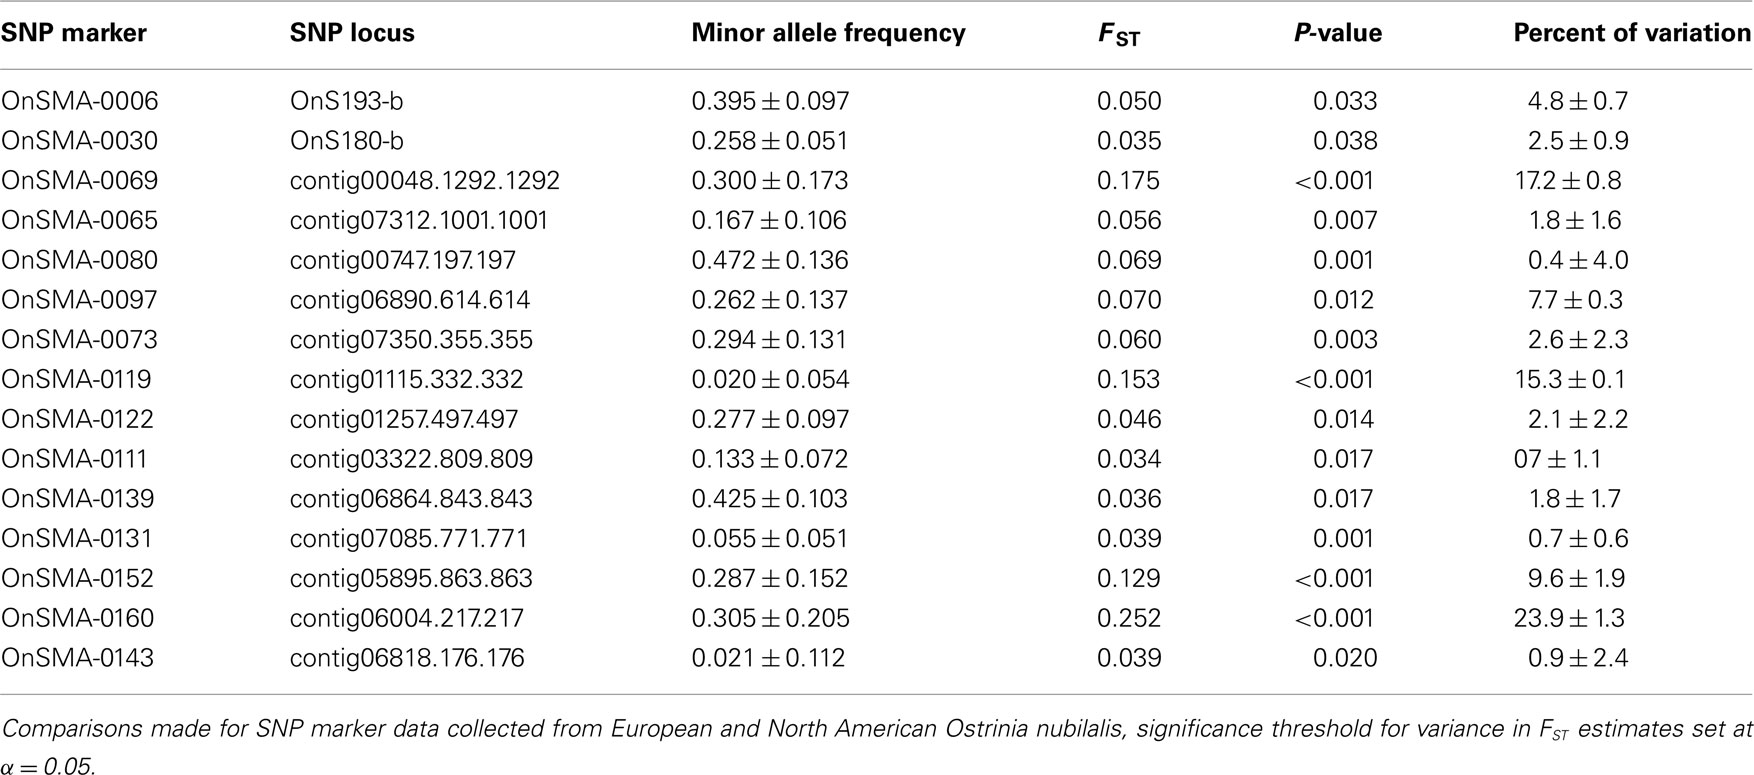
Table 3. Single nucleotide polymorphism marker loci showing significant FST differences.
Tests of hierarchical population structure between North American and European sites showed that low, but significant levels of differentiation may exist (Table 4), with an estimated FST = 0.025 (P < 0.036). Genetic differentiation between E- and Z-pheromone ecotypes was also low (FST ≤ 0.009) but not significant (remaining results not shown). STRUCTURE estimated a single O. nubilalis population (K = 1) with membership within the cluster = 0.99 (remaining results not shown). The LOCPRIOR command was used to define geographic location of genotypes and resulted in a K = 5, with 64 (33.5%), 32 (16.8%), 48 (25.1%), 24 (12.5%), and 23 (12.0%) genotypes being assigned to each cluster (Figure 3). Across sample sites, the co-ancestry coefficient (Q) partitioned 0.297 ± 0.136 and 0.677 ± 0.154 of the individual genotypes into clusters 1 and 3, respectively, whereas clusters 2, 4, and 5 each comprised ≤0.011 of the total. Cluster 1 composed 0.054 (Cussey-Sur-L’Ognon) to 0.455 (Landisville; Figure 3) of the genotypes across sample sites, and showed a significant difference between Rockspring vs. Huegas, Rockspring vs. Cussey-Sur-L’Ognon, Landisville vs. Huegas, and Landisville vs. Cussey-Sur-L’Ognon (F-statistic not shown). A plot of proportions of Q composing genotypes within cluster 1 and cluster 3 was able to separate samples from France and Pennsylvania. (Figure 4).
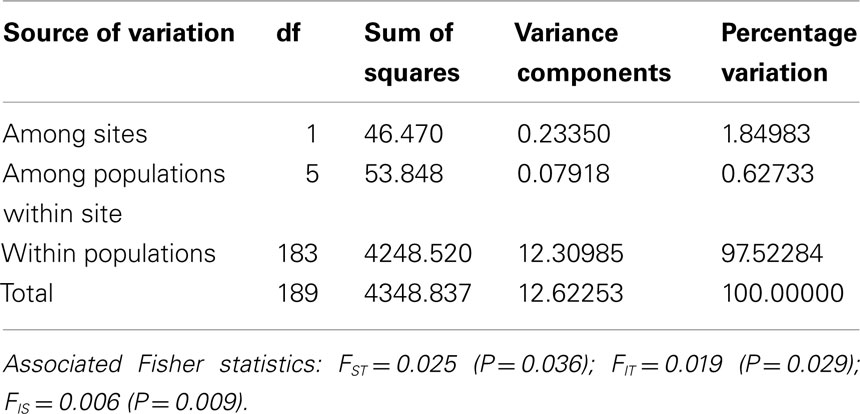
Table 4. Analysis of molecular variance (AMOVA) averaged across 84 loci.
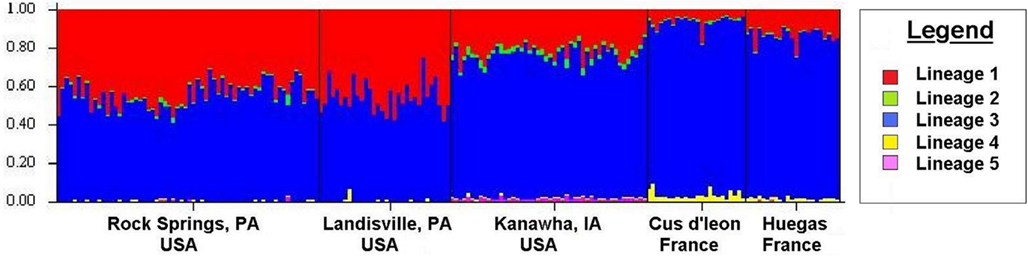
Figure 3. The estimated ancestry coefficients (Q) for Ostrinia nubilalis individuals from STRUCTURE output generated by the LOCPRIOR command. The ancestry of individual SNP genotypes from sampled subpopulations. Each of the 189 individual O. nubilalis genotypes are represented as a vertical line and are composed of proportions of each Kth segment which represent genetic lineages within the respective individual.
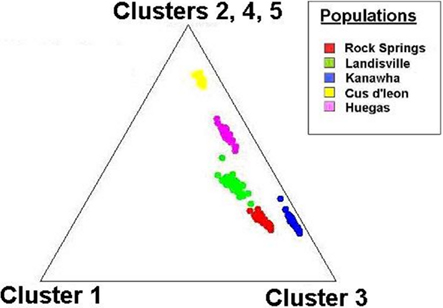
Figure 4. Cluster analysis of the ancestry coefficient (Q) among individual SNP genotypes collected at O. nubilalis sample sites. The individual ancestry vectors on the triangle plot are representative of North American and European samples, and are derived from K = 5 components (assumed number of independent populations during analyses). Each components are displayed as the distance to the corresponding corner of the triangle, where individual genotypes at the points of the triangle are completely assigned to a single population of origin.
A total of 32 of 118 O. nubilalis SNP markers (~27.1%) were polymorphic only within this species, whereas the remaining 86 (72.8%) were shown to also be polymorphic within related Ostrinia species. When SNP markers were tested upon O. furnacalis and O. scapulalis samples 36 (~30.5%) and 86 (~72.8%) of loci, respectively, remained polymorphic. This compared to 87.2% of the SNP markers that remained polymorphic among the 5 O. nubilalis sample sites. All but one of the SNPs that were polymorphic in O. furnacalis were also variable in O. scapulalis. In all instances, the nucleotide change that defined alternate alleles at each SNP locus was retained among species. Statistical tests showed that 31 (26.3%) and 62 (52.5%) of O. furnacalis and O. scapulalis markers showed no significant deviation from the expected HWE proportions (Table S4 in Supplementary Material). These data indicate that SNP markers developed from O. nubilalis EST data contain shared ancestral alleles, and that these markers may be applied to other species within the genus.
Discussion
Next generation sequencing technologies offer a rapid entry point into genomic research, and can accelerate genetic discoveries in non-model species. The current study provides a genomics pipeline for the development of high-throughput SNP genotyping assays using mutation data from current EST resources followed by application to population genetic inference. Similar studies have been published with procedural outlines for SNP marker development from sequence data (Novaes et al., 2008; Wiedmann et al., 2008; Williams et al., 2010). SNPs have been applied on a limited scale for the genetic mapping of the model lepidopteran species, Bombyx mori (Yamamoto et al., 2006), and the butterfly Bicyclus anynana (Beldade et al., 2010), and for population genetics of the Glanville fritillary butterfly (Orsini et al., 2008). To develop markers, an O. nubilalis EST reference assembly was constructed which contained 7414 contigs, from which over 2700 SNPs were predicted by mapping constituent reads against the assembled scaffolds. Interestingly, the length of contigs in which SNPs were predicted and from which subsequent assays were designed tended to be greater than that of the mean of the general reference assembly. This likely was a consequence of the positive correlation between contig length and read depth. Alternatively, the criteria we used for assay design included a requirement that sequence was present ±150 bp of putative SNPs, such that any SNPs within a contig ≤301 bp would have been excluded from resulting PCR-based single base extension assays. This suggests that downstream marker development efficiency may increase as technologies generate longer de novo sequence read lengths or algorithms written that result in the reliable assembly of longer contigs. Overall, ~6.0% of O. nubilalis contigs within the reference assembly contained a putative SNP that met our criteria, and is similar to the 0.05–11.1% of contigs previously reported from other species (Novaes et al., 2008; Wiedmann et al., 2008). Albeit, the use of relaxed criteria to define putative SNPs within the initial mutation pool would have lead to an increase in the number of candidates for SNP assay design, but may likely also have increased the ensuing SNP false discovery rate (Matukumalli et al., 2009).
Analysis of sequence by synthesis reaction data can result in errors, but tend to be associated with homopolymer stretches or the ends of individual reads (Simon et al., 2009). These intrinsic factors may have led to the 17.4 rate of SNP false discovery encountered in our study. Though this may seem high, it was analogous to the rates observed in EST-derived SNP marker assay design from beetle (15.0%; Coates et al., 2009b) and bovine species (14.7%; Matukumalli et al., 2009). Although not investigated further here, false discovery rates may likely be contingent upon the initial criteria used to differentiate mutations from DNA sequencing error or the specious assembly of closely related paralogs into a single contig (Hayes et al., 2007). Conversely, SNPs may appear to be invariable if biological sample sizes are insufficient to capture all SNP haplotypes within a geographic region, but this scenario seems unlikely due to our use of 189 individuals (378 haplotypes) for frequency estimations. We also observed from assay results that ~16.3% of markers failed to generate a nucleotide signal (i.e., no base calls were obtained from any genomic DNA samples). This class of genotyping error may result from PCR amplification failures based upon the unknown position of introns within DNA templates when a cDNA sequence is initially used for PCR assay design, where oligonucleotide primers could anneal at intron junctions or have large intervening introns (Coates et al., 2009b). These factors may be unavoidable when markers are developed for non-model organisms, and may likely remain problematic pending the ready availability of whole-genome sequence assemblies.
Despite the apparently high failure rate of O. nubilalis SNP markers on the MassARRAY®, genotypic data was successfully generated at ~66.6% of loci within natural populations. The rate of success for microsatellite markers was comparatively low for O. nubilalis, where Coates et al. (2005) and Kim et al. (2008) reported rates of ≤12.5%. In conjunction with high throughput of detection assays that facilitates the ease and low cost of screening hundreds of potential markers, SNPs have fast become accepted within the scientific community. Of special interest for lepidopteran genomic research, is that the genotypes defined at ~ 47.2% of all 178 O. nubilalis SNPs did not deviate significantly from HWE within any sampling location, but increased to 71.2% when considering loci that did not generate a signal on the MassARRAY®. HWE assumptions are violated within populations where random genetic drift, selection, range expansions, or recent genetic bottlenecks affect the genetic structure. Alternatively, assay logistics such as uncharacterized mutations within oligonucleotide primer annealing sites are known to cause non-amplifying “null” alleles which also cause genotypes at a locus to significantly deviate from HWE values (Pemberton et al., 1995). Significant reductions in observed heterozygosity levels have been observed at high frequency when microsatellite markers were applied to genotype individuals within lepidopteran populations, where as the proportion of O. nubilalis SNP markers in HWE ranged from ~33.3 (Coates et al., 2005) to 50% (Malausa et al., 2007). The increased proportion of SNP markers in HWE compared to microsatellite loci may be attributable to the sequence conservation of oligonucleotide primer binding sites within protein coding sequences such that “null” allele frequencies are dramatically reduced. Although beneficial in terms of assay performance, the protein coding sequence conservation may influence the neutrality of assayed polymorphisms where selection based upon codon bias or amino acid sequence may also play a role in the evolution and observed SFS of SNPs. The rate of success among O. nubilalis genotyping assays suggests that EST-derived SNPs offer a readily available source of mutations from which genetic markers can be developed (Novaes et al., 2008; Wiedmann et al., 2008; Williams et al., 2010).
Although SNP markers will allow for the estimation of genotypic frequencies within population samples, there are precautions that likely should be implemented during experimental design and interpretation of results. For instance, rare “private” alleles (<0.05) are often used in population genetics to detect stochastic events, and are seen as valuable for the estimation of overall differentiation (Slatkin, 1985) since they are more susceptible to the effects of random genetic drift or represent recently derived mutations that may be sample site specific. SNPs may be held at low frequencies in a population for a variety of reasons, where for instance SNPs located within protein coding sequence that cause amino acid changes (non-synonymous SNPs), are usually held at low frequencies due to purifying selection and are often specific to a subpopulation (Fay et al., 2001). Since 83.3% of the O. nubilalis SNPs that show a MAF < 0.05 are located within synonymous third positions, we assumed that loci may be nearly neutral and represent recently evolved mutations. Regardless of causal factor, the ability to accurately estimate a rare event becomes increasingly error prone with decreasing MAF and decreasing biological sample size. Indeed, we show that the proportion of monomorphic loci increased when the O. nubilalis MAF and/or the number of biological samples at a site were low. Specifically, these observations suggest that sampling error is influencing our estimations of SNP allele frequency. To address this we assigned a critical value at the 95% probability of allele inclusion within a given number of biological samples, which further indicated that SNPs with a MAF < ~0.06 were unlikely to be accurately estimated from the biological samples of n = 23. Although not startling, this scenario illustrates that insufficient sampling can result in the erroneous estimation of rare allele frequencies (Ingman and Gyllensten, 2009; Städler et al., 2009), and that the use of low-frequency SNPs in population genetic analyses needs to be done cautiously or have sampling designs adjusted at the onset of the study (Brooks et al., 2010).
There are potential drawbacks inherent to SNPs when applied to population genetic inference, but are similarly encountered for microsatellite-based assays (Ellegren et al., 1995; Ellegren, 2000). SNP markers are being increasingly used for population genetic analyses due to their highly informative value and success at predicting known population subdivisions (Lao et al., 2006; Paschou et al., 2007). O. nubilalis, the European corn borer, is native to Europe and western Asia where it is known to feed upon about 223 plant species, and populations show diversity with respect to a genetically determined number of reproducing generations per year (Eckenrode et al., 1983), and female production and corresponding male perception of E- and Z-Δ11-tetradecenyl acetate pheromone components (Klun, 1975). O. nubilalis was introduced to North America in the early 1900s. The O. nubilalis SNP markers were developed from sequences (alleles) sampled within midgut and antennal EST libraries that were constructed from individuals collected in the North American population. The North American population shows evidence of low genetic structuring over much of its range (Kim et al., 2009, 2011), which was corroborated by results from SNP marker data. Similar conclusions were drawn from statistical comparisons between the two French samples by Bourguet et al. (2000), Malausa et al. (2007), and in the current study. In contrast, a significant level of differentiation was detected between the French and North American populations, which suggest that SNP markers are capable of distinguishing O. nubilalis populations derived from different continents. Genetic variation between native and introduced ranges of O. nubilalis has not been examined prior to this study. Genetic divergence may result from random genetic drift between populations isolated by the expanse of the Atlantic Ocean, from a genetic bottleneck that occurred upon North American introduction, or from the North American introduction not being founded by moths from France. The O. nubilalis introduction into North America occurred ~100 years ago, future studies that investigate differentiation within the ancestral European population may be able to identify potential founder regions of the introduced North American cohorts. In this scenario, any ascertainment bias interjected into the SNP marker pool by their development from EST variation sampled only from North American O. nubilalis may actually be beneficial, assuming that drift or selection have not obscured the genetic similarity among the true founder and introduced population.
Previous evidence suggests that SNP allele lineages are stable and less prone to homoplasy compared to microsatellites (Brumfield et al., 2003; Coates et al., 2009b), and may provide increased accuracy for the estimation of subpopulation differentiation (Morin et al., 2004). Additionally, genotyping assays were successful and polymorphism was retained among 75% of primate (Hacia et al., 1999) and 99% of sheep SNPs (Kijas et al., 2009), such that allele lineages were traced across species boundaries. In the present study, we showed that a higher number of O. nubilalis SNP loci remained variable in O. scapulalis compared to O. furnacalis, which may support prior suggestions that O. nubilalis and O. scapulalis are recently diverged species (Frolov et al., 2007) and is reflected at the genome level. Based on a mitochondrial genome sequence comparison, O. nubilalis and O. furnacalis speciation was estimated to have occurred 3.3 mya (Coates et al., 2004), and supports the increased level of divergence we characterized at genomic SNP loci. Reports that SNPs have low estimated mutation rates and are generally biallelic within a species (Wilson and Sorant, 2000) was indicated by allelic variation at polymorphic SNP loci among three species of Ostrinia and suggests allele lineages may be stable over millions of years. Monna et al. (2006) indicated that SNPs can be informative for whole-genome analyses of evolutionary relationships, and that inclusion of additional Ostrinia species may allow for prediction of phylogenomic topology and the direction of mutation at shared ancestral SNP loci.
Conclusion
Single nucleotide polymorphisms provide a source of mutation data from non-model species that are suitable for the development of high-throughput genetic markers. Furthermore, variation at SNP loci provides a tool for the analyses of natural populations. These markers are capable of revealing genetic variation among O. nubilalis at different sample sites, but analysis indicates that caution should be used when estimating low SNP MAFs from limited biological sample numbers. SNP loci show biallelic polymorphism within the genus Ostrinia that represents shared ancestral mutations and have the potential for use in future phylogenomic and comparative genomic studies.
Conflict of Interest Statement
The authors declare that the research was conducted in the absence of any commercial or financial relationships that could be construed as a potential conflict of interest.
Acknowledgments
This research was a joint contribution from the USDA, Agricultural Research Service, CRIS project 016 and the Iowa Agriculture and Home Economics Experiment Station, Ames, IA, USA (project 3543). This article reports the results of research only. Mention of a proprietary product does not constitute an endorsement or a recommendation by USDA, or Iowa State University for its use. We thank Zhenying Wang at the Institute of Plant Protection, Chinese Academy of Agricultural Sciences, Beijing, China, Shelby Fleischer Department of Entomology, Penn State University, and Denis Bourguet from the Centre de Biologie pour la Gestion des Populations at Montpellier, France for providing moth and DNA samples.
Supplementary Material
The Supplementary Material for this article can be found online at http://www.frontiersin.org/genomic_assay_technology/10.3389/ fgene.2011.00038/abstract
Footnotes
References
Adams, M. D., Kelly, J. M., Gocayne, J. D., Dubnick, M., Polymeropoulos, M. H., Xiao, H., Merril, C. R., Wu, A., Olde, B., Mereno, R. F., Kerlavage, A. R., McCombie, W. R., and Venter, J. C. (1991). Complementary DNA sequencing: expressed sequence tags and the human genome project. Science 252, 1651–1656.
Beldade, P., Saenko, S. V., Pul, N., and Long, A. D. (2010). A gene-based linkage map of Bicyclus anynana butterflies allows for a comprehensive analysis of synteny with the lepidopteran reference genome. PLoS Genet. 5, e1000366. doi: 10.1371/journal.pgen.1000366
Bourguet, D., Bethenod, M. T., Pasteur, N., and Viard, F. (2000). Gene flow in the European corn borer Ostrinia nubilalis: implications for the sustainability of transgenic insecticidal maize. Proc. R. Soc. Lond. B Biol. Sci. 267, 117–122.
Brooks, S. A., Gabreski, N., Miller, D., Brisbin, A., Brown, H. E., Streeter, C., Mezey, J., Cook, D., and Antczak, D. F. (2010). Whole-genome SNP association in the horse: identification of a deletion in myosin Va responsible for Lavender Foal syndrome. PLoS Genet. 6, e1000909. doi: 10.1371/journal.pgen.1000909
Brumfield, R. T, Beerli, P., Nickerson, D. A., and Edwards, S. V. (2003). The utility of single nucleotide polymorphisms in inference of population history. Trends Ecol. Evol. (Amst.) 18, 249–256.
Clark, A. G., Weiss, K. M., Nickerson, D. A., Taylor, S. L., Buchanan, A., Stengard, J., Salomaa, V., Vartiainen, E., Perola, M., Boerwinkle, E., and Sing, C. F. (1998). Haplotype structure and population genetic inferences from nucleotide-sequence variation in human lipoprotein lipase. Am. J. Hum. Genet. 63, 595–612.
Coates, B. S., Hellmich, R. L., and Lewis, L. C. (2005). Polymorphic CA/GT and GA/CT microsatellite loci for Ostrinia nubilalis (Lepidoptera: Crambidae). Mol. Ecol. Notes 5, 10–12.
Coates, B. S., Kroemer, J. A., Sumerford, D. V., and Hellmich, R. L. (2011). A novel class of miniature inverted repeat transposable elements (MITEs) that contain hitchhiking (GTCY)n microsatellites. Insect Mol. Biol. 20, 15–27.
Coates, B. S., Sumerford, D. V., Hellmich, R. L., and Lewis, L. C. (2004). Partial mitochondrial genome sequences of Ostrinia nubilalis and Ostrinia furnacalis. Int. J. Biol. Sci. 1, 13–18.
Coates, B. S., Sumerford, D. V., Hellmich, R. L., and Lewis, L. C. (2008). Mining an Ostrinia nubilalis midgut expressed sequence tag (EST) library for candidate genes and single nucleotide polymorphisms (SNPs). Insect Mol. Biol. 17, 607–621.
Coates, B. S., Sumerford, D. V., Hellmich, R. L., and Lewis, L. C. (2009a). Repetitive genomic elements in a European corn borer, Ostrinia nubilalis, bacterial artificial chromosome library were indicated by bacterial artificial chromosome end sequencing and development of sequence tag site markers: implications for lepidopteran genomic research. Genome 52, 57–67.
Coates, B. S., Sumerford, D. V., Miller, N. J., Kim, K. S., Sappington, T. W., Siegfried, B. D., and Lewis, L. C. (2009b). Comparative performance of single nucleotide polymorphism and microsatellite markers for population genetic analysis. J. Hered. 100, 556–564.
Coates, B. S, Sumerford, D. V., Hellmich, R. L., and Lewis, L. C. (2010). A Helitron-like transposon superfamily from Lepidoptera disrupts (GAAA)n microsatellites and is responsible for flanking sequence similarity within a microsatellite family. J. Mol. Evol. 70, 278–288.
Eckenrode, C. J., Robbins, P. S., and Andaloro, J. T. (1983). Variations in flight patterns of European corn borer (Lepidoptera: Pyralidae) in New York. Environ. Entomol. 12, 393–396.
Ellegren, H. (2000). Heterogeneous mutation processes in human microsatellite DNA sequences. Nat. Genet. 24, 400–402.
Ellegren, H. (2009). Sequencing goes 454 and takes large-scale genomics into the wild. Mol. Ecol. 17, 1629–1635.
Ellegren, H., Primmer, C. R., and Sheldon, B. C. (1995). Microsatellite “evolution”: directionality or bias? Nat. Genet. 11, 360–362.
Estoup, A., Garnery, L., Solignac, M., and Cornuet, J. M. (1995). Microsatellite variation in honey bee (Apis mellifera L.) populations: hierarchical genetic structure and test of the infinite allele and stepwise mutation models. Genetics 140, 679–695.
Excoffier, L., Laval, G., and Schneider, S. (2005). Arlequin (version 3.0): an integrated software package for population genetic analysis. Evol. Bioinf. Online 1, 47–50.
Falush, D., Stephens, M., and Pritchard, J. K. (2007). Inference of population structure using multilocus genotype data: dominant markers and null alleles. Mol. Ecol. Notes 7, 574–578.
Fay, J. C., Wyckoff, G. J., and Wu, C. I. (2001). Positive and negative selection on the human genome. Genetics 158, 1227–1234.
Frolov, A. N., Bourguet, D., and Ponsard, S. (2007). Reconsidering the taxonomy of several Ostrinia species in the light of reproductive isolation: a tale for Ernst Mayr. Biol. J. Linn. Soc. Lond. 91, 49–72.
Gabriel, S., Ziaugra, L., and Tabbaa, D. (2009). SNP genotyping using the sequenom MassARRAY iPlex platform. Curr. Prot. Hum. Genet. 2.12.1–2.12.18.
Hacia, J. G., Fan, J. B., Ryder, O., Jin, L., Edgemon, K., Ghandour, G., Mayer, R. A., Sun, B., Hsie, L., Robbins, C. M., Brody, L. C., Wang, D., Lander, E. S., Lipshutz, R., Foder, S. P. A., and Collins, F. S. (1999). Determination of ancestral alleles for human single-nucleotide polymorphisms using high-density oligonucleotide arrays. Nat. Genet. 22, 164–167.
Hayes, B. J., Nilsen, K., Berg, P. R., Grindflek, E., and Lien, S. (2007). SNP detection exploiting multiple sources of redundancy in large EST collections improves validation rates. Bioinformatics 23. 1692–1693.
Helyar, S. J., Hemmer-Hansen, J., Bekkevold, D., Taylor, M. I., Odgen, R., Limborg, M. T., Cariani, A., Maes, G. E., Diopere, E., Carvalho, G. R., and Nielsen, E. E. (2011). Application of SNPs for population genetics of nonmodel organisms: new opportunities and challenges. Mol. Ecol. Resour. 11(Suppl. 1), 123–136.
Hubisz, M. J., Falush, D., Stephens, M., and Pritchard, J. K. (2009). Inferring weak population structure with the assistance of sampling group information. Mol. Ecol. Resour. 9, 1322–1332.
Ingman, M., and Gyllensten, U. (2009). SNP frequency estimation using massively parallel sequencing of pooled DNA. Eur. J. Human Genet. 17, 383–386.
Kern, A. D. (2009). Correcting the site frequency spectrum for divergence-based ascertainment. PLoS ONE 4, e5152. doi: 10.1371/journal.pone.0005152
Kijas, J. W., Townley, D., Dalrymple, B. P., Heaton, M. P., Maddox, J. F., McGrath, A., Wilson, P., Ingersoll, R. G., McCulloch, R., McWilliam, S., Tang, D., McEwan, J., Cockett, N., Hutton Oddy, V., Nicholas, F. W., and Raadsma, H., and for the International Sheep Genomics Consortium. (2009). A genome wide survey of SNP variation reveals the genetic structure of sheep breeds. PLoS ONE 4, e4668. doi: 10.1371/journal.pone.0004668
Kim, K. S., Bagley, M. J., Coates, B. S., Hellmich, R. L., and Sappington, T. W. (2009). Spatial and temporal genetic analyses reveal high gene flow among European corn borer populations across the central US corn belt. Environ. Entomol. 38, 1312–1323.
Kim, K. S., Coates, B. S., Hellmich, R. L., Sumerford, D. V., and Sappington, T. W. (2008). Isolation and characterization of microsatellite loci from the European corn borer, Ostrinia nubilalis (Hübner) (Insecta: Lepidoptera: Crambidae). Mol. Ecol. Resources 8, 409–411.
Kim, K. S., Coates, B. S., Hellmich, R. L., and Sappington, T. W. (2011). Genetic structure and gene flow among European corn borer populations from the Great Plains to New York. Agri. Forest Entomol. doi: 10.1111/j.1461-9563.2011.00533.x
Klun, J. A. (1975). Insect sex pheromones: intraspecific pheromonal variability of Ostrinia nubilalis in North America and Europe. Environ. Entomol. 4, 891–894.
Kuhner, M. K., Beerli, P., Yamato, J., and Felsenstein, J. (2000). Usefulness of single nucleotide polymorphism data for estimating population parameters. Genetics 156, 439–447.
Lao, O., van Duijn, K., Kersbergen, P., de Knijff, P., and Kayser, M. (2006). Proportioning whole-genome single-nucleotide-polymorphism diversity for the identification of geographic population structure and genetic ancestry. Am. J. Hum. Genet. 78, 680–690.
Malausa, T., Dalecky, A., Ponsard, S., Audiot, P., Streiff, R., Chaval, Y., and Bourguet, D. (2007). Genetic structure and gene flow in French populations of two Ostrinia taxa: host races or sibling species? Mol. Ecol. 16, 4210–4222.
Marulies, M., Egholm, M., Altman, W. E., Attiya, S., Dader, J. S., Bemben, L. A., Berka, J., Braverman, M. S., Chen, Y. J., Chen, Z., Dewell, S. B., Du, L., Fierro, J. M., Gomes, X. V., Godwin, B. C., He, W., Helgesen, S., Ho, C. H., Irzyk, G. P., Jando, S. C., Alenquer, M. L., Jarvie, T. P., Jirage, K. B., Kim, J. B., Knight, J. R., Lanza, J. R., Leamon, J. H., Lefkowitz, S. M., Lei, M., Li, J., Lohman, K. L., Lu, H., Makhijani, V. B., McDade, K. E., McKenna, M. P., Myers, E. W., Nickerson, E., Nobile, J. R., Plant, R., Puc, B. P., Ronan, M. T., Roth, G. T., Sarkis, G. J., Simons, J. F., Simpson, J. W., Srinivasan, M., Tartaro, K. R., Tomasz, A., Vogt, K. A., Volkmer, G. A., Wang, S. H., Wang, Y., Weiner, M. P., Yu, P., Begley, R. F., and Rothberg, J. M. (2005). Genome sequencing in microfabricated high-density picolitre reactors. Nature 437, 376–380.
Matukumalli, L. K., Lawley, C. T., Schnabel, R. D., Taylor, J. F., Allan, M. F., Heaton, M. P., O’Connell, J., Moore, S. S., Smith, T. P. L., Sonstegard, T. S., and Van Tassell, C. P. (2009). Development and characterization of a high density SNP genotyping assay for cattle. PLoS ONE 4, e5350. doi: 10.1371/journal.pone. 0005350
Meglécz, E., Petenian, F., Danchin, E., D’Acier, A. C., Rasplus, J. Y., and Faure, E. (2004). High similarity between flanking regions of different microsatellites detected within each of two species of Lepidoptera: Parnassius apollo and Euphydryas aurinia. Mol. Ecol. 13, 1693–1700.
Monna, L., Ohta, R., Masuda, H., Koike, H., and Minobe, Y. (2006). Genome-wide searching of single-nucleotide polymorphisms among eight distantly and closely related rice cultivars (Oryza sativa L.) and a wild accession (Oryza rufipogon Griff.). DNA Res. 13, 43–51.
Morin, P. A., Luikart, G., Wayne, R. K., and SNP workshop group. (2004). SNPs in ecology, evolution and conservation. Trends Ecol. Evol. (Amst.) 19, 208–216.
Nielsen, R. (2000). Estimation of population parameters and recombination rates from single nucleotide polymorphisms. Genetics 154, 931–942.
Nielsen, R., and Signorovitch, J. (2003). Correcting for ascertainment biases when analyzing SNP data: applications to the estimation of linkage disequilibrium. Theor. Popul. Biol. 63, 245–255.
Novaes, E., Drost, D. R., Farmerie, W. G., Pappas, G. J., Grattapaglia, D., Sederoff, R. R., and Kirst, M. (2008). High-throughput gene and SNP discovery in Eucalyptus grandis, an uncharacterized genome. BMC Genomics 9, 312. doi: 10.1186/1471-2164-9-312
Orsini, L., Wheat, C. W., Haag, C. R., Kvist, J., Frilander, M. J., and Hanski, I. (2008). Fitness differences associated with Pgi SNP genoytpes in the Glanville fritillary butterfly (Melitaea cinxia). J. Evol. Biol. 22, 367–375.
Paschou, P., Ziv, E., Burchard, E. G., Choudhry, S., Rodriquez-Cintron, W., Mahoney, M. W., and Drineas, P. (2007). PCA-correlated SNPs for structure identification in worldwide human populations. PLoS Genet. 3, 1672–1686. doi: 10.1371/journal.pgen.0030160
Pavy, N., Parsons, L. S., Paule, C., MacKay, J., and Bousquet, J. (2006). Automated SNP detection from a large collection of white spruce expressed sequences: contributing factors and approaches for the categorization of SNPs. BMC Genomics 6, 174. doi: 10.1186/1471-2164-7-174
Pemberton, J. M., Slate, J., Bancroft, D. R., and Barrett, J. A. (1995). Nonamplifying alleles at microsatellite loci – a caution for parentage and population studies. Mol. Ecol. 4, 249–252.
Pritchard, J. K., Stephens, M., and Donnelly, P. (2000). Inference of population structure using multilocus genotype data. Genetics 155, 945–959.
Ronaghi, M., Uhlen, M., and Nyren, P. (1998). DNA sequencing: a sequencing method based on real-time pyrophosphate. Science 281, 363–365.
Simon, S. A., Zhai, J., Nandety, R. S., McCormick, K. P., Zeng, J., Mejai, D., and Meyers, B. C. (2009). Short-read sequencing technologies for transcriptional analyses. Annu. Rev. Plant Biol. 60, 305–333.
Sjögren, P., and Wyöni, P. I. (1994). Conservation genetics and detection of rare alleles in finite populations. Conserv. Biol. 8, 267–270.
Städler, T., Haubold, B., Merino, C., Stephan, W., and Pfaffelhuber, P. (2009). The impact of sampling schemes on the site frequency spectrum in nonequilibrium subdivided populations. Genetics 182, 205–216.
Swofford, D. L., and Berlocher, S. H. (1987). Inferring evolutionary trees from gene frequency data under the principle of maximum parsimony. Syst. Zool. 36, 293–325.
Tang, K., Fu, D. J., Julien, D., Braun, A., Cantor, C. R., and Koster, H. (1999). Chip-based genotyping by mass spectrometry. Proc. Natl. Acad. Sci. U.S.A. 96, 10016–10020.
Tautz, D. (1989). Hypervariability of simple sequences as a general source for polymorphic DNA markers. Nucl. Acids Res. 17, 6463–6471.
Tay, W. T., Behere, G. T., Batterhan, P., and Heckel, D. G. (2010). Generation of microsatellite repeat families by RTE transposons in lepidopteran genomes. BMC Evol. Biol. 10, 144. doi: 10.1186/1471-2148-10-144
Tsuchihashi, Z., and Dracopoli, N. C. (2002). Progress in high throughput SNP genotyping methods. Pharmacogenomics J. 2, 103–110.
Van’t Hof, A. E., Brakefield, P. M., Saccheri, I. J., and Zwaan, B. J. (2007). Evolutionary dynamics of multilocus microsatellite arrangements in the genome of the butterfly Bicyclus anynana, with implications for other Lepidoptera. Heredity 98, 320–328.
Vera, J. C., Wheat, C. W., Fescemyer, H. W., Frilander, M. J., Crawford, D. L., Hanski, I., and Marden, J. H. (2008). Rapid transcriptome characterization for a non-model organism using 454 pyrosequencing. Mol. Ecol. 17, 1636–1647.
Wanner, K. W., Nichols, A. S., Allen, J. E., Bunger, P. L., Garczynski, S. F., Lin, C. E., Robertson, H. M., and Luetje, C. W. (2010). Sex pheromone receptor specificity in the European corn borer moth, Ostrinia nubilalis. PLoS ONE 5, e8685. doi: 10.1371/journal.pone.0008685
Weber, J. L., and May, P. E. (1989). Abundant class of human DNA polymorphisms which can be typed using the polymerase chain reaction. Am. J. Hum. Genet. 44, 388–396.
Wiedmann, R. T., Smith, T. P. L., and Nonneman, D. J. (2008). SNP discovery in swine by reduced representation and high throughput pyrosequencing. BMC Genomics 9, 81. doi: 10.1186/1471-2156-9-81
Williams, L. M., Ma, X., Boyko, A. R., Bustamante, C. D., and Oleksiak, M. F. (2010). SNP identification, verification, and utility for population genetics in a non-model species. BMC Genomics 11, 32. doi: 10.1186/1471-2156-11-32
Wilson, A. F., and Sorant, A. J. (2000). Equivalence of single- and multilocus markers: power to detect linkage with composite markers derived from biallelic loci. Am. J. Hum. Genet. 66, 1610–1615.
Yamamoto, K., Narukawa, J., Kadono-Okuda, K., Nohata, J., Sasanuma, M., Suetsugu, Y., Banno, Y., Fujii, J., Goldsmith, M. R., and Mita, K. (2006). Construction of a single nucleotide polymorphism linkage map for the silkworm, Bombyx mori, based on bacterial artificial chromosome end sequences. Genetics 173, 151–161.
Keywords: single nucleotide polymorphism, performance, population genetics
Citation: Coates BS, Bayles DO, Wanner KW, Robertson HM, Hellmich RL and Sappington TW (2011) The application and performance of single nucleotide polymorphism markers for population genetic analyses of Lepidoptera. Front. Gene. 2:38. doi: 10.3389/fgene.2011.00038
Received: 19 April 2011;
Accepted: 10 June 2011;
Published online: 29 June 2011.
Edited by:
David William Galbraith, University of Arizona, USACopyright: © 2011 Coates, Bayles, Wanner, Robertson, Hellmich and Sappington. This is an open-access article subject to a non-exclusive license between the authors and Frontiers Media SA, which permits use, distribution and reproduction in other forums, provided the original authors and source are credited and other Frontiers conditions are complied with.
*Correspondence: Brad Steven Coates, 103 Genetics Laboratory, Corn Insects and Crop Genetics Research Unit, Agricultural Research Service, United States Department of Agriculture, Iowa State University, Ames, IA, USA. e-mail: brad.coates@ars.usda.gov