
- 1 Department of Biology, University of North Carolina at Charlotte, Charlotte, NC, USA
- 2 Department of Nutrition, University of North Carolina, Chapel Hill, NC, USA
- 3 Department of Genetics, University of North Carolina, Chapel Hill, NC, USA
- 4 Department of Cell and Molecular Physiology, University of North Carolina, Chapel Hill, NC, USA
The genetic basis of quantitative traits such as body weight and obesity is complex, with several hundred quantitative trait loci (QTLs) known to affect these and related traits in humans and mice. It also has become increasingly evident that the single-locus effects of these QTLs vary considerably depending on factors such as the sex of the individuals and their dietary environment, and we were interested to know whether this context-dependency also applies to two-locus epistatic effects of QTLs as well. We therefore conducted a genome scan to search for epistatic effects on 13 different weight and adiposity traits in an F2 population of mice (created from an original intercross of the FVB strain with M16i, a polygenic obesity model) that were fed either a control or a high-fat diet and half of which harbored a transgene (PyMT) that caused the development of metastatic mammary cancer. We used a conventional interval mapping approach with SNPs to scan all 19 autosomes, and found extensive epistasis affecting all of these traits. More importantly, we also discovered that the majority of these epistatic effects exhibited significant interactions with sex, diet, and/or presence of PyMT. Analysis of these interactions showed that many of them appeared to involve QTLs previously identified as affecting these traits, but whose single-locus effects were variously modified by two-locus epistatic effects of other QTLs depending on the sex, diet, or PyMT environment. It was concluded that this context-dependency of epistatic effects is an important component of the genetic architecture of complex traits such as those contributing to weight and obesity.
Introduction
It is now clear that complex quantitative traits such as body and organ weights and obesity have an extensive underlying genetic basis (Allison et al., 2003; Bell et al., 2005; Pomp et al., 2008). For obesity, for example, broad-sense heritability estimates in humans typically have been moderate or high in magnitude, ranging from about 40 to 80% (O’Rahilly et al., 2003; Bell et al., 2005; Musani et al., 2008). Consistent with this, increasing numbers of genes that influence obesity have been identified (Rankinen et al., 2006). Although some of these genes are responsible for syndromic and monogenic forms of obesity (Bell et al., 2005), the bulk of the findings are quantitative trait loci (QTLs) that have been mapped in linkage or association studies.
Beyond the single-locus effects of various weight and obesity QTLs discovered thus far, there is mounting evidence that they often exhibit epistasis. Significant epistatic interactions of QTLs affecting these sorts of traits have been found in several studies using intercross and backcross populations of mice (Brockmann et al., 2000; Cheverud et al., 2001; Yi et al., 2004; Stylianou et al., 2006). Testing for epistasis in human populations inherently is more difficult, but significant interactions of genes influencing obesity have been reported (Dong et al., 2003; Stone et al., 2006; Loos et al., 2007). To the extent that epistasis impacts complex quantitative traits, we will need to view the effects of individual genes affecting these traits in the context of the effects of other modifying genes located throughout the genome.
The context-dependency of weight and obesity gene effects applies to other factors as well, such as the sex of the individuals and their dietary environment (Pomp et al., 2008). Many studies have discovered sex by QTL interactions that suggest different genotypic effects in the sexes, typically with the QTL in only one sex affecting a given trait (for example, Cheverud et al., 2001; Leamy et al., 2010). With regard to dietary effects, Taylor and Phillips (1997) discovered QTLs on chromosomes 9 and 15 that promote obesity in mice fed a high-fat diet. More recently, investigators have used both low- and high-fat diets in the same population to search for QTL by diet interactions that suggest the presence of genes for dietary response. These kinds of interactions have been found by Cheverud and colleagues for a variety of obesity-related traits in recombinant inbred and intercross populations of mice generated from an original cross of the Large (LG/J) and Small (SM/J) strains (Cheverud et al., 2004, 2011; Ehrich et al., 2005).
Gordon et al. (2008a) analyzed an F2 intercross population of mice fed either a control or a high-fat diet, and discovered QTLs on chromosomes 2, 6, 8, 9, 10, 11, and 13 that affected a number of weight and adiposity traits. Seven of these QTLs also exhibited significant interactions with sex and 17 exhibited significant interactions with diet. In addition, half of the mice in this population possessed a PyMT transgene that caused the development of mammary cancer, and this allowed these investigators to test for QTL × PyMT interactions as well. However, no significant interactions of this type were found, suggesting that the effects of the QTLs controlling the weight and adiposity traits were not altered by PyMT expression or by the presence of mammary tumors (Gordon et al., 2008a).
Given these results indicating that single-locus additive and dominance effects of QTLs can differ depending on various factors, it seemed important to ask whether this might be true for two-locus (epistatic) effects as well. We therefore made use of the same data in the F2 population of mice analyzed by Gordon et al. (2008a) to conduct a genome scan for epistasis affecting the weight and adiposity traits, and to test for interactions of epistasis with sex, diet, and PyMT. We wanted to see whether we could discover pairs of QTLs interacting differentially on each of the traits depending on the sex and dietary environments, and if present, what sorts of trends they might exhibit. And given that Gordon et al. (2008a) found no significant interactions of single-locus QTL effects with PyMT, it was of particular interest to see whether our results might yield significant epistatic × PyMT interactions. If so, this would suggest that there are epistatic effects on these traits that vary depending on the presence or absence of PyMT expression. It seemed reasonable to expect to detect these interactions, especially since PyMT increased body weight but decreased body fat in this population of mice (Gordon et al., 2008a). Full genome scans designed to detect interactions of epistasis with other factors such as sex, diet, and cancer susceptibility are extremely rare, and our study documents a number of these interactions that add to our knowledge of the genetic architecture of weight and adiposity traits in mice.
Materials and Methods
The Population and Traits
All mice used in this study were from an F2 population (Gordon et al., 2008a) generated from an intercross of two inbred strains, M16i and FVB/NJ-TgN(MMTV-PyMT)634Mul (hereafter FVB). The M16i strain was derived from the M16 line produced by long term selection for 3–6 week body weight gain (Allan et al., 2004, 2005) and FVB is an inbred line of mice containing the PyMT transgene that causes development of mammary tumors and subsequent pulmonary metastases (Guy et al., 1992). All F2 mice were weaned at 3 weeks of age and randomly allocated (within PyMT genotype and sex) into either a group fed a high-fat diet or a group fed a matched-control-fat diet at 4 weeks of age (Gordon et al., 2008a).
A total of 13 body weight and adiposity-related traits were measured in these mice up to the time of sacrifice (11 weeks for females, 14 weeks for males). These traits included body weight at 3, 6, and 9 weeks of age and at sacrifice (3W, 6W, 9W, SW), percent of fat at 7 weeks of age and at sacrifice (PF7, PFS), percent of lean body mass at 7 weeks of age and at sacrifice (LM7, LMS), liver weight at sacrifice and as a percentage of body weight (LIV, PLIV), total fat at sacrifice (FS), and fat pad weight (epididymal in males, perimetrial in females without PyMT) at sacrifice and as a percentage of body weight (FP, PFP). Altogether, phenotypic data were available for a total of 538 F2 mice, including 261 fed the control diet and 277 fed the high-fat diet. Further details regarding the rearing of the mice and the measurement of all traits are given in Gordon et al. (2008a).
Genotyping of all F2 mice was done with SNPs from DNA obtained from tail samples. Originally this was accomplished for 384 SNPs that were selected because they were expected to be informative (polymorphic) between the M16i and FVB strains, and to provide relatively even coverage of all 19 autosomes. Some proved not to be polymorphic, however, and some adjacent markers were redundant (showed the same patterns of alleles between the strains) and these were eliminated. In addition, 30 SNPs showed segregation distortion (deviation from the expected 1:2:1 F2 genotypic ratio) and were omitted (Gordon et al., 2008a). As a result, a total of 124 SNPs were available and used to create a linkage map via Map Manager QTXb20 (Manly et al., 2001). Gordon et al. (2008a) provide a list of these SNP markers with their locations and intermarker distances in centimorgans (average = 10.7). This number of SNPs was considered sufficient since it has been shown that in these kinds of populations, the power of detecting QTLs is essentially the same for a marker spacing of 10 cM as it is for a more saturated map (Darvasi et al., 1993).
Epistasis Analyses
Prior to the epistasis analyses, we first examined the distributions of the 13 weight and adiposity traits for normality. This was accomplished by generating residuals from a mixed model that included dam and replicate litters as random factors, sex, diet, and PyMT (and their interactions) as fixed classification factors, and age as a covariate for those traits measured at sacrifice. Two traits, 3W and PFP exhibited normality, but the remaining 11 traits were either marginally normal (assuming a 1% significance level and using the sequential Bonferroni procedure) or were significantly non-normal (Kruskal–Wallis normality tests). We therefore logged these 11 traits, and in all cases this was successful in promoting normality (P > 0.05 in all tests for normality).
For the epistasis scans, it was first necessary to calculate genotypic index values for each of the 19 autosomes. We therefore assigned additive genotypic index values of −1, 0, and +1 and dominance genotypic index values of −0.5, +0.5, and −0.5 for FVB homozygotes (FF), M16i/FVB heterozygotes (MF), and M16i homozygotes (MM), respectively, at the site of each SNP marker. We also imputed genotypic index values for all locations 2 cM apart between flanking SNP markers on each chromosome using the recombination percentages given in Gordon et al. (2008a) and the equations in Haley and Knott (1992).
We conducted a scan for epistatic interactions affecting the weight and adiposity traits among all pairs of locations 2 cM apart for each of the 171 possible pairs of 19 autosomes. This search was implemented with the MIXED procedure in SAS (SAS, version 9.2; SAS Institute, Cary, NC, USA). The model used included two random classification factors, replicate litters and dams (Gordon et al., 2008a), and was as follows:
Here Y is the dependent variable (trait), and the independent variables are the additive (Xa1 and Xa2) and dominance genotypic index values (Xd1 and Xd2) from each of the two chromosomes. Also included are all four pairwise products of the additive and dominance genotypic index values (Xa1*Xa2, Xa1*Xd2, Xd1*Xa2, Xd1*Xd2), and ε is the residual. The model also included sex and diet to adjust for their effects, and because roughly one-half of the F2 mice carried the PyMT transgene (Gordon et al., 2008a), PyMT was included as well. In addition, age was used as a covariate for those traits measured at sacrifice to adjust for potential effects due to age differences.
We subtracted the −2 ln likelihood value generated from this full model at each pair of sites from the comparable value obtained in a reduced model that included only the dam, litters, sex, diet, and PyMT terms (and where appropriate, age). This difference was evaluated using a chi-square test with 8 degrees of freedom, and its associated probability transformed into a LOD score = log10(1/probability). The highest LOD score for each combination of chromosomes was considered significant if it exceeded the 5% genomewise threshold value (see below). Where significance in the full model occurred, we tested for epistasis by comparing the likelihood values of the full model to a reduced model containing all except the four epistasis terms. A chi-square test (4 d.f.) again was used to evaluate the difference in these likelihood values, and if significant (P < 0.05), epistasis was assumed to be present. For each trait, all combinations showing significant epistasis also were tested for interactions with sex, diet, or PyMT (see below); and if significance occurred, only the interaction was reported.
For those combinations of sites on pairs of chromosomes suggesting epistasis, we estimated the four orthogonal epistatic components (aa, ad, da, and dd) from the coefficients associated with the pairwise products of the additive and dominance genotypic index values (see Model 1), and tested them for significance (P < 0.05) with single degree-of-freedom F-tests. Additive by additive epistasis (aa) for two loci (say A and B) occurs when the single-locus additive genotypic value (difference between the two homozygotes) at one locus (A) differs depending on what genotype (B/B, B/b, or b/b) is at another locus (B) and vice versa. Additive by dominance epistasis (ad) occurs when the single-locus additive genotypic value for a locus A differs depending on the genotype at another locus B whereas the single-locus dominance genotypic value (difference between the heterozygous and mid-homozygote values) at B differs depending on the locus A genotype (and vice versa for dominance by additive epistasis, da). Dominance by dominance epistasis (dd) occurs when the single-locus dominance genotypic value at locus A differs depending on the genotype at locus B and vice versa (Cheverud, 2000).
Once all epistatic components (aa, ad, da, and dd) were calculated for all pairwise QTL interactions that reached significance, it was possible to calculate the contribution of epistasis to the total variance of the traits. To accomplish this for a given trait, we first calculated the variance of residuals generated by an epistatic model that included sex, diet, PyMT, dam, and litter terms (and where appropriate, age) and all epistatic components significant for that trait, as well as the variance of residuals in a reduced model that included sex, diet, PyMT, dam, and litter (and age where appropriate). The percentage contribution of epistasis to the total phenotypic variance of each trait then was calculated as follows: 100 × (variance reduced model − variance epistasis model)/variance reduced model.
Interactions of Epistasis with Sex, Diet, and PyMT
We also performed a full genome scan at all pairwise combinations of locations to search for interactions of epistasis with diet. This was done for all traits except 3W since mice started the control or high-fat diet at 4 weeks of age after weight at 3 weeks was measured. In these scans, the basic model was as above but with the addition of the four interactions:
We tested this model for significance by comparing its −2 ln likelihood value with that from a model using only dam, litters, sex, diet, and PyMT terms (also age where appropriate). The difference between these likelihood values was evaluated with a chi-square statistic associated with 12 d.f., and was considered significant if the LOD score calculated from the probability exceeded the genomewise threshold level. Where this occurred, epistasis by diet interactions were tested by comparing the full model above with a reduced model not containing the four epistasis × diet interaction terms. Where chi-square tests (with 4 d.f.) of these differences generated a probability less than 0.05, the interactions of diet and epistasis were collectively considered to be statistically significant. Significant interactions were assumed to represent epistasis for dietary response, or epistasis causing differences in effects in mice fed the control versus the high-fat diet.
When significant epistasis × diet interactions were found, we investigated the nature of this dietary response by testing for epistasis separately in each of the two (control and high-fat) diet groups. We used model 1 and the same procedure already described, calculated LOD scores in each group, and regarded any LOD score of 1.30 (P < 0.05) or higher as statistically significant. This allowed us to determine whether the epistatic effects of the particular combination of QTLs were acting primarily in one diet and not the other, or whether they were acting differentially by showing either remaining possible combination (both diet groups with significant LOD scores, or both groups with non-significant LOD scores).
We also ran analyses for each trait with a model identical to (2) above except that PyMT was substituted in place of diet in each of the four interactions to test for potential interactions of epistasis with PyMT. Where found, we tested for epistatic effects separately in mice with and without the PyMT gene. While the primary goal of our study was to detect epistatic effects on the weight and adiposity traits, and especially effects that differed in the two dietary and PyMT environments, we also were interested in differential effects of epistasis in the separate sexes. We therefore used this same approach and tested for sex by epistasis interactions; if present, we tested for epistatic effects separately in males and females.
Where significant epistasis × sex interactions occurred, we tested for interactions of epistasis with diet and PyMT as well. Similarly, for significant epistasis × diet interactions, we tested for interactions of epistasis with both sex and with PyMT. And for all significant epistasis × PyMT interactions, we tested for interactions of epistasis with both sex and with diet.
Threshold Level of Significance
With the hundreds of epistasis and epistasis interaction tests conducted for each of the traits, many were expected to reach conventional levels of significance because of chance alone. To determine an appropriate threshold level of significance, therefore, we first used the method advocated by Li and Ji (2005) to estimate the effective number of independent markers on each chromosome. Because of linkage disequilibrium between loci on each chromosome, these numbers generally were less than the actual number of markers and in fact varied from 2 (chromosome 16) to 7 (chromosome 1). We then estimated the total number of independent epistasis tests by the sum of the cross-products of these effective numbers of markers for all 171 pairs of chromosomes. This sum was 3172 and the 5% genomewise threshold level therefore was calculated as 0.05/3172 = 0.0000157, equivalent to a LOD score of 4.80. We used this LOD score as the threshold value in our tests of significance of all full models (8 terms for epistasis, 12 terms for epistatic interactions with sex, diet, and PyMT).
This general approach to determine threshold levels of significance for epistasis has been used in several previous investigations (for example, Leamy et al., 2009). It should be noted that the threshold levels used by Gordon et al. (2008a) in their previous study were determined by a traditional permutation approach. These thresholds differed for each trait, and although actual values were not provided, their listing of descriptive QTL statistics suggests that in some cases they were as low as 2.62 (Gordon et al., 2008a).
Results
A total of 140 epistatic interactions were found to significantly affect the body weight and adiposity traits, a summary of which is provided in Table 1. Over half (76) of these interactions influence just four weight traits (6W, 9W, SW, and LIV), whereas the fewest interactions were found for PLIV, FP, and PFP. Chromosome 2 is most heavily involved in these interactions (47 occurrences), followed by chromosomes 10 (32), 9 (26), 11 (23), and 6 (22). In fact these five chromosomes comprise over half (150) of the 140 × 2 = 280 total chromosomes in these interactions. The numbers of significant epistatic genotypic values vary considerably among the traits. Over all traits, the distribution of aa, ad/da, and dd values (37, 99, 59) follows the expected 1:2:1 ratio (P = 0.07 in a chi-square test). The percentage contribution of epistasis to the total phenotypic variance varies from 4.63% for FP (one interaction) to a high of 33.8% for LIV, averaging 17.7% over all traits. In addition, the total impact of epistasis is greater for the weight (22.5%) than for the adiposity traits (average = 10.0%).
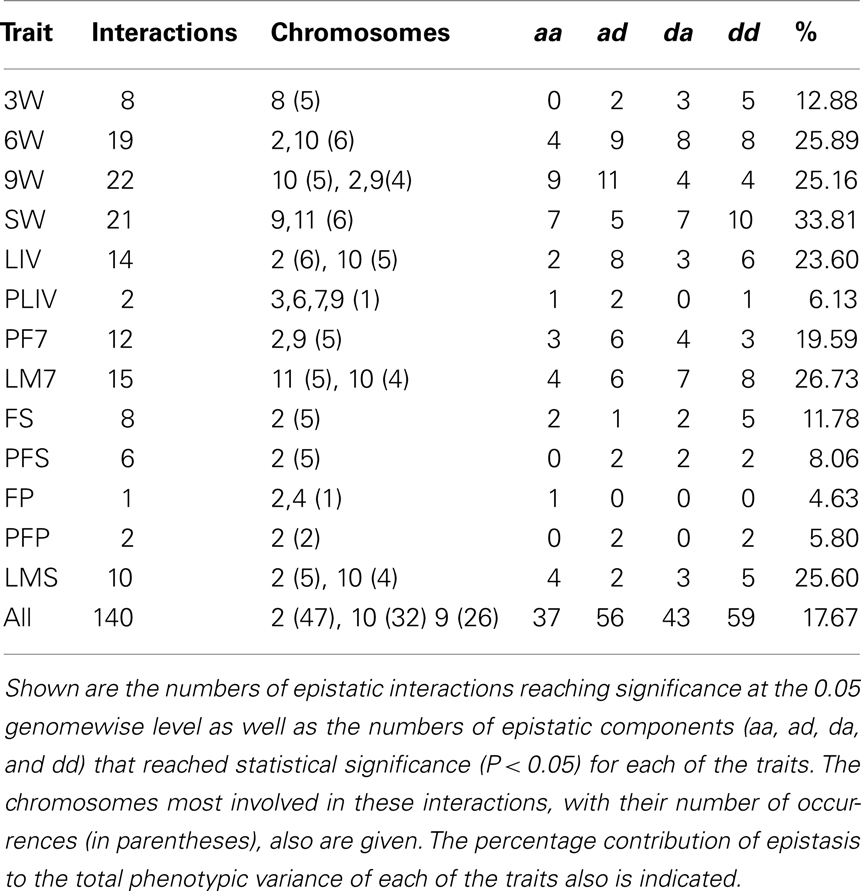
Table 1. Summary of epistatic interactions affecting the weight and adiposity traits.
Figure 1A illustrates an example of primarily dominance by dominance (dd) epistatic effects on 6W generated by QTLs on chromosomes 11 and 13. This figure depicts the values for each of the nine possible genotypes for the two QTLs combined, as predicted by our epistasis model (1). These values were calculated from the coefficients produced in the epistasis solutions and the expectations given by Wolf et al. (2005) for two-locus epistatic interactions. Note that the chromosome 11 QTL shows overdominance (heterozygote greater than either homozygote) when associated with the homozygous genotypes on chromosome 13, but underdominance when associated with the heterozygous genotype on chromosome 1. Figure 1B illustrates primarily additive by additive (aa) effects on FS from a pair of QTLs on chromosomes 2 and 7. Note that the additive effect (difference between the homozygotes) of the QTL on chromosome 2 is negligible when associated with the chromosome 7 LL genotype, but pronounced when associated with the chromosome 7 HH genotype.
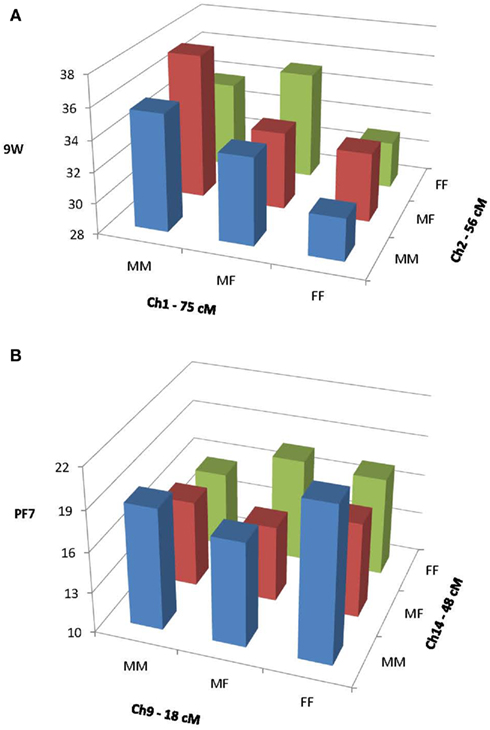
Figure 1. Epistatic interactions between QTLs on chromosomes 1 and 2 affecting 9W (A) and between QTLs on chromosomes 9 and 14 affecting PF7 (B). MM, M16i/M16i homozygotes; MF, M16i/FVB heterozygotes; and FF, FVB/FBV homozygotes.
A number of interactions of epistasis with sex, diet, and PyMT also were found to significantly affect the weight and adiposity traits (summarized in Table 2). A total of 116 significant sex by epistasis interactions were discovered, with more interactions of epistasis with diet (130; 3W excluded) and with PyMT (135). The total numbers of interactions occurring for the individual traits range from 0 (PyMT × epistasis for PLIV) to 28 (diet × epistasis for 6W), with the weight traits (especially 6W) and FS being most affected. The numbers of epistatic interactions for the 13 traits are quite consistent among the three interaction types (P < 0.01 for all three pairwise Spearman’s correlations). A number of these interactions are common; for example, among the sex by epistatic interactions, four combinations are significant for PyMT by epistatic interactions and a different four combinations are significant for diet by epistatic interactions. Similarly, a total of 13 of the diet by epistasis interactions show significant sex or PyMT by epistasis interactions, and 14 of the PyMT by epistasis interactions show significant sex or diet interactions with epistasis.
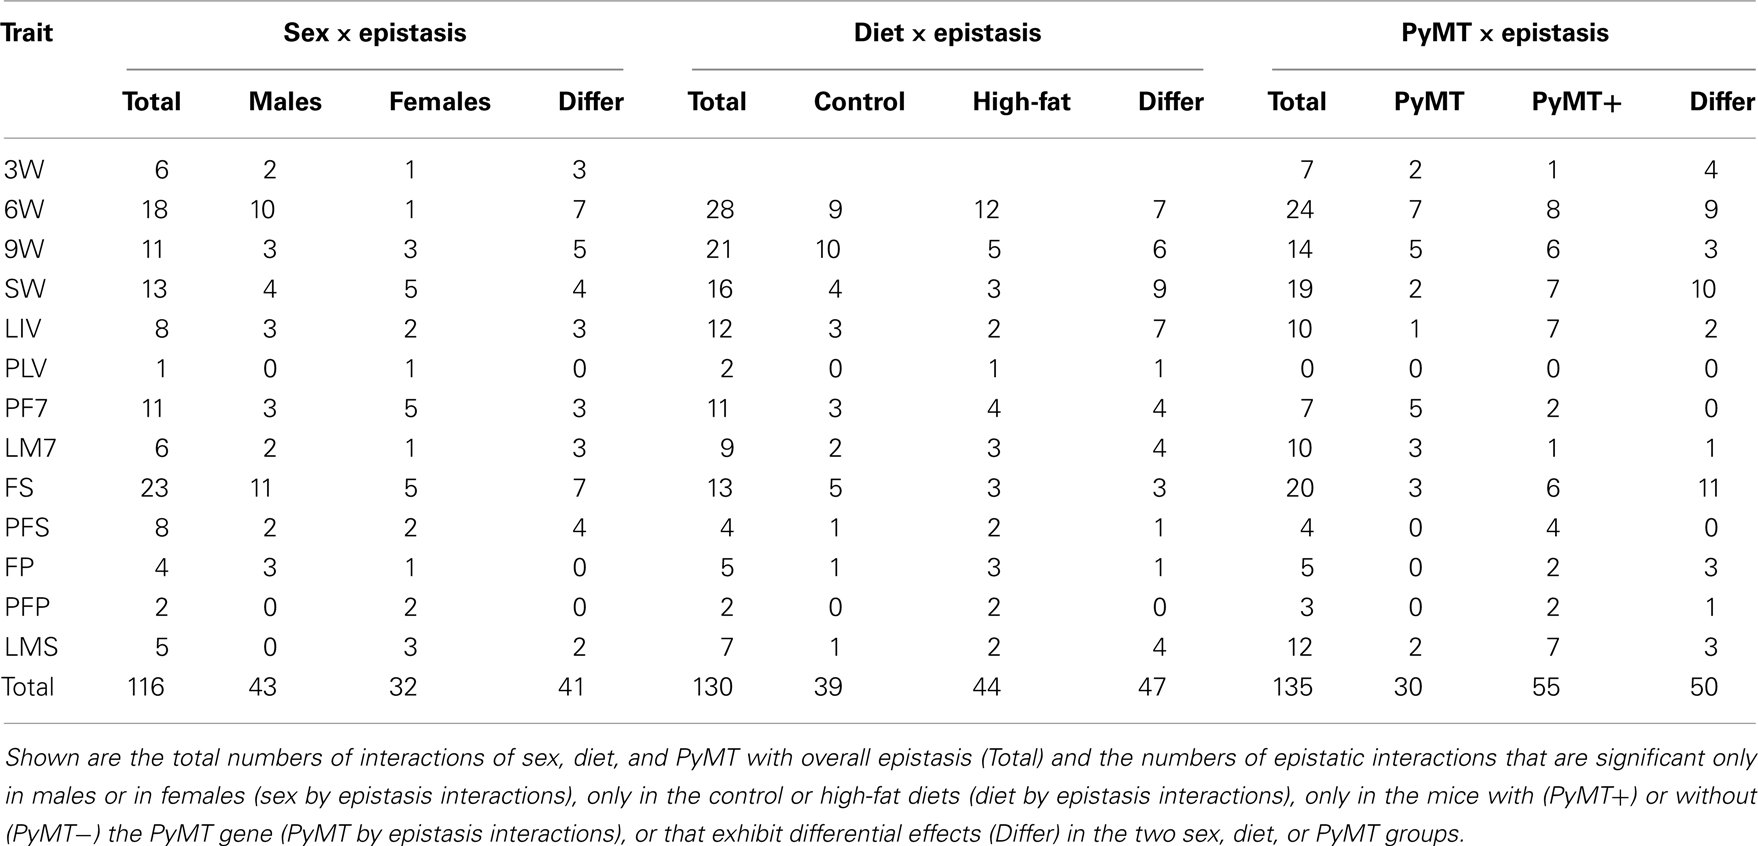
Table 2. Summary of sex, diet, and PyMT by epistasis interactions affecting the weight and adiposity traits.
Table 2 also gives the numbers of significant epistatic interactions affecting each trait in the separate sex, diet, and PyMT groups. At the locations of the sex by epistasis interactions, significant epistasis among all traits occurs at about the same frequency in males compared with females (43:32; P = 0.20 in a chi-square test of a 1:1 ratio). There also are 56 instances where differential effects occurred (total occurrences where both sexes exhibited significant epistasis and where both sexes show non-significant epistasis). Epistasis also significantly affects the weight and adiposity traits about the same in mice fed the high-fat compared to the control diet (P = 0.58), although a substantial number (47) of differential epistatic effects occur between the two dietary environments as well. With regard to the two PyMT groups, however, epistasis clearly occurs at a higher frequency in mice with the PyMT gene (PyMT−:PyMT+ 30:55). This trend is particularly noticeable for the eight traits measured at sacrifice (8:35, PyMT−:PyMT+; P < 0.01), but not for the five traits measured at earlier ages (22:20, PyMT−: PyMT+; P > 0.05). In addition, epistasis also exhibits differential effects between these two PyMT groups in a large number of instances (50).
Figure 2A illustrates epistatic effects of two QTLs on 6W in the separate sex groups. This figure includes a bar diagram that shows the magnitude of the epistatic components generated by this interaction, and a line diagram that shows how epistasis affects the relationship among the nine genotypic values. In this figure it can be seen that an interaction of QTLs on chromosomes 10 and 13 produces a significant dominance by dominance (dd) epistatic effect on 6W in males, but not in females. The line diagram also shows that in males, the chromosome 13 QTL exhibits complete dominance or overdominance when associated with both homozygotes from the chromosome 10 QTL, but underdominance when associated with the heterozygous chromosome 10 QTL, whereas females show mostly partial dominance throughout.
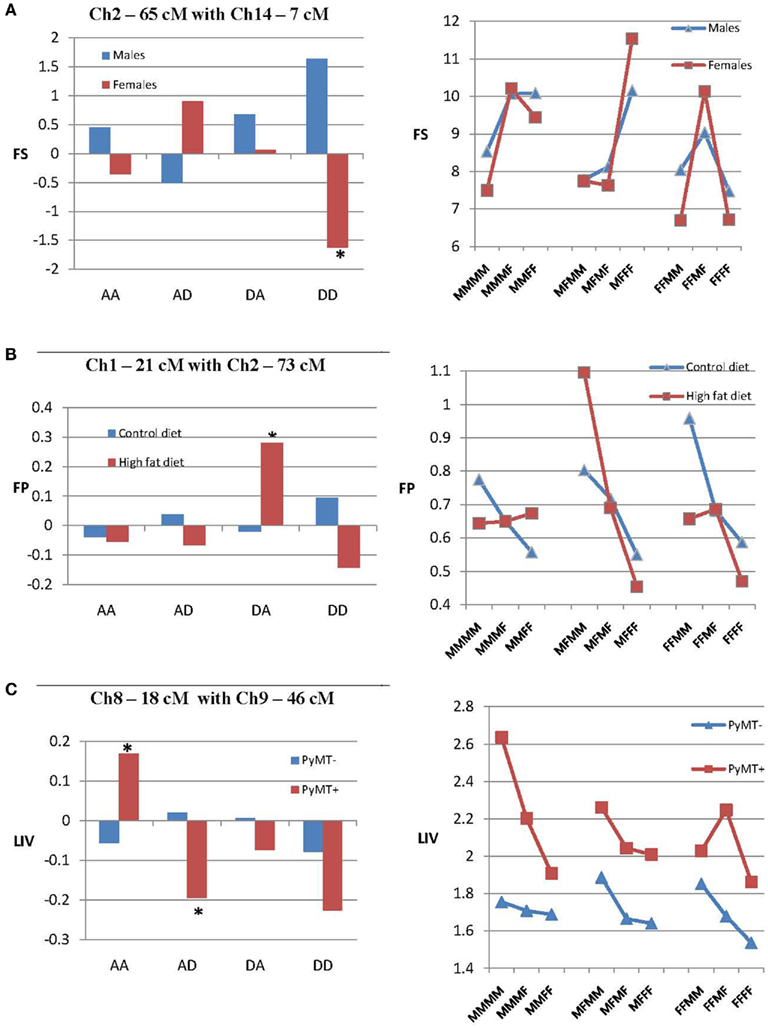
Figure 2. Epistatic effects in the separate sexes (A), diets (B), and PyMT groups (C). Each example includes a bar diagram that shows the epistatic effects of two QTLs on the trait in each sex, diet, or PyMT group (*P < 0.05). There also is a second line diagram that shows how epistasis in each group affects the relationship among the nine genotypic values (M, gene from M16i line; F, gene from FVB line) generated from the interaction of the two QTLs. (A) Illustrates dd epistatic effects of QTLs on chromosomes 10 and 13 on 6W that are significant only in males. (B) Illustrates epistatic effects of chromosome 2 and 3 on FP that are significant only in mice fed the high-fat diet. (C) Illustrates epistatic effects of chromosomes 3 and 9 on FS that are significant only in mice with the PyMT gene.
Figure 2B shows the effects of an interaction of QTLs on chromosome 2 and 3 that exhibited significant ad and dd epistasis affecting FP, but only in mice fed the high-fat diet. This resulted in additive effects (differences between homozygotes) for the chromosome 2 locus that are relatively small when associated with the chromosome 3 homozygotes, but quite large when associated with the chromosome 3 heterozygotes. Also for mice fed the high-fat diet, the chromosome 3 QTL shows overdominance when associated with the MM and MF genotypes on chromosome 2, but underdominance when associated with the FF genotype on chromosome 2.
Figure 2C illustrates the effect of epistasis of QTLs on chromosomes 3 and 9 that significantly affect FS, but only in mice with the PyMT gene. Only da epistatic effects are significant in PyMT+ mice, and in this specific group, these effects translate into large additive effects in the chromosome 9 QTL that vary considerably depending on the genotype of the chromosome 3 QTL, and vice versa. Also, it can be seen that the chromosome 3 QTL exhibits underdominance when associated with the MM and MF genotypes of the chromosome 9 QTL, but overdominance when associated with the heterogous chromosome 9 genotype.
It is useful to know which chromosomes were most involved in the epistatic interactions, and whether they were similar for all epistatic interactions with sex, diet, and PyMT. We therefore tallied the numbers of all of these epistatic interactions for each individual chromosome across all 13 weight and adiposity traits (Table 3). Since there were two chromosomes involved in each epistatic interaction, the total number of chromosomes involved is twice that of the total number of interactions of chromosomal pairs previously listed (Tables 1 and 2). For the epistatic effects exclusive of epistatic interactions with sex, diet, or PyMT, chromosome 2 is most heavily involved, followed by chromosomes 10, 9, 11, and 6. The pattern is quite similar for the interactions of epistasis with sex and diet, with chromosomes 2, 9, and 10 being most heavily involved. QTLs on these three chromosomes also play major roles in many of the PyMT by epistasis interactions as well, except that QTLs on chromosome 6 also also are prominent (second most frequent). Spearman’s correlations of the numbers of epistatic interactions among the 19 chromosomes for each pair of these four categories of epistasis vary from 0.49 to 0.75 and all are statistically significant (P < 0.05). Thus among these four categories of epistasis, there is considerable commonality of the chromosomes involved in the epistatic interactions.
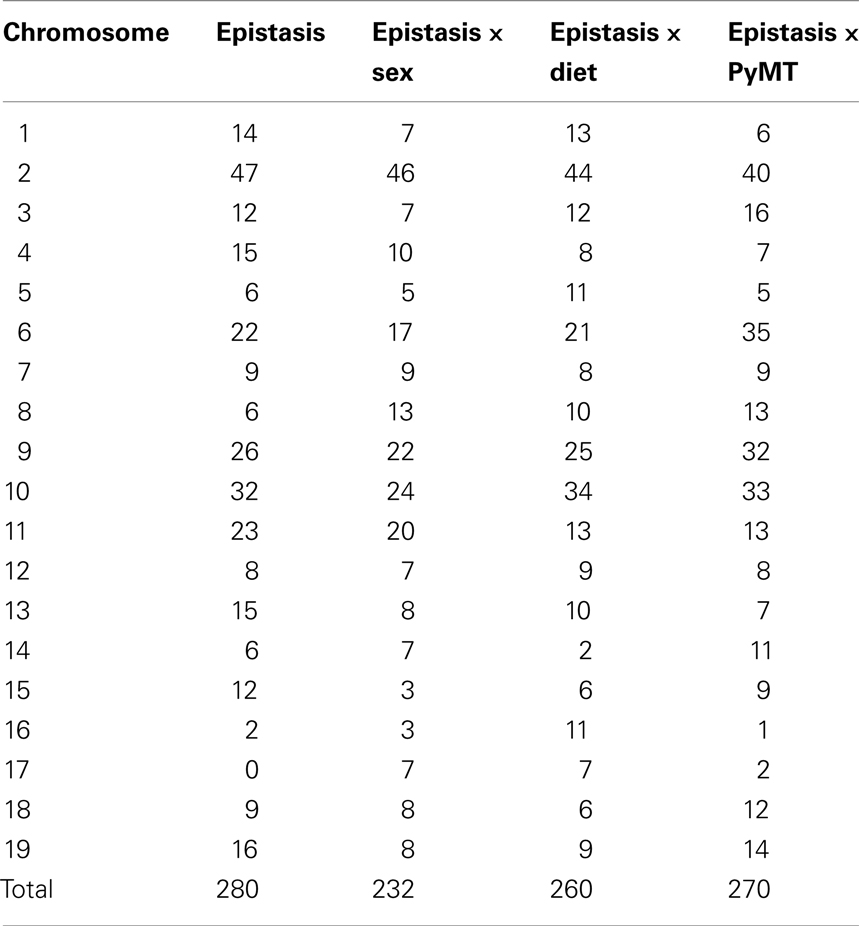
Table 3. Numbers of epistasis and the epistatic interactions with sex, diet, and PyMT on each of the 19 chromosomes that significantly affected the weight and adiposity traits.
Discussion
Epistatic Effects on Weight and Adiposity
The basic goal of this study was to discover whether epistasis affected the weight and adiposity traits in this population of mice, and especially whether epistatic patterns would be affected by the sex, dietary, or PyMT environment. Given previous reports of epistasis for these sorts of traits (Brockmann et al., 2000; Cheverud et al., 2001; Yi et al., 2004; Stylianou et al., 2006), we expected to find significant epistasis in our population of mice as well. And we certainly did, uncovering a total of 140 epistatic interactions affecting these traits (Table 1). Gordon et al. (2008a) discovered 18 QTLs (excluding QTL by sex and QTL by diet interactions) for these same traits among the 19 autosomes (18/19 = 0.95), a proportion which is not significantly different (chi-square = 0.93, P = 0.34) from 140 epistatic interactions among the 171 chromosomal pairs. This suggests that the extent of epistasis affecting the weight and adiposity traits is at a level comparable to that of single-locus effects of QTLs on these traits.
The distribution of epistatic interactions among the traits was not uniform because some traits, especially the body weights, were affected more than others. One apparent consequence of this was that the 14 interactions significantly affecting LIV decreased to only two when this trait was expressed as a percentage of body weight at sacrifice. This suggests that the bulk of the epistasis for LIV was influencing overall size more so than liver variation per se. Consistent with this, 8 of the 14 epistatic interactions affecting LIV are in roughly the same locations as epistatic (including epistasis by sex and by diet) interactions affecting SW as well, and thus may be common to both traits. The number of epistatic effects affecting body weight increased as the mice aged, a trend also found by Yi et al. (2006) in their epistatic analyses of body weights in a backcross population of mice.
It is of interest to determine the extent to which epistatic interactions might involve QTLs for the weight and adiposity traits previously mapped. Gordon et al. (2008a) identified a total of nine QTLs affecting these traits that were located on chromosomes 2 (two QTLs), 6, 8, 9 (two QTLs), 10, 11, and 13. The QTLs on chromosomes 8 and 13 each affected only a single trait (3- and 6-week weight, respectively) whereas the remaining seven QTLs on chromosomes 2, 6, 9, 10, and 11 each affected multiple traits. The pleiotropic QTLs on these five chromosomes included five weight QTLs that affected body and liver weights and lean mass, and two adiposity QTLs that primarily affected the remaining adiposity traits (Gordon et al., 2008a). We found that these same five chromosomes also were generally those most involved in the epistatic interactions (recall Table 3), suggesting that the chromosomes identified previously by Gordon et al. (2008a) play major roles in the epistatic interactions affecting these traits. However, it should be noted that most of these instances of epistasis involve one of these five chromosomes with a partner not among these five; only 18 interactions involve chromosome pairs in which both are among these five.
While the five chromosomes listed above commonly harbor QTLs involved in both single- and two-locus (epistatic) effects, it is necessary to examine the locations of the epistatic QTL pairs on these chromosomes to see whether they match those of the QTLs affecting the weight and adiposity traits identified by Gordon et al. (2008a). The results of this examination for the chromosome most heavily involved in epistasis, number 2, are instructive in this regard. A tally of the 47 epistatic interactions with chromosome 2 shows that 28 of 29 involve a QTL in the region from 44 to 70 cM affecting 3W, 6W, 9W, SW, LIV, LM7, or LMS. Further, when the same pair of chromosomes affects two or more of the weight or lean mass traits, the location of the QTL on the chromosome 2 partner is usually quite similar. For example, a QTL on chromosome 2 (48–50 cM) interacts with a QTL on chromosome 6 at 40 cM to affect both 6W and LMS. This suggests that these two interactions in fact involve the same QTLs that are exhibiting epistatic pleiotropic effects (see Wolf et al., 2005) on both traits. The remaining 18 interactions involve a QTL(s) on chromosome 2 in the region from 72 to 79 cM and affect PF7, FP, FS, PFS, or PFP. These results precisely parallel the pattern of effect and locations for the two QTLs on this chromosome discovered by Gordon et al. (2008a), the more proximal being a weight QTL affecting the body and liver weights and lean mass and the more distal being an adiposity QTL affecting the adiposity traits. Similar trends hold for the other chromosomes, so it therefore seems likely that many of the epistatic interactions primarily involve the seven major QTLs identified by Gordon et al. (2008a).
It is interesting that the common epistatic interactions affecting the weight and lean mass trait set or module are mostly separate from those affecting the adiposity trait module. This certainly was the case for the single-locus effects of these seven QTLs exhibiting pleiotropy, with only one QTL on chromosome 11 also affecting a trait (LMS) that was not part of the weight and lean mass trait module (Gordon et al., 2008a). Independence of the single-locus effects of pleiotropic QTLs on such trait modules that develop from different physiological pathways is a consistent finding (Cheverud et al., 1996, 1997; Leamy et al., 1999), and our results suggest that this applies to two-locus epistatic effects as well. Thus the effects of either the weight or the adiposity QTLs (Gordon et al., 2008a) may be modified by their interactions with other QTLs, but they mostly still affect the same suite of traits. Whether this kind of result might be generally true is not clear, although Cheverud et al. (2001) found that epistatic effects of adiposity QTLs and of tail length QTLs in an F2 population of mice also tended to be independent.
We assessed the magnitude of effects of the epistatic interactions on the weight and adiposity traits primarily by calculating their percentage contribution to the total variation in these traits. The contributions of the individual epistatic interactions averaged 2.7%, or about one-half of the 5.4% average for the single-locus effects of the weight and adiposity QTLs discovered by Gordon et al. (2008a). The magnitude of these kinds of estimates often is similar or even higher than that from single-locus effects (for example, Cheverud et al., 2001), so our estimates appear to be conservative and not inflated. Further, they are quite similar to those (average = 2.45%) estimated by Yi et al. (2006) for comparable traits in a backcross mouse population. Given the number of significant epistatic interactions affecting the weight and adiposity traits in our F2 mouse population, their cumulative effect clearly was considerable. Thus over all interactions, we estimated that epistasis contributed on average about 18% of the total variance in the traits (Table 1). These estimates tended to be greater for the weight traits (average = 22.5%), but this was not surprising because these traits were affected by the greatest number of epistatic interactions. The average impact of epistasis on the adiposity traits was only 10%, but this was still substantial and in fact did not even include the epistatic interactions with sex, diet, or PyMT.
Sex-Specific Epistatic Effects
We discovered 116 significant interactions of epistasis with sex affecting the weight and adiposity traits, nearly as many as the 140 significant epistatic interactions. This suggests that in this population, epistatic effects of QTLs are heavily influenced by the sex of the mice. This was particularly true for traits such as FS that was affected by 8 epistatic interactions, but by 23 epistasis by sex interactions. This general finding might also apply to other populations as well although studies performing a full genome search for sex by epistatic interactions are almost non-existent. A rare exception is that by Wolf et al. (2006) who uncovered several significant sex by epistasis interactions affecting organ weights and especially limb lengths in a backcross mouse population.
It was not surprising that the analysis of epistasis in the separate sexes at the locations of the sex by epistasis interactions revealed that the majority of instances (75 of 116) showed significant epistasis in one sex but not the other. Sex-specific QTLs have been found in many studies (for example, Cheverud et al., 2001; Ehrich et al., 2005; Leamy et al., 2010; Nehrenberg et al., 2010), including one instance of a female-specific QTL for PFS in this same population of mice (Gordon et al., 2008a). In addition, there have been a few reports of epistatic interactions affecting various traits in one sex only. For example, Penrod et al. (2011) found several interactions among loci in a Ghanaian population of humans that significantly affected tissue plasminogen activator levels in males but not females, and vice versa. Also, Ivakine et al. (2006) demonstrated that two loci on chromosome 11 in mice displayed an epistatic interaction affecting type 1 diabetes susceptibility in females, but not in males.
The remaining instances of sex by epistasis interactions that showed differential effects in the two sexes were perhaps more interesting. Thirty-one of the 41 instances involved pairs of QTLs that showed no significance in either males or females, but the epistatic effects tended to differ between sexes. The same typically was true for pairs of QTLs that both showed significance. Loci with nullifying epistatic components such as these may be missed in an epistasis scan that does not search for sex by epistasis interactions.
Diet-Specific Epistatic Effects
We found a total of 130 significant diet by epistasis interactions, this being only slightly fewer than the number of epistatic interactions affecting the weight and adiposity traits. Adding the 116 sex by epistasis interactions, this total of 246 represents 64% of the total epistatic effects (excluding interactions of epistasis with PyMT), and is comparable (P > 0.05) to the value of 53% for single-locus effects of QTLs found by Gordon et al. (2008a). Thus the majority of the epistatic interactions we discovered exert their effects on the weight and adiposity traits variably depending on the sex of the mice or their dietary environment. Cheverud et al. (2011) discovered that an even higher proportion (90%) of the QTLs affecting various obesity traits in an advanced intercross population of mice significantly interacted with sex, diet, or with both sex and diet. It therefore seems reasonable to expect that both single- and two-locus effects of QTLs influencing these sorts of traits will often be highly context-dependent.
Significant epistasis for the weight and adiposity traits occurred about equally in mice fed the control (39) and high-fat diet (44), whereas Gordon et al. (2008a) found that single-locus effects were more numerous in mice fed the control rather than the high-fat diet. This suggests that the expression of single- and two-locus effects of QTLs may vary depending on the different dietary environments. As an example, Gordon et al. (2008a) found a QTL on chromosome 11 (37 cM) that affected PF7 significantly only in mice fed the control diet. But we also found a QTL on chromosome 11 (39 cM) that interacted with a QTL on chromosome 3 to affect PF7 significantly only in mice fed a high-fat diet. These QTLs on chromosome 11 may well represent the same gene, and if so, this suggests that the single-locus effects of this gene are altered by another (epistatic) gene in mice fed the high-fat diet. Cheverud et al. (2004, 2011) found that various obesity traits in recombinant inbred and advanced intercross lines exhibited more significant QTL effects in mice fed a high-fat (versus a control) diet, and it would be interesting to see what patterns might emerge if epistasis scans were conducted on these or other comparable data.
At present we know nothing about the nature of the QTLs producing the epistasis by diet interactions in this population of mice. The nine QTLs discovered by Gordon et al. (2008a) no doubt are involved in many of these interactions, but until candidate genes have been verified at least for these QTLs, the mechanism(s) involved in producing these effects will remain unknown. A study by Ehrich et al. (2005) is particularly relevant because these investigators mapped QTLs causing dietary responses for adiposity in mice to a 127-kb region on chromosome 13. Suggestive positional candidate genes in this region included phosphofructokinase C (Pfkp) that codes for an enzyme involved in the metabolism of pyruvate from hexose phosphate, and pitrilysin metalloprotease 1 (Pitrm1) that is involved in energy production in mitochondria (Ehrich et al., 2005). In our population of mice, chromosome 13 contained a QTL that only affected 6W and showed no interactions with diet (Gordon et al., 2008a), but this is not surprising given that the advanced intercross population of mice used by Ehrich et al. (2005) was quite different from our F2 population. Chromosome 13 also played a minor role in the epistatic interactions with diet, although there is one specific interaction affecting PF7 and another affecting LMS that do involve a QTL on this chromosome at precisely the same location (3 cM) as Pfkp and Pitrm1.
PyMT-Specific Epistatic Effects
It was somewhat surprising to discover so many PyMT × epistasis interactions (total of 135) affecting the weight and adiposity traits given that Gordon et al. (2008a) found no QTL by PyMT interactions. It is possible that this disparity is a consequence of the difference in statistical power between the linear models involved, with our epistatic interaction full model (model 2) having a greater number of degrees-of-freedom (12) for testing. On the other hand, the number of PyMT by epistasis interactions as well as the chromosomes involved were similar to those we discovered for the epistasis by sex and epistasis by diet interactions. So perhaps this result reflects a genuine difference in the single-locus versus two-locus epistatic effects of QTLs in the two PyMT environments. It is difficult to know whether this might be the case, however, because we are not aware of any other corroborating studies that have assessed the effects of cancer on the single-locus and epistatic genetic basis of weight and adiposity traits.
It was not surprising, however, that the locations of a number of epistatic interactions showed significance for both epistasis by sex and epistasis by PyMT interactions. The presence of the PyMT transgene generally produced an increase in body weight that was proportionally greater in females because they developed a greater tumor mass than males. At the same time, PyMT led to a decrease in body fat (cachexia) in females as measured by both FS and PFS, but a slight increase in fat in males (Gordon et al., 2008a). This trend generated a significant interaction of PyMT with sex for the weight and adiposity traits measured at sacrifice (Gordon et al., 2008a) that presumably was reflected in these common epistatic interactions with sex and with PyMT.
The greater number of significant epistatic effects on the traits measured at sacrifice in PyMT+ (versus PyMT−) mice may be a consequence of the timing of tumor development. Thus for body weight, PyMT effects were not significant at 3- and 6-weeks, but did reach significance at 9 weeks of age and especially at sacrifice (Gordon et al., 2008a). Tumor onset occurred at roughly 6 weeks of age in females and about 7 weeks of age in males, and in fact lean mass and adiposity were measured at 7 weeks of age primarily to serve as baseline measures before extensive tumor development (Gordon et al., 2008a,b). PyMT effects were barely significant for LM7 (P < 0.05) and were not significant for PF7 (Gordon et al., 2008a), so perhaps it is not surprising that the numbers of PyMT by epistasis interactions were about the same in both PyMT− and PyMT+ groups for these traits and for 3W, 6W, and 9W. The greater number of PyMT by epistasis interactions on the traits measured at sacrifice also may indicate that factors in the tumors themselves (Bing et al., 2006), or physiological responses to the tumors, rather than PyMT expression, are responsible for altering epistatic effects on these traits.
Among all chromosomes exhibiting significant epistasis by PyMT interactions, about one-half harbor QTLs at roughly the same locations as those on chromosomes 2, 6, 9, 10, and 11 that pleiotropically affect the weight and adiposity traits (Gordon et al., 2008a). If we assume that these single-locus and epistatic QTLs are common and primarily control the development of these traits, therefore, the epistatic interactions suggest that their effects in the cancerous and non-cancerous environments are being modified by the remaining QTLs residing mostly on different chromosomes. It is possible that at least some of these modifying QTLs might be among those discovered by Gordon et al. (2008b) affecting tumor development in this population of mice. The locations of these tumor QTLs (on chromosomes 1, 5, 7, 8, 9, 11, 13, 14, 17, and 19) in fact were totally separate from those for the weight and adiposity traits. However the locations of nearly all the tumor QTLs are close to one or more epistatic QTLs (23 of the 25 are within 10 cM). Although this result may be a simple consequence of the diversity of locations of the epistatic QTLs, it is tempting to think that these tumor QTLs are among those epistatically affecting the primary QTLs responsible for the development of the weight and adiposity traits.
Conclusion
We have demonstrated that there is a great deal of epistasis affecting the weight and adiposity traits in our F2 population of mice. More importantly, however, we also have shown that these epistatic effects often vary depending on the sex of the mice, their dietary environment, and whether or not they develop cancer. Although the context-dependent nature of single-locus effects of QTLs has been appreciated for a number of traits, it has not been clear that this might be the case for two-locus, epistatic effects of QTLs as well. If generally true, this result is important in adding to our understanding of the genetic architecture of complex traits, including those related to body weight and obesity. But it also suggests that assessing the causes of complex traits such as obesity will be a difficult matter. As genes for obesity are identified, we should expect to find that their action and interaction will vary among cohorts separated by factors such as sex, diet, and disease susceptibility. Identification especially of differential epistatic effects on complex traits will represent a challenging task.
Conflict of Interest Statement
The authors declare that the research was conducted in the absence of any commercial or financial relationships that could be construed as a potential conflict of interest.
Acknowledgments
We acknowledge Kent Hunter from NCI for provision of the PyMT mice and assistance with the original experiments from which these data were obtained, and David Threadgill for help with design of the original experiments. We thank Anita Ferrell, Jackie Potts, and Barry Simpson for assistance with mouse dissections, Jason Wolf, and Jim Cheverud for discussion of epistasis models, and two reviewers for useful revision suggestions. This work was funded in part by grants from the NCI-MMHCC (CA105417) and NIDDK (DK076050). The SAS code for the epistasis analyses may be obtained by writing the corresponding author.
References
Allan, M. F., Eisen, E. J., and Pomp, D. (2004). The M16 mouse: an outbred animal model of early onset polygenic obesity and diabesity. Obes. Res. 12, 1397–1407.
Allan, M. F., Eisen, E. J., and Pomp, D. (2005). Genomic mapping of direct and correlated responses to long-term selection for rapid growth rate in mice. Genetics 170, 1863–1877.
Allison, D. B., Pietrobelli, A., Faith, M. S., Fontaine, K. R., Gropp, E., and Fernandez, J. R. (2003). “Genetic influences on obesity,” in Obesity: Mechanisms and Clinical Management, ed. R. Eckel (New York: Elsevier), 31–74.
Bell, C. G., Walley, A. J., and Froguel, P. (2005). The genetics of human obesity. Nat. Rev. Genet. 6, 221–234.
Bing, C., Russell, S., Becket, E., Pope, M., Tisdale, M. J., Trayhurn, P., and Jenkins, J. R. (2006). Adipose atrophy in cancer cachexia: morphologic and molecular analysis of adipose tissue in tumour-bearing mice. Br. J. Cancer 95, 1028–1037.
Brockmann, G. A., Kratzsch, J., Haley, C. S., Renne, L., Schwerin, M., and Karle, S. (2000). Single QTL effects, epistasis, and pleiotropy account for two-thirds of the phenotypic F2 variance of growth and obesity in DU5i × DBA/2 mice. Genome Res. 10, 1941–1957.
Cheverud, J. (2000). “Detecting epistasis among quantitative trait loci,” in Epistasis and the Evolutionary Process, eds J. Wolf, E. III Brodie, and M. Wade (New York: Oxford University Press), 58–81.
Cheverud, J. M., Ehrich, T. H., Hrbek, T., Kenney, J. P., Pletscher, L. S., and Semenkovich, C. F. (2004). Quantitative trait loci for obesity- and diabetes-related traits and their dietary responses to high-fat feeding in LG X SM recombinant inbred mouse strains. Diabetes 53, 3328–3336.
Cheverud, J. M., Lawson, H. A., Fawcett, G. I., Wang, B., Pletscher, S., Fox, A. R., Maxwell, T. J., Ehrich, T. H., Kenney-Hunt, J. P., Wolf, J. B., and Semenkovich, C. F. (2011). Diet-dependent genetic and genomic imprinting effects on obesity in mice. Obesity (Silver Spring) 10, 160–170.
Cheverud, J. M., Routman, E., Duarte, F. M., van Swinderen, B., Cothran, K., and Perel, C. (1996). Quantitative trait loci for murine growth. Genetics 142, 1305–1319.
Cheverud, J. M., Routman, E. J., and Irschick, D. K. (1997). Pleiotropic effects of individual gene loci on mandibular morphology. Evolution 51, 2004–2014.
Cheverud, J. M., Vaughn, T. T., Pletscher, L. S., Peripato, A. C., Adams, E. S., Erikson, C. F., and King-Ellison, K. J. (2001). Genetic architecture of adiposity in the cross of LG/J and SM/J inbred mice. Mamm. Genome 12, 3–12.
Darvasi, A., Weinreb, A., Minke, V., Weller, J. I., and Soller, M. (1993). Detecting marker-QTL linkage and estimating QTL gene effect and map location using a saturated genetic map. Genetics 134, 943–951.
Dong, C., Wang, S., Wei-Dong, L., Li, D., Zhao, H., and Price, R. A. (2003). Interacting genetic loci on chromosomes 20 and 10 influence extreme human obesity. Am. J. Hum. Genet. 72, 115–124.
Ehrich, T. H., Hrbek, T., Kenney-Hunt, J. P., Pletscher, L. S., Wang, B., Semenkovich, C. F., and Cheverud, J. M. (2005). Fine-mapping gene-by-diet interactions on chromosome 13 in a LG/J X SM/J murine model of obesity. Diabetes 54, 1863–1872.
Gordon, R. R., Hunter, K. W., Sorensen, P., and Pomp, D. (2008a). Genotype × diet interactions in mice predisposed to mammary cancer. I. Body weight and fat. Mamm. Genome 19, 163–178.
Gordon, R., Hunter, K., La Merrill, M., Sørensen, P., Threadgill, D., and Pomp, D. (2008b). Genotype × diet interactions in mice predisposed to mammary cancer: II. Tumors and metastases. Mamm. Genome 19, 179–189.
Guy, C. T., Cardiff, R. D., and Muller, W. J. (1992). Induction of mammary tumors by expression of polyomavirus middle T oncogene: a transgenic mouse model for metastatic disease. Mol. Cell Biol. 22, 3794–3802.
Haley, C. S., and Knott, S. A. (1992). A simple regression technique for mapping quantitative trait loci in line crosses using flanking markers. Heredity 69, 315–324.
Ivakine, E. A., Mortin-Toth, S. M., Gulban, O. M., Valova, A., Canty, A., Scott, C., and Danska, J. (2006). The Idd4 locus displays sex-specific epistatic effects on type 1 diabetes susceptibility in nonobese diabetic mice. Diabetes 55, 3611–3619.
Leamy, L. J., Pomp, D., and Lightfoot, J. T. (2009). Genetic variation for body weight change in mice in response to physical exercise. BMC Genet. 10, 58. doi:10.1186/1471-2156-10-58
Leamy, L. J., Pomp, D., and Lightfoot, J. T. (2010). A search for quantitative trait loci controlling within-individual variation of physical activity traits in mice. BMC Genet. 11, 83. doi:10.1186/1471-2156-11-83
Leamy, L. J., Routman, E., and Cheverud, J. (1999). Quantitative trait loci for early and late developing skull characters in mice: a test of the genetic independence model of morphological integration. Am. Nat. 153, 201–214.
Li, J., and Ji, L. (2005). Adjusting multiple testing in multilocus analyses using the eigenvalues of a correlation matrix. Heredity 95, 221–227.
Loos, R. J. F., Ruchat, S., Rankinen, T., Tremblay, A., Pérusse, L., and Bouchard, C. (2007). Adiponectin and adiponectin receptor gene variants in relation to resting metabolic rate, respiratory quotient, and adiposity-related phenotypes in the Québec Family Study. Am. J. Clin. Nutr. 85, 26–34.
Manly, K. F., Cudmore, R. H. Jr., and Meer, J. M. (2001). Map Manager QTX, cross-platform software for genetic mapping. Mamm. Genome 12, 930–932.
Musani, S. K., Erickson, S., and Allison, D. B. (2008). Obesity – still highly heritable after all these years. Am. J. Clin. Nutr. 87, 275–276.
Nehrenberg, D. L., Wang, S., Hannon, R. M., Garland, T. Jr., and Pomp, D. (2010). QTL underlying voluntary exerercise in mice: interactions with the “mini-muscle” locus and sex. J. Hered. 101, 42–53.
O’Rahilly, S., Farooqi, I. S., Yeo, G. S. H., and Challis, B. (2003). Minireview: Human obesity – lessons from monogenic disorders. Endocrinology 144, 3757–3764.
Penrod, N. M., Poku, K. A., Vaughn, D. E., Asselberg, F. W., Brown, N. J., Moors, J. H., and William, S. M. (2011). Epistatic interactions in genetic regulation of t-PA and PAI-1 levels in a Ghanaian population. PLoS ONE 6, e16639. doi:10.1371/journal.pone.0016639
Pomp, D., Nehrenberg, D., and Estrada-Smith, E. (2008). Complex genetics of obesity in mouse models. Annu. Rev. Nutr. 28, 331–345.
Rankinen, T., Zubert, A., Chagnon, Y. C., Weisnagel, S. J., Argyropoulos, G., Walts, B., Perusse, L., and Bouchard, C. (2006). The human obesity gene map: the 2005 update. Obesity (Silver Spring) 14, 529–644.
Stone, S., Abkevich, V., Russell, D. L., Riley, R., Timms, K., Tran, T., Trem, D., Frank, D., Jammulapati, S., Neff, C. D., Iliev, D., Gress, R., Gongping, H., Frech, G. C., Adams, T. D., Skolnick, M. H., Lanchbury, J. S., Gutin, A., Hunt, S. C., and Shattuck, D. (2006). TBC1D1 is a candidate for a severe obesity gene and evidence for a gene/gene interaction in obesity predisposition. Hum. Mol. Genet. 15, 2709–2720.
Stylianou, I. M., Korstanje, R., Li, R., Sheehan, S., Paigen, B., and Churchill, G. A. (2006). Quantitative trait locus analysis for obesity reveals multiple networks of interacting loci. Mamm. Genome 17, 22–36.
Taylor, B. A., and Phillips, S. J. (1997). Obesity QTLs on mouse chromosomes 2 and 17. Genomics 43, 249–257.
Wolf, J. B., Leamy, L. J., Routman, E. J., and Cheverud, J. M. (2005). Epistatic pleiotropy and the genetic architecture of covariation within early and late-developing skull trait complexes in mice. Genetics 171, 683–694.
Wolf, J. B., Pomp, D., Eisen, E. J., Cheverud, J. M., and Leamy, L. J. (2006). The contribution of epistatic pleiotropy to the genetic architecture of covariation among polygenic traits in mice. Evol. Dev. 8, 468–476.
Yi, N., Diament, A., Chiu, S., Kim, K., Allison, D. B., Fisler, J. S., and Warden, C. H. (2004). Characterization of epistasis influencing complex spontaneous obesity in the BSB model. Genetics 167, 399–409.
Keywords: epistasis, context-dependency, weight and obesity traits, mice, sex, diet, PyMT
Citation: Leamy LJ, Gordon RR and Pomp D (2011) Sex-, diet-, and cancer-dependent epistatic effects on complex traits in mice. Front. Gene. 2:71. doi: 10.3389/fgene.2011.00071
Received: 03 August 2011; Paper pending published: 23 August 2011;
Accepted: 29 September 2011; Published online: 28 October 2011.
Edited by:
Paula Kover, University of Bath, UKReviewed by:
David C. Airey, Vanderbilt University, USADanielle Renee Reed, Monell Chemical Senses Center, USA
Copyright: © 2011 Leamy, Gordon and Pomp. This is an open-access article subject to a non-exclusive license between the authors and Frontiers Media SA, which permits use, distribution and reproduction in other forums, provided the original authors and source are credited and other Frontiers conditions are complied with.
*Correspondence: Larry J. Leamy, Department of Biology, University of North Carolina at Charlotte, 9201 University City Boulevard, Charlotte, NC 28223, USA. e-mail: ljleamy@uncc.edu