 Claudia C. Wehrspaun
 Chris P. Ponting
 Ana C. Marques
- 1Department of Physiology, Anatomy and Genetics, University of Oxford, Oxford, UK
- 2Section on Neuropathology, Clinical Brain Disorders Branch, Genes, Cognition and Psychosis Program, IRP, NIMH, National Institutes of Health, Bethesda, MD, USA
- 3MRC Functional Genomics Unit, Department of Physiology, Anatomy and Genetics, University of Oxford, Oxford, UK
Why protein-coding genes express transcripts with longer 3′untranslated regions (3′UTRs) in the brain rather than in other tissues remains poorly understood. Given the established role of 3′UTRs in post-transcriptional regulation of transcript abundance and their recently highlighted contributions to miRNA-mediated cross-talk between mRNAs, we hypothesized that 3′UTR lengthening enhances coordinated expression between functionally-related genes in the brain. To test this hypothesis, we annotated 3′UTRs of human brain-expressed genes and found that transcripts encoding ion channels or transporters are specifically enriched among those genes expressing their longest 3′UTR extension in this tissue. These 3′UTR extensions have high density of response elements predicted for those miRNAs that are specifically expressed in the human frontal cortex (FC). Importantly, these miRNA response elements are more frequently shared among ion channel/transporter-encoding mRNAs than expected by chance. This indicates that miRNA-mediated cross-talk accounts, at least in part, for the observed coordinated expression of ion channel/transporter genes in the adult human brain. We conclude that extension of these genes' 3′UTRs enhances the miRNA-mediated cross-talk among their transcripts which post-transcriptionally regulates their mRNAs' relative levels.
Introduction
Post-transcriptional regulation of transcript abundance can be achieved by altering RNA stability or translation (Shyu et al., 2008). Untranslated regions (UTRs) located at 5′ and 3′ ends of mRNAs contain the majority of post-transcriptional regulatory elements. Of these, the 3'UTR contain the highest density of motifs contributing to mRNA stability, translation and localization (Kuersten and Goodwin, 2003; Wang et al., 2008). A pre-eminent class of such motifs are miRNA recognition elements (MREs) that bind to near complementary miRNAs (~22 nucleotide non-coding RNAs), which in turn induce either degradation or translational inhibition of their cognate mRNAs targets (Stark et al., 2005). Conserved miRNA sites in 3′UTRs experience stronger negative selection compared to other functional elements (Chen and Rajewsky, 2006). The significance of miRNAs in regulating transcript abundance is exemplified by the prediction of their MREs in over 60% of human genes (Bartel, 2009) and their demonstrated roles in many aspects of neuronal cell physiology, including terminal neuronal differentiation (Kawase-Koga et al., 2009), polarization of neurons (Wang et al., 2008), axonogenesis (Wu et al., 2012), neuroplasticity and stress response (Nelson et al., 2008).
Spatially and temporally regulated expression of alternative 3′UTRs, resulting either from alternative cleavage and polyadenylation or alternative splicing, are a common feature of animal genes (Iseli et al., 2002; Hughes, 2006). Alternative 3′UTR usage is often preserved across evolution as indicated by, for example, similar levels of between-species sequence conservation at proximal and distal poly(A) sites (Smibert et al., 2012). Differences in 3'UTR length are in many cases correlated with transcript abundance (Ulitsky et al., 2012). The 3′UTRs of transcripts that are expressed in the brain tend to be longer than those expressed in other tissues, a property that is widely conserved across evolution (Zhang et al., 2005; Ji et al., 2009; Hilgers et al., 2011; Ulitsky et al., 2012; Miura et al., 2013). For example transcripts whose proteins have roles in development, morphogenesis and signal transduction express longer 3′UTRs compared to transcripts for proteins involved in metabolism or RNA processing (Ramskold et al., 2009) and 3′UTRs of genes encoding ribosomal genes have been reported to be ~6-fold shorter than 3′UTRs of neurogenesis genes (Stark et al., 2005).
Here we sought to address why such transcripts might require longer 3′UTRs using an assumption that their greater lengths reflect a greater degree of post-transcriptional regulation by miRNAs. Long 3′UTRs of neuronally expressed isoforms are enriched in conserved binding sites (MREs) for well-known neural miRNAs (Miura et al., 2013) that are thought to contribute to the fine-tuning of their encoded products' abundance. For example, the predominant MeCP2 isoform in human fetal brain contains an unusually long 3′UTR (Coy et al., 1999; Balmer et al., 2003) which harbors functional binding sites for miR-483-5p, a fetal brain-enriched miRNA that post-transcriptionally represses MeCP2 in this tissue (Han et al., 2013). Interestingly, miR-483-5p also regulates transcript levels of other MeCP2 protein interacting partners (Han et al., 2013). This suggests that differential 3′UTR usage may fine-tune gene-gene interactions via miRNA-mediated modulation of their transcripts' abundance (Han et al., 2013).
The ability of mRNAs to compete for miRNAs depends both on their relative abundance and their MRE repertoire (Ala et al., 2013). The latter is determined, largely, by the sequence and length of their 3′UTRs (Mangone et al., 2010) which control, in a miRNA-dependent manner, their relative abundance (Chi et al., 2009). We hypothesized that genes with brain-specific 3′UTR extensions might engage in the miRNA-mediated cross-talk with other functionally related transcripts. Given that there is a known excess of long alternative 3′UTRs in brain-expressed isoforms (Zhang et al., 2005; Ji et al., 2009; Hilgers et al., 2011; Ulitsky et al., 2012; Miura et al., 2013), we expected such transcripts to contribute to brain-specific biological processes.
A key feature of brain cells, particularly neurons, is their ability to respond to electrochemical changes in their extracellular environment (Holtmaat and Svoboda, 2009; Vaquerizas et al., 2009). Crucial to this process are genes encoding ion channels and transporters. These proteins form, often gated, multi-subunit pores in the membrane which permit efficient and specific transport of extracellular ions (Alberts et al., 2002). Ion channels and transporters are present in most cell types (Alberts et al., 2002) but their importance in the central nervous system is illustrated by the many channelopathies that affect these tissues (Jentsch et al., 2004). Importantly, the transcript abundance of ion channel encoding genes is influenced by environmental cues, including the electrical activity present within the cell (Schulz et al., 2008). Given that ion channels require the coordinated assembly of several protein subunits to convey their function, transcript abundance may be tightly regulated to ensure proper channel assembly and stoichiometry. Such coordination can be achieved via miRNA-mediated post-transcriptional regulation. For example, miR-103 simultaneously regulates the abundance of at least three transcripts encoding subunits of the Cav1.2 L-type calcium channel, and modulates its activity (Favereaux et al., 2011). Variants in this channel play a role in chronic neuropathic pain (Favereaux et al., 2011) as well as in Timothy's (Splawski et al., 2006) and Brugada Syndrome (Antzelevitch et al., 2007).
Here we investigated the biological relevance of 3′UTR lengthening among transcripts expressed in the human adult brain. Genes that express their longest alternative 3′UTR in this organ were found to be substantially enriched for those encoding ion channels and transporters. We provide evidence that extended 3′UTR transcription in the brain provides an additional miRNA-mediated layer of post-transcriptional regulation of these genes' transcript levels.
Materials and Methods
RNA Sequencing Data
We obtained single- and paired-end long poly-adenylated RNA sequencing (RNA-Seq) reads derived from 16 human adult tissues (one individual per tissue adipose, adrenal, blood, brain, breast, colon, heart, kidney, liver, lung, lymph-node, ovary, prostate, skeletal-muscle, testes, and thyroid) from the Illumina's Human BodyMap 2.0 project (ArrayExpress, 2011a). Details on the samples and methods employed in the preparation of this data can be found in (ArrayExpress, 2011b). The median coverage of constitutively expressed 3′UTR nucleotides was 13.5X.
The expression profiles of human miRNAs were obtained from (Landgraf et al., 2007) and used to annotate miRNA families expressed in human adult frontal cortex (FC). A miRNA was considered to be expressed, if it had ≥1 reads supporting its expression in this tissue (resulting in 76 expressed miRNA families Landgraf et al., 2007). A miRNA family was defined as FC-specifically expressed if its expression was supported by a number of reads which was 2-, 5-, or 10-times higher than this miRNA's median across all non-neuronal tissues (Supplementary Table S1) (Landgraf et al., 2007).
Annotation of Constitutive and Alternative 3′Untranslated Regions
Single- and paired-reads for each of the 16 tissues were mapped to the human genome (hg19) using TopHat (Trapnell et al., 2009). Transcripts were assembled de novo with Cufflinks (version 1.3.0, Trapnell et al., 2010) using ENSEMBL (build 71, Flicek et al., 2012) protein-coding gene transcripts as reference. We considered transcripts that overlapped exonic bases of ENSEMBL protein-coding genes to be part of that gene locus.
For each tissue, we excluded protein-coding genes that were not expressed (have an FPKM -Fragments Per Kilobase of transcript per Million mapped reads- equal to zero). We included genes annotated in ENSEMBL and newly assembled transcripts. Next we considered only protein-coding genes with stop codon genomic locations that were common to all its annotated transcripts in ENSEMBL; we refer to these as constitutive stop codons (n = 8533 genes contained constitutive stop codons (Figure 1A) out of n = 19985 protein-coding genes with annotated stop codons in ENSEMBL build 71). For each gene and in each tissue, we annotated a consensus transcript, containing all transcribed nucleotides and defined its 3′UTR as the transcribed region downstream of its constitutive stop codon (Figure 1B). The nucleotide regions common to all transcripts from a gene were annotated as that gene's constitutive 3′UTRs and the remaining 3′UTR nucleotides were considered to be alternative 3′UTRs. For each gene, we annotated the alternative 3′UTRs with the maximal length in nucleotides as its longest alternative 3′UTRs (Figure 1B).
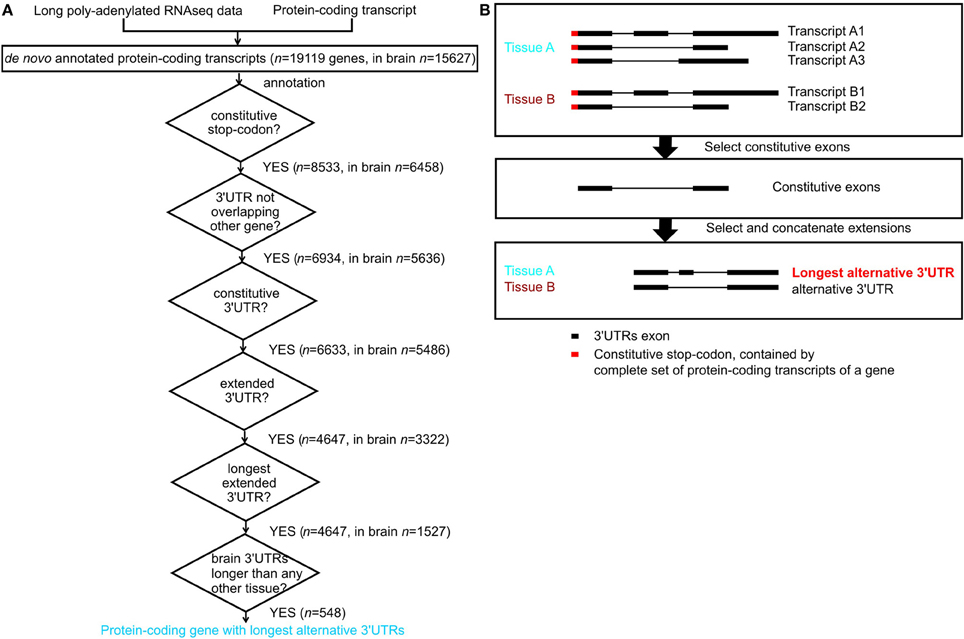
Figure 1. Annotation of constitutive and alternative 3′UTRs. (A) Flowchart for annotation of protein-coding genes with longest alternative 3′UTRs; n indicates number of genes. (B) Example of a gene with constitutive stop codon (red), expressed only in tissue A (blue) and tissue B (brown). Tissue A expresses three transcripts, and tissue B expresses 2 transcripts (top panel). The constitutive 3′UTRs consists in the nucleotides expressed in all transcript of a gene across all tissues where the gene is expressed (middle panel). The extended alternative 3′UTRs is the consensus transcript for a gene in a given tissue after constitutive parts have been removed. Tissue A expresses the longest alternative 3′UTRs for this gene, as it contains more nucleotides than the alternative 3′UTRs in tissue B (bottom panel).
3′UTR Expression
We used CoverageBed (Bedtools version 2.17.0; Quinlan and Hall, 2010) to determine the number of long mRNASeq reads derived from each adult human tissue mapping to constitutive and alternative 3′UTRs. For each tissue, we estimated constitutive and alternative 3′UTR expression (E) as the number of reads mapping to that region divided by its total length. To identify differences in 3′UTRs usage between tissues, we estimated the ratio between the expression in tissue i of the longest alternative (L) and constitutive (C) 3′UTRs(Ei = ELi/ECi).
Lineage Specific Constraint
We used the derived frequencies of 1000 Genomes single nucleotide polymorphisms (SNP; Clarke et al., 2012; Haerty and Ponting, 2013) to test for differences in selective constraint within the human lineage between ancestral repeats (AR), constitutive 3′UTRs and the longest alternative 3′UTRs across all tissues, as described in (Chen and Rajewsky, 2006; Marques and Ponting, 2009). We considered SNPs with frequency f < 10% to be rare and intermediate if 10% < f < 90%. We considered only ARs within the vicinity of 3′UTRs [20, 50, and 100 kilobases (kb) downstream of the alternative 3′UTRs or upstream of the constitutive stop codon].
Functional Enrichment
For each tissue, we tested whether genes with the longest alternative 3′UTR expressed in only that tissue were functionally enriched using the functional classification tool Database for Annotation, Visualization, and Integrated Discovery (DAVID; Huang et al., 2009) using default parameters (count = 2 and ease = 0.1). Genes expressed in only one tissue were discarded, for example in brain, out of n = 548 genes expressing their longest alternative 3′UTRs in brain only 4 were excluded. For each tissue, we compared the Gene Ontology (GO) annotations of genes with a longest alternative 3′UTR expressed in that tissue to a background containing all genes with annotated 3′UTRs expressed in that tissue. We considered GO-terms that were significantly enriched at α = 0.05, after Bonferroni multiple testing correction.
Expression Correlation
We tested whether the genes (n = 226) contributing to functional enrichment of ion channel and transporter encoding genes (referred to as “ion channel/transporter genes”) showed increased correlation in expression. In order to match the developmental stage of the subject from which the RNA used to annotate 3′UTRs in the brain was obtained (a 77 year old female) we restricted our analyses of gene expression to adulthood (20–78 years; n = 148) using the microarray data from “braincloud” (Colantuoni et al., 2011), preprocessed and quantified as described by the authors (Colantuoni et al., 2011). “Braincloud” contains gene expression data from the prefrontal cortex (PFC) of human postmortem tissue. For each gene, we used only one probe, namely the probe that showed the strongest correlation with age during the lifespan (Colantuoni et al., 2011) (number of probes = 16812) to avoid bias arising from using multiple probes for one gene. N = 192 probes were available for ion channel/transporter genes. We compared the median of all pairwise Spearman's correlations among the ion channel/transporter genes to the same measure from n = 1000 random bootstrap samples of same set size (n = 192 genes, matched to ion channel/transporter genes) from (i) brain expressed genes (n = 16812 probes available in “braincloud”), (ii) genes with longest 3′UTRs expressed in brain (n = 1261 probes) or (iii) genes with longest 3′UTRs expressed only in brain (n = 449 probes). We repeated the analysis for 1000 random samples of 192 genes annotated with the GO-term “Ion channel activity” (GO:0005216), which was the most significant p-value in enrichment analysis (n = 269 probes).
Prediction of miRNA Response Elements
We used TargetScan (version 5.0; Lewis et al., 2005) to predict miRNA response elements (MREs) in all annotated constitutive and longest alternative 3′UTRs. For all constitutive and longest alternative 3′UTRs annotated in brain, we estimated the percentage of MREs expressed in adult FC (Landgraf et al., 2007) by dividing the number of MREs for miRNAs expressed in adult FC by the total number of MREs predicted for the region of interest. The difference between MRE percentages in longest alternative 3′UTRs compared to constitutive 3′UTRs in the brain was assessed using a Kolmogorov-Smirnov test (KS-test). We repeated the analysis considering only families containing miRNAs whose expression was 10-times, 5-times, or 2-times higher than the median expression across all non-neuronal tissues (Landgraf et al., 2007); hereafter referred to as FC10, FC5, and FC2 sets. We included only ion channel/transporter genes which had at least 1 MRE predicted in alternative and constitutive 3′UTRs (n = 209). The same analysis was done for the remaining n = 300 genes expressing the longest alternative 3′UTRs only in brain after removing ion channel/transporter genes.
Next, we compared the percentage of shared MREs for FC10, FC5 and FC2 (Landgraf et al., 2007, Supplementary Table S1) predicted in constitutive and alternative 3′UTRs for each pair of ion channel/transporter genes (n = 226). Precisely, we compared the observed median value to what would be expected based on the median percentage of shared MREs between 1000 random sets of n = 226 genes expressed in the brain, excluding ion channel/transporter genes.
Results
Annotation and Characterization of Human Genes 3′Untranslated Regions
Long poly-A+ selected single- and paired-end RNA sequencing data from 16 normal human tissues was used to annotate transcripts de novo using Cufflinks (version 1.3.0, Trapnell et al., 2010, Figure 1A). For simplicity, we only considered genes whose complete set of protein-coding transcripts contain the same constitutive stop codon. Exonic nucleotides downstream of these stop codons form part of these protein-coding transcripts 3′UTR. For each gene, we defined its constitutive 3′UTR as all 3′UTR nucleotides expressed across the complete set of transcripts. The remaining 3′UTR nucleotides were defined as contributing to alternative 3′UTRs. For each gene we also defined its longest alternative 3′UTR as its alternative 3′UTR with the largest number of nucleotides observed in any tissue (Figure 1B).
We next sought to compare the density of functional elements in alternative and constitutive 3′UTRs using the derived allele frequency (DAF) test (Chen and Rajewsky, 2006). A fraction of SNPs with low allele frequencies that is higher than found for SNPs in neutrally evolving sequence suggests that negative selection has acted to prevent the accumulation of loss-of-function mutations, an evolutionary signature of functionality (Chen and Rajewsky, 2006). We compared the ratio, r, of rare (DAF < 10%) to intermediate (10% < DAF < 90%) frequency SNPs (Clarke et al., 2012; Haerty and Ponting, 2013) found in constitutive or longest alternative 3′UTRs against the ratio calculated for neutrally evolving sequences. As neutral proxy we used transposable element-derived sequences (Ancestral Repeats or ARs, Lunter et al., 2006) that inserted prior to the common ancestor of human and mouse. To ensure that ARs shared the same phylogenetic history as the 3′UTRs, we selected ARs in regions in the vicinity of 3′UTRs (20, 50, or 100 kb) (Haerty and Ponting, 2013). 3′UTRs without ARs in their vicinity were excluded (n = 4324 genes with longest alternative 3′UTRs contained ARs within 20 kb vicinity). Both longest alternative (r = 15304/6334 = 2.42; two tailed Fisher's exact test (FET) p-value < 7 × 10⁻³) and constitutive (r = 12900/5144 = 2.51; FET p-value < 2 × 10⁻⁵) 3′UTRs exhibit a moderate excess of SNPs at low frequency (DAF < 10%) relative to ARs within 20 kb (r = 18143/7928 = 2.29), consistent with some nucleotides in these regions being preferentially preserved by natural selection. Constitutive 3′UTRs were no different to longest alternative 3′UTRs in this test (FET p-value = 0.10), suggesting that they evolved under similar selective constraints. Similar results were obtained when ARs within 50 kb and 100 kb either up- or down-stream of 3′UTRs were considered. We conclude that 3′UTR extensions are subject to selective constraint in humans, consistent with these regions harboring functionally conserved motifs.
Next, we evaluated tissue differences in 3′UTR usage. Alternative 3′UTRs expressed in the human adult brain are significantly longer than those found in other tissues (two-tailed Wilcoxon test, p-value < 5 × 10⁻⁸), consistent with previous reports (Hilgers et al., 2011; Miura et al., 2013). The median length of brain-expressed alternative 3′UTRs (272 nucleotides) is 8% higher than for ovary (251 nucleotides, Figure 2A), the tissue with the next longest median alternative 3′UTRs, and 24% higher than the median length of 3′UTRs of transcripts from all other tissues (219 nucleotides, Figure 2A). The observed extension of brain-expressed alternative 3′UTRs could reflect a brain-specific usage of distal poly-adenylation signals or splice sites or be a consequence of technical bias, such as differences in RNA library preparation or sequencing coverage. To distinguish between these two explanations, we compared the ratio between the expression levels of alternative and their corresponding constitutive 3′UTRs, across all tissues tested. Relative Expression level (E) was defined as the ratio between the numbers of reads per nucleotide in alternative and constitutive 3′UTRs (Methods). We found that isoforms expressed in the brain have the highest relative expression of alternative compared to constitutive 3′UTRs (Figures 2B,C). More specifically, the median relative expression level of all genes with annotated alternative 3′UTRs was significantly higher in the brain (E = 0.35) than the median relative expression of the other 15 tissues investigated (E = 0.28; Figure 2B; Wilcoxon test, p-value < 2.2 × 10⁻¹⁶). This is consistent with brain-expressed transcripts having the longest alternative 3′UTRs owing to biological rather than technical reasons.
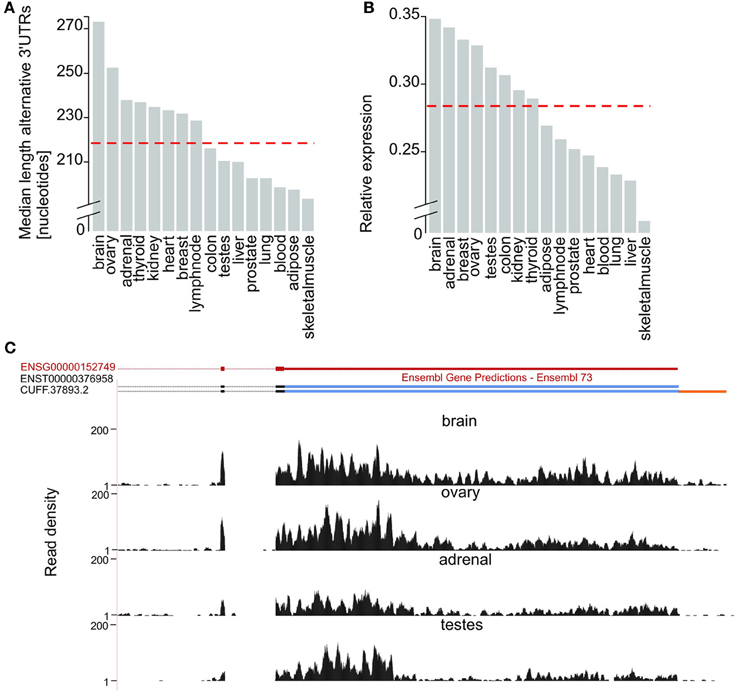
Figure 2. Brain expressed isoforms have the longest 3′UTR extensions. (A) Median length (in nucleotides, Y-axis) of alternative 3′UTRs across 16 human tissues. The median across all non-neuronal tissues (219 nucleotides) is depicted as a horizontal dashed red line. (B) Median fold difference in expression (calculated as the number of reads per nucleotide of expressed sequence) of alternative relative to constitutive 3′UTR (Y-axis) across 16 tissues. The median across all non-neuronal tissues (median relative expression = 0.28) is depicted as a horizontal dashed red line. (C) G protein-coupled receptor 180 (GPR180; ENSG00000152749; chr13:95,277,556-95,288,768, red) expresses its longest 3′UTR in the brain. Alongside support for the expression of the only transcript annotated by ENSEMBL for this gene (ENST00000376958) our approach allowed the annotation of an isoform with an extended 3′UTR in the brain (CUFF.37893.2). Read density (black, Y-axis) across the last coding exons (black), the constitutive (blue) and extended (orange) portions of GPR180 3′UTR in brain, ovary, adrenal and testes.
Isoforms with Long Alternative 3′UTRs are Often Co-Expressed and Functionally Related
We next tested whether genes expressing isoforms with the longest alternative 3′UTRs in the brain are functionally related, contributing to the same biological process or being part of the same pathway. To do so we compared the frequency of GO annotations for the 544 genes that express their longest alternative 3′UTRs only in the brain against GO-terms for all brain expressed genes with annotated 3′UTRs.
After correcting for multiple testing (Bonferroni correction, α = 0.05), we found that genes with the longest alternative 3′UTR isoform expressed in the brain were significantly enriched in 28 GO-terms that were related to either ion channel or transporter function, as summarized using REVIGO (Supek et al., 2011; Figure 3A, Supplementary Table S1). Almost half of the genes expressing their longest 3′UTR in the brain contributed to the observed enrichment (n = 226 genes; Supplementary Table S2). The protein-coding genes that contribute to this enrichment are, for simplicity, hereafter termed ion channel/transporter genes. None of the terms that were enriched for genes with longest alternative 3′UTRs in brain was replicated in any of the other 15 tissues tested (Supplementary Table S3). Ion channel/transporter genes tended to express especially long alternative 3′UTRs, showing a median length of n = 1322 nucleotides compared to n = 798 in the remaining n = 322 genes with longest 3′UTRs only in brain (two-tailed Wilcoxon test, p-value < 0.05).
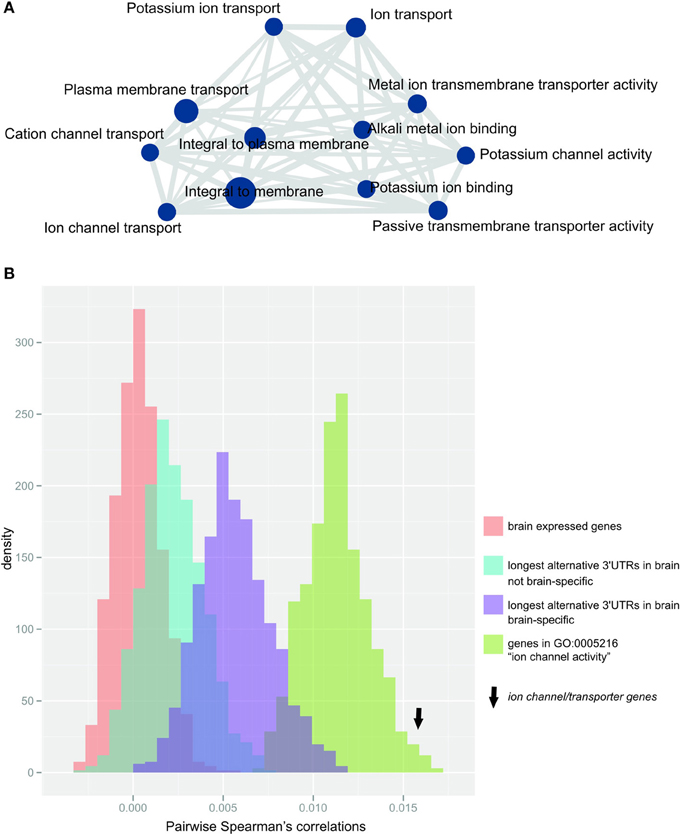
Figure 3. Ion channel/transporter genes are over-represented within genes expressing their longest 3′UTR in the brain (A) Enrichment map (Merico et al., 2010) of significantly enriched GO-terms after terms were summarized using REVIGO (Supek et al., 2011). Node size (blue circles) reflects the number of contributing genes, and edge size (gray lines) corresponds to the number of genes that are shared between nodes. (B) Distribution of the median pairwise Spearman's correlations for 1000 bootstrap samples of random gene sets (each n = 192, matched to ion channel transporter genes) from the populations: (i) brain-expressed genes (n = 16812 probes; red), (ii) genes with longest alternative 3′UTRs expressed in brain (n = 1261 probes; blue), (iii) genes with longest 3′UTRs expressed only in brain (n = 449 probes; purple) or (iv) genes contributing to GO-term “ion channel activity” (n = 192 probes; green). Arrow indicates the median pairwise Spearman's correlations for ion channel/transporter genes.
Relative to non-related genes, the expression of genes functioning in the same pathway or sharing biological roles is expected to be more strongly co-regulated. Indeed, we found that ion channel/transporter genes (n = 192 genes associated with probes in the arrays used by Colantuoni et al., 2011) showed significantly increased pairwise correlation in expression across the PFC of postmortem brains from 148 healthy adult subjects (Colantuoni et al., 2011) compared to randomly selected gene sets of brain expressed genes of the same size (median Spearman's correlation = 0.015; empirical p-value < 0.001, Figure 3B). Similar results were found when we compared ion channel/transporter genes to random sets of genes expressing their longest 3′UTRs in the brain (n = 1261 probes; empirical p-value < 0.001, Figure 3B) or only in the brain (brain-specific; n = 449 probes; empirical p-value < 0.001, Figure 3B). The expression of genes contributing to the same GO-terms are more likely to be correlated with each other than random sets of brain expressed genes. For that reason, we compared ion channel/transporter genes to random sets of brain expressed genes annotated with the GO-term “ion channel activity” and found significantly increased correlation for ion channel/transporter genes (n = 269 probes; empirical p-value < 0.05, Figure 3B). The increased correlation in expression of ion channel/transporter genes indicates that extended alternative 3′UTRs facilitate coordination of these genes in the brain.
Long Alternative 3′UTRs Strengthen miRNA Mediated Cross-Talk Among ion channel/transporter genes in the Brain
Our finding that the expression levels of ion channel/transporter genes show increased correlation in the human adult brain, prompted us to investigate the mechanism underlying these genes' coordinated expression. We hypothesized that alternative 3′UTRs might contain MREs for miRNAs that are shared between ion channel/transporter genes thereby enhancing the post-transcriptional coordination of their relative abundance in the adult PFC, by means of miRNA mediated cross-talk between transcripts.
We compared the percentages of predicted MREs per gene in constitutive or longest alternative 3′UTRs of ion channel/transporter genes for those miRNA families that are known to be expressed in the human adult FC (Landgraf et al., 2007). We defined sets of miRNA families whose miRNAs are transcribed (denoted “expressed”) or specifically expressed in the FC at levels that are at least 10-, 5-, or 2-times (denoted FC10, FC5, and FC2, respectively) higher than their median level across all non-neuronal tissues (Landgraf et al., 2007; Supplementary Table S1). For each gene, MRE percentage was defined as the ratio of predicted MREs for miRNA families expressed in or specific to the FC divided by the total number of predicted MREs. Only ion channel/transporter genes with at least one predicted MRE in alternative and constitutive 3′UTRs were considered (n = 209 genes).
Longest alternative 3′UTRs for ion channel/transporter genes expressed in the brain showed a significantly higher percentage of MREs for miRNA families that are specifically expressed in the human FC relative to constitutive 3′UTRs (Figure 4A). This observation for ion channel/transporter genes is consistent with a recent report of a general enrichment of neuronal specific miRNAs across 3′UTR extensions in the human brain (Miura et al., 2013). The difference in MRE percentage for alternative or constitutive 3′UTRs widened for increased tissue specificity of miRNA families in the human FC (Figure 4A). For the FC10 set, the median percentage of MREs predicted in brain alternative 3′UTRs was twice as high as for constitutive 3′UTRs. This large increase in the percentage of MRE for specifically expressed miRNAs was not found in genes expressing their longest 3′UTRs only in brain after removing ion channel/transporter genes (n = 300 genes, two-sample KS-test p-value = 0.45).
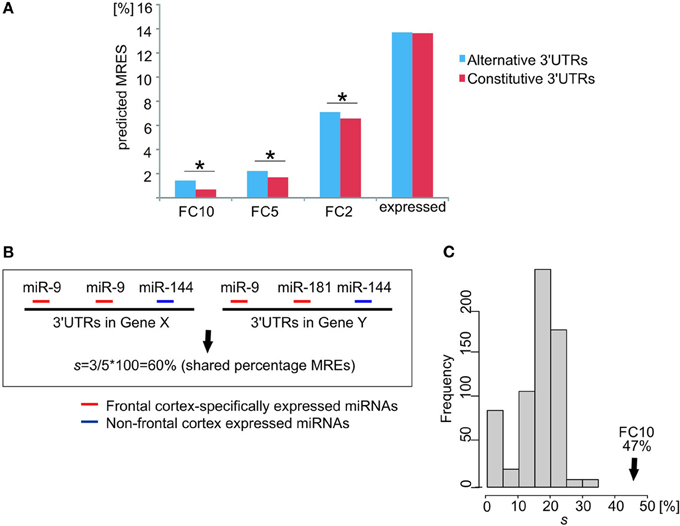
Figure 4. Frontal cortex specifically expressed miRNAs targeting 3′UTR extensions strengthen the cross-talk between ion channel/transporter genes. (A) Differences in the percentage of predicted MREs for miRNA families expressed in human adult frontal cortex (y-axis for different levels of relative expression: FC10, FC5, FC2, and expressed) between constitutive (red) and alternative (blue) 3′UTRs of ion channel/transporter genes. * indicates a significant difference (p < 0.05). (B) Calculation of the percentage (%) of shared MREs, s, between two ion channel/transporter genes. Gene X and Gene Y have two and one predicted MREs for a frontal cortex-specific miRNA (miR-9; red), respectively. Gene X and Y have predicted MREs for miRNAs that are either not expressed specifically in the frontal cortex (Gene X, miR-144) or not shared (Gene Y, miR-181). Of the 5 predicted MREs in both genes 3 are for frontal cortex-specific miRNAs (miR-9; red), resulting in s = 3/5 × 100 = 60% shared MREs. (C) Percentage shared MREs for FC10 in ion channel/transporter genes (median percentage shared MREs s = 47%, black arrow). Histogram represents the null distribution of the same metric for 1000 random brain-expressed gene sets excluding ion channel/transporter genes (each n = 226).
We hypothesized that competition for shared miRNAs contributes to the observed increased coordination in expression between ion channel/transporter genes. To test this hypothesis, we calculated the proportion, s, of all MREs that were predicted to bind FC-specific miRNAs and that were present within the constitutive and alternative 3′UTRs of a pair of ion channel/transporter genes expressing their longest 3′UTR in the brain and shared between the two genes 3′UTRs; we will refer to this as the “percentage of shared MREs” (Figure 4B). The median of s for these ion channel/transporter genes was then compared to values from randomly selected brain-expressed genes. Ion channel/transporter genes were found to share a significantly (empirical p-value < 0.001) higher percentage of predicted MREs with each other (median s = 47% for FC10 miRNA families) than other brain-expressed genes (Figure 4C). The median s value between gene-pairs was highest for miRNA families that were specifically expressed in the frontal cortex (FC10 set). Values decreased to 40% (p-value < 0.001) for FC5 miRNA families, and to 33% for FC2 miRNA families (p-value < 0.001) as would be expected if the most FC-specific miRNAs contributed the most to the observed coordination of ion channel/transporter gene transcript abundance.
GABRA4 (Gamma-aminobutyric acid receptor, alpha-4) is an appropriate illustration of the ion channel/transporter network described above. GABRA4 belongs to the receptor gene family GABA-A of ion channels and interacts with GABA, the main inhibitory neurotransmitter in the brain (Whiting et al., 1999). The expression level of GABRA4 has been linked to learning and long-term potentiation (Shen et al., 2010) and its expression levels are increased following seizures (Roberts et al., 2005). We identified ion channel/transporter genes that show significantly correlated expression (α = 0.05; Bonferroni corrected) in the adult human brain with GABRA4 (Figure 5). The genes highly co-expressed with GABRA4 included those encoding potassium channels which are involved in nervous excitability (Pongs, 1999) and activity-dependent regulation of neuronal signaling (e.g., KCNB1, Park et al., 2006), as well as G-protein coupled receptors (e.g., GPR158) which are crucial for many physiological and disease pathways (Patel et al., 2013). Significantly co-expressed genes with GABRA4 share a large number of MREs for FC specifically expressed miRNAs (Figure 5) consistent with miRNA-mediated crosstalk between ion channel/transporter genes in the GABRA4-subnetwork potentially contributing to their coordinated expression.
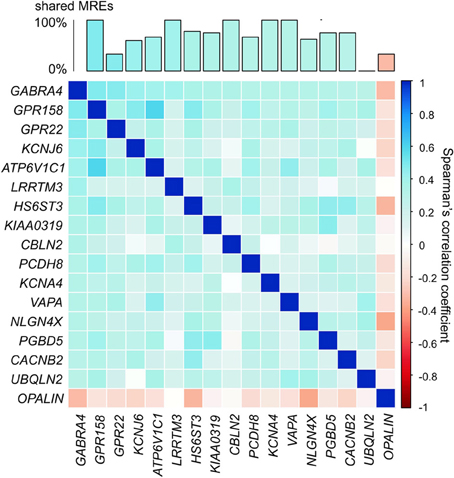
Figure 5. GABRA4-subnetwork. Example of gene in ion channel/transporter network. Correlation matrix of ion channel/transporter genes significantly correlated with GABRA4 (α = 0.05, Bonferroni corrected, pairwise Spearman's correlation). Bar chart shows percentage of MREs GABRA4 shares with every other gene in GABRA4-subnetwork.
Discussion
The biological relevance of the widespread and conserved tendency of protein-coding genes to express isoforms with longer alternative 3′UTRs in brain (Hilgers et al., 2011; Miura et al., 2013) has been poorly understood. Given the role of these regions in the post-transcriptional modulation of relative transcript abundance by means of miRNA mediated cross-talk (Salmena et al., 2011), we hypothesized that long alternative 3′UTRs could enhance the miRNA-regulated abundance of functionally related genes. To test this hypothesis, we used mRNA sequencing data to annotate 3′UTRs in adult human tissues. Consistent with previous analysis in humans (Hilgers et al., 2011; Miura et al., 2013) and other animals (Zhang et al., 2005; Ji et al., 2009; Ulitsky et al., 2012) we find that brain-expressed isoforms have longer alternative 3′UTRs which are enriched for brain-expressed miRNA binding sites (Miura et al., 2013). Our results are not a consequence of limited coverage or other technical bias or limitations resulting from the choice of experimental data set, because expression of extended, relative to constitutive, 3′UTRs is significantly higher in the brain than in other adult tissues. By comparing the expression of alternatively and constitutively expressed nucleotides within the same genes we thus controlled for potential limitations arising from limited depth of sequencing or differences in library preparation. Two major novel findings emerged from our analysis of genes expressing their longest alternative 3′UTRs in the brain. Firstly, that ion channel/transporter genes are enriched within this gene set; secondly that these genes exhibit increased transcriptional coordination mediated by competition for shared FC-specific miRNAs.
Transport across the cellular membrane is primarily mediated by ion channels and other transporter genes and this function is crucial to ensure appropriate responses to changing extra- and intracellular environments. In the brain, transport across the cellular membrane is crucial for cellular excitability. Controlled responses to both excitatory and inhibitory signals that underlie communication between cells in the brain require the dynamic regulation of the abundance and repertoire of ion channel and other transporter proteins (Voglis and Tavernarakis, 2006). This is achieved at several levels including transcriptional and post-translational control. For example, in neurons some ion channel/transporter gene encoding transcripts are enriched at dendrites (Cajigas et al., 2012). Translation of transcripts localized at dendrites is evolutionarily conserved in multiple species (Cajigas et al., 2012) and is believed to allow efficient spatial and temporal resolution of extracellular cues (Matsumoto et al., 2007; Andreassi and Riccio, 2009).
Translation of localized mRNAs is tightly regulated post-transcriptionally by miRNAs, with several brain-expressed miRNAs present within axonal compartments (Loohuis et al., 2012). These miRNAs are capable of actively regulating local mRNA translation (Manakov et al., 2009; Smalheiser and Lugli, 2009). Importantly, miRNA expression and repertoires are highly sensitive to microenvironmental changes, with several miRNAs exhibiting increased transcription, for example upon long term potentiation (Park and Tang, 2009). The observations that both ion channel/transporter genes and miRNAs respond to changes in environment and have specific and overlapping subcellular localizations suggest that their interactions mediate responses to milieu changes. Transmembrane transport that is mediated by ion channels/transporters, in response to changes in cellular microenvironment results in changes in miRNA abundance that in turn will translate in post-transcriptional repression of their targets, including transporter protein-encoding mRNAs. This regulatory feedback loop is likely to provide dynamic yet robust changes in ion channel/transporter abundance (Jiang et al., 2012).
Our findings that a subset of ion channel/transporter genes tend to express longer alternative 3′UTRs in the brain and that the sequence of these extensions is enriched for FC-specific miRNA response elements is consistent with this proposal. Furthermore we show that predicted MREs located at alternative 3′UTRs can enhance the miRNA mediated crosstalk between these transcripts, likely contributing to the observed coordination of ion-channel/transporter genes in the brain.
We propose that the alternative 3′UTRs of ion channel/transporter mRNAs in the brain post-transcriptionally enhance the robustness of dynamic chances of their product abundance in response to differences in cellular microenvironment ensuring coordinated assembly of functional transmembrane channels.
Conflict of Interest Statement
The authors declare that the research was conducted in the absence of any commercial or financial relationships that could be construed as a potential conflict of interest.
Acknowledgments
We would like to thank Christopher Nellåker and Stephen Samson's comments on the contextualization of results and on the manuscript; Wilfried Haerty for derived SNP frequencies in humans and helpful comments; Julia Steinberg and Caleb Webber for critical reading of the manuscript; Carlo Colantuoni and Andrew Jaffe for discussion and providing microarray expression data from braincloud, preprocessed to include one probe per gene; The Human BodyMap 2.0 RNAseq data were kindly provided by the Gene Expression Applications research group at Illumina. Claudia C. Wehrspaun was funded by Wellcome Trust and NIMH; Chris P. Ponting was funded by the Medical Research Council; Ana C. Marques was funded by Fellowship from the Department of Physiology, Anatomy and Genetics, University of Oxford and a Dorothy Hodgkin's Fellowship from the Royal Society.
Supplementary Material
The Supplementary Material for this article can be found online at: http://www.frontiersin.org/journal/10.3389/fgene.2014.00041/abstract
References
Ala, U., Karretha, F. A., Bosiab, C., Pagnanib, A., Taullia, R., Léopolda, V., et al. (2013). Integrated transcriptional and competitive endogenous RNA networks are cross-regulated in permissive molecular environments. Proc. Natl. Acad. Sci. U.S.A. 110, 7154–7159. doi: 10.1073/pnas.1222509110
Alberts, B., Johnson, A., Lewis, J., Raff, M., Roberts, K., and Walter, P. (2002). Molecular Biology of the Cell, 4th Edn. New York, NY: Garland Science.
Andreassi, C., and Riccio, A. (2009). To localize or not to localize: mRNA fate is in 3'UTR ends. Trends Cell Biol. 19, 465–474. doi: 10.1016/j.tcb.2009.06.001
Antzelevitch, C., Pollevick, G. D., Cordeiro, J. M., Casis, O., Sanguinetti, M. C., Aizawa, Y., et al. (2007). Loss-of-function mutations in the cardiac calcium channel underlie a new clinical entity characterized by ST-segment elevation, short QT intervals, and sudden cardiac death. Circulation 115, 442–449. doi: 10.1161/CIRCULATIONAHA.106.668392
ArrayExpress. (2011a). Illumina Bodymap2 Transcriptome. Available online at: http://www.ebi.ac.uk/ena/data/view/ERP000546
ArrayExpress. (2011b). E-MTAB-513 - RNA-Seq of Human Individual Tissues and Mixture of 16 Tissues (Illumina Body Map). Available online at: http://www.ebi.ac.uk/arrayexpress/experiments/E-MTAB-513/
Balmer, D., Goldstine, J., Rao, Y. M., and LaSalle, J. M. (2003). Elevated methyl-CpG-binding protein 2 expression is acquired during postnatal human brain development and is correlated with alternative polyadenylation. J. Mol. Med. 81, 61–68. doi: 10.1007/s00109-002-0396-5
Bartel, D. P. (2009). MicroRNAs: target recognition and regulatory functions. Cell 136, 215–233. doi: 10.1016/j.cell.2009.01.002
Cajigas, I. J., Tushev, G., Will, T. J., Fuerst, N., and Schuman, E. M. (2012). The local transcriptome in the synaptic neuropil revealed by deep sequencing and high-resolution imaging. Neuron 74, 453–466. doi: 10.1016/j.neuron.2012.02.036
Chen, K., and Rajewsky, N. (2006). Natural selection on human microRNA binding sites inferred from SNP data. Nat. Genet. 38, 1452–1456. doi: 10.1038/ng1910
Chi, S. W., Zang, J. B., Mele, A., and Darnell, R. B. (2009). Argonaute HITS-CLIP decodes microRNA-mRNA interaction maps. Nature 460, 479–486. doi: 10.1038/nature08170
Clarke, L., Zheng-Bradley, X., Smith, R., Kulesha, E., Xiao, C., Toneva, I., et al. (2012). The 1000 genomes project: data management and community access. Nat. Methods 9, 459–462. doi: 10.1038/nmeth.1974
Colantuoni, C., Lipska, B. K., Ye, T., Hyde, T. M., Tao, R., Leek, J. T., et al. (2011). Temporal dynamics and genetic control of transcription in the human prefrontal cortex. Nature 478, 519–523. doi: 10.1038/nature10524
Coy, J. F., Sedlacek, Z., Bächner, D., Delius, H., and Poustka, A. (1999). A complex pattern of evolutionary conservation and alternative polyadenylation within the long 3'-untranslated region of the methyl-CpG-binding protein 2 gene (MeCP2) suggests a regulatory role in gene expression. Hum. Mol. Genet. 8, 1253–1262. doi: 10.1093/hmg/8.7.1253
Favereaux, A., Thoumine, O., Bouali-Benazzouz, R., Roques, V., Papon, M.-A., Salam, S. A., et al. (2011). Bidirectional integrative regulation of Cav1. 2 calcium channel by microRNA miR-103: role in pain. EMBO J. 30, 3830–3841. doi: 10.1038/emboj.2011.249
Flicek, P., Amode, M. R., Barrell, D., Beal, K., Brent, S., Carvalho-Silva, D., et al. (2012). Ensembl 2012. Nucleic Acids Res. 40, D84–D90. doi: 10.1093/nar/gkr991
Haerty, W., and Ponting, C. P. (2013). Mutations within lncRNAs are effectively selected against in fruitfly but not in human. Genome Biol. 14:R49. doi: 10.1186/gb-2013-14-5-r49
Han, K., Gennarino, V. A., Lee, Y., Pang, K. F., Hashimoto-Torii, K., Choufani, S., et al. (2013). Human-specific regulation of MeCP2 levels in fetal brains by microRNA miR-483-5p. Gene Dev. 27, 485–490. doi: 10.1101/gad.207456.112
Hilgers, V., Perry, M. W., Hendrix, D., Stark, A., Levine, M., and Haley, B. (2011). Neural-specific elongation of 3' UTRs during Drosophila development. Proc. Natl. Acad. Sci. U.S.A. 108, 15864–15869. doi: 10.1073/pnas.1112672108
Holtmaat, A., and Svoboda, K. (2009). Experience-dependent structural synaptic plasticity in the mammalian brain. Nat. Rev. Neurosci. 10, 647–658. doi: 10.1038/nrn2699
Huang, D. W., Sherman, B. T., and Lempicki, R. A. (2009). Systematic and integrative analysis of large gene lists using DAVID bioinformatics resources. Nat. Protoc. 4, 44–57. doi: 10.1038/nprot.2008.211
Hughes, T. A. (2006). Regulation of gene expression by alternative untranslated regions. Trends Genet. 22, 119–122. doi: 10.1016/j.tig.2006.01.001
Iseli, C., Stevenson, B. J., Souza, S. J. D., Samaia, H. B., Camargo, A. A., Buetow, K. H., et al. (2002). Long-range heterogeneity at the 3' ends of human mRNAs. Genome Res. 12, 1068–1074. doi: 10.1101/gr.62002
Jentsch, T. J., Hubner, C. A., and Fuhrmann, J. C. (2004). Ion channels: function unravelled by dysfunction. Nat. Cell Biol. 6, 1039–1047. doi: 10.1038/ncb1104-1039
Ji, Z., Lee, J. Y., Pan, Z. H., Jiang, B. J., and Tian, B. (2009). Progressive lengthening of 3' untranslated regions of mRNAs by alternative polyadenylation during mouse embryonic development. Proc. Natl. Acad. Sci. U.S.A. 106, 7028–7033. doi: 10.1073/pnas.0900028106
Jiang, X., Zhang, J. T., and Chan, H. C. (2012). Ion channels/transporters as epigenetic regulators? —A microRNA perspective. Sci. China Life Sci. 55, 753–760. doi: 10.1007/s11427-012-4369-9
Kawase-Koga, Y., Otaegi, G., and Sun, T. (2009). Different timings of dicer deletion affect neurogenesis and gliogenesis in the developing mouse central nervous system. Dev. Dyn. 238, 2800–2812. doi: 10.1002/dvdy.22109
Kuersten, S., and Goodwin, E. B. (2003). The power of the 3' UTR: Translational control and development. Nat. Rev. Genet. 4, 626–637. doi: 10.1038/nrg1125
Landgraf, P., Rusu, M., Sheridan, R., Sewer, A., Iovino, N., Aravin, A., et al. (2007). A mammalian microRNA expression atlas based on small RNA library sequencing. Cell 129, 1401–1414. doi: 10.1016/j.cell.2007.04.040
Lewis, B. P., Burge, C. B., and Bartel, D. P. (2005). Conserved seed pairing, often flanked by adenosines, indicates that thousands of human genes are microRNA targets. Cell 120, 15–20. doi: 10.1016/j.cell.2004.12.035
Loohuis, N. F. M. O., Kos, A., Martens, G. J. M., Van Bokhoven, H., Kasri, N. N., and Aschrafi, A. (2012). MicroRNA networks direct neuronal development and plasticity. Cell. Mol. Life Sci. 69, 89–102. doi: 10.1007/s00018-011-0788-1
Lunter, G., Ponting, C. P., and Hein, J. (2006). Genome-wide identification of human functional DNA using a neutral indel model. PLoS Comput. Biol. 2, 2–12. doi: 10.1371/journal.pcbi.0020005
Manakov, S. A., Grant, S. G. N., and Enright, A. J. (2009). Reciprocal regulation of microRNA and mRNA profiles in neuronal development and synapse formation. BMC Genomics, 10:419. doi: 10.1186/1471-2164-10-419
Mangone, M., Manoharan, A. P., Thierry-Mieg, D., Thierry-Mieg, J., Han, T., Mackowiak, S. D., et al. (2010). The landscape of C. elegans 3'UTRs. Science 329, 432–435. doi: 10.1126/science.1191244
Marques, A. C., and Ponting, C. P. (2009). Catalogues of mammalian long noncoding RNAs: modest conservation and incompleteness. Genome Biol. 10:R124. doi: 10.1186/gb-2009-10-11-r124
Matsumoto, M., Setou, M., and Inokuchi, K. (2007). Transcriptome analysis reveals the population of dendritic RNAs and their redistribution by neural activity. Neurosci. Res. 57, 411–423. doi: 10.1016/j.neures.2006.11.015
Merico, D., Isserlin, R., Stueker, O., Emili, A., and Bader, G. D. (2010). Enrichment map: a network-based method for gene-set enrichment visualization and interpretation. PLoS ONE 5:e13984. doi: 10.1371/journal.pone.0013984
Miura, P., Shenker, S., Andreu-Agullo, C., Westholm, J. O., and Lai, E. C. (2013). Widespread and extensive lengthening of 3'UTRs in the mammalian brain. Genome Res. 23, 812–825. doi: 10.1101/gr.146886.112
Nelson, P. T., Wang, W. X., and Rajeev, B. W. (2008). MicroRNAs (miRNAs) in neurodegenerative diseases. Brain Pathol. 18, 130–138. doi: 10.1111/j.1750-3639.2007.00120.x
Park, C. S., and Tang, S. J. (2009). Regulation of microRNA expression by induction of bidirectional synaptic plasticity. J. Mol. Neurosci. 38, 50–56. doi: 10.1007/s12031-008-9158-3
Park, K. S., Mohapatra, D. P., Misonou, H., and Trimmer, J. S. (2006). Graded regulation of the Kv2.1 potassium channel by variable phosphorylation. Science 313, 976–979. doi: 10.1126/science.1124254
Patel, N., Itakura, T., Gonzalez, J. M. Jr., Schwartz, S. G., and Fini, M. E. (2013). GPR158, an orphan member of G protein-coupled receptor Family C: glucocorticoid-stimulated expression and novel nuclear role. PLoS ONE 8:e57843. doi: 10.1371/journal.pone.0057843
Pongs, O. (1999). Voltage-gated potassium channels: from hyperexcitability to excitement. FEBS Lett. 452, 31–35. doi: 10.1016/S0014-5793(99)00535-9
Quinlan, A. R., and Hall, I. M. (2010). BEDTools: a flexible suite of utilities for comparing genomic features. Bioinformatics 26, 841–842. doi: 10.1093/bioinformatics/btq033
Ramskold, D., Wang, E. T., Burge, C. B., and Sandberg, R. (2009). An abundance of ubiquitously expressed genes revealed by tissue transcriptome sequence data. PLoS Comput. Biol. 5:e1000598. doi: 10.1371/journal.pcbi.1000598
Roberts, D. S., Raol, Y. H., Bandyopadhyay, S., Lund, I. V., Budreck, E. C., Passini, M. J., et al. (2005). Egr3 stimulation of GABRA4 promoter activity as a mechanism for seizure-induced up-regulation of GABA(A) receptor alpha 4 subunit expression. Proc. Natl. Acad. Sci. U.S.A. 102, 11894. doi: 10.1073/pnas.0501434102
Salmena, L., Poliseno, L., Tay, Y., Kats, L., and Pandolfi, P. P. (2011). A ceRNA hypothesis: the Rosetta Stone of a hidden RNA language? Cell 146, 353–358. doi: 10.1016/j.cell.2011.07.014
Schulz, D. J., Temporal, S., Barry, D. M., and Garcia, M. L. (2008). Mechanisms of voltage-gated ion channel regulation: from gene expression to localization. Cell. Mol. Life Sci. 65, 2215–2231. doi: 10.1007/s00018-008-8060-z
Shen, H., Sabaliauskas, N., Sherpa, A., Fenton, A. A., Stelzer, A., Aoki, C., et al. (2010). A critical role for alpha 4 beta delta GABA(A) receptors in shaping learning deficits at puberty in mice. Science 327, 1515–1518. doi: 10.1126/science.1184245
Shyu, A. B., Wilkinson, M. F., and van Hoof, A. (2008). Messenger RNA regulation: to translate or to degrade. EMBO J. 27, 471–481. doi: 10.1038/sj.emboj.7601977
Smalheiser, N. R., and Lugli, G. (2009). microRNA regulation of synaptic plasticity. Neuromolecular Med. 11, 133–140. doi: 10.1007/s12017-009-8065-2
Smibert, P., Miura, P., Westholm, J. O., Shenker, S., May, G., Duff, M. O., et al. (2012). Global patterns of tissue-specific alternative polyadenylation in Drosophila. Cell Rep. 1, 277–289. doi: 10.1016/j.celrep.2012.01.001
Splawski, I., Timothy, K. W., Priori, S. G., Napolitano, C., and Bloise, R. (2006). “Timothy syndrome,” in GeneReviewsTM, eds R. A. Pagon, M. P. Adam, T. D. Bird, C. R. Dolan, C. T. Fong, and K. Stephens. Available online at: http://www.ncbi.nlm.nih.gov/books/NBK1403/2006
Stark, A., Brennecke, J., Bushati, N., Russell, R. B., and Cohen, S. M. (2005). Animal MicroRNAs confer robustness to gene expression and have a significant impact on 3'UTR evolution. Cell 123, 1133–1146. doi: 10.1016/j.cell.2005.11.023
Supek, F., Bosnjak, M., Skunca, N., and Smuc, T. (2011). REVIGO summarizes and visualizes long lists of gene ontology terms. PLoS ONE 6:e21800. doi: 10.1371/journal.pone.0021800
Trapnell, C., Pachter, L., and Salzberg, S. L. (2009). TopHat: discovering splice junctions with RNA-Seq. Bioinformatics 25, 1105–1111. doi: 10.1093/bioinformatics/btp120
Trapnell, C., Williams, B. A., Pertea, G., Mortazavi, A., Kwan, G., van Baren, M. J., et al. (2010). Transcript assembly and quantification by RNA-Seq reveals unannotated transcripts and isoform switching during cell differentiation. Nat. Biotechnol. 28, 511–515. doi: 10.1038/nbt.1621
Ulitsky, I., Shkumatava, A., Jan, C. H., Subtelny, A. O., Koppstein, D., Bell, G. W., et al. (2012). Extensive alternative polyadenylation during zebrafish development. Genome Res. 22, 2054–2066. doi: 10.1101/gr.139733.112
Vaquerizas, J. M., Kummerfeld, S. K., Teichmann, S. A., and Luscombe, N. M. (2009). A census of human transcription factors: function, expression and evolution. Nat. Rev. Genet. 10, 252–263. doi: 10.1038/nrg2538
Voglis, G., and Tavernarakis, N. (2006). The role of synaptic ion channels in synaptic plasticity. EMBO Rep. 7, 1104–1110. doi: 10.1038/sj.embor.7400830
Wang, E. T., Sandberg, R., Luo, S. J., Khrebtukova, I., Zhang, L., Mayr, C., et al. (2008). Alternative isoform regulation in human tissue transcriptomes. Nature 456, 470–476. doi: 10.1038/nature07509
Wang, Y., Liang, Y., and Lu, Q. (2008). MicroRNA epigenetic alterations: predicting biomarkers and therapeutic targets in human diseases. Clin. Genet. 74, 307–315. doi: 10.1111/j.1399-0004.2008.01075.x
Whiting, P. J., Bonnert, T. P., McKernan, R. M., Farrar, S., Le Bourdelles, B., Heavens, R. P., et al. (1999). Molecular and functional diversity of the expanding GABA-A receptor gene family. Ann. N.Y. Acad. Sci. 868, 645–653. doi: 10.1111/j.1749-6632.1999.tb11341.x
Wu, D., Raafat, A., Pak, E., Clemens, S., and Murashov, A. K. (2012). Dicer-microRNA pathway is critical for peripheral nerve regeneration and functional recovery in vivo and regenerative axonogenesis in vitro. Exp. Neurol. 233, 555–565. doi: 10.1016/j.expneurol.2011.11.041
Keywords: 3′untranslated region, 3′ UTR, gene expression, brain, miRNA, ion channels, transporters, competitive endogenous RNAs
Citation: Wehrspaun CC, Ponting CP and Marques AC (2014) Brain-expressed 3′UTR extensions strengthen miRNA cross-talk between ion channel/transporter encoding mRNAs. Front. Genet. 5:41. doi: 10.3389/fgene.2014.00041
Received: 04 December 2013; Accepted: 03 February 2014;
Published online: 26 February 2014.
Edited by:
Seth G. Grant, The University of Edinburgh, UKReviewed by:
Ilan A. Kerman, University of Alabama at Birmingham, USAClaudia V. Maurer-Morelli, University of Campinas, Brazil
Copyright © 2014 Wehrspaun, Ponting and Marques. This is an open-access article distributed under the terms of the Creative Commons Attribution License (CC BY). The use, distribution or reproduction in other forums is permitted, provided the original author(s) or licensor are credited and that the original publication in this journal is cited, in accordance with accepted academic practice. No use, distribution or reproduction is permitted which does not comply with these terms.
*Correspondence: Claudia C. Wehrspaun and Ana C. Marques, Department of Physiology, Anatomy and Genetics, University of Oxford, South Parks Road, Oxford OX1 3Q, UK e-mail: claudia.wehrspaun@dpag.ox.ac.uk; ana.marques@dpag.ox.ac.uk