 Milena Ferreira1*
 Caroline Garcia2Daniele A. Matoso3Isac S. de Jesus4
 Marcelo de B. Cioffi5
 Luiz A. C. Bertollo5
 Jansen Zuanon6
 Eliana Feldberg1
- 1Laboratório de Genética Animal, Coordenação de Biodiversidade, Instituto Nacional de Pesquisas da Amazônia, Manaus, Brazil
- 2Laboratório de Citogenética, Departamento de Ciências Biológicas, Universidade Estadual do Sudoeste da Bahia, Jequié, Brazil
- 3Laboratório de Citogenômica Animal, Instituto de Ciências Biológicas, Departamento de Genética, Universidade Federal do Amazonas, Manaus, Brazil
- 4Laboratório de Fisiologia Comportamental e Evolução, Coordenação de Biodiversidade, Instituto Nacional de Pesquisas da Amazônia, Manaus, Brazil
- 5Departamento de Genética e Evolução, Universidade Federal de São Carlos, São Carlos, Brazil
- 6Laboratório de Sistemática e Ecologia de Peixes, Coordenação de Biodiversidade, Instituto Nacional de Pesquisas da Amazônia, Manaus, Brazil
Bunocephalus is the most species-rich Aspredinidae genus, corresponding to a monophyletic clade with 13 valid species. However, many species have their classification put in question. Here, we analyzed individuals from four Amazonian populations of Bunocephalus coracoideus by cytogenetic and molecular procedures. The geographic distribution, genetic distances and karyotype data indicate that each population represents an Evolutionary Significant Unit (ESU). Cytogenetic markers showed distinct 2n and karyotype formulas, as well as different numbers and locations of the rDNA sites among ESUs. One of such populations (ESU-D) highlighted an extensive polymorphic condition, with several cytotypes probably due to chromosomal rearrangements and meiotic non-disjunctions. This resulted in several aneuploid karyotypes, which was also supported by the mapping of telomeric sequences. Phylograms based on Maximum Likelihood (ML) and Neighbor Joining (NJ) analyses grouped each ESU on particular highly supported clades, with the estimation of evolutionary divergence indicating values being higher than 3.8–12.3% among them. Our study reveals a huge degree of chromosomal and genetic diversity in B. coracoideus and highly points to the existence of four ESUs in allopatric and sympatric speciation processes. In fact, the high divergences found among the ESUs allowed us to delimitate lineages with taxonomic uncertainties in this nominal species.
Introduction
Bunocephalus is the most species-rich Aspredinidae genus, corresponding to a monophyletic clade (Cardoso, 2008, 2010) with 13 valid species (Eschmeyer et al., 2017). However, many species have their classification put in question (Carvalho et al., 2015), and, consequently, with questionable taxonomy. The genetic divergence among morphologically indistinguishable specimens within a single “species” rises doubts on their taxonomic status, once such variations imply in cladogenesis processes (Bickford et al., 2007), which may end up in speciation. Some approaches based only on morphological data may sometimes underestimate such variation due to the phenotypic plasticity evidenced by a significant number of species. Thus, an integrative cytotaxonomic, molecular and morphological analysis is required, attempting to elucidate the real taxonomic status of polymorphic species.
Cytogenetic studies, including the molecular organization and cytogenetic mapping of repetitive DNAs might be a significant data set for the characterization of particular segments of biota, providing important information for phylogenomics (Cioffi et al., 2012). Besides, these sequences seem to escape the selective pressure that acts in the non-repetitive segments, thus representing good evolutionary markers to detect recent events of evolution, once the number and location of these sequences may reveal polymorphisms, with intra- and inter-specific variations due to rearrangements, even in conserved karyotypes (Cioffi et al., 2009; Matoso et al., 2011; Motta-Neto et al., 2012; Oliveira et al., 2015). Up to now, only two Bunocephalus species had cytogenetic studies already conducted, B. doriae and B. coracoideus. While the first one has 2n = 50 chromosomes, the later presents 2n = 42, in addition to a multiple X1X1X2X2/X1Y1X2Y2 sex chromosome system (Fenocchio and Swarça, 2012; Ferreira et al., 2016).
Besides, genetic data can unmask distinct populations covered by a same taxonomic status, which are identified as Significant Evolutionary Units (ESUs) by the conservation biology area. Thus, ESU corresponds to a population, or even to a group of populations, genetically distinct within a given species that contribute to biodiversity (Hey et al., 2003). The ESUs recognition is a task that requires the accordance of a group of procedures as an identification criterion.
The present study is a contribution to the biodiversity presented by B. coracoideus using DNA barcoding and conventional and molecular cytogenetic methodologies. It was analyzed four allopatric populations from the Amazonian hydrographic basin and the results were able to highlight a huge cryptic diversity both intra- and inter-populations, pointing out that B. coracoideus corresponds to a species complex.
Materials and Methods
Specimens
Individuals of Bunocephalus coracoideus from four populations of distinct drainages of the Amazon River were analyzed (Figure 1 and Table 1). The specimens were collected under appropriate authorization of the Brazilian environmental agency ICMBIO/SISBIO (License number 48795-1). All specimens were properly identified by morphological criteria and voucher samples were deposited in the fish collections of the National Institute for Amazon Research (INPA: Instituto Nacional de Pesquisas da Amazônia). The experiments followed ethical and anesthesia conducts, in accordance with the Ethics Committee for Animal Use of the National Institute of Amazon Research, under the protocol number 010/2015.
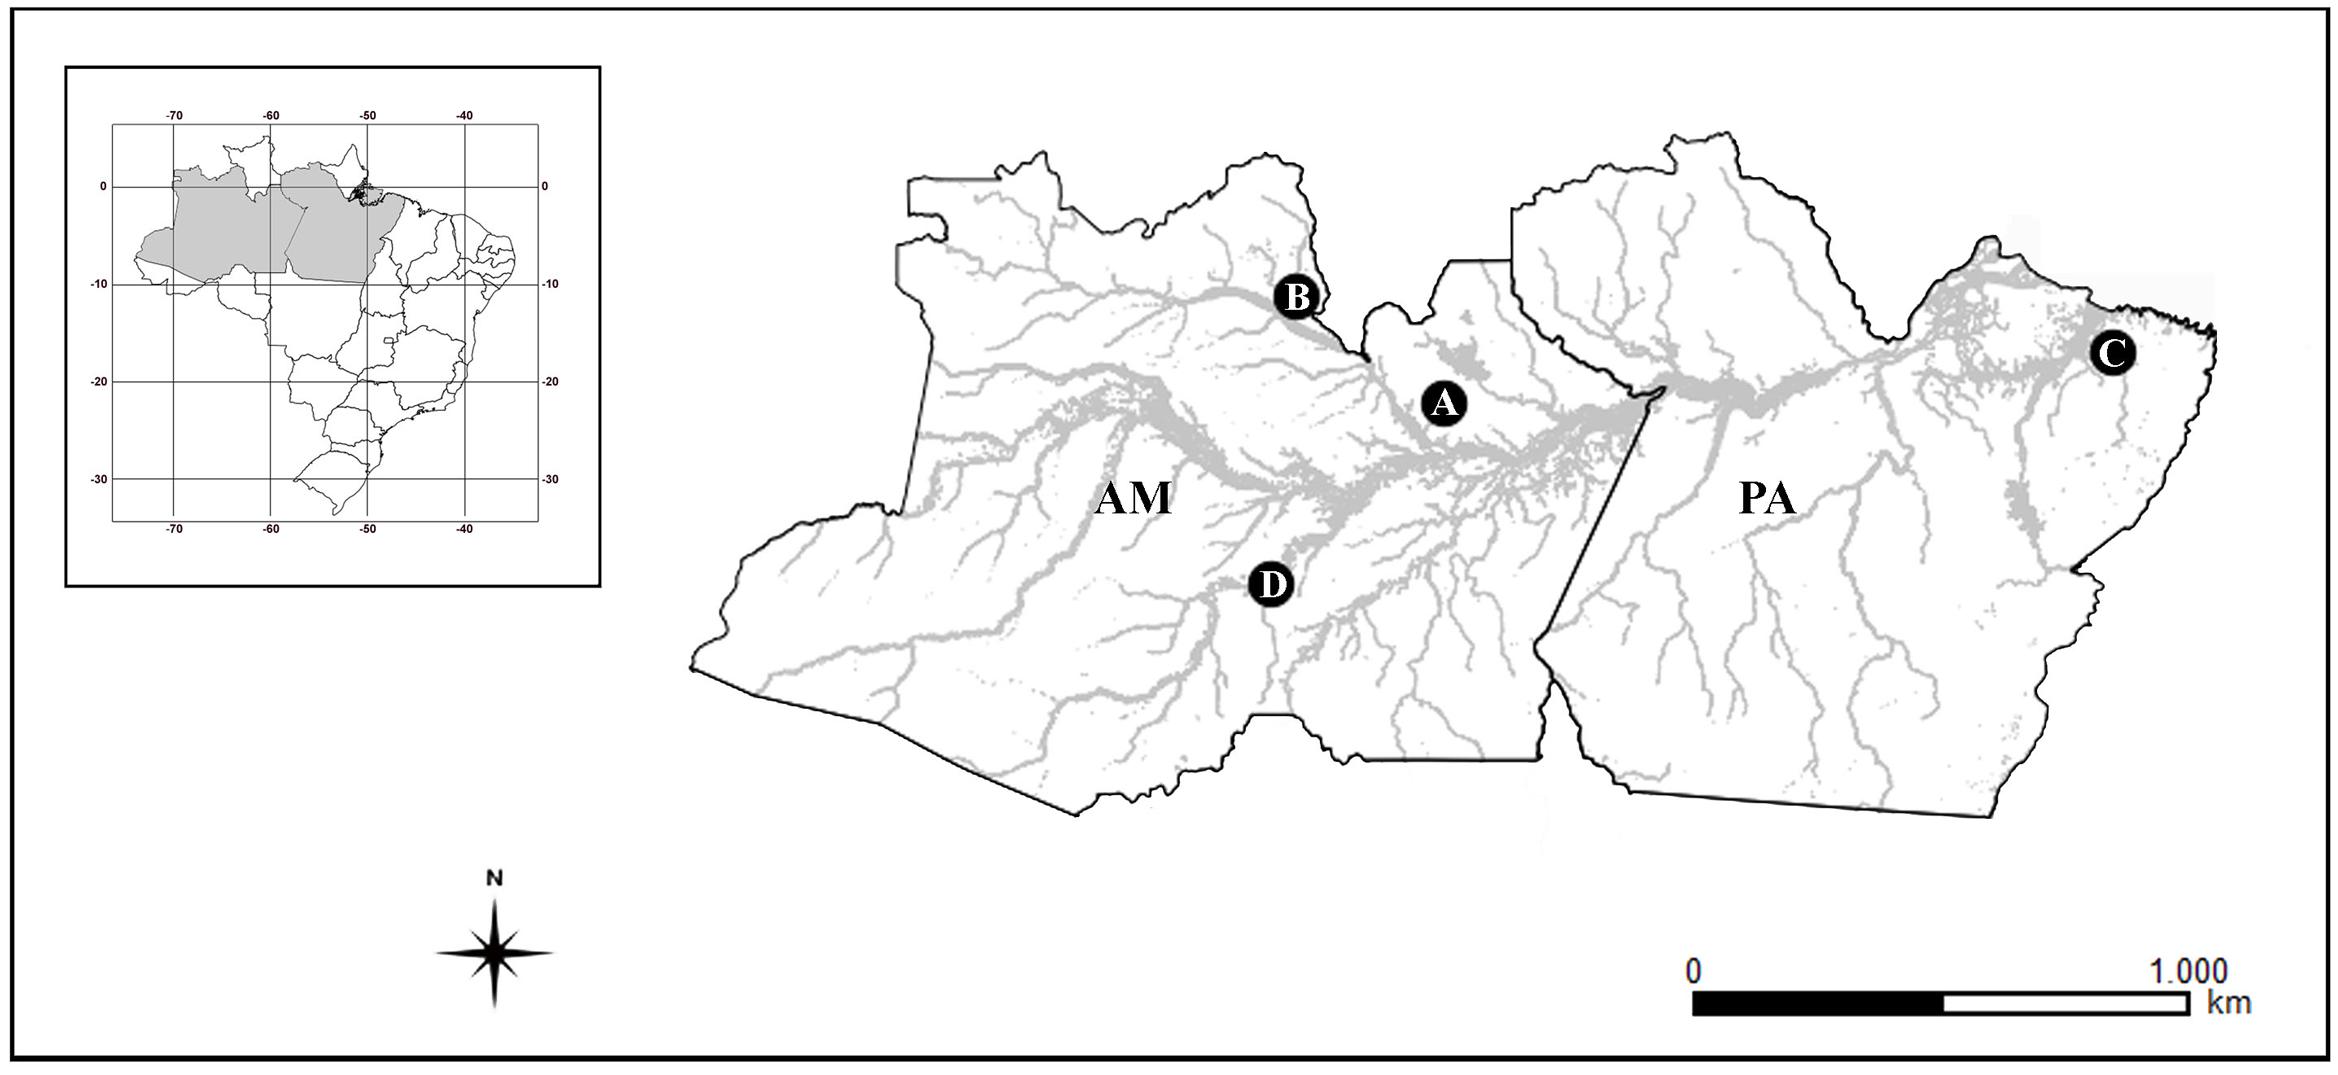
FIGURE 1. Amazonas (AM) and Pará (PA) Brazilian states map, highlighting the collection sites of the analyzed species. (A) ESU-A Igarapé Jundiá – Cuieiras River, (B) ESU-B Demini River, (C) ESU-C Igarapé Apeú – Guamá River, and (D) SEU-D1-14 Purus River.
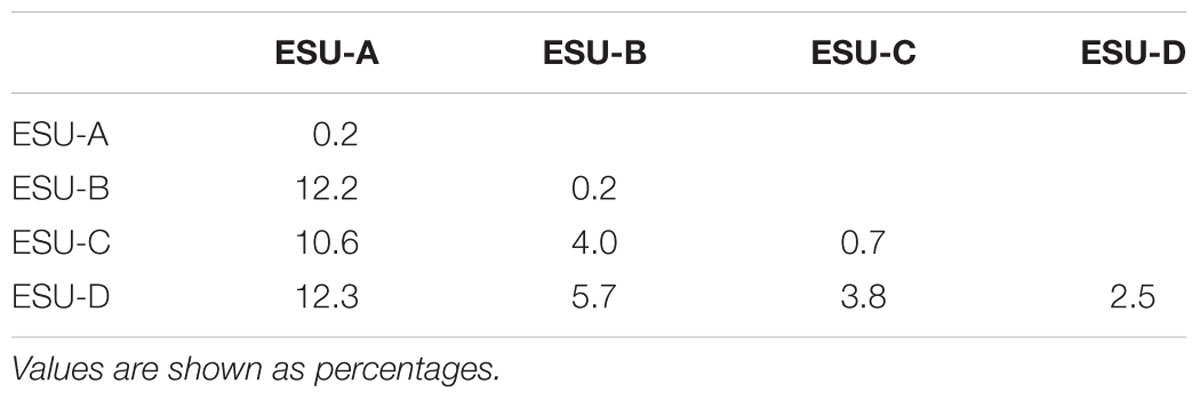
TABLE 1. Estimates of evolutionary divergence between sequences using the COI gene and the K2P model.
Mitotic and Meiotic Chromosomal Preparations
Mitotic chromosomes were obtained from the kidney cells according to the protocol described by Gold et al. (1990), using RPMI culture medium (Cultilab). Male testis were used for meiotic preparations, following the protocols described by Bertollo et al. (1978), with changes introduced by Gross et al. (2009). For conventional cytogenetic analysis the chromosomes were stained with 5% Giemsa solution (pH 6.8).
Preparation of FISH Probes
The GoTaq Colorless Master Mix (Promega) was used for the polymerase chain reaction (PCR) amplification of the 18S and 5S rRNA genes and telomeric sequences, using the following primers: 18Sf (5′-CCG CTT TGG TGA CTC TTG AT-3′), 18Sr (5′-CCG AGGACC TCA CTA AAC CA-3′) (Gross et al., 2010), 5S A (5′-TAC GCC CGA TCT CGT CCG ATC-3′), and 5S B (5′-CAGGCT GGT ATG GCC GTA AGC-3′) (Martins and Galetti, 1999). The ribosomal sequence amplification cycles comprised a denaturation for 2 min at 95°C; 35 cycles of 1 min at 94°C, 30 seg. at 56°C, and 1.5 min at 72°C; a final extension of 5 min at 72°C; and a cooling period at 4°C. The primers (TTAGGG)5 and (CCCTAA)5 (Ijdo et al., 1991), were used to obtaining telomeric sequences. PCR was performed with the following profile: 4 min at 94°C; 12 cycles of 1 min at 94°C, 45 s at 52°C, and 1.5 min at 72°C; and 35 cycles of 1 min at 94°C, 1.5 min at 60°C, and 1.5 min at 72°C. The 18S rDNA and the telomeric probes were labeled with digoxigenin-11 dUTP using a DIG-Nick Translation Mix kit (Roche), while the 5S rDNA probe was labeled with biotin-14-dATP using a Biotin-Nick Translation Mix kit (Roche) according to the manufacturer’s instructions.
Detection of Repetitive DNA Sequences by FISH
Fluorescence in situ hybridization (FISH) was performed according to the protocol described by Pinkel et al. (1986), with some modifications. The 18S rDNA and telomeric probes were detected with Anti-digoxigenin-rhodamin (Roche, Basel, Switzerland), while the 5S rDNA probe was detected with avidin-FITC (Sigma). Chromosomes were counterstained with DAPI (1.2 μg/ml) and slides mounted with antifade solution (Vector, Burlingame, CA, United States).
Microscopic Analysis and Image Processing
At least 30 metaphase spreads per individual were analyzed to confirm the 2n, karyotype structure and FISH results. Images were captured using an Olympus BX50 microscope (Olympus Corporation, Ishikawa, Japan) with CoolSNAP camera and the images processed using Image Pro Plus 4.1 software (Media Cybernetics, Silver Spring, MD, United States). The chromosome classification followed the method proposed by Levan et al. (1964), with the following limits for the arms relationship (AR): AR = 1.00–1.70, metacentric (m); AR = 1.71–3.00, submetacentric (sm); AR = 3.01–7.00, subtelocentric (st); and AR > 7.00, acrocentric (a). For the number of chromosome arms [fundamental number (FN)], the metacentric, submetacentric, and subtelocentric chromosomes was considered having two chromosomal arms and the acrocentric chromosomes a single one.
DNA Barcoding Analysis
Representatives of each population were used (Table 1). Bunocephalus cf. aloikae, B. amaurus, and Amaralia hypsiura species were used as out groups. Tissues of liver and muscle were stored in absolute ethanol for the acquisition of Cytochrome C Oxidase Subunit 1 (COI) sequences. Total DNA was obtained by Wizard® Genomic DNA Purification Kit. The pair of primers used for the COI mitochondrial region amplification in PCR reactions was VF1_t1 (TGT AAA ACG GCC AGT CAA CCA ACC ACA AAG ACA TTG G) + VR1_t1 (CAG GAA ACA GCT ATG ACT AGA CTT CTG GGT GGC CAA AGA ATC A) (Ivanova et al., 2006). Each PCR reaction presented a final volume of 25 μl containing 1 μl of DNA template [250 ng/μl] + 1 μl of each primer [5 pM]. It was used the GoTaq Colorless Master Mix® (Promega) for the PCR. The amplification cycles comprised denaturation, 2 min at 95°C; 35 cycles of 1 min at 94°C, 30 seg. at 56°C, and 1.5 min at 72°C; a final extension of 5 min at 72°C; and a cooling period at 4°C. PCR products were visualized on a 1.7% agarose gel and purified with 20% PEG (Lis, 1980). For sequencing it was used a “Big Dye Sequence Terminator v.3.1” kit (Applied Biosystems), according to the manufacturer instructions. The amplification conditions were comprised 25 cycles at 96°C for 30 seg.; 15 seg. at 50°C; and 4 min at 60°C. After the reaction, the products were precipitated and sequenced (sequencer model ABI PRISM 3100 Genetic Analyzer from Applied Biosystems/made by HITACHI).
Sequence Alignment and Phylogenetic Analysis
Sequences with 690 pb were used to perform the barcoding analyses, by using COI gene, which were aligned using the Geneious® 10.1.3 software. The distance model of Kimura 2-parameters (Kimura, 1980), was used to build a Neighbor-Joining (NJ) dendrogram and a bootstrap analyses was performed (Felsenstein, 1985) with 1,000 replicates. All the aligned sequences were translated into amino acids to detect possible alignment errors. The Maximum Likelihood (ML) model (Tamura et al., 2004) was performed to recover the phylogenetic topology. All positions containing gaps and missing data were eliminated. There were a total of 461 positions in the final dataset. Pairwise genetic distance calculations and NJ tree analysis were implemented using Molecular Evolutionary Genetics Analysis version 5 (MEGA5) software (Tamura et al., 2011) and applying 1,000 bootstrap replicates.
Results
Cytogenetic Data
The four B. coracoideus populations presented distinct karyotypes, which classified as evolutionary significant units (ESUs), with the following characteristics ESU-A: 42 chromosomes (16m+20sm+4st+2a, NF = 82) from Igarapé Jundiá – Cuieiras River (Figure 2A), ESU-B: 44 chromosomes (2m+14sm+2st+26a, NF = 62) from Demini River (Figure 2B) and ESU-C: 56 chromosomes (4m+12sm+6st+34a, NF = 78) from Igarapé Apeú – Guamá River (Figure 2C). There was no karyotype differentiation among males and females in these populations. For the ESU-D, from Purus River, 14 distinct cytotypes bearing variant chromosomes in number and morphology were observed, with 2n varying from 40 to 46. Due to such variation, chromosomes were not grouped in pairs once homeology was not usually found among the distinct cytotypes (Figure 3). Significant variations were also found concerning the 18S rDNA carrier chromosomes, localization and number of sites. For ESUs A, B, and C such sequences were found in one or five chromosomes pairs, in the pericentromeric or telomeric regions, in the short or long arms (Figure 2). Similar results were also detected among the cytotypes of the ESU-D. However, in this case, although the telomeric position of the sites was consistent for all cytotypes, they were found in the short arms of two chromosomes in the cytotypes D1, D2, D4, D5, D6, D7, D8, D9, D11, D12 and D14, but in only one chromosome in the cytotypes D3 and D10. In turn, the cytotype D13 highlighted two chromosomes bearing sites in the short arms and three chromosomes in the long arms (Figure 3).
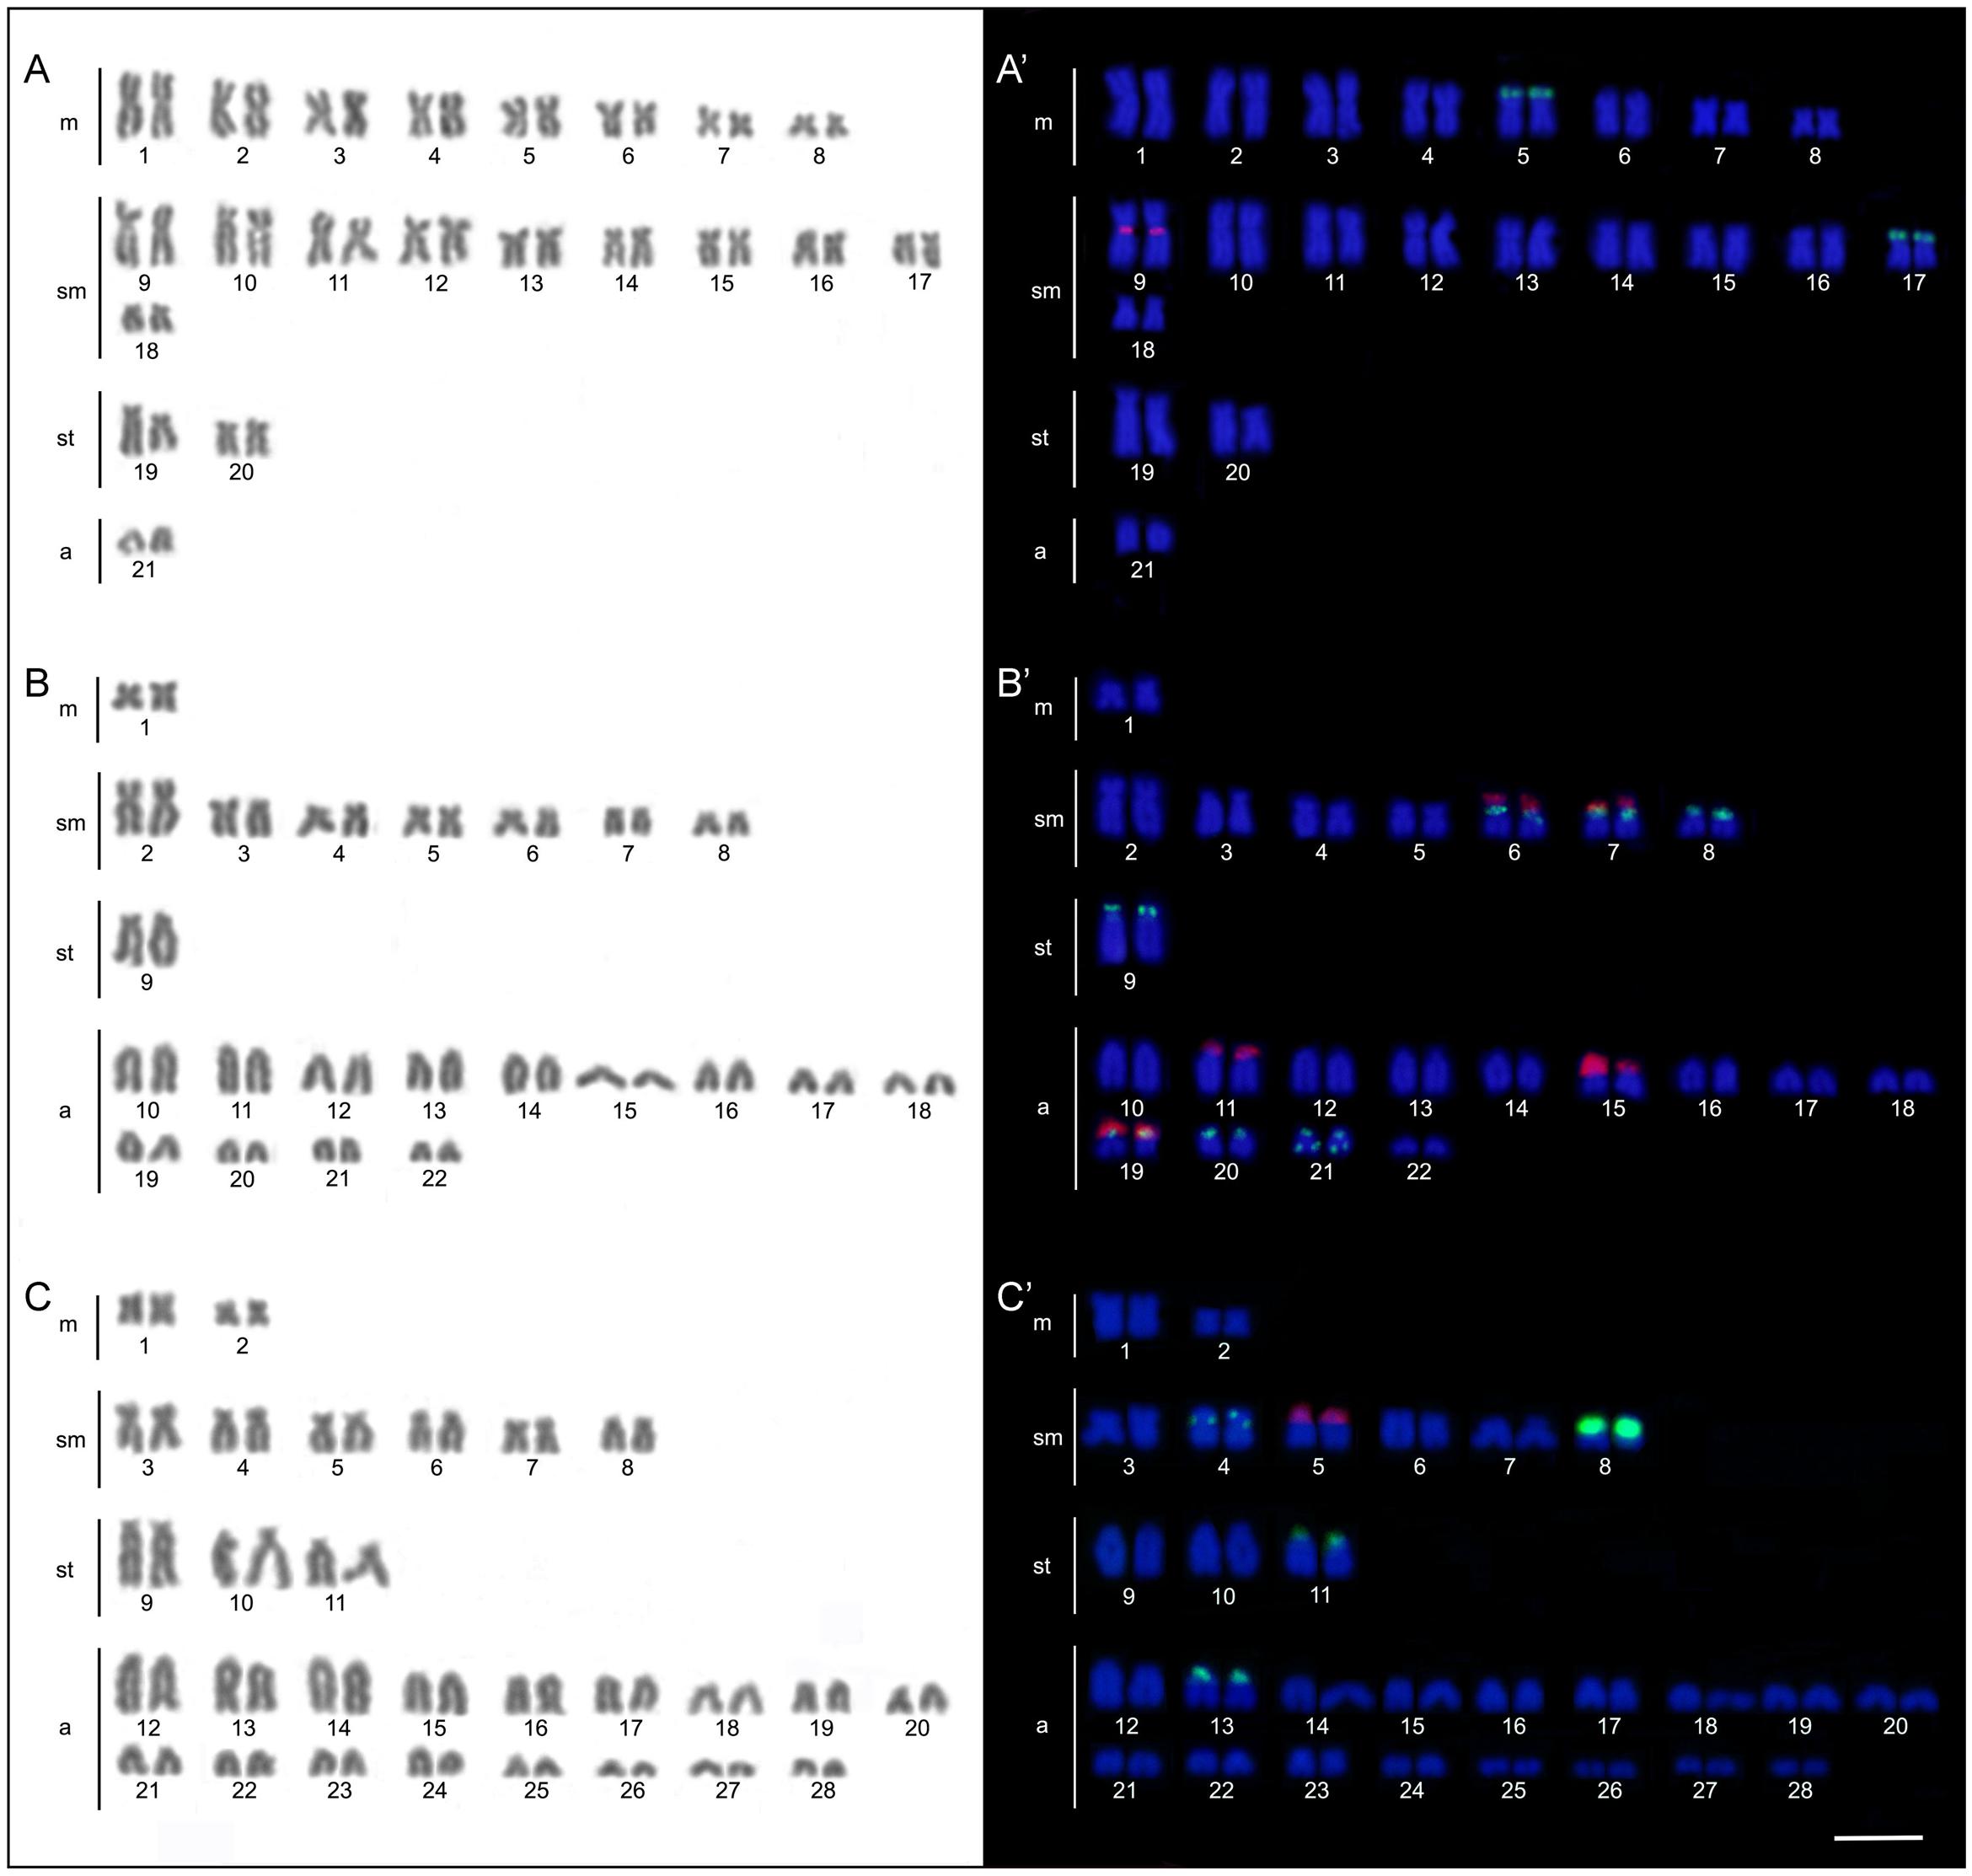
FIGURE 2. Bunocephalus coracoideus karyotypes. On the left, Giemsa staining; on the right. Double-FISH evidencing chromosome pairs bearing the 18S rDNA (red) and 5S rDNA (green) sequences. (A,A′) ESU-A Igarapé Jundiá – Cuieiras River, (B,B′) ESU –B Demini River (Cuieiras River) and (C,C′) ESU-C Igarapé Apeú – Guamá River. Bar = 10 μm.
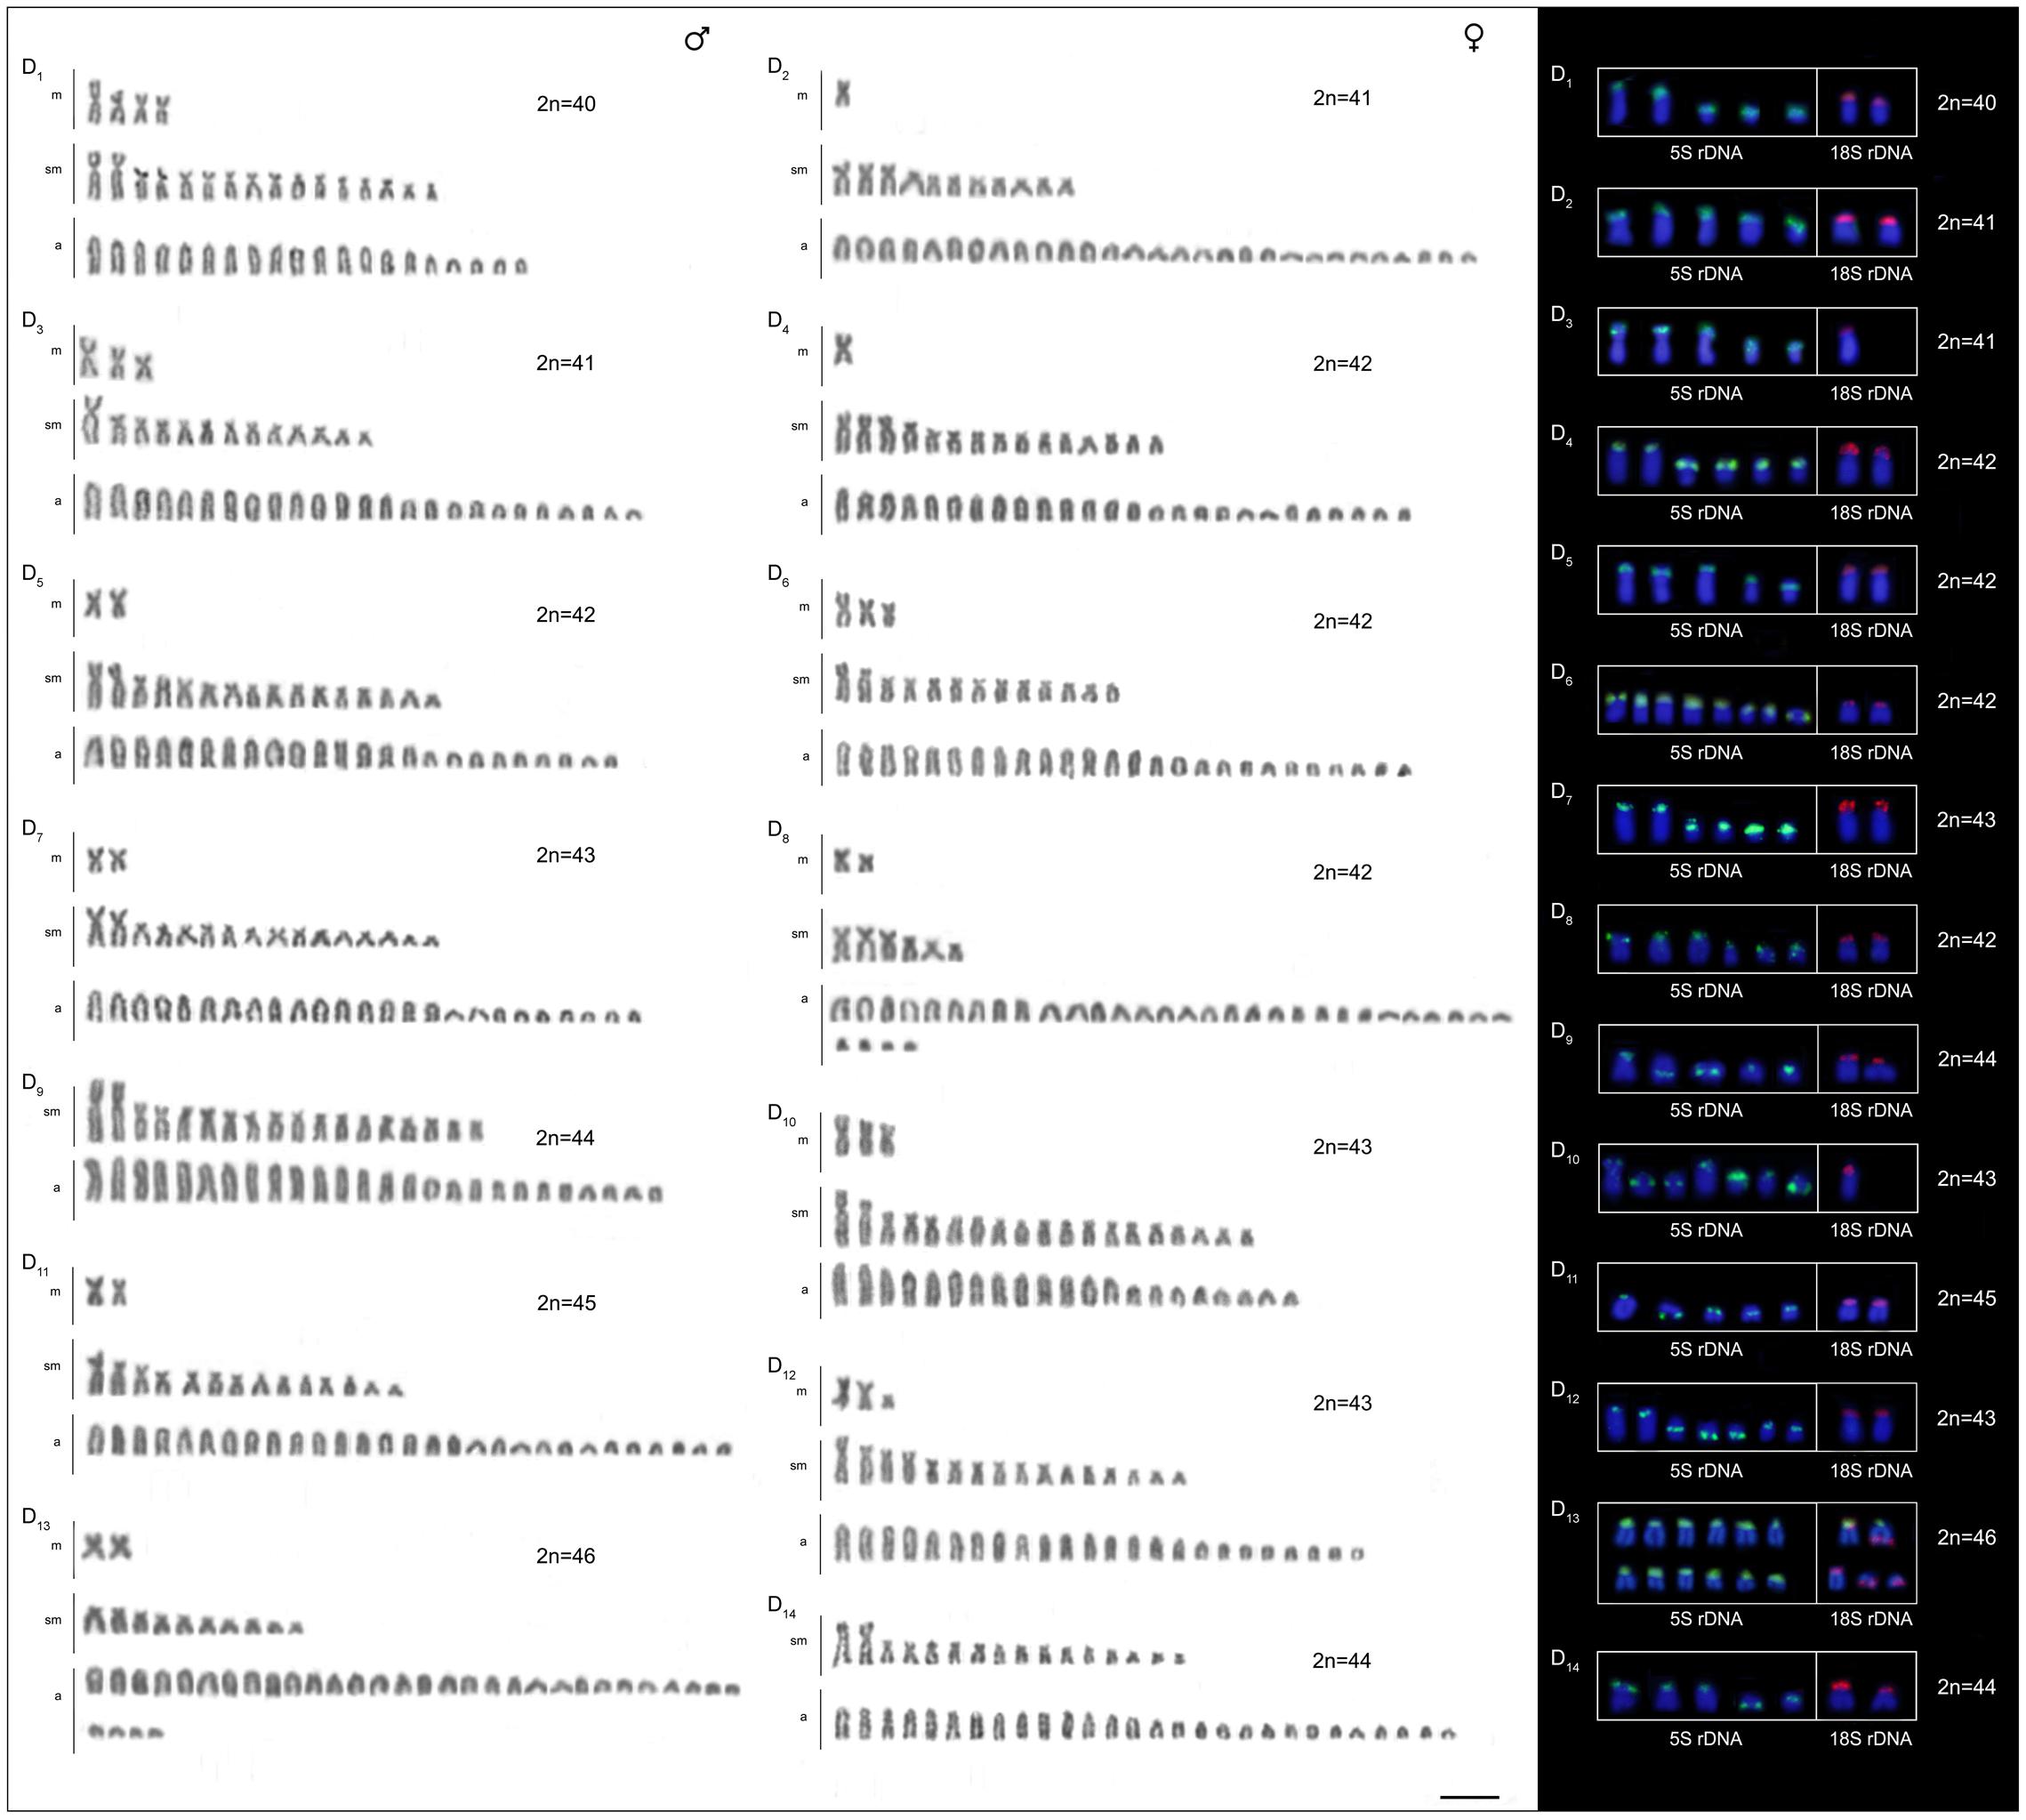
FIGURE 3. Cytotypes of B. coracoideus ESU-D1-14 Purus River, with Giemsa staining. For this ESU chromosomes were not paired, once no homeology was usually found between the correspondent pairs among the distinct cytotypes. On the right, double-FISH showing the chromosome pairs bearing the 18S rDNA (red) and 5S (green) sequences. Bar = 10 μm.
Likewise, the 5S rDNA also showed great variation among ESUs. Like for 18S rDNA, with distinct chromosomes carrying these sequences and with variations in number and localization on the chromosomes. ESU-A showed only two chromosome pairs carrying 5S sequences, while ESUs B, C, and D presented a higher number of these sites. Although maintaining the preferential telomeric localization, interstitial positions were also highlighted mainly among ESU-D cytotypes. In addition, the syntenic localization with the 18 rDNA was evidenced in three chromosome pairs of the ESU-B, as well as in two chromosomes of the ESU-D – cytotype D13 (Figures 2, 3).
The mapping of telomeric sequences evidenced only the usual terminal marks on the chromosomes of the ESUs A, B, and C. In turn, the ESU-D exhibited additional interstitial sites (ITS) in seven cytotypes, D1, D4, D7, D8, D9, D12, and D14 (Figure 4).
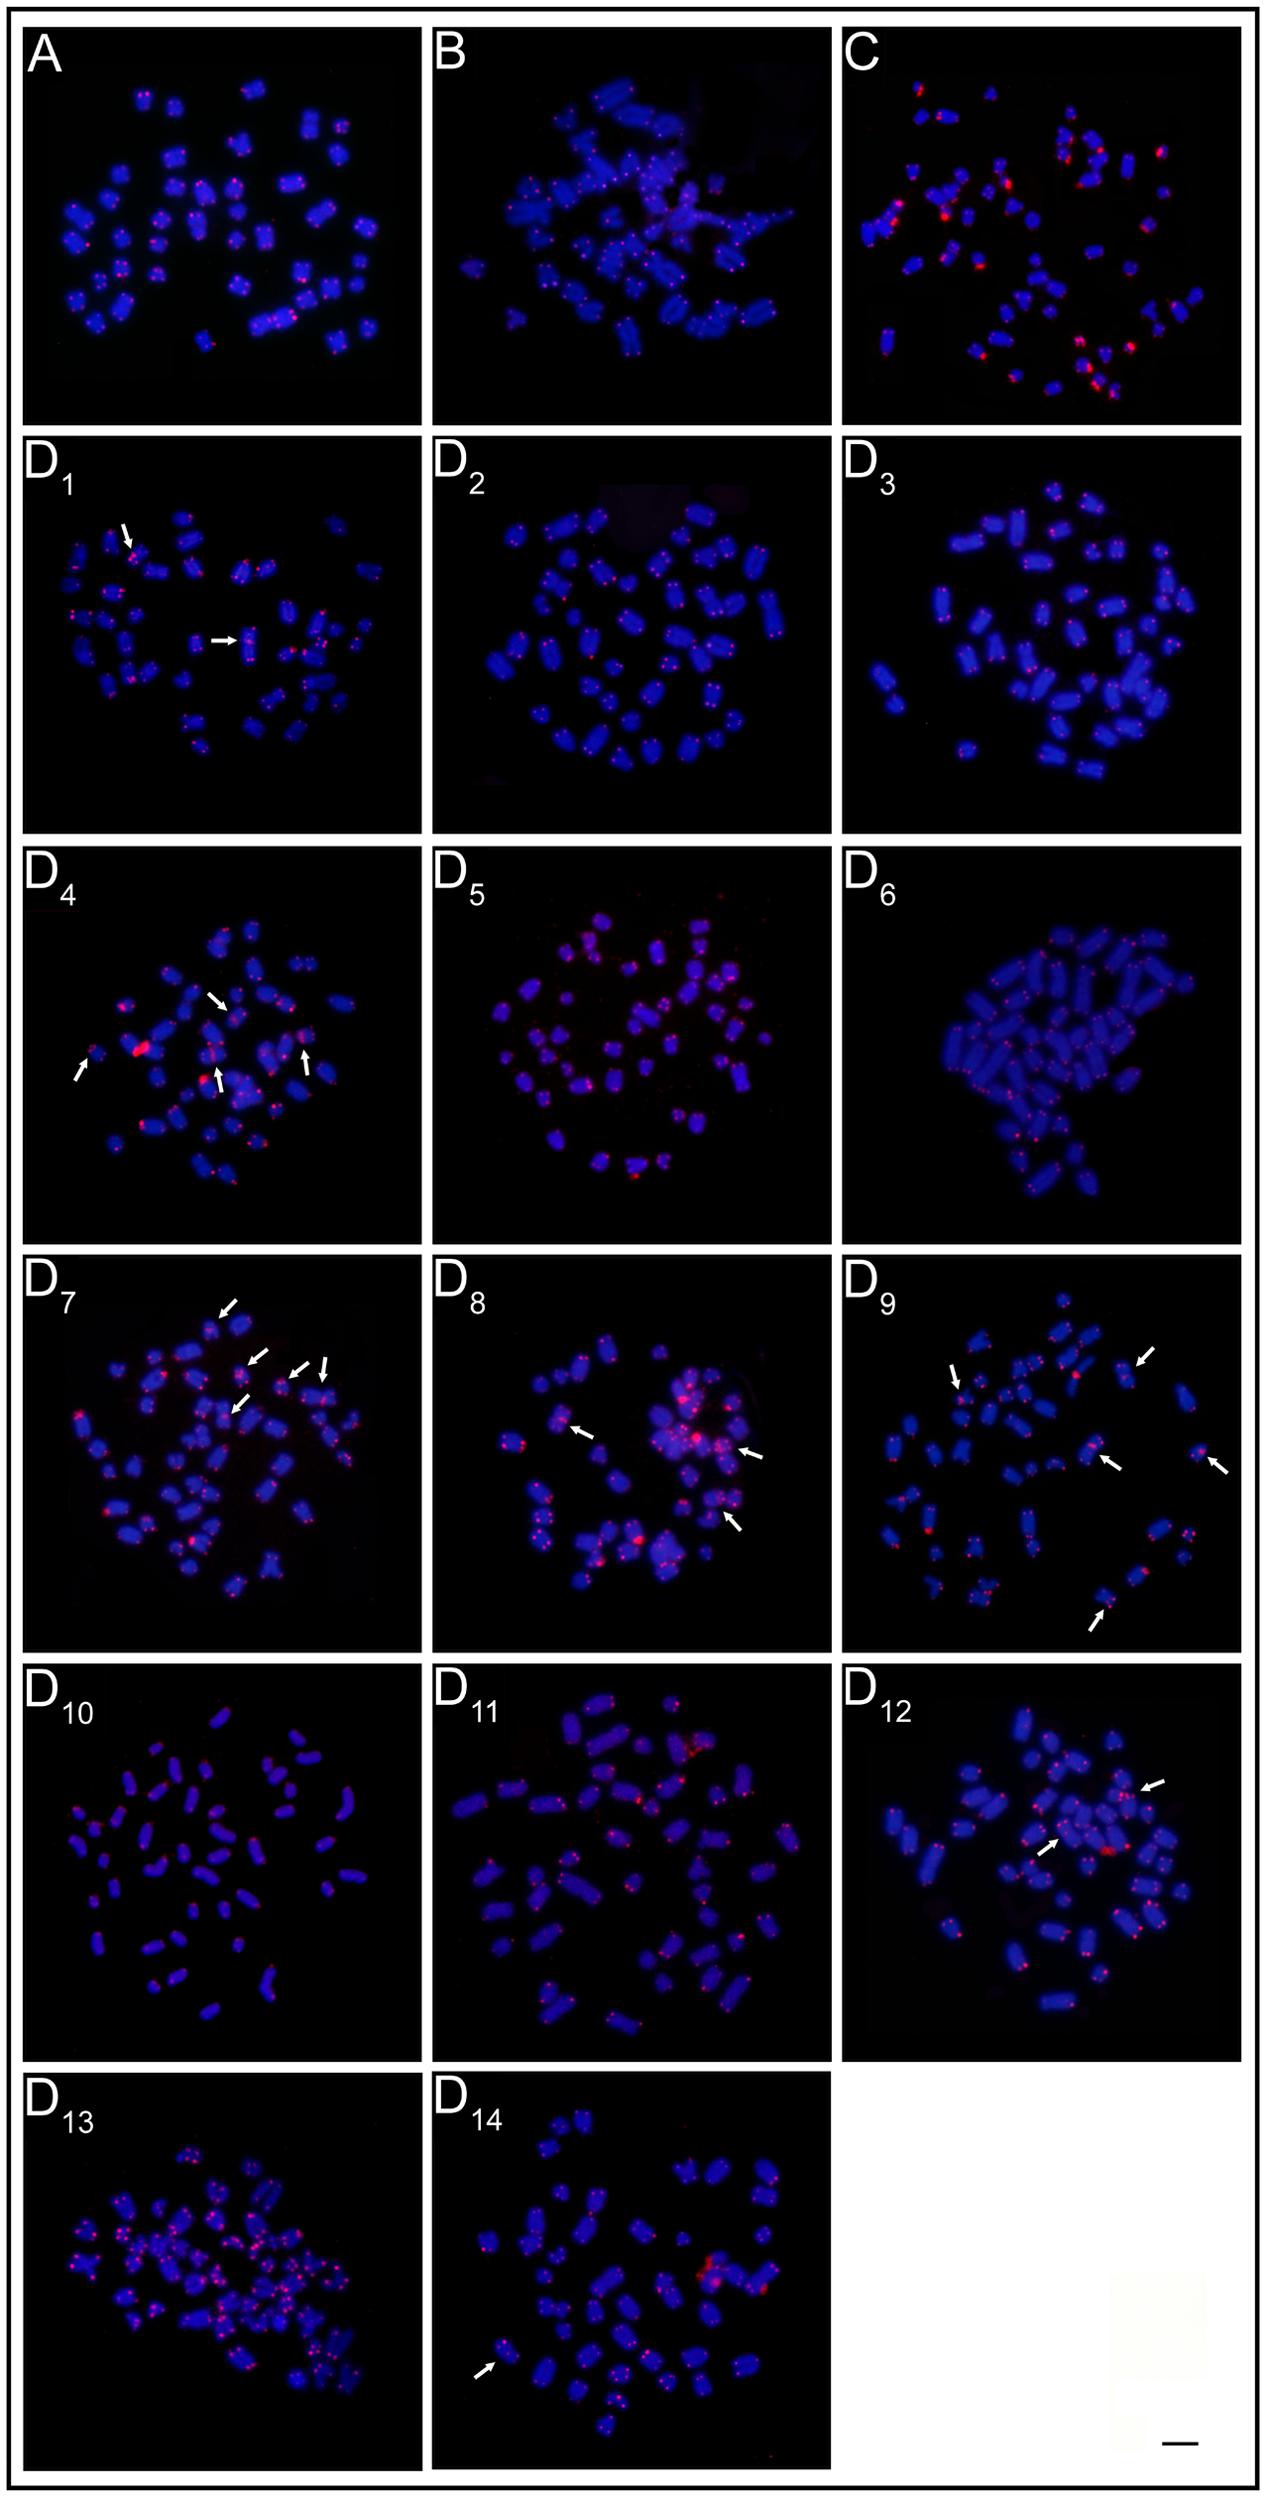
FIGURE 4. FISH with telomeric probe. (A) ESU-A Igarapé Jundiá – Cuieiras River, (B) SEU-B Demini River, (C) SEU-C Igarapé apeú – Guamá River, and (D1-D14) SEU-D1-14 Purus River. Arrows indicate the occurence of interstitial telomeric sites (ITS). Bar = 10 μm.
Meiotic plates from individuals of the ESU-D, showed a variable number of chromosomes corroborating the diversity found in the mitotic chromosomes. From 18 to 22 bivalents were evidenced, in addition to interstitial chiasmata and synaptic points, and probable tetravalent and chromosomal chain formations (Figure 5).
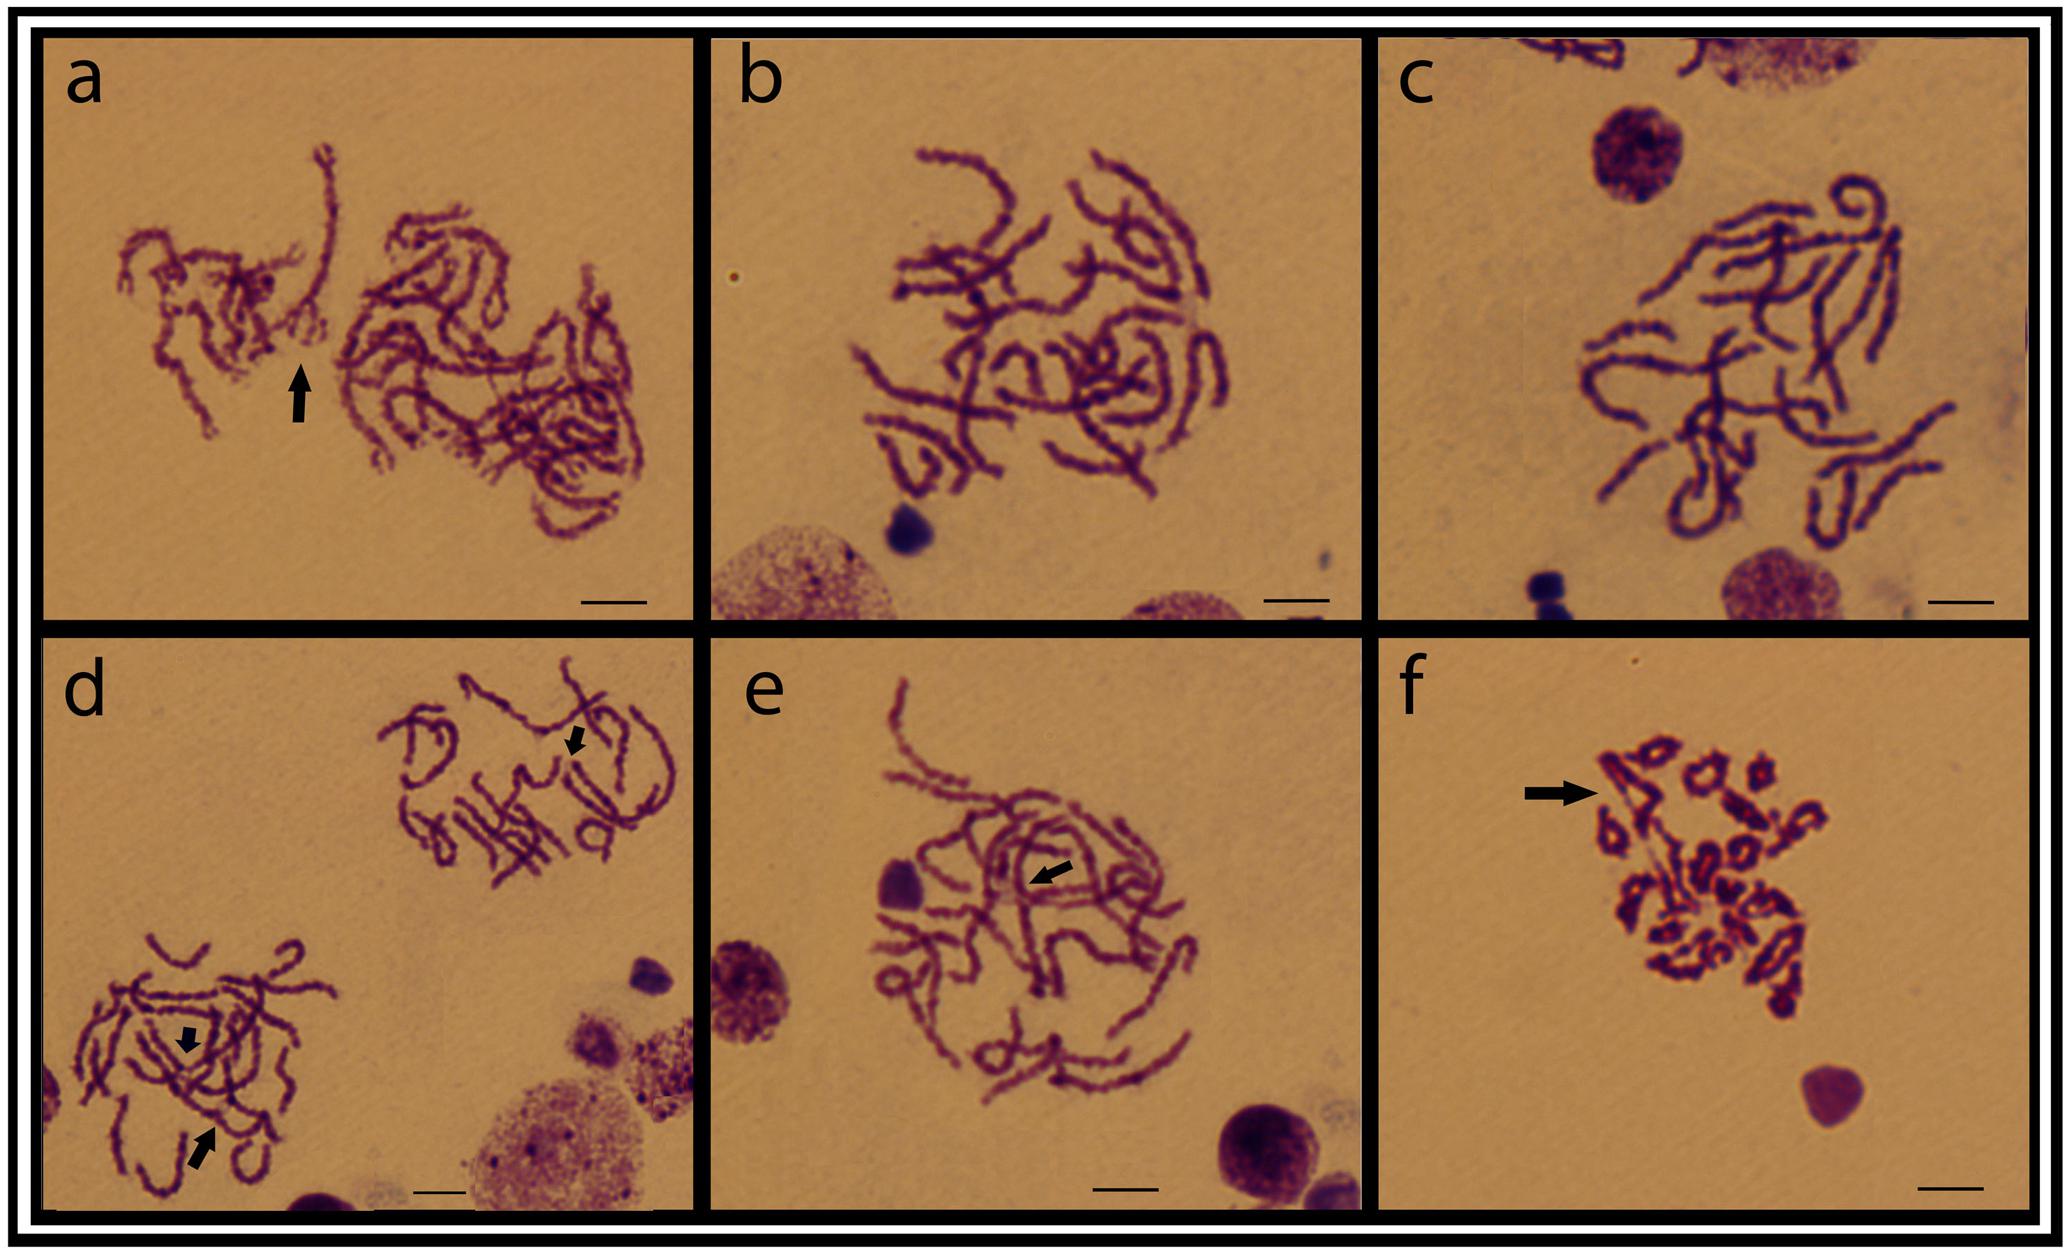
FIGURE 5. Testicular meiotic cell plates from the ESU-D in Giemsa staining. (a) Zigotene cells, with a possible tetravalent arrangement; (b–e) Aneuploid pachytene cells and arrows evidencing chiasmata formation; (f) Diplotene cells, with associated chromosomes likely in a chromosomal chain organization. Bar = 10 μm.
DNA Barcoding Analysis
Topologies obtained with the Neighbor-Joining (NJ) and Maximum Likelihood (ML) algorithms were congruent. The major clades were well-supported and it was confirmed that Bunocephalus represents a monophyletic group (Figure 5). Each population was also grouped as a monophyletic and well-supported clade, justifying them as four ESUs. ESU-A occupies the more basal position in relation to the other ones, and the ESUs C and D are more related to each other and with a more recent divergence (Figure 6).
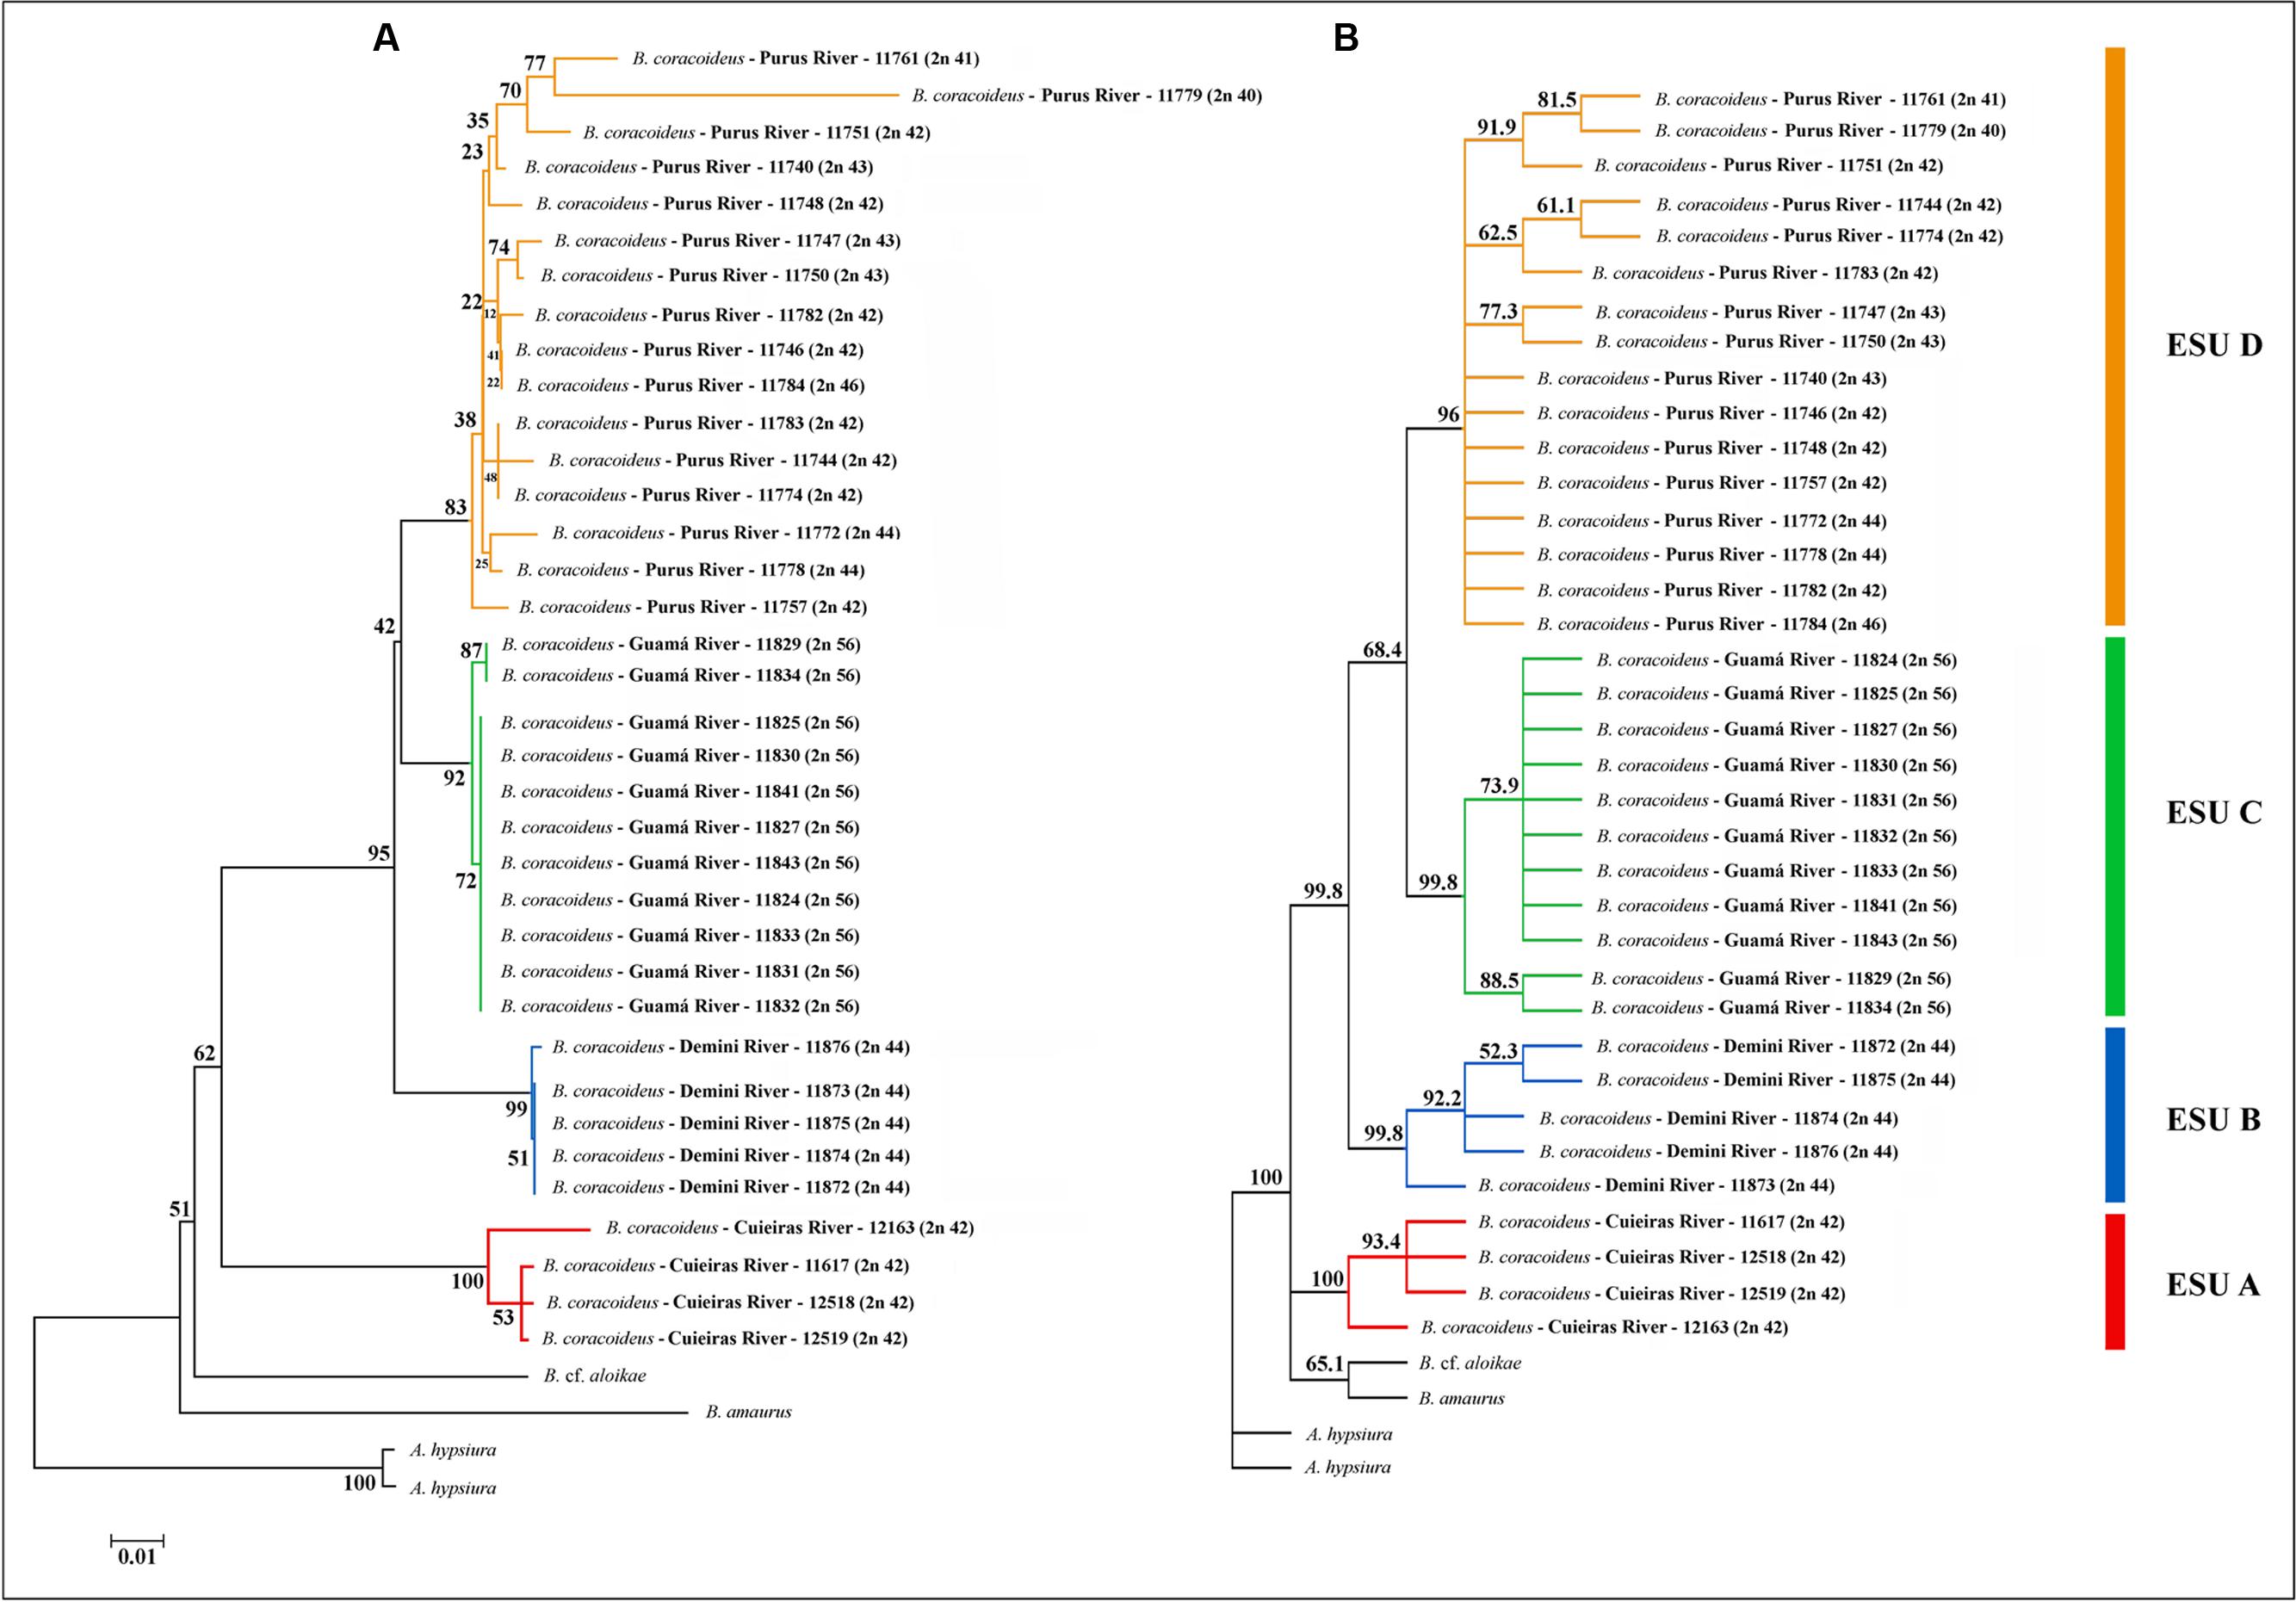
FIGURE 6. Phylogeny of B. coracoideus inferred by the analysis of (A) Maximum Likelihood (ML) and (B) Neighbor-Joining (NJ) using the mitochondrial gene COI. The bootstrap values for 1000 replications are evidenced above the branches.
Discussion
The geographic distribution, genetic distances, and karyotype data indicated that each B. coracoideus population represents an ESU. In fact, these populations differed by conspicuous karyotypes variability, where each ESU shows specificities on their 2n, karyotype formula and ribosomal sites distribution in the genome (Figures 7, 8). In addition, they have possibly evolved in allopatry due to vicariant events, making their natural contact unfeasible. Oliveira and Gosztonyi (2000) proposed that the ancestral karyotype of Siluriformes contained 2n = 56 chromosomes, mainly two-armed ones. According to our phylogenetic data, ESU-A (2n = 42; 16m+20sm+4st+2a) corresponds to the firstly differentiated karyotype among the four populations analyzed. In this way, ESU- A probably retains an ancestral feature of Siluriformes by the large number of bi-armed chromosomes they have, but with the reduction of the 2n due to chromosomal fusions. In this sense, the other ESUs share a synapomorphic condition by presenting karyotypes mostly composed by acrocentric chromosomes, where pericentric inversions and/or centric fissions may have played a role. Such feature is also found in other Bunocephalus species, such as B. doriae (Fenocchio and Swarça, 2012) and B. coracoideus population from the Negro River (Ferreira et al., 2016), in which acrocentric chromosomes are also mainly composing the karyotype. Thus, taking in account the Oliveira and Gosztonyi (2000) proposition, it can be considered that the Bunocephalus ESUs A, B, and D presents a trend toward the reduction of the chromosome number in relation to other Siluriformes, while ESU-C maintained the probable ancestral 2n = 56 chromosomes.
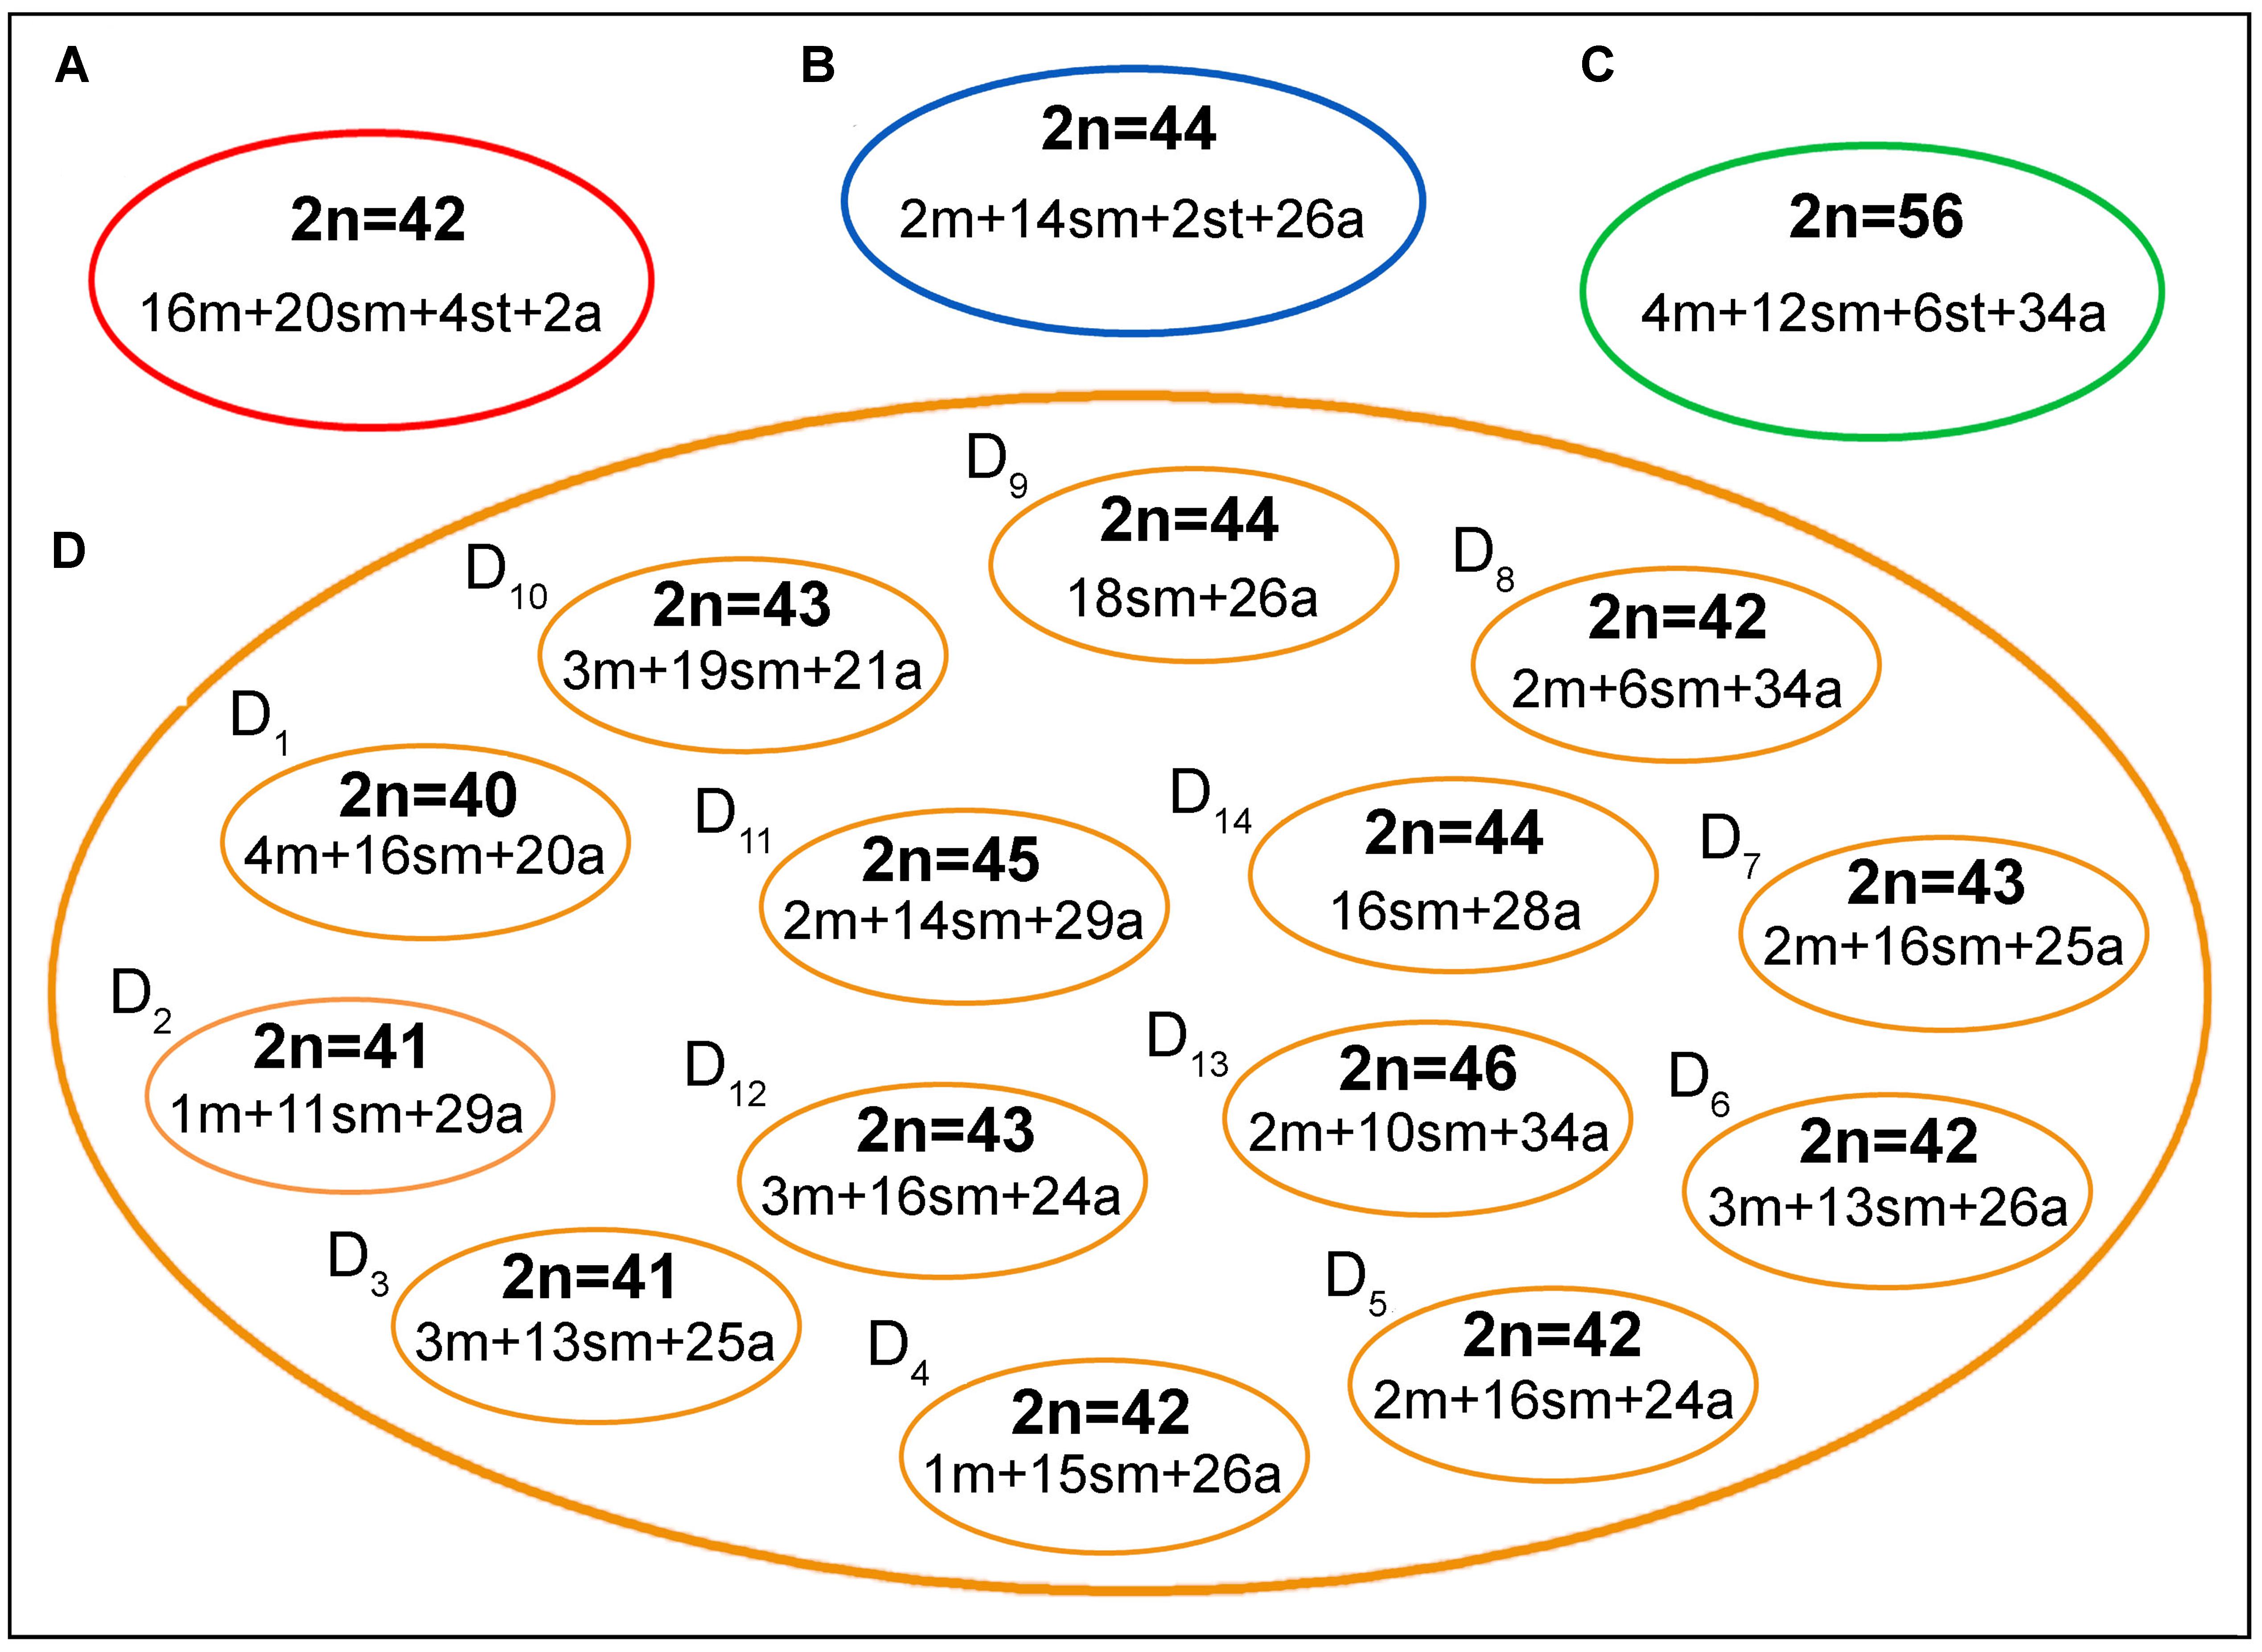
FIGURE 7. A general overview on the chromosomal heterogeneity on B. coracoideus. (A) ESU-A Igarapé Jundiá – Cuieiras River, (B) SEU-B Demini River, (C) SEU-C Igarapé Apeú – Guamá River, and (D) SEU-D1-14 Purus River.
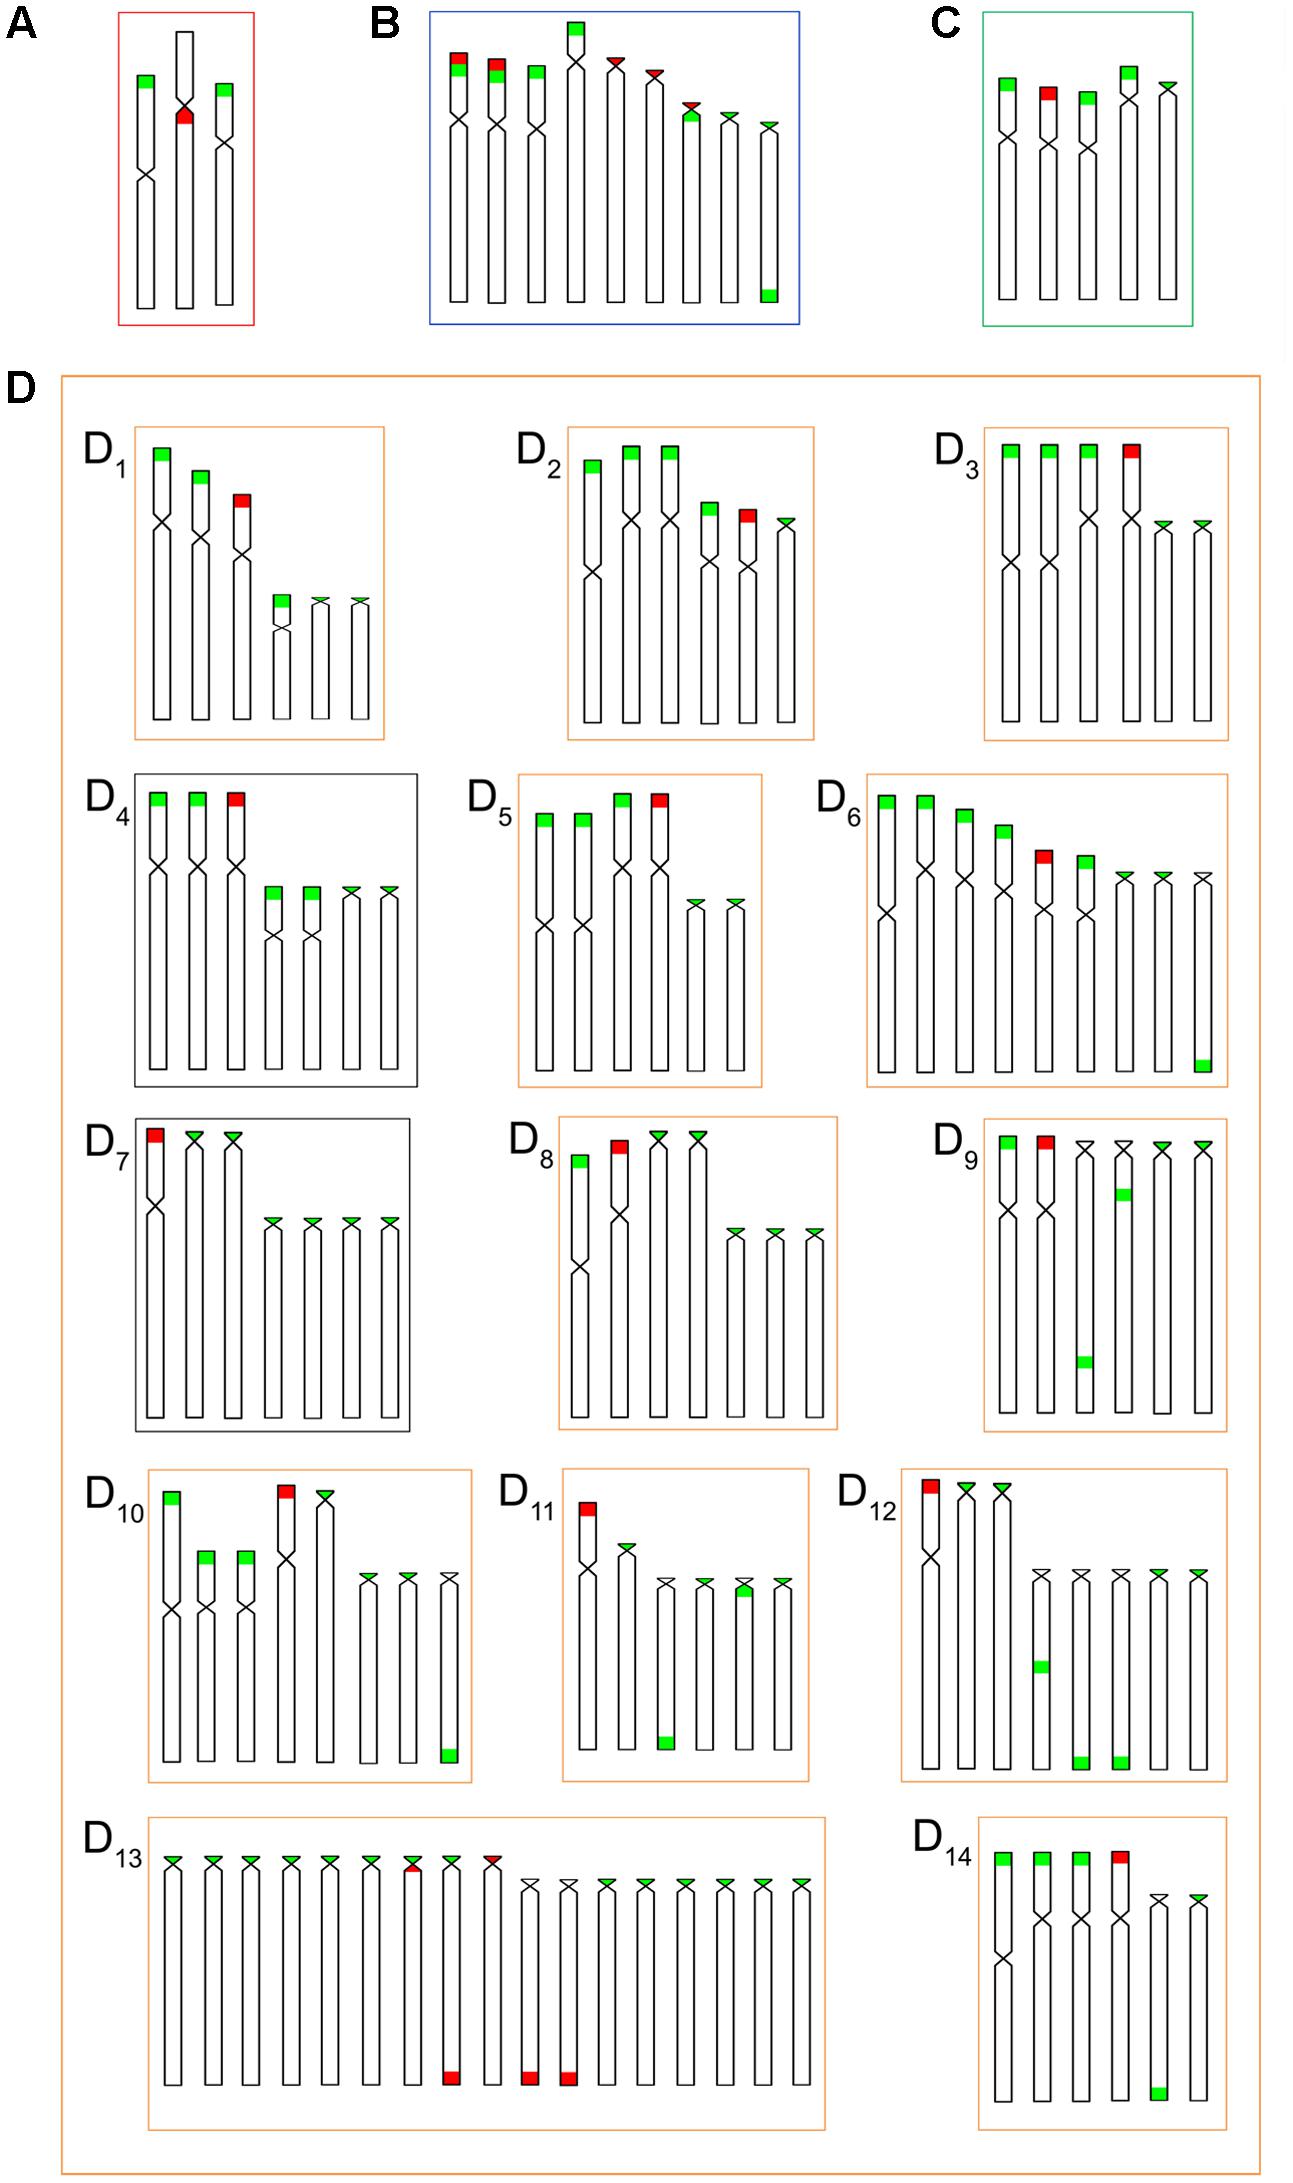
FIGURE 8. Idiograms for numbers and locations of the 18S (red) and 5S (green) rDNA sequences in the chromosomes of the B. coracoideus populations (A) ESU-A Igarapé Jundiá – Cuieiras River, (B) SEU-B Demini River, (C) SEU-C Igarapé Apeú – Guamá River, and (D) SEU-D1-14 Purus River.
Chromosomal rearrangements can play a role on speciation processes as they may act in the reproductive isolation (Mayr, 1995), generating an useful investigation area concerning genetic variability (Faria and Navarro, 2010), Indeed, in some distinct Neotropical fish species, such as Hoplias malabaricus (Bertollo et al., 2000), Astyanax fasciatus (Pazza et al., 2006), Astyanax scabripinnis (Moreira-Filho and Bertollo, 1991; Maistro et al., 2000), and Hoplerythinus unitaeniatus (Giuliano-Caetano et al., 2001), the chromosomal diversification raised the hypothesis that they may encompass different species under a same nomenclature.
Additionally, both number and location of rDNA sites were highly variable among ESUs (Figures 2, 3), highlighting their dynamic behavior in the genomes and in generation of the genetic diversity among populations. Besides, it seems that multiple 5S rDNA sites represent a synapomorphy in B. coracoideus, since all populations analyzed present such condition. Accordingly, ESU-A presents the lowest number of such sites (in only two pairs of chromosomes), thus representing a basal condition (Figure 8). Since the accumulation of repetitive sequences in particular genomic areas can cause chromosomal rearrangements (Lim and Simmons, 1994; Dimitri et al., 1997), the dynamic behavior of rRNA genes might also be linked with the huge karyotype diversity presented by this nominal species.
The occurrence of synteny between the 5S and 18S rRNA genes in the ESUs B and D (Figure 8B, D13) represents an uncommon condition among vertebrates (Martins and Galetti, 2001), once these genes are transcribed by distinct RNA polymerases, suggesting the need to be distant from each other or allocated in different chromosomes, avoiding possible harmful rearrangements between them (Amarasinghe and Carlson, 1998; Martins and Galetti, 1999). However, in Siluriformes, the syntenic condition for such both rDNA classes was already found for several species, such as Imparfinis mirini and I. minutus (Ferreira et al., 2014), Ancistrus maximus, A. ranunculus, A. dolichopterus, Ancistrus aff. dolichopterus (Favarato et al., 2016), Hemibagrus wyckii (Supiwong et al., 2014), Corydoras carlae (Rocha et al., 2016), Panaqolus sp. (Ayres-Alves et al., 2017) and in B. coracoideus (present study). Nevertheless, the evolutionary paths taking to the selection of this apparently non-advantageous condition are not revealed yet but, at first, it appears to be not a deleterious character.
An outstanding finding in our study is the huge karyotype diversity found in the ESU D. In fact, this population highlighted many varying cytotypes living in sympatry. Apparently, such polymorphism does not appear to represent effective reproductive barriers capable to impair crosses, at least among some different cytotypes, increasing the chromosome diversity inside the population. Similar intrapopulacional features were also highlighted in the Characidae, Astyanax fasciatus, which presented two well-defined cytotypes, 2n = 46 and 2n = 48, but with numeric and structural chromosome variants when they occur in sympatry (Pazza et al., 2006, 2007, 2008). It is noteworthy that in both cases, ESU-D and Astyanax fasciatus, the variant karyotypes apparently do not demonstrate deleterious phenotypic effects on the carriers. However, the hypothesis that such degree of chromosomal diversity may affect, in some way, the homeostasis of the segregation cannot be fully discarded.
To better investigate the extension of the polymorphism inside ESU-D, we extended our analyzes to the chromosomal behavior during meiosis, since it was found monosomies and trisomies in nearly all cytotypes. In order to confirm this condition, meiotic plates of three individuals were analyzed, and attested that, during meiosis I, a clear numeric variation can be observed. In fact, different bivalent numbers were found in pachytene cells of the same individual, as well as probable trivalents with synapses points. In addition, a typical tetravalent formation and an apparent chromosomal chain were also observed in zygotene and diplotene cells, respectively (Figure 5), and such events might have contributed for irregular segregations. It is known that chromosomal rearrangements can alter the homologs pairing during meiosis and, as a consequence, provide unbalanced gametes (Davisson and Akeson, 1993; Navarro and Ruiz, 1997; Spirito, 1998). In this way, non-disjunction events during meiosis may result in aneuploid individuals, a factor that may, at least in part, explain the polymorphic condition found in the ESU-D population. In addition, a second factor probably related to such biodiversity relies on the ecological conditions in the Purus River basin, where ESU-D occurs. This region is located in a lowland area subjected to water flooding, influenced by the seasonality of the river level (Haugaasen and Peres, 2006). These flooded forests, which appear on the rainy season, form complexes labyrinths made by tree logs, rocks and every type of vegetation common to such environments (Luize et al., 2015). This particular habitat favors fish dispersion and the consequent subpopulations segregation until their future reconnection during the dry periods.
Thus, the evolutionary scenario for the ESU-D is that chromosomal rearrangements have occurred and that geographic isolation periods, due to flood pulse cycles may have favored their fixation in the population. During the flood periods, the reestablishment of the physical connection among the previously isolated aquatic environments allowed gene flow among them and, as a consequence, the variety of the cytotypes observed among the population. This hypothesis is reinforced by the ITS found in several cytotypes, indicating the occurrence of chromosomal rearrangements (Figure 4).
The DNA barcoding analysis is a very informative tool for biodiversity studies. In Salminus fish, for example, it was evidenced eight distinct lineages increasing its current diversity, nowadays limited to four species (Machado et al., 2016). Rhamdia voulezi and Rhamdia branneri, considered synonyms of Rhamdia quelen, are currently argued to constitute valid species supported by karyotype, ecomorphology and morphometric data (Abucarma and Martins-Santos, 2001; Garcia et al., 2010; Mise et al., 2013; Garavello and Shibatta, 2016), as well as by the barcoding DNA analysis (Ribolli et al., 2017).
Facing the karyotype diversity found in B. coracoideus, the DNA barcoding methodology was also useful for analyzing the relationships among populations. In fact, this procedure is a helpful tool for analyzing the occurrence of cryptic species (Smith et al., 2008). Theoretically, the nucleotide divergences between populations of a single species (intraspecific variations) are smaller than the ones between distinct species (interspecific variations), the “barcoding gap” (Ward et al., 2005; Hajibabaei et al., 2006). Most congeneric species have showed substantial nucleotide divergences by means of this molecular marker (Hebert et al., 2003). Intraspecific divergences are rarely superior to 2%, and usually do not overcome 1% (Avise, 2000). For B. coracoideus the intra-population genetic distance did not overcome the value of 2%, except for the Purus population (ESU-D), which presented divergences among the sequences from 0.2 to 10.3%.
Such molecular data corroborated the karyotype diversity allowed us to infer that there is a probable ongoing sympatric speciation process within this population. From the NJ analysis, all the ESUs were supported with bootstrap values higher than 96%. The same occurred with the phylogeny based on ML, except for the ESU-D, which presented a bootstrap value of 83%, reflecting once more the karyotype variation present among the specimens of this population. However, the high value observed supports its identity as an ESU.
The ESU-A presented a mean distance of 10.6% from the other ESUs (Table 2), which is a value equivalent to species differences. The bootstrap value of 62% of ML between the ESU-A and the super clade including ESU-B, ESU-C, and ESU-D is much lower to the 95% ML and 99.8% NJ to grouping them. Besides, in the NJ phylogram, the ESU-A is more related to B. cf. aloikae and B. amaurus than to the other ESUs. In addition to its particular karyotype features, ESU-A presents a high value of allopatric speciation and the potential of being a new species. According to Avise and Walker (1999), the high divergences among the ESUs of B. coracoideus allowed us to delimitate lineages with taxonomic uncertainties in this nominal species.
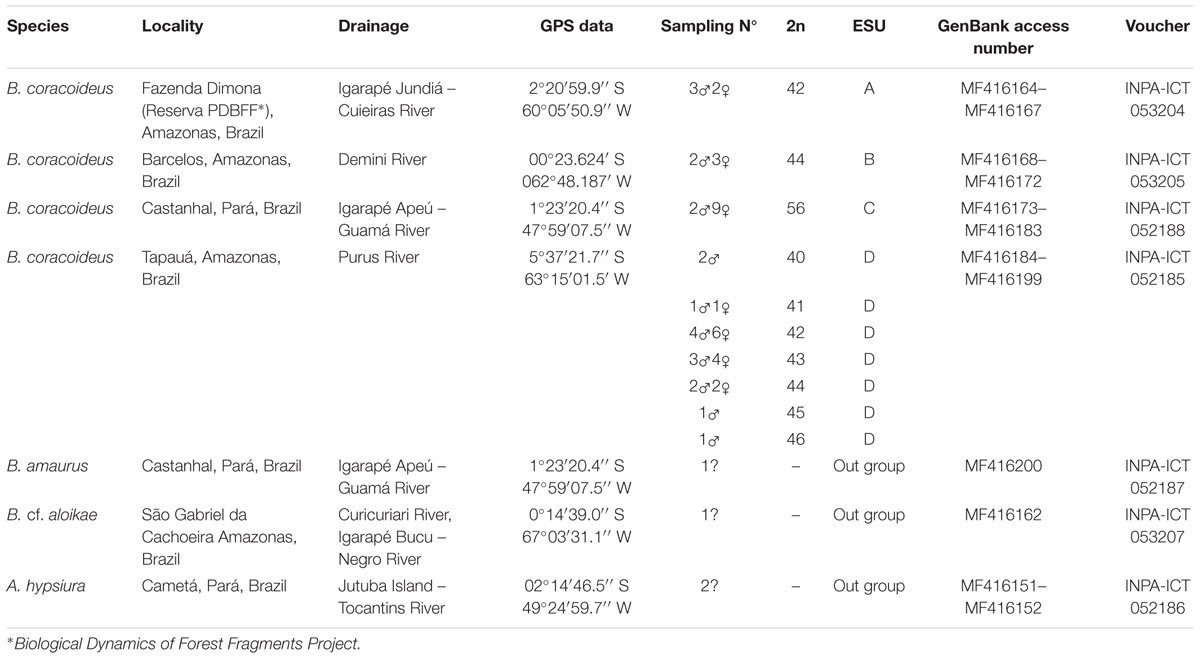
TABLE 2. Aspredinidae specimens analyzed in the present study, with their respective collection places, number of individuals, diploid number (2n), and identification.
The genetic variability and the natural selection are important conditions for evolutionary changes. Thus, understanding the neutralization of the gene flow or the locking for factors that prevent gene exchanges, such as vicariance, gene mutations and chromosomal rearrangements, are important steps to explain evolutionary processes that frequently lead to speciation (Turelli et al., 2001; Kawakami et al., 2011). Indeed, it is well-known that mutations and chromosome rearrangements can be fixated by genetic drift and, more easily, in small and isolated populations (Jesus et al., 2016), as is the case for the B. coracoideus populations here investigated. However, the great challenge for genetic biodiversity analyzes is to preserve the connection with the natural history and the species nomenclature, with consequent implications on their management and conservation (Pellens et al., 2016). In this sense, a key question that emerges is how to classify the evolutionary history of a specific population concerning their genetic diversification. In fact, the description of new species, based on genetic diversity, still finds some resistance and is not yet fully adopted. In this way, many cryptic species remain undescribed, even after their identification by genetic markers (Schlick-Steiner et al., 2007).
Conclusion
The diversity of Neotropical freshwater fishes is still largely underestimated (Reis et al., 2016) and requires additional investigations. Nevertheless, a previous challenge remains still to be overcome: “what is a species and what new information is needed to solve this issue?” (Hey, 2001). Our study reveals a huge degree of chromosomal and genetic diversity in B. coracoideus and highly suggests the existence of four ESUs in allopatric and sympatric speciation processes. We believe that they were enough to reveal the occurrence of a B. coracoideus species complex. It indicates that new available methods, such as the genetic variability, can be definitely used in taxonomic procedures.
Author Contributions
MF and CG performed techniques and analyzed the data; MF, JZ, and EF contributed with reagents, materials and analysis tools; MF, CG, DM, IdJ, MC, LB, JZ, and EF wrote the paper.
Funding
This study was supported by the Brazilian agencies, Instituto Nacional de Pesquisas da Amazônia (INPA), Fundação de Amparo à Pesquisa do Estado do Amazonas (UNIVERSAL AMAZONAS/FAPEAM 030/2013-062.00663/2015); CAPES pró Amazônia; ADAPTA-II INCT para Adaptação da Biota Aquática da Amazônia; Fundação de Amparo à Pesquisa do Estado de São Paulo (FAPESP 2016/22196-2); and received a productivity grant from CNPq (#313183/2014-7).
Conflict of Interest Statement
The authors declare that the research was conducted in the absence of any commercial or financial relationships that could be construed as a potential conflict of interest.
Acknowledgments
The authors thank to Douglas Bastos for the collaboration during the acquirement of the specimens and to Leonardo Goll for the help in meiosis analysis. This is the study number 725 of the technical series of the Biological Dynamics of Forest Fragments Project – PDBFF (INPA/STRI).
References
Abucarma, M., and Martins-Santos, I. C. (2001). Karyotype and B chromosome of Rhamdia species (Pisces, Pimelodidae) endemic in the River Iguaçu basin. Cytologia 66, 299–306. doi: 10.1508/cytologia.66.299
Amarasinghe, V., and Carlson, J. E. (1998). Physical mapping and characterization of 5S rRNA genes in douglas-fir. Amer. Gen. Assoc. 89, 495–500. doi: 10.1093/jhered/89.6.495
Avise, J. C. (2000). Phylogeography: The History and Formation of Species. Cambridge, MA: Harvard University Press.
Avise, J. C., and Walker, D. (1999). Species realities and numbers in sexual vertebrates: perspectives from an asexually transmitted genome. Proc. Natl. Acad. Sci. U.S.A. 96, 992–995. doi: 10.1073/pnas.96.3.992
Ayres-Alves, T., Cardoso, A. L., Nagamachi, C. Y., de Sousa, L. M., Pieczarka, J. C., and Noronha, R. C. R. (2017). Karyotypic evolution and chromosomal organization of repetitive DNA sequences in species of Panaque, Panaqolus, and Scobinancistrus (Siluriformes and Loricariidae) from the Amazon Basin. Zebrafish 14, 251–260. doi: 10.1089/zeb.2016.1373
Bertollo, L. A. C., Born, G. G., Dergam, J. A., Fenocchio, A. S., and Moreira-Filho, O. (2000). A biodiversity approach in the Neotropical fish, Hoplias malabaricus. Karyotypic survey, geographic distribution of cytotypes and cytotaxonomic considerations. Chromosome Res. 8, 603–613. doi: 10.1023/A:1009233907558
Bertollo, L. A. C., Takahashi, C. S., and Moreira-Filho, O. (1978). Cytotaxonomic considerations on Hoplias lacerdae (Pisces, Erytrinidae). Braz. J. Biol. 1, 103–120.
Bickford, D., Lohman, D. J., Sodhi, N. S., Ng, P. K., Meier, R., Winker, K., et al. (2007). Cryptic species as a window on diversity and conservation. Trends Ecol. Evol. 22, 148–155. doi: 10.1016/j.tree.2006.11.004
Cardoso, A. R. (2008). Filogenia da Família Aspredinidae Adams, 1854 e Revisão Taxonômica de Bunocephalinae Eigenmann & Eigenmann, 1888 (Teleostei: Siluriformes: Aspredinidae). doctoral’s thesis, Pontifícia Universidade Católica do Rio Grande Do Sul, Porto Alegre.
Cardoso, A. R. (2010). Bunocephalus erondinae, a new species of banjo catfish from southern Brazil (Siluriformes: Aspredinidae). Neotrop. Ichthyol. 8, 607–613. doi: 10.1590/S1679-62252010000300005
Carvalho, T. P., Cardoso, A. R., Friel, J. P., and Reis, R. E. (2015). Two new species of the banjo catfish Bunocephalus Kner (Siluriformes: Aspredinidae) from the upper and middle rio São Francisco basins, Brazil. Neotrop. Ichthyol. 13, 499–512. doi: 10.1590/1982-0224-20140152
Cioffi, M. B., Kejnovský, E., Marquioni, V., Poltronieri, J., Molina, W. F., Diniz, D., et al. (2012). The key role of repeated DNAs in sex chromosome evolution in two fish species with ZW sex chromosome system. Mol. Cytogenet. 5:28. doi: 10.1186/1755-8166-5-28
Cioffi, M. B., Martins, C., and Bertollo, L. A. C. (2009). Comparative chromosome mapping of repetitive sequences. Implications for genomic evolution in the fish, Hoplias malabaricus. BMC Genetics 10:34. doi: 10.1186/1471-2156-10-34
Davisson, M. T., and Akeson, E. C. (1993). Recombination suppression by heterozygous Robertsonian chromosomes in the mouse. Genetics 133, 649–667.
Dimitri, P., Arcà, B., Berghella, L., and Mei, E. (1997). High genetic instability of heterochromatin after transposition of the LINE-like I factor in Drosophila melanogaster. Proc. Natl. Acad. Sci. U.S.A. 94, 8052–8057. doi: 10.1073/pnas.94.15.8052
Eschmeyer, W. N., Fricke, R., and van der Laan, R. (eds) (2017). Catalog of Fishes: Genera, Species, References. Available at: http://researcharchive.calacademy.org/research/ichthyology/catalog/fishcatmain.asp [accessed June 22, 2017].
Faria, R., and Navarro, A. (2010). Chromosomal speciation revisited: rearranging theory with pieces of evidence. Trends Ecol. Evol. 25, 660–669. doi: 10.1016/j.tree.2010.07.008
Favarato, R. M., Silva, M., Oliveira, R. R., Artoni, R. F., Feldberg, E., and Matoso, D. A. (2016). Cytogenetic diversity and the evolutionary dynamics of rDNA genes and telomeric sequences in the Ancistrus genus (Loricariidae: Ancistrini). Zebrafish 13, 103–111. doi: 10.1089/zeb.2015.1140
Felsenstein, J. (1985). Confidence limits on phylogenies: an approach using the bootstrap. Evolution 39, 783–791. doi: 10.1111/j.1558-5646.1985.tb00420.x
Fenocchio, A. S., and Swarça, A. C. (2012). Cytogenetic description of Bunocephalus doriae Boulenger, 1902 (Siluriformes: Aspredinidae) from the Paraná River (Misiones, Argentina). Neotrop. Ichthyol. 10, 461–464. doi: 10.1590/S1679-62252012005000014
Ferreira, M., Garcia, C., Matoso, D. A., Jesus, I. S., and Feldberg, E. (2016). A new multiple sex chromosome system X1X1X2X2/X1Y1X2Y2 in Siluriformes: cytogenetic characterization of Bunocephalus coracoideus (Aspredinidae). Genetica 44, 591–599. doi: 10.1007/s10709-016-9927-9
Ferreira, M., Kavalco, K. F., De Almeida-Toledo, L. F., and Garcia, C. (2014). Cryptic diversity between two imparfinis species (Siluriformes, Heptapteridae) by cytogenetic analysis and DNA barcoding. Zebrafish 11, 306–317. doi: 10.1089/zeb.2014.0981
Garavello, J. C., and Shibatta, O. A. (2016). Reappraisal of Rhamdia branneri Haseman, 1911 and R. voulezi Haseman, 1911 (Siluriformes: Heptapteridae) from the rio Iguaçu with notes on their morphometry and karyotype. Neotrop. Ichthyol. 14:e140111. doi: 10.1590/1982-0224-20140111
Garcia, C., Oliveira, C., and Almeida-Toledo, L. F. (2010). Karyotypic evolution trends in Rhamdia quelen (Siluriformes, Heptapteridae) with considerations about the origin and differentiation of its supernumerary chromosomes. Genet. Mol. Res. 9, 365–384. doi: 10.4238/vol9-1gmr750
Giuliano-Caetano, L., Jorge, L. C., Moreira-Filho, O., and Bertollo, L. A. C. (2001). Comparative cytogenetic studies on Hoplerythrinus unitaeniatus populations (Pisces, Erythrinidae). Cytologia 66, 39–43. doi: 10.1508/cytologia.66.39
Gold, J. R., Li, C., Shipley, N. S., and Powers, P. K. (1990). Improved methods for working with fish chromosomes with a review of metaphase chromosome banding. J. Fish Biol. 37, 563–575. doi: 10.1111/j.1095-8649.1990.tb05889.x
Gross, M. C., Feldberg, E., Cella, D. M., Schneider, M. C., Schneider, C. H., Porto, J. I. R., et al. (2009). Intriguing evidence of translocations in Discus fish (Symphysodon, Cichlidae) and a report of the largest meiotic chromosomal chain observed in vertebrates. Heredity 102, 435–441. doi: 10.1038/hdy.2009.3
Gross, M. C., Schneider, C. H., Valente, G. T., Martins, C., and Feldberg, E. (2010). Variability of 18S rDNA locus among Symphysodon fishes: chromosomal rearrangements. J. Fish Biol. 76, 1117–1127. doi: 10.1111/j.1095-8649.2010.02550.x
Hajibabaei, M., Janzen, D. H., Burns, J. M., Hallwachs, W., and Hebert, P. D. N. (2006). DNA barcodes distinguish species of tropical Lepidoptera. Proc. Natl. Acad. Sci. U.S.A. 103, 968–971. doi: 10.1073/pnas.0510466103
Haugaasen, T., and Peres, C. A. F. (2006). Edaphic and structural characteristics of flooded and unflooded forests in the lower Rio Purus region of central Amazonia, Brazil. Acta Amaz. 36, 25–35. doi: 10.1590/S0044-59672006000100005
Hebert, P. D. N., Ratnasingham, S., and de Waard, J. R. (2003). Barcoding animal life: cytochrome c oxidase subunit 1 divergences among closely related species. Proc. R. Soc. B Biol. Sci. 270, S96–S99. doi: 10.1098/rsbl.2003.0025
Hey, J. (2001). The mind of the species problem. Trends Ecol. Evol. 16, 326–329. doi: 10.1016/S0169-5347(01)02145-0
Hey, J., Waples, R. S., Arnold, M. L., Butlin, R. K., and Harrison, R. G. (2003). Understanding and confronting species uncertainty in biology and conservation. Trends Ecol. Evol. 18, 597–603. doi: 10.1016/j.tree.2003.08.014
Ijdo, J. W., Wells, R. A., Baldini, A., and Reeders, S. T. (1991). Improved telomere detection using a telomere repeat probe (TTAGGG)n generated by PCR. Nucleic Acids Res. 19:4780. doi: 10.1093/nar/19.17.4780
Ivanova, N. V., Dewaard, J. R., and Hebert, P. D. N. (2006). An inexpensive, automation-friendly protocol for recovering high-quality DNA. Mol. Ecol. Notes 6, 998–1002. doi: 10.1111/j.1471-8286.2006.01428.x
Jesus, I. S., Ferreira, M., Garcia, C., Ribeiro, L. B., Alves-Gomes, J. A., and Feldberg, E. (2016). First cytogenetic description of Microsternarchus bilineatus (Gymnotiformes: Hypopomidae) from Negro River (Brazilian Amazon). Zebrafish 13, 571–577. doi: 10.1089/zeb.2016.1281
Kawakami, T., Butlin, R. K., and Cooper, S. J. (2011). Chromosomal speciation revisited: modes of diversification in Australian morabine grasshoppers (Vandiemenella viatica species Group). Insects 2, 49–61. doi: 10.3390/insects2010049
Kimura, M. (1980). A simple method of estimating evolutionary rate of base substitutions through comparative studies of nucleotide sequences. J. Mol. Evol. 16, 111–120. doi: 10.1007/BF01731581
Levan, A., Fredga, K., and Sandberg, A. A. (1964). Nomenclature for centromeric position on chromosomes. Hereditas 52, 201–220. doi: 10.1111/j.1601-5223.1964.tb01953.x
Lim, J. K., and Simmons, M. J. (1994). Gross chromosome rearrangements mediated by transposable elements in Drosophila melanogaster. Bioessays 16, 269–275. doi: 10.1002/bies.950160410
Lis, J. T. (1980). Fractionation of DNA fragments by polyethylene glycol induced precipitation. Methods Enzymol. 65, 347–353. doi: 10.1016/S0076-6879(80)65044-7
Luize, B. G., Silva, T. S., Wittmann, F., Assis, R. L., and Venticinque, E. M. (2015). Effects of the flooding gradient on tree community diversity in várzea forests of the Purus River, Central Amazon, Brazil. Biotropica 47, 137–142. doi: 10.1111/btp.12203
Machado, C. D. B., Ishizuka, T. K., Freitas, P. D. D., Valiati, V. H., Galetti, P. M. Jr., et al. (2016). DNA barcoding reveals taxonomic uncertainty in Salminus (Characiformes). Syst. Biodivers 15, 372–382. doi: 10.1080/14772000.2016.1254390
Maistro, E. L., Oliveira, C., and Foresti, F. (2000). Sympatric occurrence of two cytotypes of Astyanax scabripinnis (Characiformes, Characidae). Genet. Mol. Biol. 23, 365–369. doi: 10.1590/S1415-47572000000200021
Martins, C., and Galetti, P. M. Jr. (1999). Chromosomal localization of 5S rDNA genes in Leporinus fish (Anostomidae, Characiformes). Chromosome Res. 7, 363–367. doi: 10.1023/A:1009216030316
Martins, C., and Galetti, P. M. Jr. (2001). Two 5S rDNA arrays in Neotropical fish species: is it a general rule for fishes? Genetica 111, 439–446.
Matoso, D. A., Almeida-Val, V. M. F., Silva, M., Moraes-Neto, A., Almeida, M. C., Vicari, M. R., et al. (2011). Chromosomal polymorphism in Steindachneridion melanodermatum Garavello, 2005 (Siluriformes, Pimelodidae) - a reappraisal the existence of sex chromosomal system in the species. Rev. Fish Biol. Fish. 21, 497–508. doi: 10.1007/s11160-011-9201-2
Mayr, E. (1995). “Species, classification, and evolution,” in Biodiversity and Evolution, eds R. Arai and Y. Doi (Tokyo: Natural Science Museum Foundation), 3–12.
Mise, F. T., Tencatt, L. F. C., and Souza, F. (2013). Ecomorphological differences between Rhamdia (Bleeker, 1858) populations from the Iguaçu River basin. Biota Neotrop. 13, 99–104. doi: 10.1590/S1676-06032013000400010
Moreira-Filho, O., and Bertollo, L. A. C. (1991). Astyanax scabripinnis (Pisces, Characidae): a species complex. Brazil J. Genet. 14, 331–357.
Motta-Neto, C. C., Lima-Filho, P. A., Araujo, W., Bertollo, L. A. C., and Molina, W. (2012). Differentiated evolutionary pathways in Haemulidae (Perciformes): karyotype stasis versus morphological differentiation. Rev. Fish Biol. Fish. 22, 457–465. doi: 10.1007/s11160-011-9236-4
Navarro, A., and Ruiz, A. (1997). On the fertility effects of pericentric inversions. Genetics 147, 931–933.
Oliveira, C., and Gosztonyi, A. E. (2000). A cytogenetic study of Diplotnystes mesembrinus (Teleostei, Siluriformes, Diplomystidae) with a discussion of chromosome evolution in siluriforms. Caryologia 53, 31–37. doi: 10.1080/00087114.2000.10589178
Oliveira, E. A., Bertollo, L. A. C., Yano, C. F., Liehr, T., and Cioffi, M. B. (2015). Comparative cytogenetics in the genus Hoplias (Characiformes, Erythrinidae) highlights contrasting karyotype evolution among congeneric species. Mol. Cytogenet. 8:56. doi: 10.1186/s13039-015-0161-4
Pazza, R., Kavalco, K. F., and Bertollo, L. A. C. (2006). Chromosome polymorphism in Astyanax fasciatus (Teleostei, Characidae). 1. Karyotype analysis, Ag-NORs and mapping of the 18S and 5S ribosomal genes in sympatric karyotypes and their possible hybrid forms. Cytogenet. Genome Res. 112, 313–319. doi: 10.1159/000089886
Pazza, R., Kavalco, K. F., and Bertollo, L. A. C. (2008). Chromosome polymorphism in Astyanax fasciatus (Teleostei, Characidae). 2 – Chromosomal location of a satellite DNA. Cytogenet. Genome Res. 122, 61–66. doi: 10.1159/000151317
Pazza, R., Kavalco, K. F., Prioli, S. M. A. P., Prioli, A. J., and Bertollo, L. A. C. (2007). Chromosome polymorphism in Astyanax fasciatus (Teleostei, Characidae), Part 3: analysis of the RAPD and ISSR molecular markers. Biochem. Syst. Ecol. 35, 843–851. doi: 10.1016/j.bse.2007.03.018
Pellens, R., Faith, D. P., and Grandcolas, P. (2016). “The future of phylogenetic systematics in conservation biology: linking biodiversity and society,” in Biodiversity Conservation and Phylogenetic Systematics, eds R. Pellens and P. Grandcolas (Basel: Springer International Publishing), 375–383.
Pinkel, D., Straume, T., and Gray, J. W. (1986). Cytogenetic analysis using quantitative, high-sensitivity, fluorescence hybridization. Proc. Natl. Acad. Sci. 83, 2034–2038. doi: 10.1073/pnas.83.9.2934
Reis, R. E., Albert, J. S., Di Dario, F., Mincarone, M. M. M., Petry, P. L., and Rocha, L. R. (2016). Fish biodiversity and conservation in South America. J. Fish Biol. 89, 12–47. doi: 10.1111/jfb.13016
Ribolli, J., Scaranto, B. M., Shibatta, O. A., Bombardelli, R. A., and Zaniboni-Filho, E. (2017). DNA barcoding confirms the occurrence of Rhamdia branneri and Rhamdia voulezi (Siluriformes: Heptapteridae) in the Iguaçu River Basin. Neotrop. Ichthyol. 15:e160147. doi: 10.1590/1982-0224-20160147
Rocha, R. H., Baumgätner, L., Paiz, L. M., Margarido, V. P., Fernandes, C. A., and Gubiani, E. A. (2016). An uncommon co-localization of rDNA 5S with major rDNA clusters in Callichthyidae (Siluriformes): a report case in Corydoras carlae Nijssen & Isbrücker, 1983. Compar. Cytogenet. 10, 603–613. doi: 10.3897/CompCytogen.v10i4.9507
Schlick-Steiner, B. C., Seifert, B., Stauffer, C., Christian, E., Crozier, R. H., and Steiner, F. M. (2007). Without morphology, cryptic species stay in taxonomic crypsis following discovery. Trends Ecol. Evol. 22, 391–392. doi: 10.1016/j.tree.2007.05.004
Smith, M. A., Rodriguez, J. J., Whitfield, J. B., Deans, A. R., Janzen, D. H., Hallwachs, W., et al. (2008). Extreme diversity of tropical parasitoid wasps exposed by iterative integration of natural history, DNA barcoding, morphology, and collections. Proc. Natl. Acad. Sci. U.S.A. 105, 12359–12364. doi: 10.1073/pnas.0805319105
Spirito, F. (1998). “The role of chromosomal change in speciation,” in Endless Forms: Species and Speciation, eds D. J. Howard and S. H. Berlocher (New York, NY: Oxford University Press), 320–329.
Supiwong, W., Liehr, T., Cioffi, M. B., Chaveerach, A., Kosyakova, N., Fan, X., et al. (2014). Comparative cytogenetic mapping of rRNA genes among naked catfishes: implications for genomic evolution in the Bagridae family. Genet. Mol. Res. 13, 9533–9542. doi: 10.4238/2014.November.12.2
Tamura, K., Nei, M., and Kumar, S. (2004). Prospects for inferring very large phylogenies by using the neighbor-joining method. Proc. Natl. Acad. Sci. U.S.A. 101, 11030–11035. doi: 10.1073/pnas.0404206101
Tamura, K., Peterson, D., Peterson, N., Stecher, G., Nei, M., and Kumar, S. (2011). MEGA5: molecular evolutionary genetics analysis using maximum likelihood, evolutionary distance, and maximum parsimony methods. Mol. Biol. Evol. 28, 2731–2739. doi: 10.1093/molbev/msr121
Turelli, M., Barton, N. H., and Coyne, J. A. (2001). Theory and speciation. Trends Ecol. Evol. 16, 330–343. doi: 10.1016/S0169-5347(01)02177-2
Keywords: chromosomal differentiation, molecular taxonomy, ecological adaptations, evolutionary units, banjo catfish
Citation: Ferreira M, Garcia C, Matoso DA, de Jesus IS, Cioffi MB, Bertollo LAC, Zuanon J and Feldberg E (2017) The Bunocephalus coracoideus Species Complex (Siluriformes, Aspredinidae). Signs of a Speciation Process through Chromosomal, Genetic and Ecological Diversity. Front. Genet. 8:120. doi: 10.3389/fgene.2017.00120
Received: 17 July 2017; Accepted: 29 August 2017;
Published: 21 September 2017.
Edited by:
Roberto Ferreira Artoni, Ponta Grossa State University, BrazilReviewed by:
Vladimir Pavan Margarido, Universidade Estadual do Oeste do Paraná, BrazilMauro Nirchio, Universidad de Oriente, Venezuela
Copyright © 2017 Ferreira, Garcia, Matoso, de Jesus, Cioffi, Bertollo, Zuanon and Feldberg. This is an open-access article distributed under the terms of the Creative Commons Attribution License (CC BY). The use, distribution or reproduction in other forums is permitted, provided the original author(s) or licensor are credited and that the original publication in this journal is cited, in accordance with accepted academic practice. No use, distribution or reproduction is permitted which does not comply with these terms.
*Correspondence: Milena Ferreira, milena_fro@hotmail.com