 Venkatesh Kancherla1
 Samir Abdullazade1Matthias S. Matter1
 Manuela Lanzafame1
 Luca Quagliata1
 Guglielmo Roma2
 Yujin Hoshida3
 Luigi M. Terracciano1
 Charlotte K. Y. Ng1,4*
 Salvatore Piscuoglio1*
- 1Institute of Pathology, University Hospital Basel, Basel, Switzerland
- 2Department of Biology, University of Naples Federico II, Naples, Italy
- 3Division of Liver Diseases, Department of Medicine, Liver Cancer Program, Tisch Cancer Institute, Graduate School of Biomedical Sciences, Icahn School of Medicine at Mount Sinai, New York, NY, United States
- 4Department of Biomedicine, University of Basel, Basel, Switzerland
The TP53 gene is the most commonly mutated gene in human cancers and mutations in TP53 have been shown to have either gain-of-function or loss-of-function effects. Using the data generated by The Cancer Genome Atlas, we sought to define the spectrum of TP53 mutations in hepatocellular carcinomas (HCCs) and their association with clinicopathologic features, and to determine the oncogenic and mutational signatures in TP53-mutant HCCs. Compared to other cancer types, HCCs harbored distinctive mutation hotspots at V157 and R249, whereas common mutation hotspots in other cancer types, R175 and R273, were extremely rare in HCCs. In terms of clinicopathologic features, in addition to the associations with chronic viral infection and high Edmondson grade, we found that TP53 somatic mutations were less frequent in HCCs with cholestasis or tumor infiltrating lymphocytes, but were more frequent in HCCs displaying necrotic areas. An analysis of the oncogenic signatures based on the genetic alterations found in genes recurrently altered in HCCs identified four distinct TP53-mutant subsets, three of which were defined by CTNNB1 mutations, 1q amplifications or 8q24 amplifications, respectively, that co-occurred with TP53 mutations. We also found that mutational signature 12, a liver cancer-specific signature characterized by T>C substitutions, was prevalent in HCCs with wild-type TP53 or with missense TP53 mutations, but not in HCCs with deleterious TP53 mutations. Finally, whereas patients with HCCs harboring deleterious TP53 mutations had worse overall and disease-free survival than patients with TP53-wild-type HCCs, patients with HCCs harboring missense TP53 mutations did not have worse prognosis. In conclusion, our results highlight the importance to consider the genetic heterogeneity among TP53-mutant HCCs in studies of biomarkers and molecular characterization of HCCs.
Introduction
Hepatocellular carcinomas (HCCs) display extensive histologic, transcriptomic and genetic diversity (Lee et al., 2004; Boyault et al., 2007; Chiang et al., 2008; Hoshida et al., 2009; Fujimoto et al., 2012; Guichard et al., 2012; Ahn et al., 2014; Schulze et al., 2015; The Cancer Genome Atlas Research Network, 2017). On the genetic level, genes involved in liver metabolism, Wnt and p53 signaling have been shown to be recurrently altered (Fujimoto et al., 2012; Guichard et al., 2012; Ahn et al., 2014; Schulze et al., 2015; The Cancer Genome Atlas Research Network, 2017). The most frequently mutated protein-coding genes are CTNNB1 (encoding β-catenin) and TP53 (encoding p53), both mutated in 20–40% of HCCs (Fujimoto et al., 2012; Guichard et al., 2012; Ahn et al., 2014; Schulze et al., 2015; The Cancer Genome Atlas Research Network, 2017).
TP53 is the most frequently mutated gene in human cancers (Kandoth et al., 2013). The p53 protein modulates multiple cellular functions, including transcription, DNA synthesis and repair, cell cycle arrest, senescence and apoptosis (Vogelstein et al., 2000). Mutations in TP53 can abrogate these functions, leading to genetic instability and progression to cancer (Vogelstein et al., 2000). Across 12 major cancer types (excluding HCC), 42% of cancers harbored TP53 somatic mutations, with at least 20% mutational rate in 10/12 cancer types and TP53 mutations are associated with inferior prognosis and unfavorable clinicopathologic parameters, such as tumor stage (Kandoth et al., 2013). Furthermore, TP53-mutant tumors are highly enriched among tumors driven by copy number alterations (CNAs), with most remaining TP53-mutant tumors associated with the presence of somatic mutations in the Wnt and/or the RAS-RAF-ERK signaling pathways (Ciriello et al., 2013).
The pattern of TP53 mutations is reminiscent of both an oncogene and a tumor suppressor gene (Vogelstein et al., 2013). The majority (86%) of TP53 mutations are in the DNA-binding domain (Olivier et al., 2010; Kandoth et al., 2013). Most mutations in the DNA-binding domain are missense (88%) and approximately 1/3 of missense mutations affect the hotspot residues R175, G245, R248, R249, R273, and R282 (Olivier et al., 2010). Outside the DNA-binding domain, most mutations (∼60%) are nonsense or frameshift (Olivier et al., 2010). Mutant p53 proteins may lose the tumor suppressive functions and exert dominant-negative activities, but may also gain new oncogenic properties (Olivier et al., 2010; Muller and Vousden, 2014). Indeed, on the immunohistochemical level, p53 is generally detectable to various extents in samples with missense mutations but is undetectable in samples with truncating or frameshift mutations (Hall and McCluggage, 2006; Soussi et al., 2014).
In HCC, TP53 mutational frequency has been reported to range between 22 and 33% (Fujimoto et al., 2012; Guichard et al., 2012; Cleary et al., 2013; Kan et al., 2013; Ahn et al., 2014; Jhunjhunwala et al., 2014; Shiraishi et al., 2014; Totoki et al., 2014; Weinhold et al., 2014; Schulze et al., 2015; Fujimoto et al., 2016; The Cancer Genome Atlas Research Network, 2017). However, the frequency varies between geographic regions, etiological factors and carcinogen exposure, with more frequent TP53 mutations in regions where hepatitis B virus (HBV) infection is endemic (Fujimoto et al., 2012; Guichard et al., 2012; The Cancer Genome Atlas Research Network, 2017). Similar to other cancer types, TP53-mutant HCCs have been associated with features linked to poor prognosis, including high levels of alpha-fetoprotein, high Edmondson grade, expression of stem-like markers, and activation of pro-oncogenic signaling pathways (Kiani et al., 2002; Breuhahn et al., 2004; Lee et al., 2004; Peng et al., 2004; Boyault et al., 2007; Chiang et al., 2008; Hoshida et al., 2009; Goossens et al., 2015). Furthermore, patients with TP53-mutant HCCs tend to have shorter overall (OS) and disease-free survival (DFS) (Yano et al., 2007; Woo et al., 2011; Cleary et al., 2013). However, it appears that not all TP53 mutations in HCCs are equal. For instance, one of the most common mutation hotspots affecting residues R248/249 has an overall frequency of ∼10% among TP53-mutant HCCs (Fujimoto et al., 2012, 2016; Ahn et al., 2014; Schulze et al., 2015; The Cancer Genome Atlas Research Network, 2017). In particular, the R249S mutation resulting from G>T transversion has specifically been linked to the combined effect of aflatoxin B1 exposure and HBV infection (Bressac et al., 1991; Hsu et al., 1991) and this mutation is detected in >75% of HCC from areas with high aflatoxin B1 exposure (Gouas et al., 2009; Kew, 2010). Further hotspot mutations affecting preferentially HCC are located at the residues V157 and H193 (both at ∼2%) (Fujimoto et al., 2012, 2016; Ahn et al., 2014; Schulze et al., 2015; The Cancer Genome Atlas Research Network, 2017). Both R249S and V157F have been associated with stem cell-like traits and poor prognosis in HCC patients (Villanueva and Hoshida, 2011; Woo et al., 2011).
Finally, molecular classification studies have invariably grouped TP53-mutant HCCs under the umbrella of the aggressive subclass, but it is also clear that this subclass is molecularly, biologically and clinically heterogeneous (Boyault et al., 2007; Hoshida et al., 2009; Goossens et al., 2015).
Given the diverse pattern of TP53 mutations, taking advantage of The Cancer Genome Atlas (TCGA) dataset, in this study we sought to determine the pattern of TP53 somatic mutations in HCCs and its association with clinicopathologic features. Additionally, as TP53 mutations are associated with HCC molecular subclasses with poor prognosis, we sought to define the oncogenic and mutational signatures among TP53-mutant HCCs.
Materials and Methods
Sample Selection and Histologic Assessment
From TCGA liver hepatocellular carcinoma (LIHC) project (The Cancer Genome Atlas Research Network, 2017), 373 tumors with available somatic mutational data1 (accessed April 2017) (Gao et al., 2013) were included in the study. Images of diagnostic hematoxylin & eosin (H&E) slides were retrieved from the cbioportal and reviewed by three expert hepatopathologists (SA, MSM and LMT) according to the guidelines by the World Health Organization (Bosman et al., 2010) to define the presence or absence of cholestasis, Mallory bodies, tumor infiltrating lymphocytes (TILs), vessel infiltration and necrotic areas. 4-point scale Edmondson and Steiner system was adopted for tumor grading as previously described (Edmondson and Steiner, 1954; Alexandrov et al., 2013). Clinical information were obtained from the cbioportal (Gao et al., 2013).
Classification of TP53 Somatic Mutations
TP53 somatic non-synonymous and splice region mutations for the 373 HCCs were retrieved from the cbioportal (accessed April 2017) (Gao et al., 2013). TP53 mutations were stratified according to (i) the mutation type as single-nucleotide missense mutations (also encompassing synonymous mutations affecting splice region, Supplementary Methods and Supplementary Table S1) or deleterious mutations (encompassing splice site, nonsense, in-frame, and frameshift mutations); (ii) whether the mutations were within or outside of the DNA-binding domain. For correlative analyses with clinicopathologic parameters, the sample (TCGA-DD-A1EE) with three TP53 mutations (A161S, H193R and C277∗) was classified as harboring deleterious mutation.
The spectrum of TP53 mutations in non-LIHC TCGA datasets were retrieved from the cbioportal (accessed June 2017, Supplementary Table S2) (Gao et al., 2013). Mutation (lolliplot) diagrams and Oncoprints were generated using cbioportal (Gao et al., 2013).
Genomic and Transcriptomic Data Analysis
Gene-level copy number (“gistic2_thresholded,” 370/373 samples) and expression (“IlluminaHiSeq,” 367/373 samples) data were retrieved from the UCSC Xena Functional Genomics Browser2 accessed April 2017). Gene-level copy number data were used to define genomic regions with differential frequencies of copy number alterations between HCCs with missense TP53 mutations, with deleterious TP53 mutations, or with wild-type TP53. Copy number states -2, -1, 0, 1, and 2 were considered homozygous deletion, heterozygous loss, copy number neutral, gain and high-level gain/amplification, respectively.
Transcriptomic data were in the form of gene-level, log-transformed, upper-quartile-normalized RSEM values. Molecular classification was performed according to Hoshida et al. (2009), using the Nearest Template Prediction: http://software.broadinstitute.org/cancer/software/genepattern. The R package limma was used to perform quantile normalization and for differential expression analysis. Multiple correction was performed using the Benjamini–Hochberg method. Genes with adjusted P-value < 0.05 were considered as differentially expressed.
The number of somatic mutations per sample was obtained from the cbioportal (Gao et al., 2013).
Oncogenic Signatures
Oncogenic signature (“oncosign”) classification and the selection of genomic features as ‘selected functional elements’ (SFEs) input data were performed as described by Ciriello et al. (2013). Specifically, we selected 29 significantly mutated genes that have previously been reported as cancer genes (Futreal et al., 2004; Fujimoto et al., 2012; Kandoth et al., 2013; Lawrence et al., 2014), 27 recurrent amplifications and 34 recurrent deletions as SFEs (Supplementary Methods). Robustness of the subclasses was assessed by removing 5, 10, or 20% of samples, reclassifying the reduced dataset, and calculating the Jaccard coefficients over 20 runs (Ciriello et al., 2013). Enrichment of genomic alterations was assessed using Chi-squared and Fisher’s exact tests, as described (Ciriello et al., 2013).
Mutational Signatures
Decomposition of mutational signatures was performed using deconstructSigs (Rosenthal et al., 2016), based on the set of 30 mutational signatures (“signature.cosmic”) (Alexandrov et al., 2013; Nik-Zainal et al., 2016), for the 358 samples with at least 30 somatic mutations. Mutational signatures with >20% weight were considered to have substantial contribution to the overall mutational landscape. For each sample, the mutation signature with the highest weight was considered the dominant mutational signature.
Pathway Analysis
Pathways analysis was performed using Ingenuity Pathway Analysis as previously described (Piscuoglio et al., 2014; Martelotto et al., 2015). P < 0.001 was considered significant (Supplementary Methods).
Statistical Analysis
Associations between TP53 mutations and clinical/histologic features were assessed using Mann–Whitney U, Chi-squared or Fisher’s exact tests as appropriate. Survival analyses were performed using the Kaplan-Meier method and the log-rank test. Univariate and multivariate analyses for OS and DFS were performed using the Cox proportional-hazards model. Mutual exclusivity and co-occurrence of somatic mutations were defined using the cbioportal (Gao et al., 2013). Statistical analyses comparing copy number profiles and defining genes up-regulated when gained or amplified and genes down-regulated when lost were performed as previously described (Supplementary Methods) (Piscuoglio et al., 2014). All tests were two-sided. P < 0.05 were considered statistically significant. Statistical analyses were performed with R v3.1.2 or SPSS v24 (IBM, Münchenstein, CH).
Results
Clinicopathologic Characterization and Molecular Classification of HCCs
TP53 mutation status was available for 373 HCCs subjected to whole-exome sequencing by TCGA (The Cancer Genome Atlas Research Network, 2017). Analysis of the clinical details of the patients revealed that the median age at diagnosis was 61 (range 16–90) and that 67.5% were male (Supplementary Table S3). Half of the patients were Caucasian (50.8%), with most remaining patients being Asian (43.9%). The most frequent primary risk factor was alcohol consumption (33.1%), followed by HBV (30.0%) and hepatitis C virus (HCV) infection (15.9%). Overall, history of at least one primary risk factor was noted in 74.2% patients (Supplementary Table S3).
We performed a comprehensive histopathologic review of the diagnostic H&E slides for all 373 included cases to assess Edmondson grade, the presence of cholestasis, Mallory bodies, vessel infiltration, necrotic areas, and TILs (Figure 1 and Supplementary Table S3). Most samples were of intermediate grade, with 33.2, 60.6, and 5.4% graded as of Edmondson grades 2, 3, and 4, respectively. No sample was classified as of Edmondson grade 1. Cholestasis, Mallory bodies, vessel infiltration, necrotic areas, and TILs were present in 21.6, 22.0, 34.1, 24.8, and 47.3% of cases, respectively.
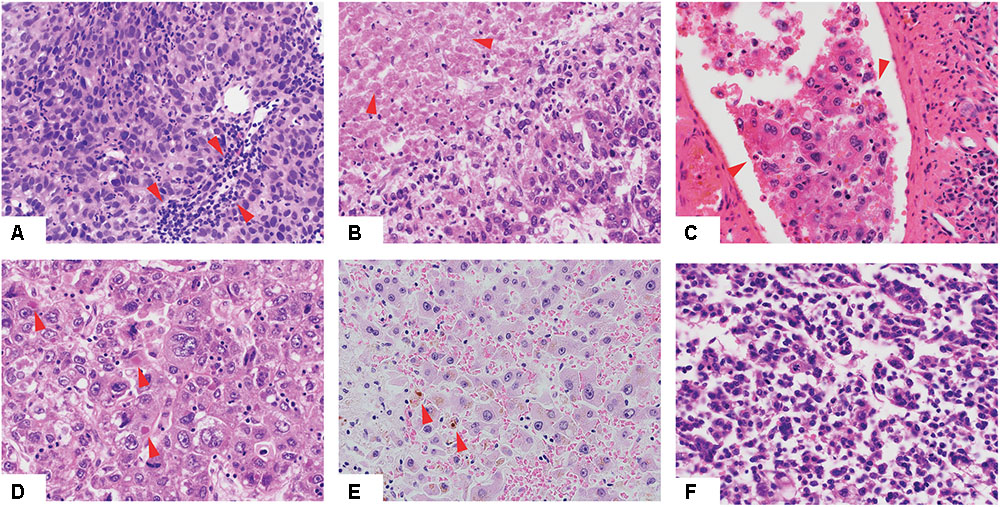
FIGURE 1. Histologic features of hepatocellular carcinoma. Low-power view of hepatocellular carcinomas with tumor infiltrating lymphocytes (A), necrotic areas (B), vessel infiltration (C), Mallory bodies (D), cholestasis (E) and of high Edmondson grade (F). Red arrows indicate the relevant histologic features.
Molecular classification was performed for the 367 HCCs for which expression data were available according to Hoshida et al. (2009). 31.3, 21.5, and 47.2% of HCCs were classified as S1, S2 and S3, respectively (Supplementary Table S3).
Spectrum of TP53 Somatic Mutations in HCCs
Given that TP53 is one of the most frequently mutated genes in HCCs and its diverse spectrum of mutations in human cancers, we sought to define the spectrum and type of TP53 mutations found in HCCs. A total of 116 somatic non-synonymous TP53 mutations and 2 synonymous TP53 mutations affecting splice regions were identified in 115 (30.8%) cases, including one case with three distinct mutations and one case with two. Missense (including missense and synonymous mutations affecting splice region, Supplementary Methods and Supplementary Table S1) and deleterious (including nonsense, frame-shift, in-frame, splice site) mutations accounted for 73 (62%) and 45 (38%), respectively (Figure 2). Compared to other cancer types characterized by the TCGA, there was no difference between HCC and non-HCC tumor types in terms of the ratio of missense vs deleterious mutations (P = 0.197, Fisher’s exact test).
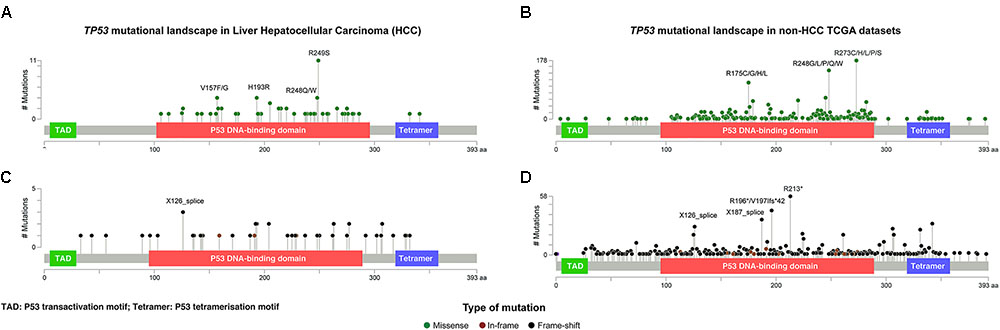
FIGURE 2. The distribution and the spectrum of TP53 mutations. The distribution and spectrum of TP53 missense (A,B) and deleterious (C,D) mutations in hepatocellular carcinoma (A,C) and in non-liver TCGA datasets (B,D). Diagrams represent the protein domains of p53 encoded by the TP53 gene. The presence of a mutation is shown on the x axis (lollipop), and the frequency of mutations is shown on the y axis. Missense mutations are presented as green circles, deleterious mutations (i.e., nonsense, frameshift, splice-site and in-frame) are depicted in black and brown circles. Plots were generated using cBioPortal tools (http://www.cBioPortal.org) and curated manually.
Of the 73 missense and synonymous mutations affecting splice region, 51 (70%) affected known hotspot residues (Chang et al., 2016; Gao et al., 2017) and all but one (99%) affected the DNA-binding domain (Figure 2A). All missense mutations were predicted to be pathogenic by at least 2/5 in silico mutation effect predictors, with the two synonymous mutations affecting splice region also predicted to be disease causing (Supplementary Methods and Supplementary Table S1). The most frequent hotspot mutations were R249S (11/73, 15%), H193R (4/73, 5%), and R248Q/W (4/73, 5%). V157F, a mutation not considered to be a hotspot residue (Chang et al., 2016; Gao et al., 2017) but was reported as a mutation hotspot in HCCs (Woo et al., 2011), accounted for 4/73 (5%) of the missense mutations (Figure 2A). Compared to other cancer types, mutations affecting V157 and R249 accounted for greater proportions of the missense mutations in HCCs than in other cancer types (4/73, 5% vs. 22/1787, 1.2%, P = 0.017 and 11/73, 15% vs. 21/1787, 1.2%, P < 0.001, respectively, Fisher’s exact tests, Figures 2A,B). In particular, R249S accounted for <0.5% of TP53 missense mutations in non-HCC TCGA samples, but accounted for 15% of the missense mutations in HCCs (P < 0.001, Fisher’s exact test). In contrast, the most frequent hotspots in non-HCC tumors R273 (178/1787, 10.0% of missense mutations) and R175 (112/1787, 6.3%) were only observed once and not at all, respectively, in HCCs (P = 0.008 and P = 0.020, respectively, Fisher’s exact tests).
The 45 deleterious mutations comprised 13 (29%) nonsense point mutations, 20 (44%) frameshift small insertions or deletions (indels), 3 (7%) in-frame indels and 9 (20%) mutations affecting splice sites. Unlike missense mutations, the 45 deleterious mutations were spread across the TP53 gene, with 32 (71%) in the DNA-binding domain, 3 (7%) in the tetramerization motif and 10 (22%) outside of these two domains (Figure 2C). In other cancer types, recurrent truncating mutations were observed at R196 (44/926, 4.8% of deleterious TP53 mutations) and R213 (56/926, 6.0%), both of which were not observed in HCC (Figures 2C,D).
Our results demonstrate that the spectrum of TP53 mutations in HCCs is distinct from that in non-HCC tumors, with HCC-specific recurrent hotspot mutations and a near absence of highly recurrent TP53 mutations found in other cancer types.
TP53 Status Correlates with Specific Histopathologic and Clinical Features of HCCs
Next, we sought to define whether TP53 mutation status correlated with clinicopathologic parameters. TP53 mutations were more frequently found in male patients (35.9% vs. 20.7% in female; P = 0.003, Fisher’s exact test) and in patients with at least one primary risk factor (35.1% vs. 20.9%; P = 0.013, Fisher’s exact test), especially in HCCs associated with HBV/HCV infection (53.1% vs. 39.7%; P = 0.021, Fisher’s exact test, Table 1). Patients from different racial backgrounds were associated with different TP53 mutational frequencies (P = 0.001, Chi-squared test, Table 1). Black or African Americans had the highest frequency of TP53 mutations (70.6% vs. Asians, 36.5%, P = 0.009, and vs. Caucasians, 22.8%, P < 0.001, Fisher’s exact tests), while Asians displayed more frequent TP53 mutations than Caucasians (P = 0.006, Fisher’s exact test). No association with age of patients or Child-Pugh classification was observed.
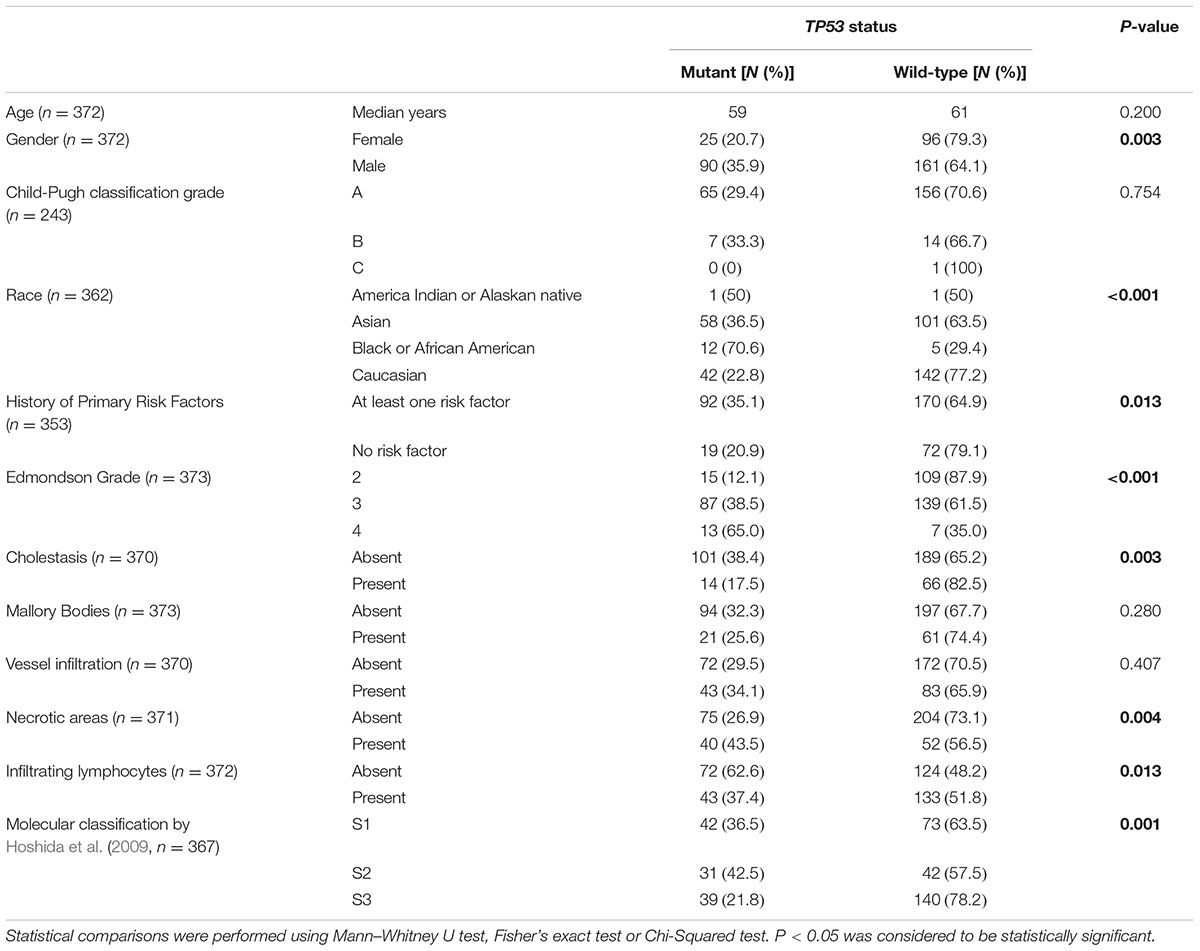
TABLE 1. Analyses of TP53 status and clinicopathologic parameters in the 373 HCCs from The Cancer Genome Atlas cohort (The Cancer Genome Atlas Research Network, 2017).
Correlation with histologic features revealed that TP53-mutant HCCs were associated with high Edmondson grade, accounting for 12.1, 38.5, and 65.0% of cases classified as Edmondson grades 2, 3, and 4, respectively (P < 0.001, Chi-squared test, Table 1). TP53 mutations were less frequent in HCCs associated with cholestasis (17.5% vs. 38.4%; P = 0.003, Fisher’s exact test) and were more frequent in HCCs with necrotic areas (43.5% vs. 26.9%; P = 0.004, Fisher’s exact test, Table 1). The presence of TILs was associated with less frequent TP53 mutations (37.4% vs. 62.6%; P = 0.013, Fisher’s exact test; Table 1). No association was found between TP53 mutation status and the presence of Mallory Bodies or vessel infiltration.
Further analyses comparing HCCs with missense or deleterious mutations showed that patients with HCCs with deleterious TP53 mutations were slightly older than those with missense mutations (median 64 vs. 58, P = 0.049, Mann–Whitney U test, Supplementary Table S4). After excluding one patient (TCGA-DD-A1EE) with both deleterious mutation (C277∗) and hotspot missense (H193R) mutations, the ages between the two groups were not different (P = 0.058, Mann–Whitney U test). Of note, TP53 recurrent hotspots V157F, R158H, H193R, Y205, and R249S were exclusively found in tumors of high Edmondson grade (grades 3/4, P = 0.038, Fisher’s exact test, compared to HCCs with other TP53 mutations).
Correlating TP53 status with molecular classification, (Hoshida et al., 2009) TP53-mutant HCCs were preferentially enriched in the S1 and S2 subclasses (36.5% and 42.5% vs. 21.8% in S3, P = 0.001, Chi-squared test, Table 1). Stratifying TP53-mutant HCCs into those with missense or deleterious mutations did not reveal association between TP53 mutation types and molecular classification (P = 0.459, Chi-squared test, Supplementary Table S4).
These results demonstrate that, additional to the well-established associations with the male gender, HBV/HCV infection and high Edmondson grade, TP53 mutations were less frequent in HCCs with cholestasis or TILs, but were more frequent in HCCs with necrotic areas.
Genomic Instability Is Not Associated with TP53 Mutation Type
Next, we compared the number of somatic genetic alterations between TP53-wild-type and mutant cases. Mutational burden was higher in TP53-mutant HCCs, HCCs with missense TP53 mutations and HCCs with deleterious TP53 mutations than TP53-wild-type cases (P < 0.001, P < 0.001 and P = 0.004, respectively, Mann–Whitney U tests), but no difference was observed between cases with missense or deleterious mutations (P = 0.799, Mann–Whitney U test, Supplementary Figure S1A). Similarly, TP53-mutant HCCs, HCCs with missense TP53 mutations and HCCs with deleterious TP53 mutations all harbored higher number of genes affected by CNAs compared with TP53-wild-type cases (P < 0.001, P < 0.001 and P = 0.001, respectively, Mann–Whitney U tests, Supplementary Figure S1B), with no difference between cases with missense or deleterious TP53 mutations (P = 0.352, Mann–Whitney U test, Supplementary Figure S1B).
Consistent with their increased chromosomal instability, TP53-mutant HCCs displayed more frequent gains of chromosomes 1p, 3, 10p and 19p and losses of half the genome, notably of chromosomes 4, 5, 10q, 14, 17p, 18 and 19 (Supplementary Figures S2A–C). The CNA landscapes between HCCs with TP53 missense or deleterious mutations were remarkably similar (Supplementary Figure S2D).
To identify potential CNA drivers associated with TP53 mutations, we interrogated the genes overexpressed when gained and genes downregulated when lost in the regions that showed differential CNA frequencies between TP53-mutant and TP53-wild-type cases (Supplementary Figure S2A). Pathway analysis of the copy number-regulated genes revealed that TP53-mutant cases displayed deregulation in pathways associated with EIF2 signaling, protein ubiquitination pathway, RNA polymerase-II complex and DNA repair pathways, and in molecular and cellular functions related to cell death and survival, cell cycle, DNA replication, recombination and repair (Supplementary Figure S3).
TP53-Mutant HCCs Displayed Heterogeneous Oncogenic Signatures
In HCCs, TP53 and CTNNB1 mutations were largely mutually exclusive (P = 0.028, Figure 3A) (Fujimoto et al., 2012; Guichard et al., 2012; Schulze et al., 2015; The Cancer Genome Atlas Research Network, 2017). Additionally, TP53 and BAP1 mutations were also mutually exclusive (P = 0.004; Figure 3A). In contrast, TP53 mutations co-occurred with RB1, JAK1 and KEAP1 mutations (P = 0.028, P = 0.034 and P = 0.044, respectively, Figure 3A). These observations suggest that TP53-mutant HCCs likely constitute a genetically heterogeneous subclass and may be subclassified into categories with distinct oncogenic signatures.
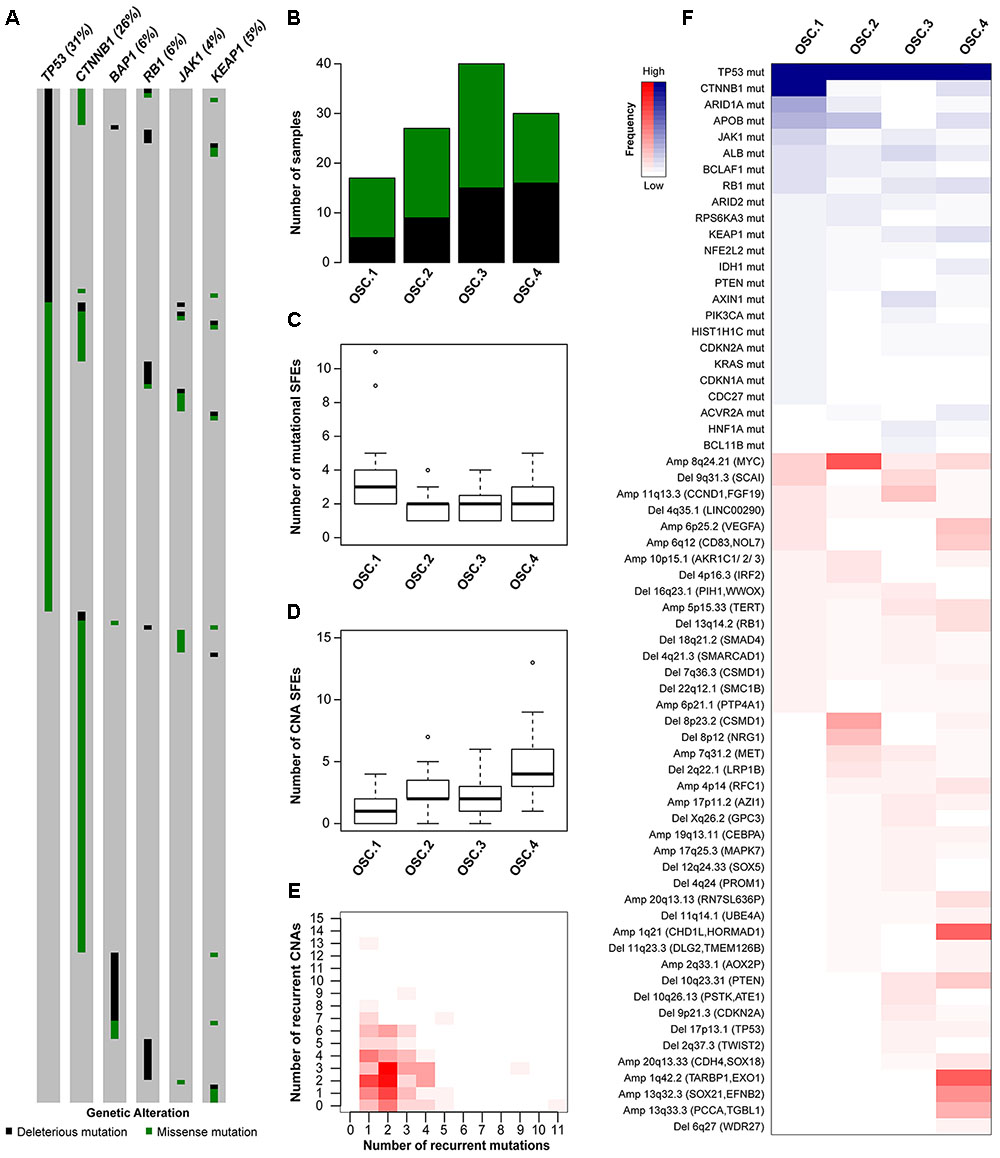
FIGURE 3. Oncogenic signature classes in TP53-mutant hepatocellular carcinoma. The pattern of mutations in TP53, CTNNB1, BAP1, RB1, JAK1 and KEAP1 in hepatocellular carcinoma (A). Number of TP53-mutant samples classified as OSC1, OSC2, OSC3, and OSC4, according to the color key in A (B). Number of mutational (C) and copy number (D) ‘selected functional elements’ (SFEs) in the different subclasses. The distribution of mutational vs copy number SFEs in TP53-mutant cases (E). The shade of red is proportional to the number of samples for a given (x,y) position. Heatmap shows the mutational and copy number SFEs altered in at least 5% of the samples in at least one oncogenic signature class (F). Shades of red and blue are proportional to the number of samples with a given genetic alteration, according to the color key. Plot in (A) was generated using cBioPortal (http://www.cBioPortal.org) and curated manually.
To define the oncogenic signatures in TP53-mutant HCCs, we performed unsupervised partitioning of the samples into classes with distinct patterns of likely ‘driver’ genetic alterations (or ‘selected functional elements,’ SFEs), (Ciriello et al., 2013) including mutations in 29 significantly mutated genes, amplifications in 27 recurrently amplified regions, and homozygous deletions in 34 recurrently deleted regions (see Materials and Methods). Among the 144 TP53-mutant HCCs with mutational and CNA data, we found median of 2 mutational (range 0–11) and 2.5 CNA (range 0–13) SFEs in each case and identified four robust oncogenic signature classes (OSCs, Figures 3B–E and Supplementary Figure S4A). HCCs with missense or deleterious TP53 mutations did not cluster separately (P = 0.305, Chi-squared test, Figure 3B), nor HCCs of distinct transcriptomic subclasses (Supplementary Figure S4B).
Inspection of the SFEs that characterized each OSC revealed that OSC1 was defined by the presence of CTNNB1 mutations (100%, P < 0.001, Fisher’s exact test, Figure 3F). The most frequent alteration in OSC2 was 8q24.21 amplification (encompassing MYC, 67%, P < 0.001, Fisher’s exact test), while the most frequent alterations in OSC4 were 1q21.3 (encompassing CHD1L and HORMAD1, 60%) and 1q42.2 (encompassing TARBP1 and EXO1, 63%) amplifications (both P < 0.001, Fisher’s exact tests, Figure 3F). OSC3 was notable for lacking highly recurrent genetic alterations, with the most frequent alteration being 11q13.3 amplification (CCND1, 23%, P = 0.011, Fisher’s exact test). Additionally, ARID1A mutations were enriched in OSC1 (35%, P < 0.001, Fisher’s exact test), while 10q23.21 deletion (PTEN, 20%) and 6p25.2 amplification (VEGFA, 23%) were enriched in OSC4 (P = 0.020 and P = 0.001, respectively, Fisher’s exact tests). We also found that OSC1 harbored higher number of mutational SFEs and lower number of CNA SFEs (P < 0.001 and P = 0.002, respectively, Mann–Whitney U tests, Figures 3C,D) compared to other classes. By contrast, OSC4 harbored higher number of CNA SFEs than the other classes (P < 0.001, respectively, Mann–Whitney U test, Figure 3D). The TP53 R249S hotspot mutation was not associated with specific OSC classes (P = 0.591, Chi-squared test). Finally, OSC1/2 were more frequently associated with the presence of TILs than OSC3/4 (P = 0.028, Chi-squared test). No other associations between histologic or clinicopathologic parameters and OSCs were found.
These observations are concordant with the observation that tumors are primarily driven by either somatic mutations or CNAs but rarely both (Ciriello et al., 2013) (Figure 3E and Supplementary Figures S4C,D). Furthermore, we identified subclasses of TP53-mutant HCCs likely driven by co-occurring CTNNB1 mutations, 8q24.21 (MYC) amplification or 1q amplification in a mutually exclusive manner.
Mutational Signatures in TP53-Mutant HCCs
The somatic mutational landscapes are shaped by endogenous and/or environmental biological and chemical processes (Alexandrov et al., 2013). More than 10 mutational signatures have been identified in liver cancers, including two liver cancer-specific signatures 12 and 16 of unknown etiology, both of which are characterized by frequent T>C substitutions but with different sequence contexts (Alexandrov et al., 2013). To determine whether TP53-mutant HCCs harbored distinct mutational signatures compared to TP53-wild-type HCCs, we inferred the underlying mutational processes for the 358 HCCs with at least 30 somatic mutations (Alexandrov et al., 2013; Nik-Zainal et al., 2016). The age-associated signature 5, (Alexandrov et al., 2015) and the liver cancer-specific signatures 12 and 16 contributed substantially (≥20% weight) to the mutational landscapes in 17.0, 12.8, and 53.4% of the samples, respectively (Figure 4). Together, 72.9% of HCCs harbored signatures 5, 12 or 16 as the dominant signatures (14.0, 10.6, and 48.3%, respectively).
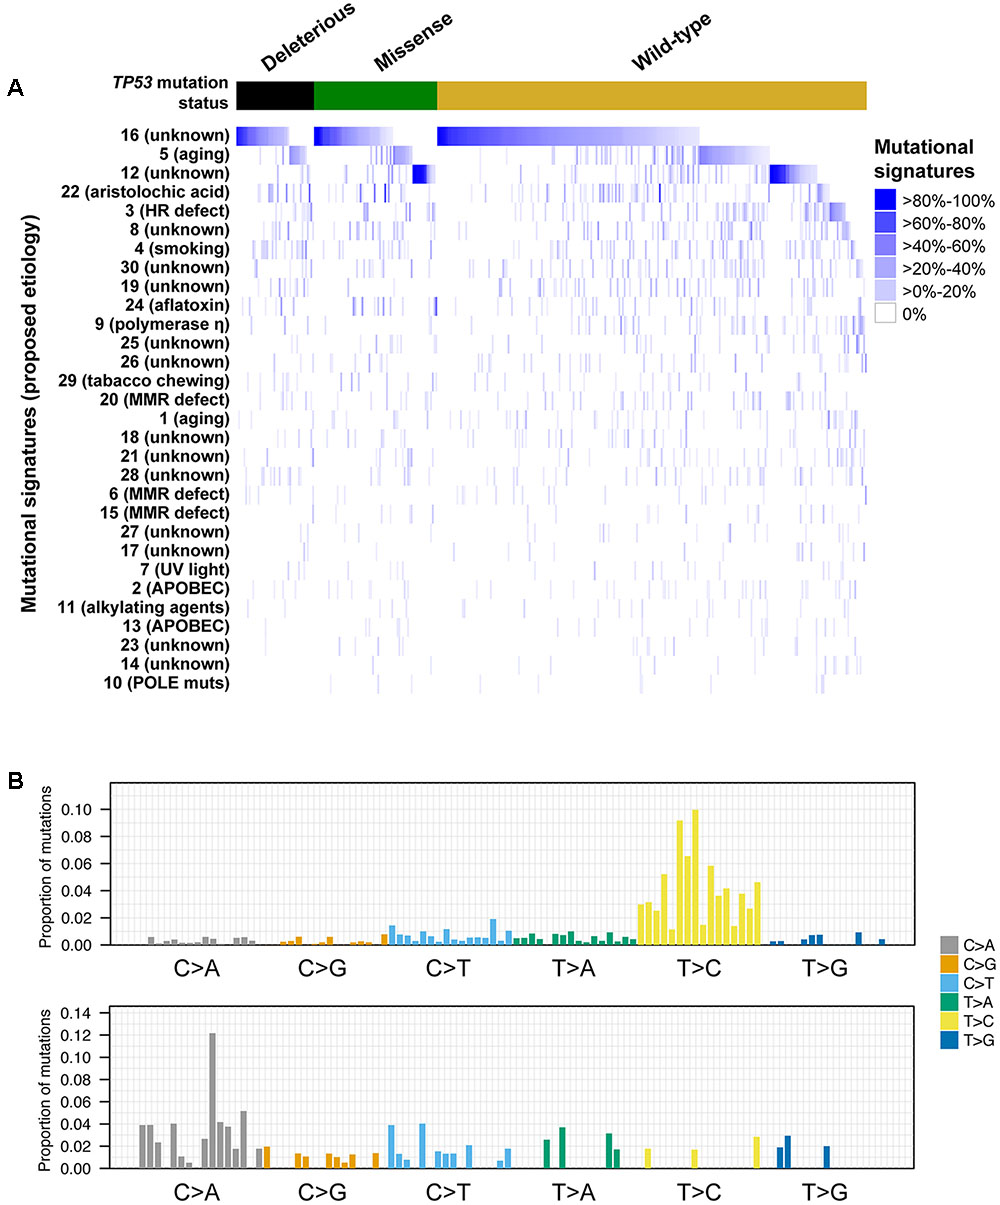
FIGURE 4. Mutational signatures in hepatocellular carcinoma with and without TP53 somatic mutations. Heatmap depicting the mutational signatures that shaped the genomes of the tumor samples analyzed (A) (Alexandrov et al., 2013). The similarity of the pattern of substitutions to the published mutational signatures is indicated in blue according to the color key. HCC samples were divided according to their TP53 mutational status. Mutational signatures were sorted by the number of cases classified as having a given mutational signature as the dominant signature, in decreasing order. Barplots illustrating examples of mutational signatures 12 (upper) and 24 (bottom) (B). In each panel, the colored barplot illustrates each mutational signature according to the 96 substitution classification defined by the substitution classes (C>A, C>G, C>T, T>A, T>C, and T>G bins) and the 5′ and 3′ sequence context, normalized using the observed trinucleotide frequency in the human exome to that in the human genome. The bars are ordered first by mutation classes (C>A/G>T, C>G/G>C, C>T/G>A, T>A/A>T, T>C/A>G, T>G/A>C), then by the 5′ flanking base (A, C, G, T) and then by the 3′ flanking base (A, C, G, T).
A comparison of the mutational signatures with substantial contribution (≥20%) to the mutational landscapes of TP53-mutant or TP53-wild-type HCCs revealed that only the aflatoxin-associated signature 24 was enriched among TP53-mutant HCCs (7/114, 6.1% vs. 4/244, 1.6%, P = 0.042, Fisher’s exact test).
We further compared the mutational signatures between HCCs with missense or deleterious TP53 mutations. Interestingly, while 18.6% (13/70) of samples with missense TP53 mutations displayed substantial contribution from signature 12, only 4.5% (2/44) of samples harboring deleterious TP53 mutations did (P = 0.044, Fisher’s exact test), with signature 12 being the dominant signature in 15.7% (11/70) and 2.3% (1/44) of samples with missense or deleterious TP53 mutations, respectively (P = 0.027, Fisher’s exact test, Figure 4). No difference in other signatures was observed. The aflatoxin-associated signature 24 was enriched among R249S-mutant HCCs compared other TP53-mutant HCCs (4/11, 36% vs. 3/103, 3%, P = 0.001 for substantial contribution and 3/11, 27% vs. 2/103, 2%, P = 0.006 for dominant signature, Fisher’s exact tests).
Taken together, our results suggest that the different types of TP53 mutations were associated with distinct mutational processes. Specifically, signature 12 was rarely found in HCCs with deleterious TP53 mutations.
Distinct Types of TP53 Mutations Are Associated with Different Prognoses
Previous studies found that associations between the types of TP53 mutations and prognoses in breast, and head and neck cancers (Olivier et al., 2006; Ozcelik et al., 2007; Vegran et al., 2013; Lapke et al., 2016). Here we hypothesized that patients with HCCs harboring TP53 missense or deleterious mutations may display different prognoses. Considering the patients with available data on OS (n = 372) or DFS (n = 321), we found that patients with TP53-mutant HCCs displayed a more aggressive behavior including shorter OS and DFS than TP53-wild-type patients (P = 0.018 and P = 0.005, respectively, log-rank tests, Figure 5). Patients with missense or deleterious TP53 mutations did not differ in OS or DFS (P = 0.129 and P = 0.148, respectively, log-rank tests, Figure 5). Importantly, while patients with deleterious TP53 mutations had worse OS and DFS than TP53-wild-type patients (P = 0.004 and P = 0.001, respectively, log-rank tests, Figure 5), there was no difference in OS or DFS between patients with missense TP53 mutations and those wild-type for TP53 (P = 0.192 and P = 0.084, respectively, log-rank tests, Figure 5).
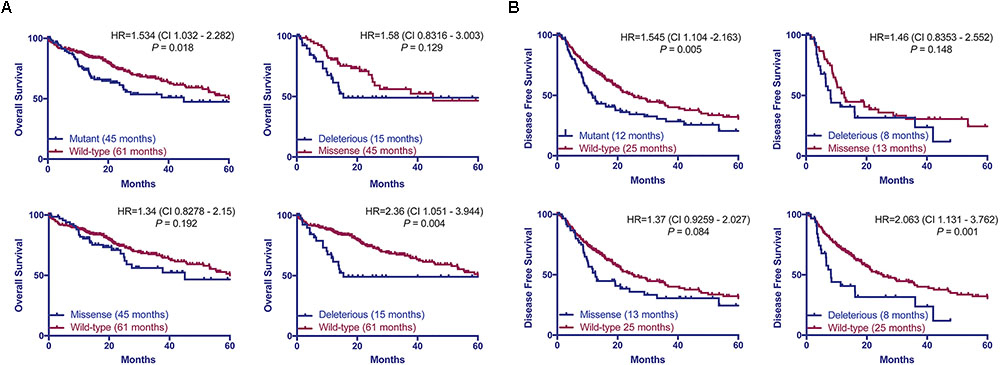
FIGURE 5. TP53 mutation status is associated with worse overall and disease-free survival. Overall (A) and disease-free survival (B) of HCC patients with and without TP53 somatic mutations using the Kaplan–Meier method. Median survival for each group is indicated in parentheses. Statistical comparisons were performed using log-rank tests. P < 0.05 was considered statistically significant.
As an exploratory analysis, we asked whether OSCs or mutational signatures of TP53-mutant HCCs were prognostic. Compared to OSC1 (28 months), OSC2 (26 months) and OSC3 (median not reached), OSC4 was associated with the shortest median OS of 14 months, although the difference was not statistically significant (P = 0.366, log-rank test; Supplementary Figure S4E). Univariate Cox regression analyses revealed that the aflatoxin-associated signature 24 (HR 3.275, CI 1.279–8.384, P = 0.013), HBV infection status and the presence of necrotic areas were associated with poor prognosis (Supplementary Table S5). However, in a multivariate analysis, mutational signature 24 was not an independent prognostic indicator (P = 0.242; Supplementary Table S5).
Taken together, our results showed only patients with deleterious TP53 mutations but not missense TP53 mutations were associated with significantly worse OS and DFS in this cohort.
Discussion
In this study, we performed a detailed analysis of TP53 somatic mutational spectrum in HCCs, with nearly all missense mutations (98%) and most deleterious mutations (73%) affecting the DNA-binding domain. Notably, we found that the residues mutated in HCCs differed from those in other cancer types. Hotspot mutations R249S and V157F were common in HCCs but extremely rare in other cancers, while mutations affecting R175 and R273, two of the most frequently mutated residues in other cancers, were nearly absent in HCCs. This latter observation also applies to other HCC datasets (Ahn et al., 2014; Schulze et al., 2015), suggesting that TP53 mutational spectrum in HCC is distinct from that in other cancers.
To determine the genotype–phenotype correlation between TP53 mutation status and clinicopathologic parameters, we performed a detailed assessment of histologic features using H&E slides. We confirmed the established associations with the male gender, HBV/HCV infection and high Edmondson grade. Additionally, TP53 mutations were associated with the presence of necrotic areas, and accordingly, with the absence of cholestasis, a feature more frequently observed in well-differentiated HCCs. Finally, we observed that the presence of TILs was associated with less frequent TP53 mutations, in line with the favorable prognosis associated with tumors with high TILs in other tumor types (Mahmoud et al., 2011).
Analysis of the mutational signatures revealed that signatures 16 of unknown etiology and the age-associated signature 5 (Alexandrov et al., 2015) were the most prevalent in HCCs. We also found that signature 12 of unknown etiology, characterized by frequent T>C substitutions, was prevalent in TP53-wild-type and HCCs with missense TP53 mutations but were largely absent in those with deleterious TP53 mutation. A previous study reported that the W3 signature, which was highly similar to signature 12 (Fujimoto et al., 2012), was associated with the age of patients. Here we found no difference in the age of patients when we considered tumors with strictly missense or deleterious TP53 mutations (i.e., excluding one patient with both types). The basis of signature 12 is thus unclear and further studies are required to elucidate its biological significance.
Adopting the algorithm of “oncosign” (Ciriello et al., 2013), we identified four robust subclasses of TP53-mutant HCCs with distinct oncogenic signatures. Of these classes, one subclass was likely driven by co-occurring CTNNB1 mutations, while two subclasses were likely driven by amplicon drivers on 1q and 8q. 1q21 amplification has been linked to hepatocarcinogenesis, with ALC1 (CHD1L) overexpression in HCC cells shown to promote G1/S phase transition and to inhibit apoptosis (Ma et al., 2008). The authors further suggested that the oncogenic function of ALC1 might be associated with its role in promoting cell proliferation by down-regulating p53 expression (Ma et al., 2008). The 1q21 amplicon also contains HORMAD1, a gene that has been shown to drive chromosomal instability in breast cancer (Watkins et al., 2015). As for 8q24, in addition to the well-known oncogenic role of MYC, previous studies have also shown that MYC amplification is an indicator of malignant potential and poor prognosis in HCC (Lin et al., 2010), and that the co-occurrence of MYC amplification and p53 alteration may contribute to HCC progression (Kawate et al., 1999). The remaining subclass did not have highly recurrent genetic alterations. Interestingly, this subclass was numerically, though not statistically, associated with the most favorable OS among the four classes. One may speculate that TP53-mutant HCCs lacking additional drivers may constitute a less aggressive subclass. Of note, the features that characterized the four OSCs were largely mutually exclusive, suggesting that distinct oncogenic processes are operative in non-overlapping subsets of TP53-mutant HCCs.
TP53 mutation status predicts worse OS and DFS in HCC patients (Yano et al., 2007; Woo et al., 2011; Cleary et al., 2013). However, we found that patients with deleterious mutations, but not those with missense mutations, were associated with worse OS and DFS compared to patients wild-type for TP53. This is in line with other tumor types, in which different types of TP53 mutations have been associated with different prognoses (Olivier et al., 2006; Ozcelik et al., 2007; Vegran et al., 2013; Lapke et al., 2016). In fact, the risk of death or relapse for patients harboring deleterious mutation is 2.3 times (HR = 2.36 and 2.063, respectively) higher than TP53-wild-type patients. The prognosis for patients with missense mutations appears to sit between those with wild-type TP53 or deleterious TP53 mutations, albeit not statistically different from either group. It is conceivable that the prognostic significance of the type of TP53 mutations may be confirmed in a larger cohort with extensive follow-up.
It has been suggested that TP53 missense mutations have varying capacity to transactivate p53 target genes and to alter the responsiveness to chemotherapeutic agents in breast cancer (Jordan et al., 2010). A differential expression analysis using the HCC TCGA dataset comparing HCCs with TP53 missense mutations and those with TP53 deleterious mutations identified TP53 itself as up-regulated but did not identify significantly altered genes (data not shown). Furthermore, HCCs harboring the missense mutations functionally shown to lack the ability to transactivate genes with p53 response elements (Jordan et al., 2010) did not differ from HCCs with other missense mutations on the transcriptomic level (data not shown). It is thus unclear precisely how the various TP53 mutations may differentially alter the transcriptomic landscape of HCCs. Further functional studies may be required to elucidate how the types of TP53 mutations may affect its biological functions.
In HCC molecular characterization studies to date, HCCs are typically classified as TP53-wild-type or TP53-mutant, where all TP53 mutations were treated as equal (Fujimoto et al., 2012; The Cancer Genome Atlas Research Network, 2017). However, many studies have demonstrated that TP53 can be affected by either (or both) gain-of-function or loss-of-function mutations, with missense mutations preferentially displaying gain-of-function or neomorphic properties (Muller and Vousden, 2014). Our study has demonstrated that HCCs with missense or deleterious TP53 mutations display similar clinicopathologic features, mutational/CNA burden and oncogenic signatures, but are associated with distinct mutational signatures. Clinically, while patients with tumors harboring deleterious TP53 mutations had worse prognosis compared to those wild-type for TP53, there was no statistically significant difference between those with missense mutations and those wild-type for TP53. Our study highlights the importance to consider the type of TP53 mutations in studies of biomarkers and molecular characterization of HCCs.
Our study has limitations. Despite TCGA being the largest genomic study of HCC, it is by no means the only large-scale study. However, as one of our aims was to define clinicopathologic correlates, we chose TCGA as it is the only study with publicly available H&E slides for pathology review. Secondly, the power of the OS and DFS analyses was limited due to the cohort size. Further studies may reveal whether prognosis is related to the type of TP53 mutations, as has been shown in other cancers. Thirdly, our analyses did not consider the non-coding genome due to the nature of the sequencing performed by the TCGA. Given the frequent mutations in non-coding regions such as TERT promoter, MALAT1 and NEAT1 (Fujimoto et al., 2012; Schulze et al., 2015), it is conceivable that additional oncogenic signatures within TP53-mutant HCCs may emerge.
Conclusion
Our study highlights the genetic heterogeneity among TP53-mutant HCCs and that patients with HCCs harboring different types of TP53 mutations may be associated with distinct prognoses. Future work will be required to elucidate whether the co-occurring genetic alterations act synergistically with TP53 mutations to promote carcinogenesis in HCCs.
Author Contributions
CKYN and SP conceived and supervised the study. SA, MSM, and LMT performed the histologic review. VK performed the bioinformatics analyses under supervision of CKYN. VK, CKYN, and SP performed the statistical analyses. VK performed the transcriptomic classification under supervision of YH. VK, ML, LQ, GR, LMT, CKYN, and SP analyzed the data and critically discussed the results. CKYN and SP wrote the manuscript. All authors reviewed and approved the final version of the manuscript.
Funding
SP is funded by Swiss National Science Foundation (Ambizione grant number PZ00P3_168165). CKYN is supported by the European Research Council Synergy grant 609883 (MERiC). The study was supported by grants from Oncosuisse KFS-3995-08-2016 SP and KLS-3639-02-2015 LMT.
Conflict of Interest Statement
The authors declare that the research was conducted in the absence of any commercial or financial relationships that could be construed as a potential conflict of interest.
Acknowledgments
The authors acknowledge that the manuscript has been accepted and presented as e-poster at the International Liver Cancer Association 2018. However, the work has been expanded and only a small part overlaps with the one presented at the mentioned congress.
Supplementary Material
The Supplementary Material for this article can be found online at: https://www.frontiersin.org/articles/10.3389/fgene.2018.00002/full#supplementary-material
Footnotes
- ^http://www.cbioportal.org
- ^https://xenabrowser.net/datapages/?cohort=TCGA%20Liver%20Cancer%20(LIHC)
References
Ahn, S. M., Jang, S. J., Shim, J. H., Kim, D., Hong, S. M., Sung, C. O., et al. (2014). Genomic portrait of resectable hepatocellular carcinomas: implications of RB1 and FGF19 aberrations for patient stratification. Hepatology 60, 1972–1982. doi: 10.1002/hep.27198
Alexandrov, L. B., Jones, P. H., Wedge, D. C., Sale, J. E., Campbell, P. J., Nik-Zainal, S., et al. (2015). Clock-like mutational processes in human somatic cells. Nat. Genet. 47, 1402–1407. doi: 10.1038/ng.3441
Alexandrov, L. B., Nik-Zainal, S., Wedge, D. C., Aparicio, S. A., Behjati, S., Biankin, A. V., et al. (2013). Signatures of mutational processes in human cancer. Nature 500, 415–421. doi: 10.1038/nature12477
Bosman, F. T., Carneiro, F., Hruban, R. H., and Theise, N. D. (2010). WHO Classification of Tumours of the Digestive System World Health Organization. Lyon: IARC.
Boyault, S., Rickman, D. S., De Reynies, A., Balabaud, C., Rebouissou, S., Jeannot, E., et al. (2007). Transcriptome classification of HCC is related to gene alterations and to new therapeutic targets. Hepatology 45, 42–52. doi: 10.1002/hep.21467
Bressac, B., Kew, M., Wands, J., and Ozturk, M. (1991). Selective G to T mutations of p53 gene in hepatocellular carcinoma from southern Africa. Nature 350, 429–431. doi: 10.1038/350429a0
Breuhahn, K., Vreden, S., Haddad, R., Beckebaum, S., Stippel, D., Flemming, P., et al. (2004). Molecular profiling of human hepatocellular carcinoma defines mutually exclusive interferon regulation and insulin-like growth factor II overexpression. Cancer Res. 64, 6058–6064. doi: 10.1158/0008-5472.CAN-04-0292
Chang, M. T., Asthana, S., Gao, S. P., Lee, B. H., Chapman, J. S., Kandoth, C., et al. (2016). Identifying recurrent mutations in cancer reveals widespread lineage diversity and mutational specificity. Nat. Biotechnol. 34, 155–163. doi: 10.1038/nbt.3391
Chiang, D. Y., Villanueva, A., Hoshida, Y., Peix, J., Newell, P., Minguez, B., et al. (2008). Focal gains of VEGFA and molecular classification of hepatocellular carcinoma. Cancer Res. 68, 6779–6788. doi: 10.1158/0008-5472.CAN-08-0742
Ciriello, G., Miller, M. L., Aksoy, B. A., Senbabaoglu, Y., Schultz, N., and Sander, C. (2013). Emerging landscape of oncogenic signatures across human cancers. Nat. Genet. 45, 1127–1133. doi: 10.1038/ng.2762
Cleary, S. P., Jeck, W. R., Zhao, X., Chen, K., Selitsky, S. R., Savich, G. L., et al. (2013). Identification of driver genes in hepatocellular carcinoma by exome sequencing. Hepatology 58, 1693–1702. doi: 10.1002/hep.26540
Edmondson, H. A., and Steiner, P. E. (1954). Primary carcinoma of the liver: a study of 100 cases among 48,900 necropsies. Cancer 7, 462–503. doi: 10.1002/1097-0142(195405)7:3<462::AID-CNCR2820070308>3.0.CO;2-E
Fujimoto, A., Furuta, M., Totoki, Y., Tsunoda, T., Kato, M., Shiraishi, Y., et al. (2016). Whole-genome mutational landscape and characterization of noncoding and structural mutations in liver cancer. Nat. Genet. 48, 500–509. doi: 10.1038/ng.3547
Fujimoto, A., Totoki, Y., Abe, T., Boroevich, K. A., Hosoda, F., Nguyen, H. H., et al. (2012). Whole-genome sequencing of liver cancers identifies etiological influences on mutation patterns and recurrent mutations in chromatin regulators. Nat. Genet. 44, 760–764. doi: 10.1038/ng.2291
Futreal, P. A., Coin, L., Marshall, M., Down, T., Hubbard, T., Wooster, R., et al. (2004). A census of human cancer genes. Nat. Rev. Cancer 4, 177–183. doi: 10.1038/nrc1299
Gao, J., Aksoy, B. A., Dogrusoz, U., Dresdner, G., Gross, B., Sumer, S. O., et al. (2013). Integrative analysis of complex cancer genomics and clinical profiles using the cBioPortal. Sci. Signal. 6:l1. doi: 10.1126/scisignal.2004088
Gao, J., Chang, M. T., Johnsen, H. C., Gao, S. P., Sylvester, B. E., Sumer, S. O., et al. (2017). 3D clusters of somatic mutations in cancer reveal numerous rare mutations as functional targets. Genome Med. 9:4. doi: 10.1186/s13073-016-0393-x
Goossens, N., Sun, X., and Hoshida, Y. (2015). Molecular classification of hepatocellular carcinoma: potential therapeutic implications. Hepat. Oncol. 2, 371–379. doi: 10.2217/hep.15.26
Gouas, D., Shi, H., and Hainaut, P. (2009). The aflatoxin-induced TP53 mutation at codon 249 (R249S): biomarker of exposure, early detection and target for therapy. Cancer Lett. 286, 29–37. doi: 10.1016/j.canlet.2009.02.057
Guichard, C., Amaddeo, G., Imbeaud, S., Ladeiro, Y., Pelletier, L., Maad, I. B., et al. (2012). Integrated analysis of somatic mutations and focal copy-number changes identifies key genes and pathways in hepatocellular carcinoma. Nat. Genet. 44, 694–698. doi: 10.1038/ng.2256
Hall, P. A., and McCluggage, W. G. (2006). Assessing p53 in clinical contexts: unlearned lessons and new perspectives. J. Pathol. 208, 1–6. doi: 10.1002/path.1913
Hoshida, Y., Nijman, S. M., Kobayashi, M., Chan, J. A., Brunet, J. P., Chiang, D. Y., et al. (2009). Integrative transcriptome analysis reveals common molecular subclasses of human hepatocellular carcinoma. Cancer Res. 69, 7385–7392. doi: 10.1158/0008-5472.CAN-09-1089
Hsu, I. C., Metcalf, R. A., Sun, T., Welsh, J. A., Wang, N. J., and Harris, C. C. (1991). Mutational hot spot in the p53 gene in human hepatocellular carcinomas. Nature 350, 427–428. doi: 10.1038/350427a0
Jhunjhunwala, S., Jiang, Z., Stawiski, E. W., Gnad, F., Liu, J., Mayba, O., et al. (2014). Diverse modes of genomic alteration in hepatocellular carcinoma. Genome Biol. 15, 436. doi: 10.1186/s13059-014-0436-9
Jordan, J. J., Inga, A., Conway, K., Edmiston, S., Carey, L. A., Wu, L., et al. (2010). Altered-function p53 missense mutations identified in breast cancers can have subtle effects on transactivation. Mol. Cancer Res. 8, 701–716. doi: 10.1158/1541-7786.MCR-09-0442
Kan, Z., Zheng, H., Liu, X., Li, S., Barber, T. D., Gong, Z., et al. (2013). Whole-genome sequencing identifies recurrent mutations in hepatocellular carcinoma. Genome Res. 23, 1422–1433. doi: 10.1101/gr.154492.113
Kandoth, C., Mclellan, M. D., Vandin, F., Ye, K., Niu, B., Lu, C., et al. (2013). Mutational landscape and significance across 12 major cancer types. Nature 502, 333–339. doi: 10.1038/nature12634
Kawate, S., Fukusato, T., Ohwada, S., Watanuki, A., and Morishita, Y. (1999). Amplification of c-myc in hepatocellular carcinoma: correlation with clinicopathologic features, proliferative activity and p53 overexpression. Oncology 57, 157–163. doi: 10.1159/000012024
Kew, M. C. (2010). Epidemiology of chronic hepatitis B virus infection, hepatocellular carcinoma, and hepatitis B virus-induced hepatocellular carcinoma. Pathol. Biol. 58, 273–277. doi: 10.1016/j.patbio.2010.01.005
Kiani, C., Chen, L., Wu, Y. J., Yee, A. J., and Yang, B. B. (2002). Structure and function of aggrecan. Cell Res. 12, 19–32. doi: 10.1038/sj.cr.7290106
Lapke, N., Lu, Y. J., Liao, C. T., Lee, L. Y., Lin, C. Y., Wang, H. M., et al. (2016). Missense mutations in the TP53 DNA-binding domain predict outcomes in patients with advanced oral cavity squamous cell carcinoma. Oncotarget 7, 44194–44210. doi: 10.18632/oncotarget.9925
Lawrence, M. S., Stojanov, P., Mermel, C. H., Robinson, J. T., Garraway, L. A., Golub, T. R., et al. (2014). Discovery and saturation analysis of cancer genes across 21 tumour types. Nature 505, 495–501. doi: 10.1038/nature12912
Lee, J. S., Chu, I. S., Heo, J., Calvisi, D. F., Sun, Z., Roskams, T., et al. (2004). Classification and prediction of survival in hepatocellular carcinoma by gene expression profiling. Hepatology 40, 667–676. doi: 10.1002/hep.20375
Lin, C. P., Liu, C. R., Lee, C. N., Chan, T. S., and Liu, H. E. (2010). Targeting c-Myc as a novel approach for hepatocellular carcinoma. World J. Hepatol. 2, 16–20. doi: 10.4254/wjh.v2.i1.16
Ma, N. F., Hu, L., Fung, J. M., Xie, D., Zheng, B. J., Chen, L., et al. (2008). Isolation and characterization of a novel oncogene, amplified in liver cancer 1, within a commonly amplified region at 1q21 in hepatocellular carcinoma. Hepatology 47, 503–510. doi: 10.1002/hep.22072
Mahmoud, S. M., Paish, E. C., Powe, D. G., Macmillan, R. D., Grainge, M. J., Lee, A. H., et al. (2011). Tumor-infiltrating CD8+ lymphocytes predict clinical outcome in breast cancer. J. Clin. Oncol. 29, 1949–1955. doi: 10.1200/JCO.2010.30.5037
Martelotto, L. G., De Filippo, M. R., Ng, C. K., Natrajan, R., Fuhrmann, L., Cyrta, J., et al. (2015). Genomic landscape of adenoid cystic carcinoma of the breast. J. Pathol. 237, 179–189. doi: 10.1002/path.4573
Muller, P. A., and Vousden, K. H. (2014). Mutant p53 in cancer: new functions and therapeutic opportunities. Cancer Cell 25, 304–317. doi: 10.1016/j.ccr.2014.01.021
Nik-Zainal, S., Davies, H., Staaf, J., Ramakrishna, M., Glodzik, D., Zou, X., et al. (2016). Landscape of somatic mutations in 560 breast cancer whole-genome sequences. Nature 534, 47–54. doi: 10.1038/nature17676
Olivier, M., Hollstein, M., and Hainaut, P. (2010). TP53 mutations in human cancers: origins, consequences, and clinical use. Cold Spring Harb. Perspect. Biol. 2:a001008. doi: 10.1101/cshperspect.a001008
Olivier, M., Langerod, A., Carrieri, P., Bergh, J., Klaar, S., Eyfjord, J., et al. (2006). The clinical value of somatic TP53 gene mutations in 1,794 patients with breast cancer. Clin. Cancer Res. 12, 1157–1167. doi: 10.1158/1078-0432.CCR-05-1029
Ozcelik, H., Pinnaduwage, D., Bull, S. B., and Andrulis, I. L. (2007). Type of TP53 mutation and ERBB2 amplification affects survival in node-negative breast cancer. Breast Cancer Res. Treat. 105, 255–265. doi: 10.1007/s10549-006-9452-0
Peng, S. Y., Chen, W. J., Lai, P. L., Jeng, Y. M., Sheu, J. C., and Hsu, H. C. (2004). High alpha-fetoprotein level correlates with high stage, early recurrence and poor prognosis of hepatocellular carcinoma: significance of hepatitis virus infection, age, p53 and beta-catenin mutations. Int. J. Cancer 112, 44–50. doi: 10.1002/ijc.20279
Piscuoglio, S., Ng, C. K., Martelotto, L. G., Eberle, C. A., Cowell, C. F., Natrajan, R., et al. (2014). Integrative genomic and transcriptomic characterization of papillary carcinomas of the breast. Mol. Oncol. 8, 1588–1602. doi: 10.1016/j.molonc.2014.06.011
Rosenthal, R., Mcgranahan, N., Herrero, J., Taylor, B. S., and Swanton, C. (2016). deconstructSigs: delineating mutational processes in single tumors distinguishes DNA repair deficiencies and patterns of carcinoma evolution. Genome Biol. 17:31. doi: 10.1186/s13059-016-0893-4
Schulze, K., Imbeaud, S., Letouze, E., Alexandrov, L. B., Calderaro, J., Rebouissou, S., et al. (2015). Exome sequencing of hepatocellular carcinomas identifies new mutational signatures and potential therapeutic targets. Nat. Genet. 47, 505–511. doi: 10.1038/ng.3252
Shiraishi, Y., Fujimoto, A., Furuta, M., Tanaka, H., Chiba, K., Boroevich, K. A., et al. (2014). Integrated analysis of whole genome and transcriptome sequencing reveals diverse transcriptomic aberrations driven by somatic genomic changes in liver cancers. PLOS ONE 9:e114263. doi: 10.1371/journal.pone.0114263
Soussi, T., Leroy, B., and Taschner, P. E. (2014). Recommendations for analyzing and reporting TP53 gene variants in the high-throughput sequencing era. Hum. Mutat. 35, 766–778. doi: 10.1002/humu.22561
Totoki, Y., Tatsuno, K., Covington, K. R., Ueda, H., Creighton, C. J., Kato, M., et al. (2014). Trans-ancestry mutational landscape of hepatocellular carcinoma genomes. Nat. Genet. 46, 1267–1273. doi: 10.1038/ng.3126
The Cancer Genome Atlas Research Network (2017). Comprehensive and integrative genomic characterization of hepatocellular carcinoma. Cell 169, 1327.e23–1341.e23. doi: 10.1016/j.cell.2017.05.046
Vegran, F., Rebucci, M., Chevrier, S., Cadouot, M., Boidot, R., and Lizard-Nacol, S. (2013). Only missense mutations affecting the DNA binding domain of p53 influence outcomes in patients with breast carcinoma. PLOS ONE 8:e55103. doi: 10.1371/journal.pone.0055103
Villanueva, A., and Hoshida, Y. (2011). Depicting the role of TP53 in hepatocellular carcinoma progression. J. Hepatol. 55, 724–725. doi: 10.1016/j.jhep.2011.03.018
Vogelstein, B., Lane, D., and Levine, A. J. (2000). Surfing the p53 network. Nature 408, 307–310. doi: 10.1038/35042675
Vogelstein, B., Papadopoulos, N., Velculescu, V. E., Zhou, S., Diaz, L. A. Jr., and Kinzler, K. W. (2013). Cancer genome landscapes. Science 339, 1546–1558. doi: 10.1126/science.1235122
Watkins, J., Weekes, D., Shah, V., Gazinska, P., Joshi, S., Sidhu, B., et al. (2015). Genomic complexity profiling reveals that hormad1 overexpression contributes to homologous recombination deficiency in triple-negative breast cancers. Cancer Discov. 5, 488–505. doi: 10.1158/2159-8290.CD-14-1092
Weinhold, N., Jacobsen, A., Schultz, N., Sander, C., and Lee, W. (2014). Genome-wide analysis of noncoding regulatory mutations in cancer. Nat. Genet. 46, 1160–1165. doi: 10.1038/ng.3101
Woo, H. G., Wang, X. W., Budhu, A., Kim, Y. H., Kwon, S. M., Tang, Z. Y., et al. (2011). Association of TP53 mutations with stem cell-like gene expression and survival of patients with hepatocellular carcinoma. Gastroenterology 140, 1063–1070. doi: 10.1053/j.gastro.2010.11.034
Keywords: TP53 mutations, somatic mutations, copy number alterations, mutational signature, oncogenic signature
Citation: Kancherla V, Abdullazade S, Matter MS, Lanzafame M, Quagliata L, Roma G, Hoshida Y, Terracciano LM, Ng CKY and Piscuoglio S (2018) Genomic Analysis Revealed New Oncogenic Signatures in TP53-Mutant Hepatocellular Carcinoma. Front. Genet. 9:2. doi: 10.3389/fgene.2018.00002
Received: 30 October 2017; Accepted: 03 January 2018;
Published: 02 February 2018.
Edited by:
Michael Eccles, University of Otago, New ZealandReviewed by:
Rengyun Liu, Johns Hopkins University School of Medicine, United StatesKartiki V. Desai, National Institute of Biomedical Genomics, India
Copyright © 2018 Kancherla, Abdullazade, Matter, Lanzafame, Quagliata, Roma, Hoshida, Terracciano, Ng and Piscuoglio. This is an open-access article distributed under the terms of the Creative Commons Attribution License (CC BY). The use, distribution or reproduction in other forums is permitted, provided the original author(s) and the copyright owner are credited and that the original publication in this journal is cited, in accordance with accepted academic practice. No use, distribution or reproduction is permitted which does not comply with these terms.
*Correspondence: Salvatore Piscuoglio, salvatore.piscuoglio@usb.ch Charlotte K. Y. Ng, kiuyancharlotte.ng@usb.ch