 Juliana S. M. Pimentel1
 Anderson O. Carmo1
 Izinara C. Rosse1
 Ana P. V. Martins1
 Sandra Ludwig2
 Susanne Facchin1
 Adriana H. Pereira1
 Pedro F. P. Brandão-Dias1
 Nazaré L. Abreu1
 Evanguedes Kalapothakis1*
- 1Laboratory of Biotechnology and Molecular Markers, Department of General Biology, Institute of Biological Sciences, Federal University of Minas Gerais, Belo Horizonte, Brazil
- 2Department of Zoology, Institute of Biological Sciences, Federal University of Minas Gerais, Belo Horizonte, Brazil
Genetic diversity and population studies are essential for conservation and wildlife management programs. However, monitoring requires the analysis of multiple loci from many samples. These processes can be laborious and expensive. The choice of microsatellites and PCR calibration for genotyping are particularly daunting. Here we optimized a low-cost genotyping method using multiple microsatellite loci for simultaneous genotyping of up to 384 samples using next-generation sequencing (NGS). We designed primers with adapters to the combinatorial barcoding amplicon library and sequenced samples by MiSeq. Next, we adapted a bioinformatics pipeline for genotyping microsatellites based on read-length and sequence content. Using primer pairs for eight microsatellite loci from the fish Prochilodus costatus, we amplified, sequenced, and analyzed the DNA of 96, 288, or 384 individuals for allele detection. The most cost-effective methodology was a pseudo-multiplex reaction using a low-throughput kit of 1 M reads (Nano) for 384 DNA samples. We observed an average of 325 reads per individual per locus when genotyping eight loci. Assuming a minimum requirement of 10 reads per loci, two to four times more loci could be tested in each run, depending on the quality of the PCR reaction of each locus. In conclusion, we present a novel method for microsatellite genotyping using Illumina combinatorial barcoding that dispenses exhaustive PCR calibrations, since non-specific amplicons can be eliminated by bioinformatics analyses. This methodology rapidly provides genotyping data and is therefore a promising development for large-scale conservation-genetics studies.
Introduction
Innovative technological applications in the field of conservation genetics can contribute to wildlife monitoring and management programs. Technological advances in genomics have greatly expanded the use of genetic markers in biological research, resulting in more extensive and efficient generation and analysis of population genetics data (Putman and Carbone, 2014).
Microsatellites are DNA units composed of repeating motifs in tandem, also known as simple sequence repeats (SSRs) or short tandem repeats. Due to their high degree of polymorphism, microsatellites are used as molecular markers in genetic structure, kinship identification, genetic mapping, and others population genetics studies (Buschiazzo and Gemmell, 2006; Chistiakov et al., 2006; Yazbeck and Kalapothakis, 2007; Bhargava and Fuentes, 2010). The high statistical power per locus obtained through microsatellites genotyping makes this a powerful tool in population studies (Guichoux et al., 2011; Putman and Carbone, 2014). Moreover, microsatellites are preferred in forensic and kinship analyses due to their high mutation rates and multiallelic nature (Clayton et al., 1998), and are the markers most frequently used in human paternity tests (Guichoux et al., 2011).
The early difficulties in isolating sequences from microsatellites were circumvented with the use of next-generation sequencing (NGS). Indeed, thousands of microsatellite loci can now be identified from a single NGS run (Tang et al., 2008; Boomer and Stow, 2010; Castoe et al., 2010; Rosazlina et al., 2015). However, the current techniques present difficulties regarding PCR calibration and the choice of informative microsatellites with high specificity. Thus, a balanced reaction that maintains great sensitivity and specificity to target DNA remains a challenge. In addition, studies involving microsatellites frequently use electrophoresis, which makes PCR calibration and fragment size identification laborious, and compromises the analysis of homoplasy cases (Delmotte et al., 2001; Pasqualotto et al., 2007).
NGS has enabled high-throughput genotyping, with a range of protocols for partial sequencing of genomes such as the use of restriction enzymes, e.g., RAD (Baird et al., 2008), ddRAD (Peterson et al., 2012), and 2bRAD (Wang et al., 2012). This is collectively known as ‘genotyping-by-sequencing’ (GBS) (Narum et al., 2013). Sequencing of a target region (PCR amplicon) can also be used as a GBS method (Vartia et al., 2015).GBS enables analyses of multiple target sequences in several different samples simultaneously, thereby saving time and resources. Moreover, target region sequencing can be applied to DNA samples with a certain degree of degradation such as forensic and cancer biopsy samples (Kerick et al., 2011; Van Neste et al., 2012; König et al., 2015). New approaches with microsatellite genotyping using individual combinatorial barcoding have been used in conservation genetics (Scheible et al., 2011; Vartia et al., 2015).
Here, we optimized a high-throughput genotyping methodology for genetic studies in conservation programs. We genotyped microsatellite loci employing NGS technology using Prochilodus costatus, a migratory fish species found in Brazil, as a model. Microsatellite markers with a maximum size of 200 base pairs (bp) and tri- or tetra-nucleotide motifs were used to facilitate data analysis (de Valk et al., 2005). We tested distinct NGS reagent kits and varying numbers of individuals per analysis. We believe that the use of high-throughput technology in conservation studies will advance the field, allowing large amounts of data to be generated quickly and efficiently.
Materials and Methods
Ethics Statement
We collected P. costatus samples in the region under the influence of the Três Marias dam (located in the state of Minas Gerais, Southeastern Brazil). To collect the samples needed for the study we obtained a Permanent Field Permit for Collecting from the Instituto Chico Mendes de Conservação da Biodiversidade (protocol number 57204-1) and also from the Instituto Estadual de Florestas (protocol number 014.007 2017).
DNA Extraction
Using a sterile metallic mold, we removed 12.5-mm2 fragments of fish fin from samples previously collected and stored in 70% ethanol (v/v). Fragments were washed with ultrapure water and individually placed in 96-well plates. We added 50 μL of NaOH (50 mM) to the wells, sealed the plates, vortexed for 10 s, incubated at 95°C for 10 min, and vortexed again for 10 s. Then, 7.5 μL of Tris-HCl (0.5 M, pH 8.0) were added to each well and the plates vortexed for 15 s. Supernatants were transferred to new 96-well plates. We purified DNA from the supernatants using Agencourt AMPure XP magnetic beads (Beckman Coulter, Brea, CA, United States), according to the manufacturer’s protocol. DNA was quantified using Qubit 2.0 (Invitrogen, Carlsbad, CA, United States) and its purity was evaluated using NanoDrop 2000 (ThermoScientific, Waltham, MA, United States).
Analysis and Identification of Microsatellites
Contigs previously generated by shotgun genome sequencing of P. costatus and deposited in the database of the Laboratory of Biotechnology and Molecular Markers were used for in silico analysis. The software msatcommander (Faircloth, 2008) was used to identify microsatellite regions. Over 100,000 contigs containing microsatellite regions were identified, and about 1,000 primer pairs suggested. We screened the primer pairs for the generated fragment size (amplicons of 130–200 bp), and selected microsatellites containing at least seven repeats of tri- or tetra-nucleotide motifs. de Valk et al. (2005) reported that microsatellites with tri- and tetra-nucleotide motifs can be easily discerned, avoiding issues such as stutter patter.
We selected 50 primer pairs that matched the requirements and tested them in P. costatus samples. PCR optimization was carried out by testing buffers with distinct concentrations of Mg2+ and KCl (Phoneutria Biotecnologia e Serviços LTDA, Brazil). PCR was performed using different annealing temperatures (50 – 65°C), dimethyl sulfoxide concentrations (0 – 7%), and numbers of amplification cycles (20 – 35). Amplicons were analyzed in 8% (w/v) polyacrylamide gel stained with silver nitrate. Twenty-four sets of primers were selected based on the presence of a single band (homozygous) or two adjacent bands (heterozygous). For genotyping, we used Illumina’s metagenomics protocol for amplicon resequencing. An ‘overhang adapter’ complementary to the ‘index’ in Illumina’s Nextera kits was added to the primers. The ‘overhang adapter’ sequences were as follows: Forward: 5′-TCGTCGGCAGC GTCAGATGTGTATAAGAGACAG + locus-specific forward primer sequence-3′, and Reverse: 5′-GTCTCGTGGGCTCG GAGATG TGTATAAGAGACAG + locus-specific reverse primer sequence-3′. The primers with the overhang adapters were incorporated into the target DNA through 30 PCR cycles. A specific primer (index) containing the MiSeq adapter (which individualizes samples in the NGS procedures) was attached to amplicons through 10 PCR amplification cycles (Figure 1A). A preliminary genotyping test (NGS sequencing) was performed using P. costatus DNA isolated from five individuals. From the 24 sets of primers, eight were selected for further analyses (Table 1). These were selected based on performance and PCR robustness (i.e., satisfactory amplification in non-ideal conditions, such as little or degraded DNA, the presence of inhibitors, etc.) and the presence of homozygous or heterozygous alleles with low amounts of unspecific DNA. GenBank accession number: Proc10 MG456705; Proc18 MG456707; Proc22 MG456708; Proc36 MG456709; Proc37 MG456710; Proc44 MG456712; Proc48 MG456715; Proc49 MG456716.
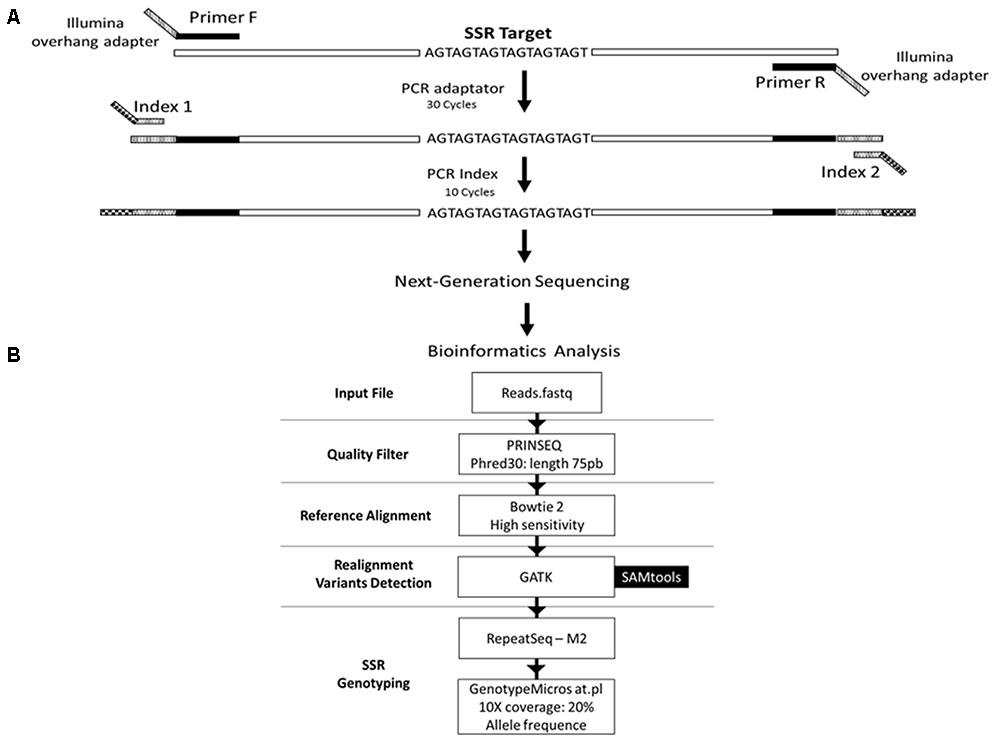
FIGURE 1. Schematic representation of the genotyping strategy. (A) Amplification protocol for generation of the amplicons for sequencing. (B) Data analysis pipeline. The reads from the sequencing are filtered based on the quality of the bases and the length of the read, using the PRINSEQ tool. Filtered reads are aligned against the reference sequence using the software Bowtie2 with high sensitivity parameter. Then, the reads are realigned against the reference, using tools from the GATK package, to increase the confidence in genotyping. Subsequently, alleles are detected and quantified using the RepeatSeq tool. Results are filtered to decrease the false negative rate using the GenotypeMicrosat.pl script. Finally, the result of the genotyping is converted into the format required by population genetics analysis software using the same script.
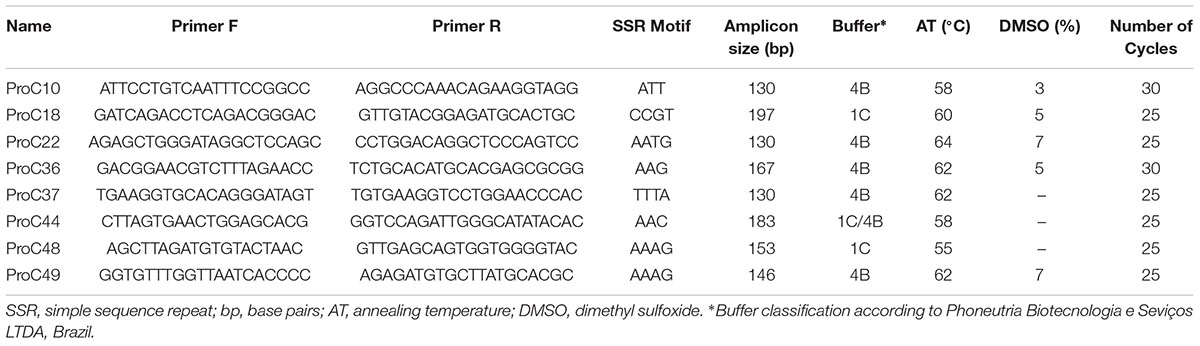
TABLE 1. Primers used for amplification of the microsatellite markers selected for genotyping of Prochilodus costatus.
We tested several NGS genotyping strategies: (a) multiplex, in which all primer pairs were used to amplify a single DNA sample in a single reaction (30 cycles) followed by the incorporation of the index (10 cycles) and NGS sequencing; (b) pseudo-multiplex reaction, in which each primer pair was individually used to amplify a DNA target (30 cycles), followed by pooling the amplicons of one individual and a second PCR (10 cycles) for index incorporation and MiSeq sequencing; (c) monoplex, in which DNA target amplification (30 cycles) and index incorporation (10 cycles) were performed individually for each DNA target and followed by MiSeq sequencing. Table 2 indicates the strategies, the types of cartridges, and the number of target DNA samples used (minimum of five and maximum of 384).
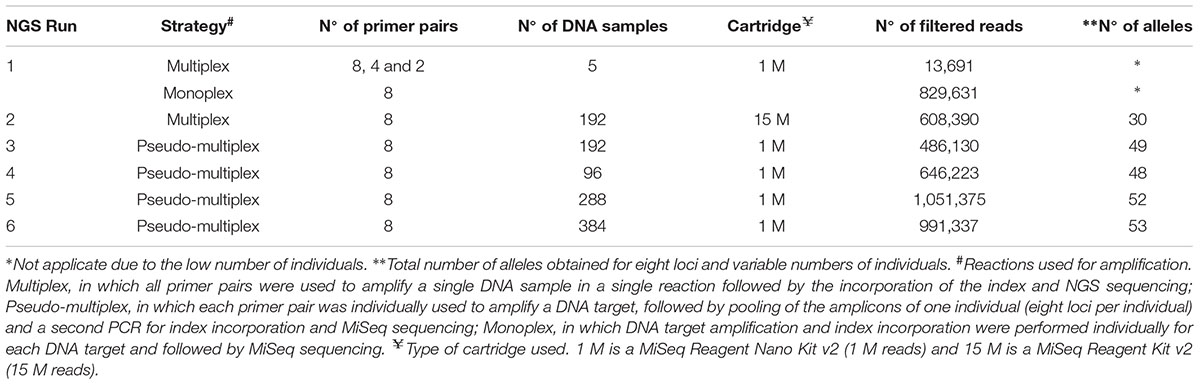
TABLE 2. Strategies used for optimization of next generation sequencing (NGS) microsatellite genotyping of Prochilodus costatus.
To optimize the NGS genotyping procedures, we performed multiplex PCR tests in an initial MiSeq run (run 1) using a low-throughput kit (1 M reads, MiSeq Reagent Kit Nano, 300 cycles; Illumina). We mixed eight, four, and two primer pairs for the first, second, and third tests, respectively. Additionally, a monoplex test was carried out for each of the eight primer pairs selected. We used DNA from five individuals in all tests (Table 2) and different index sequences for each test.
The second NGS run (run 2) was carried out using a multiplex reaction with the eight selected primer pairs, 192 individuals, and a high-throughput kit (15 M cartridge, MiSeq Reagent Kit Standard, 300 cycles; Illumina). Pseudo-multiplex reactions with eight primer pairs and 1M cartridges were performed in the runs 3, 4, 5, and 6 with 192, 96, 288, and 384 target DNAs, respectively (Table 2).
We used Nextera XT Index Kit v2 Sets A, B, C, and D (Illumina), which allows the sequencing of up to 384 individuals in a single MiSeq run and, therefore, accelerates the process and increases the benefit-cost ratios of the analysis. We further increased the number of individuals genotyped per run using a random nucleotide sequence (such as AAA or TTT) between the adapter and the locus-specific sequences. We used the following primers: Forward: 5′-TCGTCGGCAG CGTCAGATGT GTATAAGAGA CAG + AAA or TTT + locus-specific forward primer sequence-3′, and Reverse: 5′-GTCTCGTGGGCTCGGAGATG TGTATAAGAG ACAG + AAA or TTT + locus-specific reverse primer sequence-3′ (see Table 1 for primer sequences). In these runs, only one set of adapters was used (Nextera XT Index kit v2 set A) and 288 individuals were genotyped. Noteworthy, other sequences can be used including CCC or sequences with four or more nucleotides. However, shorter sequences (one or two nucleotides) may hinder bioinformatics analysis, whereas longer sequences may reduce the efficiency of amplification. Additional tests should be performed to evaluate each case.
Amplicons of the eight loci were polled for each individual, quantified using Qubit, and diluted to 10 ng/μl. Then, a new pool (the combinatorial barcoding amplicon library) was prepared with all the quantified material. This library was then quantified by qPCR using the KAPA Library Quant Illumina/Universal kit (KAPA Biosciences) following the manufacturers’ instructions. The library was used as input in a MiSeq run with a final concentration of 15 pM. A ready-to-use control library from Illumina (PhiX Control v3) was used in each sequencing run.
Genotyping of Microsatellites
We developed a bioinformatics pipeline for microsatellite genotyping (described below and in Figure 1B). To improve reliability, we trimmed and filtered the obtained reads using the PRINSEQ tool (Schmieder and Edwards, 2011). Bases with Phred scores lower than 30 and/or read lengths shorter than 75 bp were removed. Filtered reads were aligned against a FASTA file containing reference sequences for the eight microsatellite loci using the software Bowtie 2 (Langmead and Salzberg, 2012) with the high sensitivity option.
Alignment against a reference region that contains insertions or deletions of nucleotides, such as the microsatellite variants requires careful curation because variations in the edge of the repeat can lead to error in alignment and consequent misidentification of the alleles. One way to increase the confidence and reduce error is to realign the reads taking into account the nucleotide sequence of the edges of the repeat and possible variants within the region. As no information on the variants of the microsatellite region studied here was available in public databases, we identified the possible variants at the edges of the repetition of each of the eight loci. We used the SAMtools package (Li et al., 2009) to detect possible variants in the mapping file (BAM format) of each of the 384 sequenced individuals. As a result, we obtained a Variant Call Format (VCF) file containing all the variants in the regions around the microsatellites repeat motifs. Next, we realigned the reads that mapped to the reference repeating regions using the tools RealignTargetCreator and IndelRealigner from the GATK package (McKenna et al., 2010). These tools perform a local realignment to the regions of the repeat motifs taking into account only high-quality reads that completely cover the repeat region and the variants described for the region (VCF file). Reads that did not match these criteria were removed. A realignment file (BAM format) containing only reads that realigned to each locus (tested twice) was obtained for each individual, thus increasing the confidence in the identification of the alleles.
We used the RepeatSeq tool (Highnam et al., 2012), with parameter -M 2 (minimum sequencing quality required value) to identify and quantify the alleles from the realignment files. This tool requires a file containing the chromosome coordinates and the repeat region motif sequence. Since P. costatus genomic information was unavailable, we used the information obtained through the microsatellites amplicon sequencing as an independent chromosome. We created an input file containing the name, the starting and ending positions of the repeat sequence in the amplicon, and the sequence of repeat motif for each locus. The information of the chromosomal regions was replaced by the information of each of the amplicons. There is no limit regarding the size or number of amplicons. However, it is important to enter the correct location and base sequence of the repeat region. The RepeatSeq tool uses the coordinate file to search for repeat regions in the realignment files and calculates the repeat length, which determines the alleles. A repeat ATTATTATTATT, for example, would be defined as allele 12. After identification of the repeat motif, the reads that aligned to that region are selected and quantified, according to their number of repeats. The resulting file contains the full read annotation of the reference microsatellite, including the total number of alleles detected, total number of reads, total number of reads per allele, and mapping quality score.
To avoid false negatives and to convert the results into the input format required by the software commonly used in population genetics, we developed a Perl script, named GenotypeMicrosat.pl. This script performs a detailed analysis of the RepeatSeq output file. We determined the individual’s genotype for each locus using the following filter criteria: (1) maximum of two alleles per individual per locus; (2) at least 10 reads per locus in the entire repeat sequence, including eight bases in the 5′ and eight bases in the 3′ flanking regions; and (3) at least 20% of reads corresponding to a second allele for an individual to be considered heterozygous in a given locus. Individuals with a second allele coverage of less than 20% were considered homozygous. Following application of these filter criteria, we generated a spreadsheet containing the genotypes of each individual for each of the eight loci. Loci that did not attain the filter requirements were identified as ‘NA.’ The generated spreadsheet can be easily adapted for other population genetics analysis programs.
Results
In comparison with monoplex, multiplex reactions generated 10- to 100-times fewer reads (run 1) that could be used in genotyping (Figure 2). For some loci, no reads were detected in the multiplex tests, which suggests intense primer competition. On the other hand, consistent results were observed with monoplex-amplified samples (Figure 2).
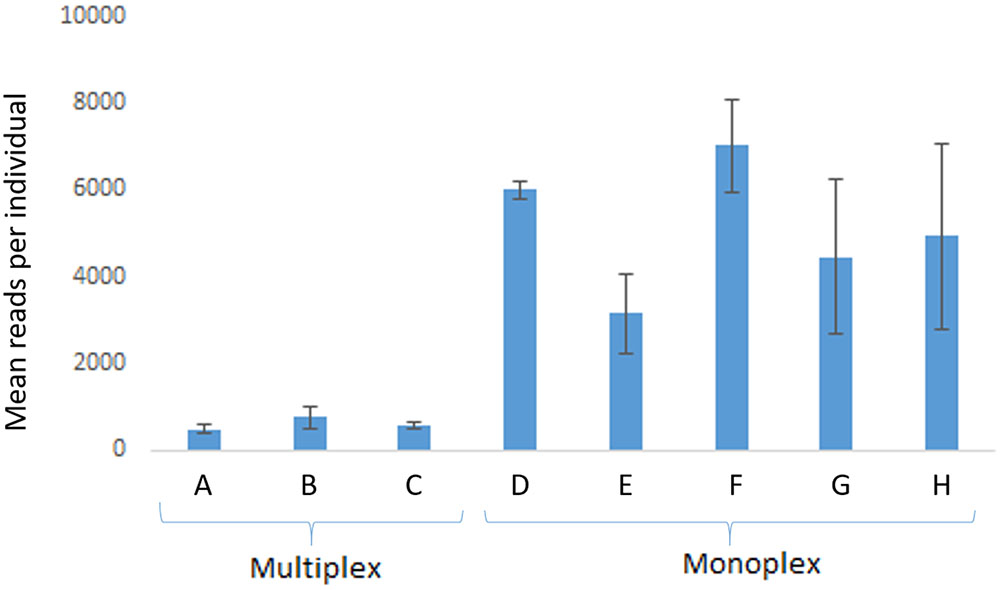
FIGURE 2. Average (mean) read yield in run 1 (n = 5 individuals). Multiplex reactions were performed in A with eight loci (proC10, proC18, proC22, proC36, proC37, proC44, proC48, proC49), in B with four loci (proC18, proC36, proC37, proC44), and in C with two loci (proC48 and proC49). Monoplex reactions were performed in D (proC10), E (proC18), F (proC36), G (proC48), and H (proC49). Error bars are standard deviation. MiSeq Reagent Kit v2 1 M reads was used.
We compared the genotyping results of 192 individuals by multiplex (run 2) or pseudo-multiplex (run 3) reactions. The 15 M cartridge tested in run 2 yielded about 4.7 times more reads than the 1 M cartridge (Nano) kit tested in run 3. Nevertheless, the number of reads generated with the Nano kit (run 3) allowed genotyping of all individuals. In run 2 (multiplex, Table 3), reads were obtained for five loci only. Amplification efficiency, determined as the fraction of individuals successfully genotyped for a given locus, was superior in the pseudo-multiplex reaction (run 3) for all loci, except proC10 and proC37 (Table 3).
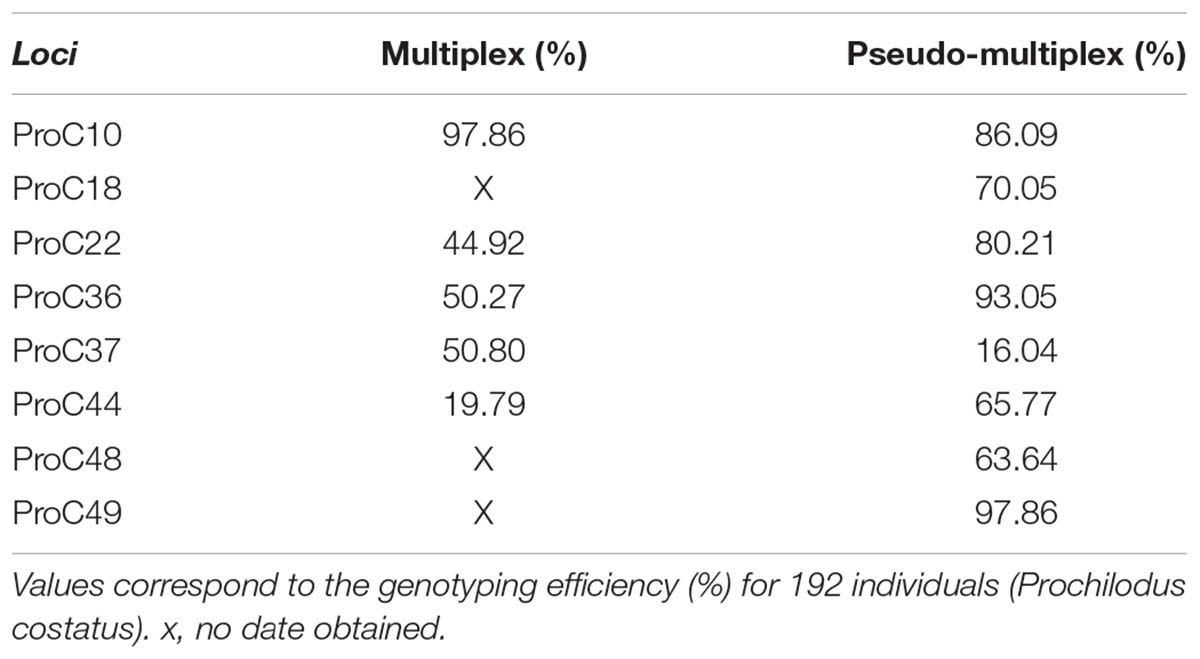
TABLE 3. Amplification and genotyping efficiency test for multiplex (run 2) and pseudo-multiplex (run 3) systems.
As expected, the standard curve generated from runs 4, 5, and 6 revealed a strong negative correlation between the number of individuals tested and the number of reads generated (Figure 3). The obtained distribution of reads per locus in these three runs (Table 4) was uneven. When analyzing 384 individuals (run 6), we encountered an average of 325 reads per individual per locus for all loci. The yield differed depending on the locus being evaluated and for the same locus in different runs. For example, marker proC36 yielded an average of 1,018 reads per individual in run 5 and 198 reads per individual in run 6. On the other hand, proC37 yielded only 65 and 42 reads in runs 5 and 6, respectively. This variation did not compromise the genotyping analysis because of the bioinformatics parameters used.
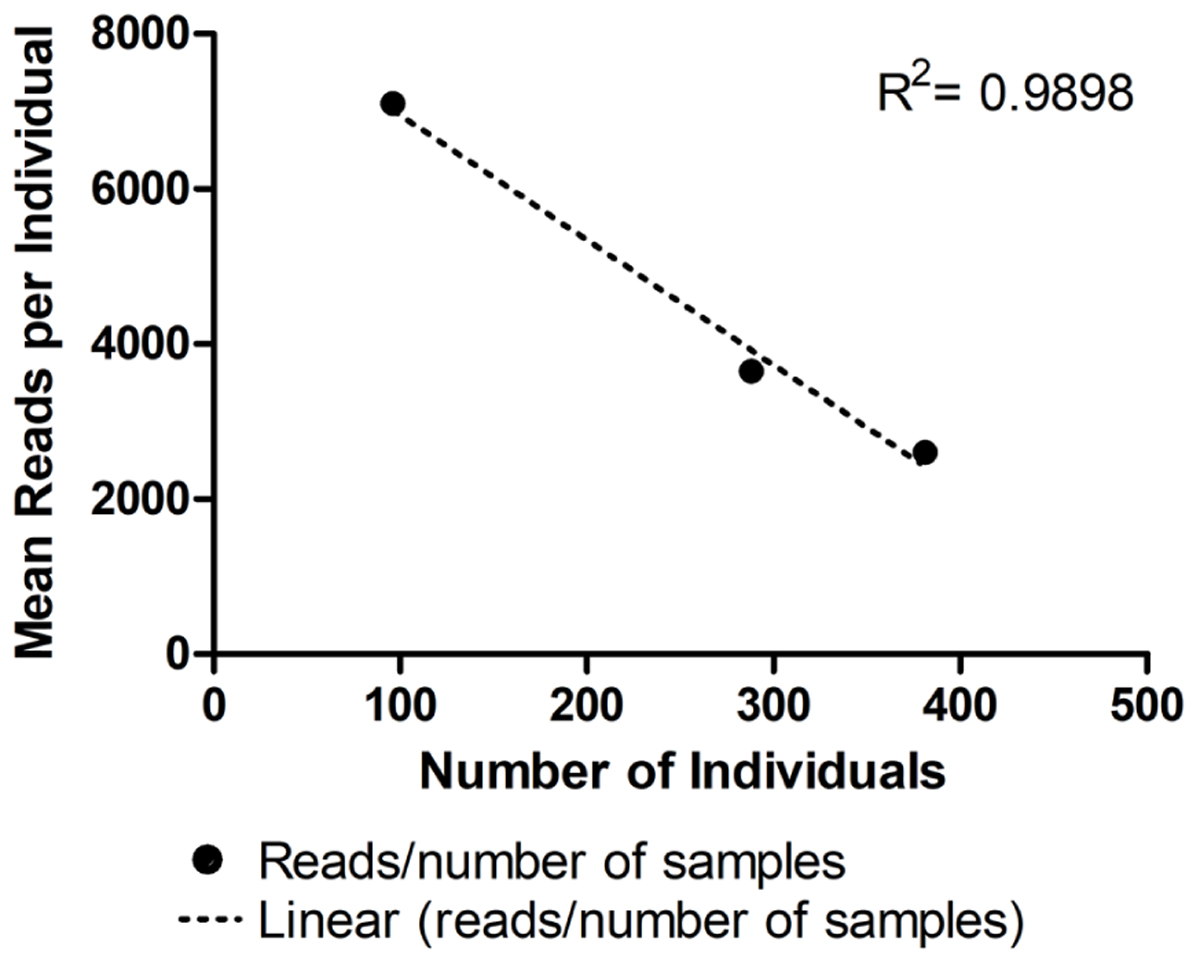
FIGURE 3. Average number of reads generated per individual in three distinct runs using MiSeq Reagent Kit v2 1 M reads: run 4 (96 individuals), run 5 (288 individuals), and run 6 (384 individuals). • Represents the mean number of reads for each number of samples tested. Linear regression is represented by the dashed line (……). For more details, see Table 2.
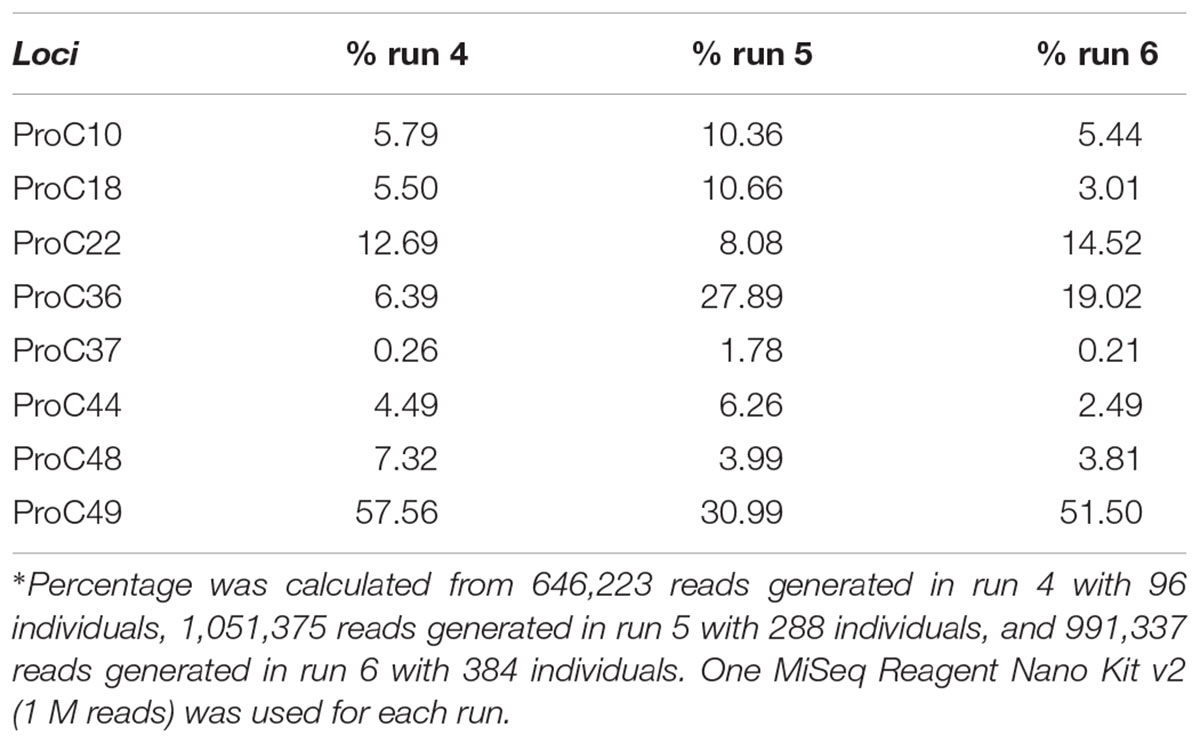
TABLE 4. Percentage∗ of reads generated for each locus tested in three distinct sequencing runs (runs 4, 5, and 6).
From the 3,771,786 reads yielded in run 6, 1,998,885 (53%) passed quality filtering. Repeatseq identified 991,337 high-quality reads (Table 2), which were subsequently used for allele detection. Of the 3,072 microsatellites genotyped in this run (eight loci from 384 individuals), 1,179 (39%) remained with undetermined genotype due to the low number of reads per locus (<10). The total number of alleles obtained in run 6 (384 individuals and 1 M cartridge) was 53, with the locus proC49 showing the highest number of alleles (10) while proC10 showed the lowest (4). Genotyping using the primers marked with base triads AAA and TTT generated results similar to those obtained in run 6.
Discussion
In the present paper we showed the potential of microsatellite genotyping by NGS as a fast and cost-effective methodology to be implemented in large-scale population genetic studies. We used a combination of commercially available indexes and genotyped 384 individuals per run. The efficiency observed with the Nano (1 M reads) kit represents a substantial cost reduction over the NGS runs with the 15 M reads kit.
The flowchart presented herein was developed to ensure high accuracy in microsatellite genotyping. We excluded low-quality reads from the analysis and aligned the reads against the reference using Bowtie 2, the best-suited software for INDEL-rich loci (Highnam et al., 2012). This realignment step increases the confidence in allele detection, since our analysis considers only reads that cover the whole repeat region, including eight bases in the 5′ and eight bases in the 3′ flanking regions. Additionally, the pipeline proposed verifies all neighboring variations (5′ and 3′ regions flanking the microsatellite motif), allowing the identification of homoplastic motif repeat numbers and fragment length. The microsatellite genotyping tool RepeatSeq uses a Bayesian approach, which considers characteristics of the read and the sequence under analysis (Highnam et al., 2012). The developed GenotypeMicrosat.pl script further increases the confidence of the genotyping by establishing a minimum of 10 reads to confirm an allele.
Read realignment with the GATK package requires a file containing all the variants described for the analyzed species. However, information about variations in our model species is scarce in public databases. As an alternative, we used single nucleotide polymorphisms (SNPs) and INDELs detected through sequenced amplicons as input for GATK. To circumvent the lack of data on the P. costatus microsatellite genomic localization required by RepeatSeq, we generated a file containing the genomic coordinates and repeat sequences to use as input. Our successful attempts to overcome the lack of genomic information for our species of interest highlight the potential application of the pipeline proposed for microsatellite genotyping of species for which genomic data are not available, and further support its use in genetic monitoring programs.
The maximum number of individuals genotyped per run is limited by the number of commercially available indexes (currently 384). However, the amplification success of primers containing adenine or thymine trios shows the potential of this tool to increase the number of individuals genotyped in a single run. We genotyped eight loci per individual, with an average coverage of 325 reads per locus per individual in the runs with the Nano kit using 384 samples. As the genotyping pipeline considers a minimum of 10 reads per allele per individual, none of the runs reached the maximum capacity of the cartridge. In theory, the number of individuals or the number of loci could be increased up to four times per run (32 loci or 1536 individuals), based on the regression analysis. However, this possibility must be weighted carefully since the number of alleles considerably varies among the loci. For instance, ProC49 showed an average of 700 reads, while ProC37 showed 20 reads per individual in run 6. The number of loci may, therefore, be increased or decreased depending on the quality of the loci tested. Previous knowledge of the quality of a given locus also allows for the use of greater amounts of amplicon for loci with low yield. These findings open the prospect of using loci for which PCR reactions are not 100% efficient and represent an advantage in the genetic analysis of understudied species with limited availability of microsatellites.
Traditional methods employing microsatellite molecular markers have disadvantages such as the long optimization process and the elevated costs, especially in the development of multiplex systems. Additionally, automation limitations and data management requirements can prevent technology transfer among different laboratories (Guichoux et al., 2011). Previous studies have shown that allele sizes generated by capillary electrophoresis may vary depending on the equipment and running conditions (Delmotte et al., 2001; Foulet et al., 2005; Pasqualotto et al., 2007), and the number of loci that can be multiplexed with this technique is limited by the number of commercially available fluorophores. On the other hand, many loci can be simultaneously genotyped in a single NGS run (Scheible et al., 2011). The direct sequencing of loci is a more reliable approach as it allows for the analysis of all the variations in the fragment, thus ensuring greater reliability. Furthermore, technology transfer and detection of technical errors are facilitated by NGS. Here we tested eight loci per individual. Nevertheless, our pipeline has the potential to provide analysis of a significantly larger number of loci and recent publications with neotropical migratory fish revealed a minimum of seven and a maximum of 13 loci for up to 30 individuals (Rueda et al., 2011; Berdugo and Narvaez Barandica, 2014; Coimbra et al., 2017).
Despite the poor results of direct multiplex reactions, we successfully optimized a ‘pseudo-multiplex strategy,’ in which previous monoplex reactions were performed for each sample and the amplicons mixed in the indexing reaction. This strategy reduced the cost and duration of the analysis and may be used in the genotyping of other markers, such as SNPs, and in metagenomics studies.
Conclusion
We present a novel method for microsatellite genotyping based on the Illumina combinatorial barcoding using a Nano kit. This approach is faster and more efficient than those currently available and offers large amounts of high-quality data for conservation genetics and population studies.
Author Contributions
JP and EK designed and coordinated the work. SL, SF, AP, PB-D, and NA acquired the data. AC, IR, and AM developed the pipeline. JP, AC, IR, and SL analyzed the data. All authors contributed to data interpretation and provided substantial contributions to manuscript writing. All authors approved the final version prior to submission.
Funding
This work was funded by Companhia Energética de Minas Gerais (CEMIG) (project P&D GT 455), Coordenação de Aperfeiçoamento de Pessoal de Nível Superior (CAPES) (Edital Cincias Forenses no. 25/2014), and Conselho Nacional de Desenvolvimento Científico e Tecnológico (CNPq).
Conflict of Interest Statement
The authors declare that the research was conducted in the absence of any commercial or financial relationships that could be construed as a potential conflict of interest.
References
Baird, N. A., Etter, P. D., Atwood, T. S., Currey, M. C., Shiver, A. L., Lewis, Z. A., et al. (2008). Rapid SNP discovery and genetic mapping using sequenced RAD markers. PLoS One 3:e3376. doi: 10.1371/journal.pone.0003376
Berdugo, G. O., and Narvaez Barandica, J. C. (2014). Genetic diversity and population structure of bocachico Prochilodus magdalenae (Pisces, Prochilodontidae) in the Magdalena River basin and its tributaries, Colombia. Genet. Mol. Biol. 37, 37–45.
Bhargava, A., and Fuentes, F. F. (2010). Mutational dynamics of microsatellites. Mol. Biotechnol. 44, 250–266. doi: 10.1007/s12033-009-9230-4
Boomer, J. J., and Stow, A. J. (2010). Rapid isolation of the first set of polymorphic microsatellite loci from the Australian gummy shark, Mustelus antarcticus and their utility across divergent shark taxa. Conserv. Genet. Resour. 2, 393–395. doi: 10.1007/s12686-010-9274-6
Buschiazzo, E., and Gemmell, N. J. (2006). The rise, fall and renaissance of microsatellites in eukaryotic genomes. Bioessays 28, 1040–1050. doi: 10.1002/bies.20470
Castoe, T. A., Poole, A. W., Gu, W., Jason de Koning, A. P., Daza, J. M., Smith, E. N., et al. (2010). Rapid identification of thousands of copperhead snake (Agkistrodon contortrix) microsatellite loci from modest amounts of 454 shotgun genome sequence. Mol. Ecol. Resour. 10, 341–347. doi: 10.1111/j.1755-0998.2009.02750.x
Chistiakov, D. A., Hellemans, B., and Volckaert, F. A. (2006). Microsatellites and their genomic distribution, evolution, function and applications: a review with special reference to fish genetics. Aquaculture 255, 1–29. doi: 10.1016/j.aquaculture.2005.11.031
Clayton, T. M., Whitaker, J. P., Sparkes, R., and Gill, P. (1998). Analysis and interpretation of mixed forensic stains using DNA STR profiling. Forensic Sci. Int. 91, 55–70. doi: 10.1016/S0379-0738(97)00175-8
Coimbra, M. R. M., Lima, A. P. S., Oliveira, K. K. C., and Severi, W. (2017). Microsatellite assessment of the genetic diversity in indigenous populations of curimba (Prochilodus argenteus) in the São Francisco river (Brazil). Conserv. Genet. 18, 965–975. doi: 10.1007/s10592-017-0947-5
de Valk, H. A., Meis, J. F., Curfs, I. M., Muehlethaler, K., and Mouton, J. W. (2005). Use of a novel panel of nine short tandem repeats for exact and high-287 resolution fingerprinting of Aspergillus fumigatus isolates. J. Clin. Microbiol. 43, 4112–4120. doi: 10.1128/JCM.43.8.4112-4120.2005
Delmotte, F., Leterme, N., and Simon, J. C. (2001). Microsatellite allele sizing: difference between automated capillary electrophoresis and manual technique. Biotechniques 31, 810, 814–816, 818.
Faircloth, B. C. (2008). Msatcommander: detection of microsatellite repeat arrays and automated, locus-specific primer design. Mol. Ecol. Resour. 8, 92–94. doi: 10.1111/j.1471-8286.2007.01884.x
Foulet, F., Nicolas, N., Eloy, O., Botterel, F., Gantier, J. C., Costa, J. M., et al. (2005). Microsatellite marker analysis as a typing system for Candida glabrata. J. Clin. Microbiol. 43, 4574–4579. doi: 10.1128/JCM.43.9.4574-4579.2005
Guichoux, E., Lagache, L., Wagner, S., Chaumeil, P., Léger, P., Lepais, O., et al. (2011). Current trends in microsatellite genotyping. Mol. Ecol. Resour. 11, 591–611. doi: 10.1111/j.1755-0998.2011.03014.x
Highnam, G., Franck, C., Martin, A., Stephens, C., Puthige, A., and Mittelman, D. (2012). Accurate human microsatellite genotypes from high-throughput resequencing data using informed error profiles. Nucleic Acids Res. 41:e32. doi: 10.1093/nar/gks981
Kerick, M., Isau, M., Timmermann, B., Sültmann, H., Herwig, R., Krobitsch, S., et al. (2011). Targeted high throughput sequencing in clinical cancer settings: formaldehyde fixed-paraffin embedded (FFPE) tumor tissues, input amount and tumor heterogeneity. BMC Med. Genomics 4:68. doi: 10.1186/1755-8794-4-68
König, K., Peifer, M., Fassunke, J., Ihle, M. A., Künstlinger, H., Heydt, C., et al. (2015). Implementation of amplicon parallel sequencing leads to improvement of diagnosis and therapy of lung cancer patients. J. Thorac. Oncol. 10, 1049–1057. doi: 10.1097/JTO.0000000000000570
Langmead, B., and Salzberg, S. L. (2012). Fast gapped-read alignment with Bowtie 2. Nat. Methods 9, 357–359. doi: 10.1038/nmeth.1923
Li, H., Handsaker, B., Wysoker, A., Fennell, T., Ruan, J., Homer, N., et al. (2009). The sequence alignment/map format and SAMtools. Bioinformatics 25, 2078–2079. doi: 10.1093/bioinformatics/btp352
McKenna, A., Hanna, M., Banks, E., Sivachenko, A., Cibulskis, K., Kernytsky, A., et al. (2010). The genome analysis toolkit: a MapReduce framework for analyzing next-generation DNA sequencing data. Genome Res. 20, 1297–1303. doi: 10.1101/gr.107524.110
Narum, S. R., Buerkle, C. A., Davey, J. W., Miller, M. R., and Hohenlohe, P. A. (2013). Genotyping-by-sequencing in ecological and conservation genomics. Mol. Ecol. 22, 2841–2847. doi: 10.1111/mec.12350
Pasqualotto, A. C., Denning, D. W., and Anderson, M. J. (2007). A cautionary tale: lack of consistency in allele sizes between two laboratories for a published multilocus microsatellite typing system. J. Clin. Microbiol. 45, 522–528. doi: 10.1128/JCM.02136-06
Peterson, B. K., Weber, J. N., Kay, E. H., Fisher, H. S., and Hoekstra, H. E. (2012). Double digest RADseq: an inexpensive method for de novo SNP discovery and genotyping in model and non-model species. PLoS One 7:e0037135. doi: 10.1371/journal.pone.0037135
Putman, A. L., and Carbone, I. (2014). Challenges in analysis and interpretation of microsatellite data for population genetic studies. Ecol. Evol. 4, 4399–4428. doi: 10.1002/ece3.1305
Rosazlina, R., Jacobsen, N., Ørgaard, M., and Othman, A. S. (2015). Utilizing next generation sequencing to characterize microsatellite loci in a tropical aquatic plant species Cryptocoryne cordata var. cordata (Araceae). Biochem. Syst. Ecol. 61, 385–389. doi: 10.1016/j.bse.2015.06.033
Rueda, E., Sommer, J., Scarabotti, P., Markariani, R., and Ortí, G. (2011). Isolation and characterization of polymorphic microsatellite loci in the migratory freshwater fish Prochilodus lineatus (Characiformes. Prochilodontidae). Conserv. Genet. Resour. 3, 681–684. doi: 10.1111/jfb.12632
Scheible, M., Loreille, O., Just, R., and Irwin, J. (2011). Short tandem repeat sequencing on the 454 platform. Forensic Sci. Int. 3, e357–e358. doi: 10.1016/j.fsigen.2014.04.010
Schmieder, R., and Edwards, R. (2011). Quality control and preprocessing of metagenomic datasets. Bioinformatics 27, 863–864. doi: 10.1093/bioinformatics/btr026
Tang, J., Baldwin, S. J., Jacobs, J. M., van der Linden, C. G., Voorrips, R. E., Leunissen, J. A., et al. (2008). Large-scale identification of polymorphic microsatellites using an in silico approach. BMC Bioinformatics 9:374. doi: 10.1186/1471-2105-9-374
Van Neste, C., Van Nieuwerburgh, F., Van Hoofstat, D., and Deforce, D. (2012). Forensic STR analysis using massive parallel sequencing. Forensic Sci. Int. Genet. 6, 810–818. doi: 10.1016/j.fsigen.2012.03.004
Vartia, S., Villanueva-Cañas, J. L., Finarelli, J., Farrell, E. D., Collins, P. C., Hughes, G. M., et al. (2015). A novel method of microsatellite genotyping-by-sequencing using individual combinatorial barcoding. R Soc. Open Sci. 3:15056. doi: 10.1098/rsos.150565
Wang, S., Meyer, E., McKay, J. K., and Matz, M. V. (2012). 2b-RAD: a simple and flexible method for genome-wide genotyping. Nat. Methods 9, 808–810. doi: 10.1038/nmeth.2023
Keywords: microsatellite, fish, genotyping, next-generation sequencing, conservation genetics
Citation: Pimentel JSM, Carmo AO, Rosse IC, Martins APV, Ludwig S, Facchin S, Pereira AH, Brandão-Dias PFP, Abreu NL and Kalapothakis E (2018) High-Throughput Sequencing Strategy for Microsatellite Genotyping Using Neotropical Fish as a Model. Front. Genet. 9:73. doi: 10.3389/fgene.2018.00073
Received: 14 September 2017; Accepted: 19 February 2018;
Published: 09 March 2018.
Edited by:
Roberto Ferreira Artoni, Ponta Grossa State University, BrazilReviewed by:
Alexandre Wagner Silva Hilsdorf, University of Mogi das Cruzes, BrazilMasafumi Nozawa, Tokyo Metropolitan University, Japan
Copyright © 2018 Pimentel, Carmo, Rosse, Martins, Ludwig, Facchin, Pereira, Brandão-Dias, Abreu and Kalapothakis. This is an open-access article distributed under the terms of the Creative Commons Attribution License (CC BY). The use, distribution or reproduction in other forums is permitted, provided the original author(s) and the copyright owner are credited and that the original publication in this journal is cited, in accordance with accepted academic practice. No use, distribution or reproduction is permitted which does not comply with these terms.
*Correspondence: Evanguedes Kalapothakis, kalapothakis@gmail.com