When the words are not everything: the use of laughter, fillers, back-channel, silence, and overlapping speech in phone calls
 Alessandro Vinciarelli
 Paraskevi Chatziioannou1
 - 1School of Computing Science, University of Glasgow, Glasgow, UK
- 2Department of Psychology, Second University Naples, Caserta, Italy
This article presents an observational study on how some common conversational cues – laughter, fillers, back-channel, silence, and overlapping speech – are used during mobile phone conversations. The observations are performed over the SSPNet Mobile Corpus, a collection of 60 calls between pairs of unacquainted individuals (120 subjects for roughly 12 h of material in total). The results show that the temporal distribution of the social signals above is not uniform, but it rather reflects the social meaning they carry and convey. In particular, the results show significant use differences depending on factors such as gender, role (caller or receiver), topic, mode of interaction (agreement or disagreement), personality traits, and conflict handling style.
1. Introduction
In general terms, non-verbal communication is the “process of one person stimulating meaning in the mind of another person or persons by means of non-verbal messages” (Richmond et al., 1991). In face-to-face conversations, people have at disposition a wide spectrum of cues – facial expressions, gestures, mutual distances, posture, etc. – to accomplish non-verbal communication and enrich the words being exchanged with multiple layers of meaning (social, psychological, emotional, etc.). However, the situation changes dramatically in phone-mediated conversations where all the functions typically fulfilled via non-verbal communication, e.g., conveying impressions, sending relational messages, expressing emotions, etc. (Hecht et al., 1999), must be constrained through the only available channel, i.e., speech. The main difficulty in this case is that the same vocal apparatus must be used for both verbal and non-verbal components of communication and, in some cases, one component can be used only at the expense of the other (e.g., it is difficult to speak and laugh at the same time).
Given the above, the temporal distribution of non-verbal vocal cues should not be uniform, but rather correspond to the function and role of non-verbal communication in human–human interactions. For example, in the case of laughter, “the temporal segregation of speech and laughter on the single vocalization channel reveals the presence or absence of an underlying organizational principle” (Provine, 1993). More generally, “the circumstances in which an activity is performed and those in which it never occurs [provide] clues as to what the behavior pattern might be for (its function)” (Martin and Bateson, 2007). For these reasons, this article proposes an analysis of the temporal distribution of several non-verbal vocal cues – laughter (audible contractions, typically rhythmical, of the diaphragm and other parts of the respiratory system), fillers (expressions like “ehm” that fill the time intervals that should be occupied by a word), back-channel (short voiced utterances like “ah-ah” that signal attention and encouragement to continue to others), silence (time intervals during which nobody speaks or produces audible sounds), and overlapping speech (time intervals during which at least two speakers talk at the same time) – in the SSPNet Mobile Corpus (Polychroniou et al., 2014), a collection of 60 phone calls between unacquainted individuals (120 subjects in total). In particular, the observations show that the distribution of the cues changes according to the following factors expected to account for the relational context: gender (male vs female), role (caller vs receiver), topic of conversation (task vs social), mode of interaction (agreement vs disagreement), Big-Five personality traits (McCrae, 2009), and conflict handling style (Rahim, 1983).
The rationale behind the choice of the cues above is that they tend to appear frequently in conversations (see Section 2) and this is probably an indication of their primacy in human–human communication. Furthermore, the five cues are the subject of extensive work in social signal processing (Vinciarelli et al., 2012), computational paralinguistics (Schuller and Batliner, 2013), and human–media interaction (Nijholt, 2014), three computing domains involving automatic detection and interpretation of non-verbal behavioral cues. In this respect, the findings of this work can be helpful for automatic approaches aimed at automatically making sense of social interactions.
Overall, the observations of this work try to address the following three main questions:
• What are the physical, possibly machine detectable traces of socially relevant factors like gender, role, topic of conversation, mode of interaction, personality traits, and conflict handling style?
• Is it possible to transfer observations made about face-to-face interactions to phone-mediated conversations?
• Does the use of phones introduce effects and biases that are not observed (or not applicable) in face-to-face interactions?
The results of the observations show that, far from distributing uniformly over time, non-verbal cues appear with different frequency depending on the relational context factors. Therefore, the frequency of the cues can be considered one of the physical traces that contextual factors leave. Furthermore, the results show that several status and dominance effects observed in face-to-face interactions seem to apply in the case of phone-mediated conversations as well. Hence, observations about co-located interactions appear to transfer, at least partially, to phone calls. Finally, the results show that the difference between calling or receiving (peculiar of phone calls and not applicable to face-to-face encounters) tends to be perceived as a difference in terms of status and dominance. Therefore, the use of phones induces peculiar effects that are not observed in other interactional settings.
The rest of this article is organized as follows: Section 2 describes the corpus and its scenario, Section 3 describes the methodology adopted in this work, Section 4 illustrates observations and findings, and Section 5 draws some conclusions.
2. The SSPNet Mobile Corpus: Scenario and Cues
The observations of this work are performed over the SSPNet Mobile Corpus (Polychroniou et al., 2014), a collection of 60 phone calls between unacquainted individuals (120 subjects in total). The conversations, 708 min and 24 s in total, revolve around the Winter Survival Task (see below) and are annotated in terms of the cues mentioned in Section 1, namely laughter, fillers, back-channel, silence, and overlapping speech. The rest of this section provides further details about both task and cues.
2.1. The Winter Survival Task
The winter survival task (WST) requires the participants to consider a list of 12 items (steel wool, axe, pistol, butter can, newspaper, lighter without fuel, clothing, canvas, airmap, whiskey, compass, chocolate) and to identify those that can increase the chances of survival after a plane crash in Northern Canada (Joshi et al., 2005). Before participating in the experiment, the participants have been asked to fill the Big-Five Inventory 10 (Rammstedt and John, 2007) and the Rahim Organizational Conflict Inventory II (Rahim, 1983), two questionnaires that measure personality traits (see Section 4.5 for details) and conflict handling style (see Section 4.6 for details), respectively.
Figure 1 illustrates the experimental protocol adopted for collecting the data. After having filled the questionnaires, the participants have been admitted to the experiment and the calls have been collected as follows:
• Step 1: The two subjects involved in the same call are conducted to two different rooms of the School of Computing Science at the University of Glasgow (the two subjects never enter in contact with one another before the call).
• Step 2: Once in their room, the participants receive the same document that explains the WST and are asked to read it carefully (the document includes the list of the 12 items at the core of the task).
• Step 3: Before starting the call, the subjects address the WST by filling a form where, for each of the 12 items, they have to tick a “Yes” or “No” box. A positive answer means that the item can increase the chances of survival and vice versa for the negative answer. The participants are asked to tick a box for each of the items (the call cannot start if any item is left blank).
• Step 4: The two subjects receive a mobile phone (the same model for both participants).
• Step 5: One of the two subjects, selected randomly, calls the other with the mobile phone provided by the experimenters.
• Step 6: During the call, the two subjects have to negotiate a common solution for the WST. Every time they have ticked a different box about an item, one of the two participants has to shift to the decision made by the other participant. The items have to be discussed one-by-one following the same order for all pairs; the call cannot be interrupted until a common decision has been reached for all items.
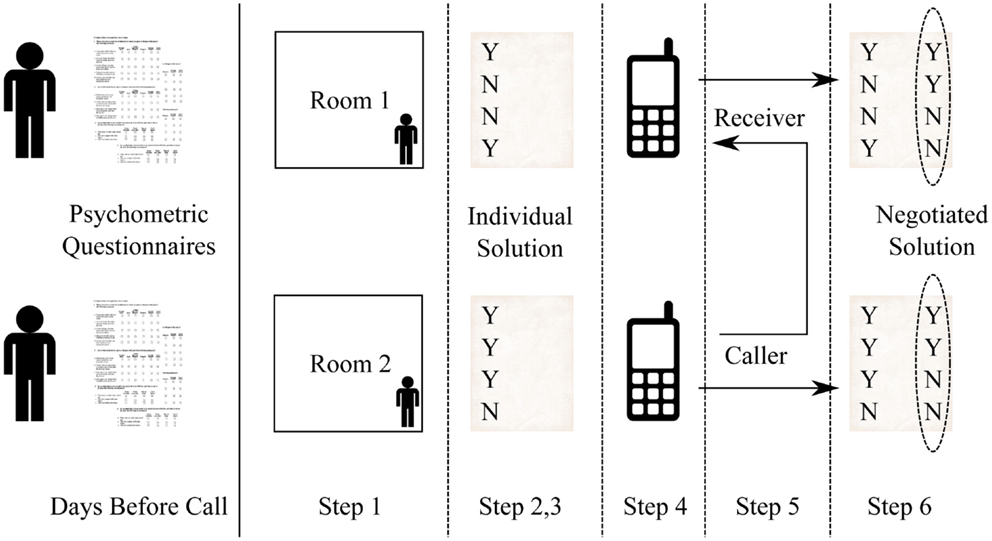
Figure 1. The picture shows the experimental protocol. The subjects fill self-assessment questionnaires in the days before the call. The day of the call, they sit in one of the two offices used for the experiment (step 1), they read the protocol (step 2), they address the WST task individually (step 3), they receive a mobile phone (step 4), they negotiate a common solution during a call (step 5), and they deliver a negotiated solution (step 6).
At the end of the call, the participants have received a payment that includes a fixed sum of £6 and a bonus calculated as follows: the WST has a golden standard that shows what are the items for which the box “Yes” should be ticked. Each time the participants tick the box “Yes” for one of these, they earn £3. However, if the participants tick the box Yes for an item for which the golden standard says “No,” then they loose £3. If the bonus is negative (the false positives are more frequent than the true positives), the participants do not receive any extra bonus.
2.2. The Cues
Figure 2 shows the distribution of the cues in terms of both occurrences and percentage of the corpus duration covered by each of them. The high frequency of all cues (16,235 occurrences in total) confirms their primacy in human–human communication.
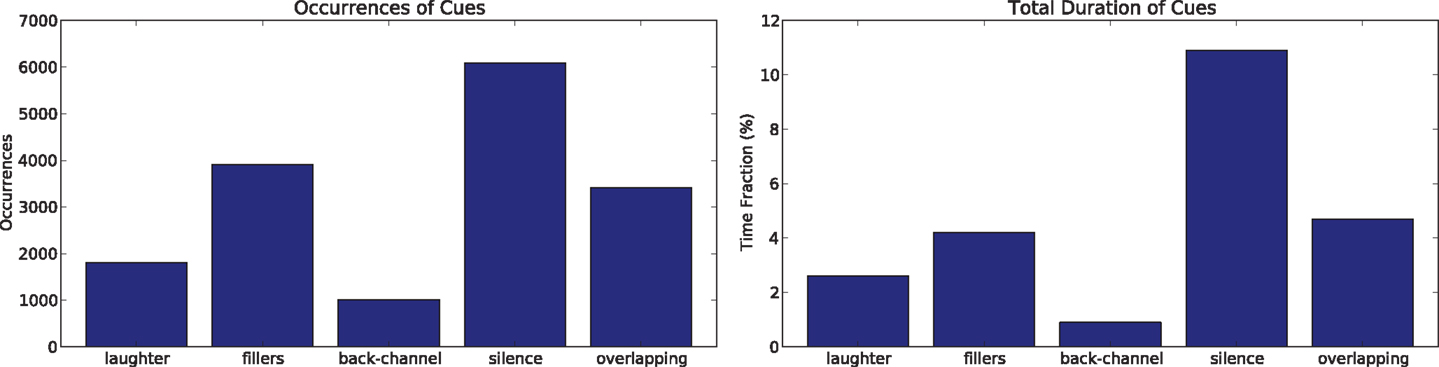
Figure 2. The left chart shows the number of occurrences for the cues considered in this article. The right chart shows the percentage of time covered by each cue in the corpus.
Laughter is “a common, species-typical human vocal act and auditory signal that is important in social discourse” (Provine and Yong, 1991). Seminal findings about the temporal distribution of laughter in conversations have been proposed by Provine (1993), including the tendency of women to laugh more than men, the tendency of listeners to laugh less than speakers, and the tendency to laugh only when a sentence has been completed. More recently, laughter was found to signal topic changes in spontaneous conversations (Bonin et al., 2014). This article confirms some of the previous observations while proposing new effects that can emerge in the particular scenario of the SSPNet Mobile Corpus. Figure 2 shows that the laughter occurrences in the corpus are 1805 for a total duration of 1,114.8 s (2.6% of the total length of the corpus). When the speakers laugh together, the cue is counted twice.
Fillers are expressions like “ehm” and “uhm” that “are characteristically associated with planning problems [.] planned for, formulated, and produced as parts of utterances just as any word is” (Clark and Fox Tree, 2002). This means that speakers replace words with fillers when, e.g., they need time to look for the right term, they plan what to say next or they try to hold the floor. According to the distribution of Figure 2, the corpus includes 3,912 filler occurrences that account for 1,815.9 s (4.2% of the total corpus time).
Another frequent event in human–human conversations is back-channel, i.e., the use of “short utterances produced by one participant in a conversation while the other is talking” (Ward and Tsukahara, 2000). In English, this corresponds to expressions like “yeah,” “aha-aha,” etc., that signal, in most cases, attention and agreement. Figure 2 shows that the speakers of the Corpus perform back-channel 1,015 times, for a total of 407.1 s (0.9% of the corpus time).
Silence is the most frequent cue among those considered in this work: 6,091 occurrences for a total of 4,670.6 s (10.9% of the corpus length). In some cases, silence accompanies the grammatical structure of the speech stream (e.g., a short silence can signal the end of a sentence), in others it manifests hesitation in planning the next words or it is a latency time between questions and answers (Hall and Knapp, 1992). Furthermore, silence can serve communication purposes: “the main common link between speech and silence is that the same interpretive processes apply to someone’s remaining meaningfully silent in discourse as to their speaking” (Jaworski, 1999). The observations of this work do not take into account the differences mentioned above, but show that the frequency of silences changes according to some relational context factors (see Section 4).
According to Schegloff (2000), “Talk by more than one person at a time in the same conversation is one of the two major departures that occur from what appears to be a basic design feature of conversation, [.] namely ‘one at a time’ (the other departure is silence, i.e., fewer than one at a time).” For this reason, the observations of this work take into account both silence (see above) and overlapping speech, i.e., the time intervals during which the two subjects involved in the same call talk simultaneously. The number of occurrences for this cue is 3,412 for a total of 2,000.5 s (4.7% of the corpus time). Unless there is competition for the floor, simultaneous speakers resolve overlapping quickly to move back to the “one at a time” situation (the average duration of overlapping speech segments in the corpus is 0.58 s). Like in the case of the other cues, the observations of this work show how the frequency of overlapping speech segments changes in different parts of a conversation.
3. Methodology
The goal of this work is to show whether the frequency of non-verbal cues changes according to six factors expected to account for the relational context, namely gender (see Section 4.1), role (see Section 4.2), topic of conversation (see Section 4.3), mode of interaction (see Section 4.4), personality traits (see Section 4.5), and conflict handling style (see Section 4.6).
Each factor is modeled as a variable V that can take L values (numeric or nominal). For example, in the case of gender, the variable V can take 2 values, i.e., male and female. Given V, the corpus can be segmented into intervals that correspond to one of the values of V. In the case of gender, this corresponds to segment the corpus into intervals where the speaker is female and intervals where it is male. As a result, a fraction pf of the corpus time corresponds to female speakers while a fraction pm corresponds to male ones, with pf + pm = 1, 0 < pf < 1 and 0 < pm < 1. In more general terms, if the variable V associated to a factor can take L values v1, v2,…,vL, the Corpus can be segmented into L subsets that account for fractions of the total time p1, p2,…,pL of the total time, where 0 < pk < 1∀k and .
If a cue (i.e., laughter, fillers, back-channel, silence, or overlapping speech) occurs N times in the corpus and its temporal distribution does not depend on the factor associated to V, the expected number of occurrences in the corpus intervals where V = vk will be Ek = N⋅pk. For example, in the case of gender, the expected numbers of occurrences in correspondence of female and male speakers will be Ef = N⋅pf and Em = N⋅pm, respectively. However, the observed number of occurrences, i.e., the number of occurrences actually counted in the corpus intervals where V = vk, will be Ok. In the gender examples, Of will be the number of times that female speakers actually display the cue while Om will be the number of times that male ones do it. This allows one to define the following χ2 variable:
where the number of degrees of freedom is L − 1. Such a variable can be used to test whether the null hypothesis is true (there is no statistically significant difference between observed and expected distribution) or it must be rejected. In other words, the χ2 variable above can tell us whether the frequency of a given cue changes to a statistically significant extent depending on the value of V. In the case of gender, if the null hypothesis can be rejected, it means that speakers of a given gender tend to display a certain cue significantly more frequently than those of the other gender or vice versa. The process for verifying whether a deviation with respect to the expected distribution is statistically significant with confidence level α is as follows:
1. The value of the χ2 variable resulting from the observed distribution is calculated.
2. The p-value corresponding to the χ2 value is estimated;
3. If the p-value estimated at step 2 is lower than α/k, where α is the desired confidence level and k = 79 is the total number of statistical inferences made over the data, then the deviation is considered statistically significant with confidence level α.
In other words, an effect is considered statistically significant with confidence level 0.01 when the p-value is lower than 0.01/79 = 0.0001. Similarly, an effect is considered statistically significant with confidence level 0.05 when the p-value is lower than 0.05/79 = 0.0006. Such a practice, known as Bonferroni correction, is typically applied when making a large number of statistical inferences over the same data like it happens in this work. The Bonferroni correction is subject to criticism because it reduces the number of false positives at the cost of increasing significantly the number of false negatives (Nakagawa, 2004). However, it allows one to concentrate the analysis on the stronger effects observed in the corpus.
4. Corpus Analysis
This section adopts the methodology described in Section 3 to test whether the frequency of non-verbal cues changes according to relational context factors, i.e., gender, role, topic, mode of interaction, personality, and conflict handling style.
4.1. Gender Effects
The gender variable can take two values, male and female. In the SSPNet Mobile Corpus, male subjects are 57 (47.5% of the total) and female ones are 63 (52.5% of the total). However, male subjects speak 54.5% of the time and this means that they tend to talk longer than female ones to a statistically significant extent (statistically significant with confidence level α = 0.01 according to a χ2 test with Bonferroni correction). A possible explanation is that the negotiation scenario adopted in the corpus (Polychroniou et al., 2014) activates gender stereotypes according to which “women are less assertive and agentic than men” (Thompson et al., 2010). Therefore, women might tend to speak less, on average, than men. Further confirmation comes from the duration of male–male calls that tend to be, on average, significantly longer than calls where at least one of the two speakers is female (see end of this section).
In absence of further gender effects, 54.5% of the occurrences of a cue should be displayed by male subjects because these speak 54.5% of the total time (see Section 3). However, Figure 3 shows that there are statistically significant deviations with respect to such an expectation. In particular, female subjects tend to display laughter and back-channel significantly more frequently than male subjects (statistically significant with confidence level α = 0.01 in both cases according to a χ2 test with Bonferroni correction). Furthermore, female subjects initiate overlapping speech significantly more frequently than male ones (statistically significant with confidence level α = 0.01 in both cases according to a χ2 test with Bonferroni correction). Gender effects for the other cues, if any, are too weak to be observed in the corpus.
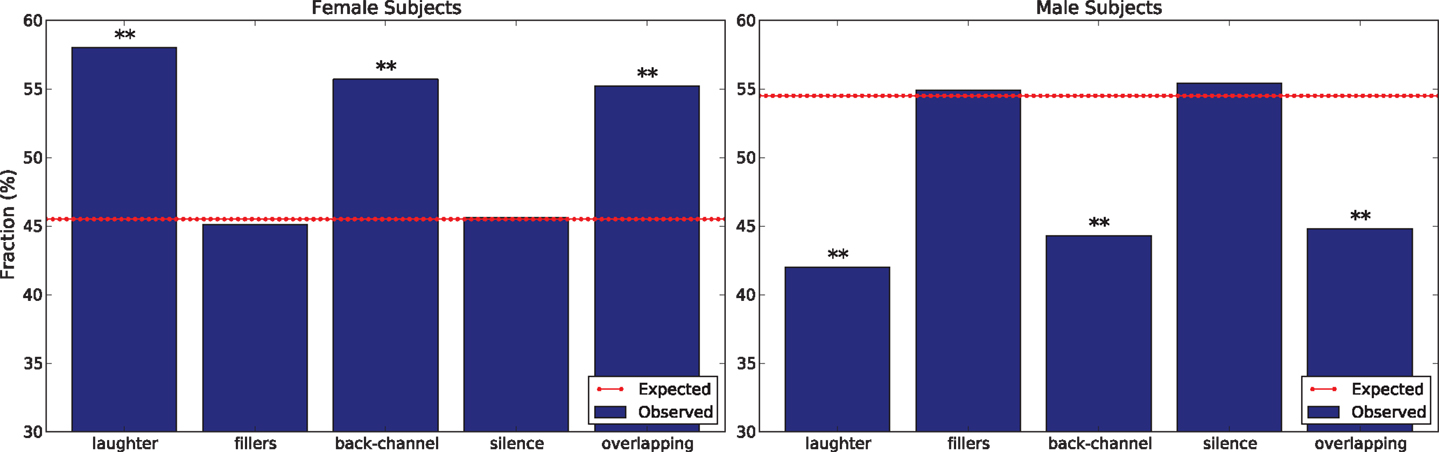
Figure 3. The charts show gender differences in the distribution of cues’ occurrences. In particular, the left chart shows the distribution for female subjects while the right one shows it for male ones. The double asterisk means that the deviation is statistically significant with confidence level α = 0.01 (according to a χ2 test with Bonferroni correction).
This pattern is compatible with a large body of work showing that “men and women are generally perceived as differing in status (importance, dominance, power, etc.) and also that they often feel themselves to differ in this way” (Leffler et al., 1982). In other words, even if the scenario of the corpus does not introduce a status difference between subjects and there is no status difference between male and female subjects (Polychroniou et al., 2014), males are still more likely to adopt behaviors typical of higher-status individuals, including speaking longer (see above), laughing less (Leffler et al., 1982; Provine, 1993), and showing back-channel less frequently (Hall et al., 2005). The only contradictory evidence is that female subjects tend to initiate overlapping speech significantly more often than male ones. A possible explanation is that female subjects initiate overlapping speech more often to avoid a stereotype threat, i.e., the risk to confirm negative stereotypes about a category someone belongs to Steele and Aronson (1995). In this case, female subjects might interrupt more to contradict the sterotype that depicts women are less assertive and agentic (Thompson et al., 2010).
When it comes to gender composition, the SSPNet Mobile Corpus includes 17 female-female calls (28.3% of the total time), 14 male–male calls (23.3% of the total time), and 31 female–male calls (48.4% of the total time). The average duration of female–female, male–male, and female–male calls is 595, 899, and 639 s, respectively. Therefore, male–male pairs seem to need significantly more time to complete a call (statistically significant with confidence level α = 0.01 according to a χ2 test with Bonferroni correction). In absence of further gender composition effects, non-verbal cues should distribute over the three types of call according to the same proportions indicated above, namely 28.3% (female–female), 23.3% (male–male), and 48.4% (female–male). However, the observed distribution is significantly different from the expected one for fillers and silences (statistically significant with confidence level α = 0.01 according to a χ2 test with Bonferroni correction).
A possible explanation of the latter observations is that male subjects tend to compete more to hold the floor. This can explain the higher frequency of fillers – one of the functions of such a cue is to keep the floor while planning what to say next or addressing any other communication performance problem (Hall and Knapp, 1992; Clark and Fox Tree, 2002) – as well as lower frequency of silences. Higher competition in holding the floor might contribute to explain the longer duration of male–male calls as well. In fact, competition to hold the floor is typically associated to higher levels of conflict (Smith-Lovin and Brody, 1989; Schegloff, 2000) that result into longer negotiations before reaching a consensual solution for the Winter Survival Task (see Section 4.4).
4.2. Role Effects: Calling vs Receiving
The scenario of the SSPNet Mobile Corpus does not introduce any difference between two subjects involved in the same call (Polychroniou et al., 2014). However, given that the conversations take place over the phone, one subject plays the role of the caller (the person that makes the call) while the other one plays the role of the receiver (the person that receives the call). For every pair, the two roles were assigned randomly. This section adopts the methodology of Section 3 (the variable takes the values caller and receiver) to test whether the role has any effect on the frequency of non-verbal cues.
By design, 50% of the subjects are callers while the other 50% are receivers. The former speak 49.9% of the time and the latter 50.1%. According to a χ2 test with Bonferroni correction, the difference is not significant and the effect of role on speaking time, if any, is too weak to be observed in the corpus. If the same applies to the cues under examination, 49.9% of their occurrences should be displayed by callers and the remaining 50.1% by receivers. However, Figure 4 shows that, to a statistically significant extent, callers tend to display fillers more often while receivers tend to initiate overlapping speech more frequently (statistically significant with confidence level α = 0.01 according to a χ2 test with Bonferroni correction).
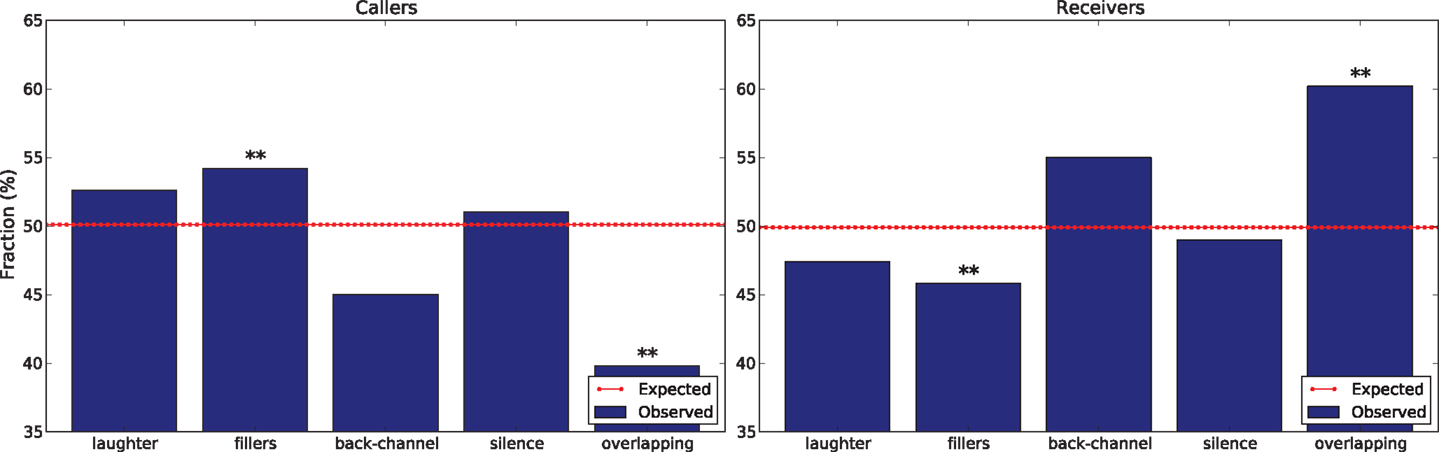
Figure 4. The charts show the effects of roles (callers on the left and receivers on the right) measured in terms of frequency of the cues under examination. The double asterisk means that the deviation is statistically significant with confidence level α = 0.01 (according to a χ2 test with Bonferroni correction).
Initiating overlapping speech is typically associated with dominance (Anderson and Leaper, 1998) and higher-status (Leffler et al., 1982). Therefore, a possible reason why receivers initiate overlapping speech significantly more frequently than callers is that they tend to be perceived, and perceive themselves, as higher-status individuals. As a possible confirmation, previous results obtained over the SSPNet Mobile Corpus (Vinciarelli et al., 2014) show that receivers persuade callers 70% of the times (statistically significant with confidence level α = 0.01 according to a χ2 test with Bonferroni correction) when there is disagreement about one item of the winter survival task (see Section 4.4): being perceived as a higher-status individual is one of the two factors that “stand out as particularly powerful determinants of a person’s ability to influence others” (Oldmeadow et al., 2003). The tendency of callers to display fillers more frequently goes in the same direction, given that “when communicating with a higher status person, the lower status person [.] has more filled and unfilled pauses than normal” (Richmond et al., 1991), where the “filled pauses” correspond to the fillers of this work. Overall, while perceived status has not been measured and the corpus scenario does not involve any status difference, role related effects seem to be compatible with a situation where the receiver is perceived to be higher in status.
4.3. Topic Effects
The calls of the SSPNet Mobile Corpus revolve around the winter survival task (Polychroniou et al., 2014). The two subjects involved in each call are asked to identify objects that are likely to increase the chances of survival in a polar environment (Joshi et al., 2005). The subjects spend only 90.3% of the total corpus time in addressing the task. The remaining 9.7% is dedicated to mutual introductions, small-talk, greetings, comments about the experiment, and other activities that, in general, aim at establishing a social contact between fully unacquainted subjects. This allows one to apply the methodology of Section 3 with a variable that takes the values task and social.
Figure 5 shows that laughter, silence, and overlapping speech are significantly more frequent than expected when the subjects do not address the task (statistically significant with confidence level α = 0.01 according to a χ2 test with Bonferroni correction) and vice versa for back-channel (statistically significant with confidence level α = 0.01 according to a χ2 test with Bonferroni correction).
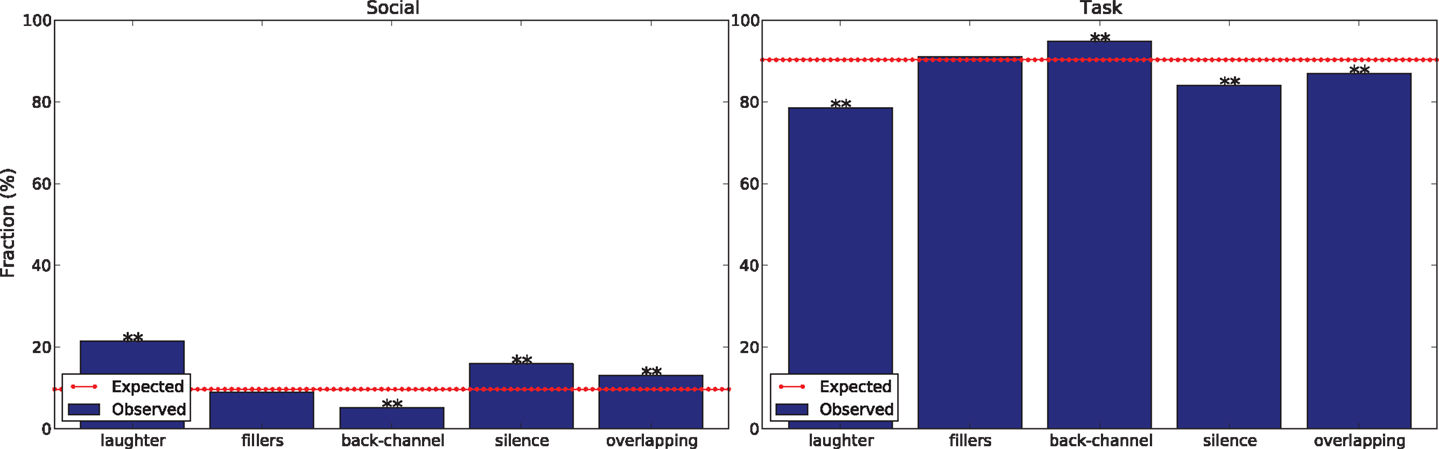
Figure 5. The charts show how the distribution of the cues changes depending on whether the subjects establish social contact (left chart) or address the winter survival task (right chart). The double asterisk means that the deviation is statistically significant with confidence level α = 0.01 (according to a χ2 test with Bonferroni correction).
In the case of laughter, a possible explanation is that the cue is “important in social discourse” (Provine and Yong, 1991). Therefore, it probably tends to appear more frequently when interactions are socially rather than task oriented. For what concerns fillers and silence, one possible explanation is that these cues can account for communication difficulties between fully unacquainted individuals speaking to one another for the first time. In particular, silences can reflect a difficulty in planning what to say next in absence of a predefined topic of conversation (Hall and Knapp, 1992). Furthermore, overlapping speech might account for lack of coordination in turn-taking (Schegloff, 2000).
4.4. Mode of Interaction Effects: Agreement vs Disagreement
Before participating in the experiment, the two subjects involved in the same call are asked to look at a list of 12 items and decide, for each of them, whether it increases the chances of survival in a polar environment or not. In this way, it is possible to know whether the two subjects agree (they have made the same decision) or disagree (they have made a different decision) about an item, given that agreement can be defined as “a relation of identity, similarity or congruence between the opinions of two or more persons” (Poggi et al., 2011). During the call, the two subjects are asked to discuss the items sequentially, one at a time, and to reach a consensual decision for each of them. As a result, the corpus can be segmented into 720 discussions (12 items × 60 calls) about individual items and, for each discussion, it is possible to know whether the subjects agree or disagree. This allows one to adopt te methodology of Section 3 to test whether the mode of interaction has an effect on the frequency of non-verbal cues. The variable used to segment the corpus takes the values agreement and disagreement.
Disagreement is less frequent than agreement (283 out discussion of the total 720), but it accounts for 61.7% of the total time spent on the task in the corpus. The reason is that it takes more time to reach a consensual decision when the subjects have different opinions about a given item. If the mode of interaction has no effect, 61.7% of a cue’s occurrences (within statistical fluctuations) should be displayed during disagreement discussions. Figure 6 shows how the occurrences distribute over agreement and disagreement. The observed distribution is statistically significantly different from the expected one for silence and overlapping speech (statistically significant with confidence level α = 0.01 according to a χ2 test with Bonferroni correction).
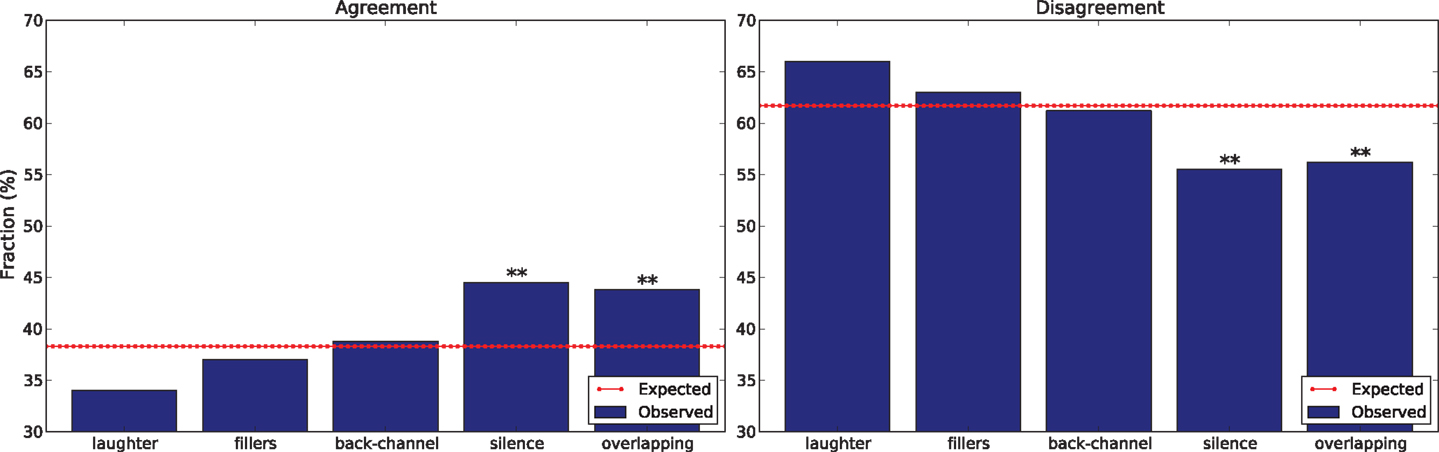
Figure 6. The charts show the percentage of total cues’ occurrences displayed during agreement and disagreement, respectively. The double asterisk means that the deviation is statistically significant (statistically significant with confidence level α = 0.01 according to a χ2 test with Bonferroni correction).
In the case of silences, the lower frequency during disagreement can have at least two possible reasons. The first is that people tend to react immediately to interlocutors they disagree with Bilmes (1988), thus reducing, if not eliminating, the latency time in responding. The second is that conversation participants tend to hold the floor during competitive interactions (Smith-Lovin and Brody, 1989) and, therefore, the chances of observing silence are reduced. The lower frequency of overlapping speech seems to contradict previous observations showing that the cue is associated with competitive interactions (Smith-Lovin and Brody, 1989; Schegloff, 2000). However, it should be noted that the conversations take place over mobile phones and people cannot hear one another when they speak simultaneously more than a few hundreds of second. The need of mutual monitoring while negotiating a common solution to the task might therefore lead people to reduce overlapping (McGinn and Croson, 2004).
4.5. Personality Effects
Every subject of the SSPNet Mobile Corpus has filled the Big-Five Inventory 10 (Rammstedt and John, 2007), a questionnaire aimed at assessing personality in terms of the Big-Five traits (Saucier and Goldberg, 1996): Openness (tendency to be intellectually curious, to have wide interests, etc.), Conscientiousness (tendency to be planful, reliable, thorough, etc.), Extraversion (tendency to be assertive, energetic, outgoing, etc.), Agreeableness (tendency to be kind, sympathetic, generous, etc.), and Neuroticism (tendency to be anxious, self-pitying, touchy, etc.). The questionnaire allows one to calculate five integer scores that measure how well an individual fits the tendencies associated to the Big-Five traits.
The scores range in the interval [−4, 4] and, for each trait, it is possible to define a variable V that has value low when the score is in the interval [−4, −2], middle when it is in [−1, 1], and high when it is in (Andre, 2013; Bonin et al., 2014). This allows one to apply the methodology of Section 3. Figure 7 shows the deviations of the observed frequencies with respect to the expected ones. In particular, the size of a circle is proportional to the ratio (O − E)/E, where O is the number of times a cue actually occurs and E is the number of times the cue is expected to occur. The circle is blue when O > E and red otherwise. The stars are plotted in correspondence of deviations statistically significant with confidence level α = 0.01 according to a χ2 test with Bonferroni correction.
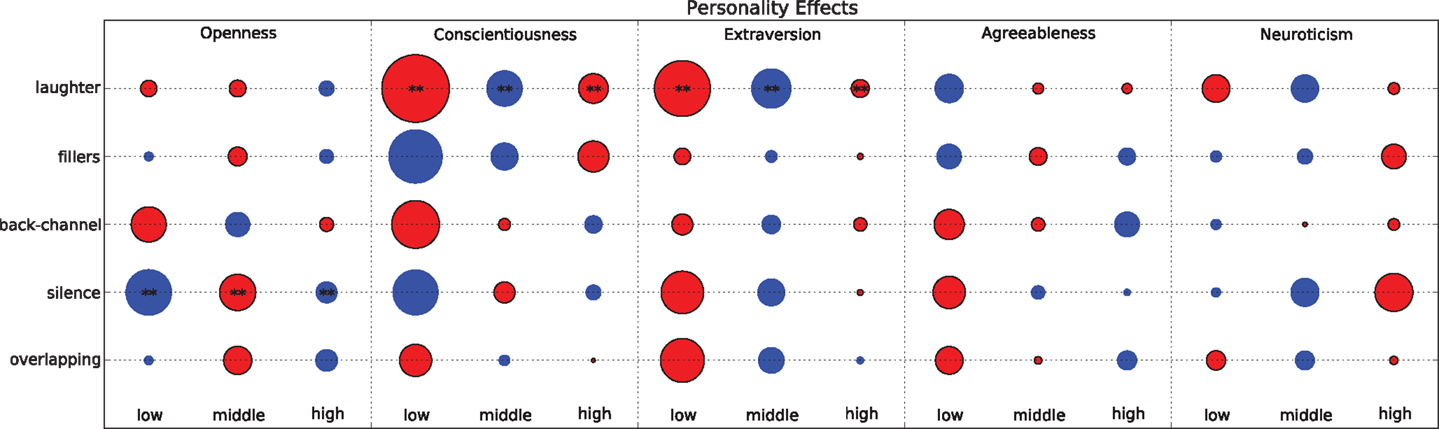
Figure 7. The bubble plot shows the deviation of the observed distribution of the cues with respect to the expected ones as a function of the personality traits. The larger the bubble, the larger the deviation. When the bubble is red, the deviation is negative (less occurrences than expected), when the bubble is blue the deviation is positive (more occurrences than expected). The double asterisk means that the deviation is statistically significant with confidence level α = 0.01 (according to a χ2 test with Bonferroni correction).
In the case of laughter, there are statistically significant deviations for extraversion and conscientiousness (statistically significant with confidence level α = 0.01 according to a χ2 test with Bonferroni correction). Previous findings suggest that “the tendency to laugh is a characteristic of the extraverted person, albeit the empirical basis for this assertion is somewhat meager” (Ruch and Deckers, 1993). The observations of the corpus seem to be coherent with such an indication and, in particular, show that subjects scoring low in extraversion laugh significantly less often than the others (one of the largest deviations in Figure 7). However, the deviation is negative in the case of subjects scoring high as well and only people scoring middle appear to laugh significantly more than expected. In this respect, the observations of the corpus confirm that the evidence of an association between laughter and Extraversion is “meager.” Similar considerations apply to conscientiousness, with the subjects scoring middle that laugh more frequently than the others to a statistically significant extent. A possible explanation is that the subjects scoring low do not feel comfortable and/or motivated in addressing the task and, therefore, tend to laugh less. At the opposite extreme, subjects scoring high tend to remain concentrated on the task and, in line with the findings of Section 4.3, reduce the laughter frequency.
Figure 7 shows that subjects scoring low and high in Openness tend to initiate silences more frequently than expected to a statistically significant extent. To the best of our knowledge, the literature does not provide indications that can help to explain or interpret such an observation.
Overall, the results suggest that scenario and setting adopted for the corpus induce low “Relevance (i.e., the environment must allow the person to express the trait) and Availability (i.e., the trait must be perceptible to others” (Wright, 2014). In other words, it appears that addressing the winter survival task over the phone does not let the traits emerge with evidence, at least through the lens of the non-verbal cues analyzed in this work.
4.6. Conflict Handling Style Effects
All subjects of the SSPNet Mobile Corpus have filled the Rahim Organizational Conflict Inventory II (Rahim, 1983), a questionnaire aimed at measuring the attitude toward conflict and disagreement in terms of five dimensions: Compromising (tendency to find solutions where all parties loose something to reach mutually acceptable solutions), Avoiding (tendency to withdraw and sidestep rather than finding solutions), Obliging (tendency to focus on commonalities to satisfy the concerns of other parties), Dominating (tendency to look for win–lose solutions), and Integrating (tendency to look for solutions acceptable to all parties). The questionnaire allows one to calculate five integer scores that measure how well an individual fits the tendencies associated to the five conflict handling styles above.
The scores range in the interval [−14, 14] and, for each trait, it is possible to define a variable V that has value low when the score is in the interval [−14, −5], middle when it is in [−4, 4], and high when it is in (Clark and Fox Tree, 2002; Kim et al., 2014). This allows one to apply the methodology of Section 3. Figure 8 shows the deviations of the observed frequencies with respect to the expected ones (see Section 4.5 for more details on how deviations are calculated). The number of statistically significant deviations is higher than in the case of personality (see Figure 8). The probable reason is that the scenario adopted in the corpus (Polychroniou et al., 2014; Vinciarelli et al., 2014) lets the conflict handling style to emerge more clearly than the personality traits.
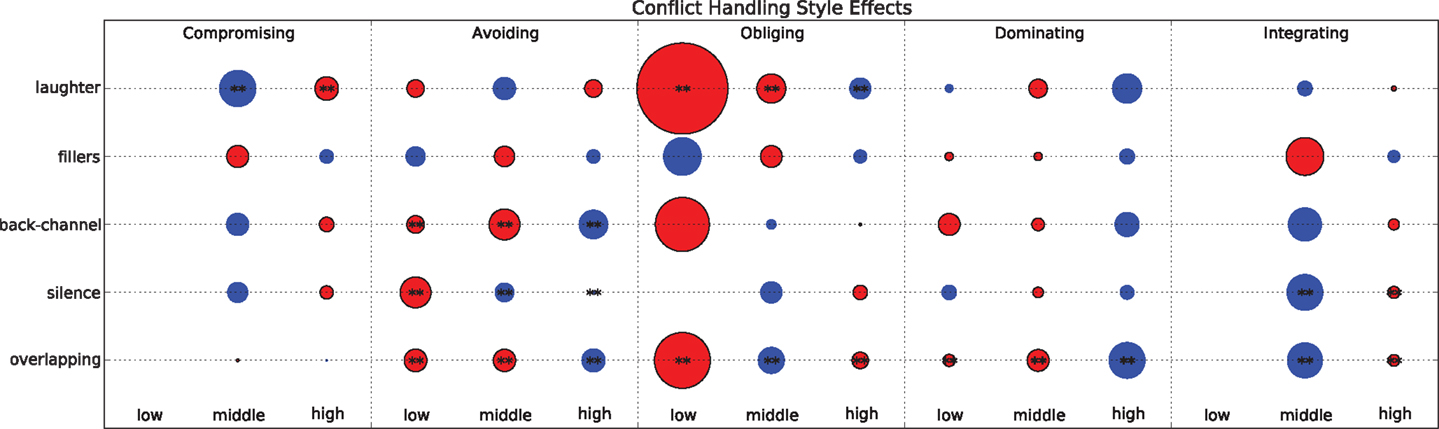
Figure 8. The bubble plot shows how the observed frequency of non-verbal cues deviates from the expected one according to the conflict handling style of individuals. When the bubble is red, the deviation is negative (less occurrences than expected), when the bubble is blue the deviation is positive (more occurrences than expected). The double asterisk means that the deviation is statistically significant with α = 0.01 (according to a χ2 test with Bonferroni correction).
In the case of laughter, Figure 8 shows that people scoring low and middle along the Obliging style tend to laugh significantly less than expected. To the best of our knowledge, the literature does not provide indications that can explain such an observation. However, it has been shown that individuals that score lower along the Obliging style tend to show less empathy and lower social skills (Rahim et al., 2002). This might result into lower tendency to laugh as well given the highly pro-social value of such a cue (Provine and Yong, 1991; Provine, 1993). Similar explanations can apply to the tendency of subjects scoring high along the Compromising dimension to laugh more than expected. In fact, people with such a style tend to show concern for the others and, therefore, tend to adopt pro-social behaviors like laughter (Rahim et al., 2002).
Subjects that score low and middle along the avoiding style tend to display back-channel less frequently than expected while those scoring high tend to display it more frequently than expected. A possible explanation is that one of the main functions of back-channel is to encourage others to hold the floor and continue speaking (Richmond et al., 1991; Hall and Knapp, 1992). Such a type of behavior is compatible with the tendencies associated to the avoiding style, namely to sidestep, to leave others to address the problems, etc. In a similar vein, Figure 8 shows that people that score middle and high in Avoiding tend to initiate silences more frequently than expected (the effect size is small, but statistically significant). In this case as well, the cue appears to be compatible with the tendencies associated to the conflict handling style.
The same tendency to initiate silence more frequently than expected can be observed for people scoring middle along the Integrating style. Given that the main tendency associated to this way of handling conflict is to find solutions acceptable to all parties, higher frequency of silence might correspond to the tendency to leave others talk and express their points of view (Rahim et al., 2002). In this sense, the observations of Figure 8 seem to be compatible with the attitude the Integrating style accounts for.
In the case of overlapping speech, significant effects can be observed for all styles except Compromising. This is not surprising because the cue has been extensively shown to be associated with conflict, both in human sciences (Smith-Lovin and Brody, 1989; Schegloff, 2000) and computing (Grezes et al., 2013; Kim et al., 2014). The overall pattern of association (see Figure 8) suggests that the subjects that tend to satisfy concerns for others tend to initiate overlapping less frequently than expected (subjects that score low and middle in Dominating or high in Integrating and Obliging), while those that tend to privilege concerns for the self tend to initiate overlapping more frequently than expected (high in Dominating or middle in Obliging and Integrating). Not surprisingly, such a pattern does not apply to Avoiding because such a handling style accounts for attitudes that do not privilege neither concerns for the self nor concerns for the other.
5. Conclusion
The article has presented a detailed analysis of the temporal distribution of non-verbal cues (laughter, fillers, back-channel, silence, and overlapping speech) in the SSPNet Mobile Corpus, a collection of 60 phone calls between unacquainted individuals (120 subjects in total). In particular, the analysis shows how the frequency changes according to six factors expected to account for the relational context, namely gender, role, topic of conversation, mode of interaction, personality, and conflict handling style of the interactants.
The results show that the non-verbal cues do not distribute uniformly over time, but appear more or less frequently according to one or more of the abovementioned factors. In particular, male subjects and people playing the role of receiver appear to display more frequently non-verbal cues associated to dominance and/or higher social status. This happens even if the scenario adopted in the corpus does not introduce any status or power difference between the two subjects involved in the same call. In the case of gender, this is coherent with previous results showing that people tend to perceive male subjects as higher in status (see Section 4.1). To the best of our knowledge, this is the first time that a similar effect is observed for callers and receivers.
In the case of conflict handling style, non-verbal cues appear to change frequency according to the tendencies associated to the various styles while, in the case of personality, statistically significant deviations with respect to the expected distributions take place only in a limited number of cases. This is not surprising given that the scenario of the corpus includes negotiation and disagreement aspects that allow the conflict handling styles to emerge more clearly in terms of behavioral cues. This finds confirmation in the changes observed when the relational context factor accounts for the mode of interaction (agreement vs disagreement). Finally, several cues change of frequency to a statistically significant extent depending on whether the subjects are addressing the task at the core of the scenario or not. In this case as well, the observations are compatible with previous work in the literature.
Overall, the findings suggest that the subjects manage to convey the same socially relevant information as in face-to-face encounters even if they have to constrain their expressiveness through the phone. In other words, the lack of visual feedback is not an obstacle toward manifesting dominance, power differences, and/or social verticality and reproduce, to a substantial extent, the patterns observed in the cases where the WST or other negotiation tasks are addressed in co-located settings. At the same time, the use of the phones appears to introduce at least one specific bias, i.e., the tendency to associate the role of receiver with behaviors typical of dominance and higher status. Such a finding might depend on the particular scenario adopted in the corpus, but still shows that communication technologies can actually influence human–human communication and are not a mere passive channel.
From a technological point of view, the main interest of the findings above is that social and psychological phenomena that cannot be observed and accessed directly can still be inferred from physical traces – the non-verbal cues and their frequency – that can be sensed and detected automatically. In this respect, the analysis presented in this work provides a solid ground for domains like social signal processing (Vinciarelli et al., 2012), computational paralinguistics (Schuller and Batliner, 2013), or human–media interaction (Nijholt, 2014) that aim at making machines socially intelligent, i.e., capable to understand social interactions in the same terms as humans do. In particular, the observations suggest that it is possible to develop automatic approaches for the inference of the factors the cues account for (e.g., mode of interaction, topic of conversation, conflict handling style, etc.). However, while the inference of certain factors can be expected to achieve satisfactory performance because the number of statistically significant effects is high (e.g., the conflict handling style), the inference of other factors might be difficult or not possible because the corresponding physical traces are too weak (e.g., the personality traits), at least for what concerns the cues analyzed in this work.
The development of the approaches above will contribute to further improve the state-of-the-art of conversational technologies (Renals et al., 2014). These include, e.g., the analysis of agent–customer interactions at call centers1 with the goal of improving the quality of services (Galanis et al., 2013), the development of dialog systems capable to interact naturally with human users (Keizer et al., 2014), the improvement of tutoring systems aimed at supporting students in collective learning processes (Scherer et al., 2012), the creation of speech synthesizers2 that convey both verbal and non-verbal aspects of a text (Schroeder, 2009), the enrichment of multimedia indexing systems with social and affective information (Andre, 2013), etc.
In light of the above, the continuation of this work can take two parallel, but intertwined directions. The first is the development of automatic approaches that perform the tasks mentioned above. The second is the analysis of interaction effects between multiple factors. The findings described above focus on individual factors because this makes it possible to observe larger number of events and, hence, to collect more reliable statistics. However, the analysis of interaction effects can show further, more subtle effects like, e.g., possible changes in the frequency of certain cues for subjects that have the same gender but different conflict handling styles. This, in turn, can help to further enhance the performance of automatic systems that aim at inferring the relational factors from the frequency of the cues analyzed in this study.
Conflict of Interest Statement
The authors declare that the research was conducted in the absence of any commercial or financial relationships that could be construed as a potential conflict of interest.
Acknowledgments
The authors are indebted with Dr. Anna Polychroniou and Dr. Hugues Salamin for their invaluable contribution to the SSPNet Mobile Corpus. Funding: This work was possible thanks to the support of the European Commission (SSPNet, Grant Agreement 231287), of the Swiss National Science Foundation (National Centre of Competence in Research IM2) and the Finnish Ministry for Technological Innovation (TEKES).
Footnotes
- ^See http://www.cogitocorp.com for a company working on the analysis of call centre conversations.
- ^See http://www.cereproc.com for a company active in the field.
References
Anderson, K., and Leaper, C. (1998). Meta-analyses of gender effects on conversational interruption: who, what, when, where, and how. Sex Roles 39, 225–252. doi: 10.1023/A:1018802521676
Andre, E. (2013). Exploiting unconscious user signals in multimodal human-computer interaction. ACM Trans. Multimed. Comput. Commun. Appl. 9, 48. doi:10.1145/2502433
Bilmes, J. (1988). The concept of preference in conversation analysis. Lang. Soc. 17, 161–181. doi:10.1017/S0047404500012744
Bonin, F., Campbell, N., and Vogel, C. (2014). Time for laughter. Knowl. Based Syst. 71, 15–24. doi:10.1016/j.knosys.2014.04.031
Clark, H. H., and Fox Tree, J. E. (2002). Using “uh” and “um” in spontaneous speaking. Cognition 84, 73–111. doi:10.1016/S0010-0277(02)00017-3
Pubmed Abstract | Pubmed Full Text | CrossRef Full Text | Google Scholar
Galanis, D., Karabetsos, S., Koutsombogera, M., Papageorgiou, H., Esposito, A., and Riviello, M.-T. (2013). “Classification of emotional speech units in call centre interactions,” in Proceedings of IEEE International Conference on Cognitive Infocommunications (Budapest: IEEE), 403–406.
Grezes, F., Richards, J., and Rosenberg, A. (2013). “Let me finish: automatic conflict detection using speaker overlap,” in Proceedings of Interspeech. Lyon.
Hall, J., and Knapp, M. (1992). Nonverbal Communication in Human Interaction. San Diego: Harcourt Brace College Publishers.
Hall, J. A., Coats, E., and Smith LeBeau, L. (2005). Nonverbal behavior and the vertical dimension of social relations: a meta-analysis. Psychol. Bull. 131, 898–924. doi:10.1037/0033-2909.131.6.898
Pubmed Abstract | Pubmed Full Text | CrossRef Full Text | Google Scholar
Hecht, M., De Vito, J., and Guerrero, L. (1999). “Perspectives on nonverbal communication: codes, functions, and contexts,” in The Nonverbal Communication Reader, eds M. Hecht, J. De Vito, and L. Guerrero (Long Grove: Waveland Press), 3–18.
Jaworski, A. (1999). “The power of silence in communication,” in The Nonverbal Communication Reader, eds L. Guerrero, J. De Vito, and M. Hecht (Long Grove: Waveland Press), 156–162.
Joshi, M., Davis, E., Kathuria, R., and Weidner, C. (2005). Experiential learning process: exploring teaching and learning of strategic management framework through the winter survival exercise. J. Manag. Educ. 29, 672–695. doi:10.1177/1052562904271198
Keizer, S., Foster, M., Wang, Z., and Lemon, O. (2014). Machine learning for social multi-party human-robot interaction. ACM Trans. Int. Interact. Syst. 4, 14. doi:10.1145/2600021
Kim, S., Filippone, M., Valente, F., and Vinciarelli, A. (2014). Predicting continuous conflict perception with Bayesian Gaussian processes. IEEE Trans. Affect. Comput. 5, 187–200. doi:10.1109/TAFFC.2014.2324564
Leffler, A., Gillespie, D., and Conaty, J. (1982). The effects of status differentiation on nonverbal behavior. Soc. Psychol. Q. 45, 153–161. doi:10.2307/3033648
McCrae, R. (2009). “The five-factor model of personality,” in The Cambridge Handbook of Personality Psychology, eds P. Corr and G. Matthews (Cambridge: Cambridge University Press), 148–161.
McGinn, K., and Croson, R. (2004). “What do communication media mean for negotiations? A question of social awareness,” in The Handbook of Negotiation and Culture, eds M. Gelfand and J. Brett (Redwood City: Stanford University Press), 334–339.
Nakagawa, S. (2004). A farewell to Bonferroni: the problems of low statistical power and publication bias. Behav. Ecol. 15, 1044–1045. doi:10.1093/beheco/arh107
Nijholt, A. (2014). Breaking fresh ground in human-media interaction research. Front. ICT 1:4. doi:10.3389/fict.2014.00004
Oldmeadow, J. A., Platow, M. J., Foddy, M., and Anderson, D. (2003). Self-categorization, status, and social influence. Soc. Psychol. Q. 66, 138–152. doi:10.2307/1519844
Pubmed Abstract | Pubmed Full Text | CrossRef Full Text | Google Scholar
Poggi, I., D’Errico, F., and Vincze, L. (2011). Agreement and its multimodal communication in debates: a qualitative analysis. Cognit. Comput. 3, 466–479. doi:10.1007/s12559-010-9068-x
Polychroniou, A., Salamin, H., and Vinciarelli, A. (2014). “The SSPNet mobile corpus: social signal processing over mobile phones,” in Proceedings Language Resources and Evaluation Conference (Reykjavik: ELRA), 1492–1498.
Provine, R. (1993). Laughter punctuates speech: linguistic, social and gender context of laughter. Ethology 95, 291–298. doi:10.1111/j.1439-0310.1993.tb00478.x
Provine, R., and Yong, Y. (1991). Laughter: a stereotyped human vocalization. Ethology 89, 115–124. doi:10.1111/j.1439-0310.1991.tb00298.x
Rahim, M. (1983). A measure of styles of handling interpersonal conflict. Acad. Manag. J. 26, 368–376. doi:10.2307/255985
Rahim, M., Psenicka, C., Polychroniou, P., Zhao, J., Yu, C., Chan, K., et al. (2002). A model of emotional intelligence and conflict management strategies: a study in seven countries. Int. J. Organ. Anal. 10, 302–326. doi:10.1108/eb028955
Rammstedt, B., and John, O. (2007). Measuring personality in one minute or less: a 10-item short version of the big five inventory in English and German. J. Res. Pers. 41, 203–212. doi:10.1016/j.jrp.2006.02.001
Renals, S., Carletta, J., Edwards, K., Bourlard, H., Garner, P., Popescu-Belis, A., et al. (2014). “ROCKIT: roadmap for conversational interaction technologies,” in Proceedings of the Workshop on Roadmapping the Future of Multimodal Interaction Research Including Business Opportunities and Challenges (Istanbul: ACM), 39–42.
Richmond, V., McCroskey, J., and Payne, S. (1991). Nonverbal Behavior in Interpersonal Relations. Upper Saddle River: Prentice Hall.
Ruch, W., and Deckers, L. (1993). Do extraverts like to laugh?: an analysis of the situational humor response questionnaire (SHRQ). Eur. J. Pers. 7, 211–220. doi:10.1002/per.2410070402
Saucier, G., and Goldberg, L. (1996). “The language of personality: lexical perspectives on the five-factor model,” in The Five-Factor Model of Personality, ed. J. Wiggins (New York: Guilford Press), 21–50.
Schegloff, E. (2000). Overlapping talk and the organization of turn-taking for conversation. Lang. Soc. 29, 1–63. doi:10.1017/S0047404500001019
Scherer, S., Weibel, N., Morency, L., and Oviatt, S. (2012). “Multimodal prediction of expertise and leadership in learning groups,” in Proceedings of the International Workshop on Multimodal Learning Analytics. Santa Monica.
Schroeder, M. (2009). “Expressive speech synthesis: past, present, and possible futures,” in Affective Information Processing, eds T. Tan and J. Tao (London: Springer), 111–126.
Schuller, B., and Batliner, A. (2013). Computational Paralinguistics: Emotion, Affect and Personality in Speech and Language Processing. New York: John Wiley & Sons.
Smith-Lovin, L., and Brody, C. (1989). Interruptions in group discussions: the effects of gender and group composition. Am. Sociol. Rev. 54, 424–435. doi:10.2307/2095614
Steele, C., and Aronson, J. (1995). Stereotype threat and the intellectual test performance of African Americans. J. Pers. Soc. Psychol. 69, 797–811. doi:10.1037/0022-3514.69.5.797
Pubmed Abstract | Pubmed Full Text | CrossRef Full Text | Google Scholar
Thompson, L., Wang, J., and Gunia, B. (2010). Negotiation. Annu. Rev. Psychol. 61, 491–515. doi:10.1146/annurev.psych.093008.100458
Pubmed Abstract | Pubmed Full Text | CrossRef Full Text | Google Scholar
Vinciarelli, A., Pantic, M., Heylen, D., Pelachaud, C., Poggi, I., D’Errico, F., et al. (2012). Bridging the gap between social animal and unsocial machine: a survey of social signal processing. IEEE Trans. Affect. Comput. 3, 69–87. doi:10.1109/T-AFFC.2011.27
Vinciarelli, A., Salamin, H., and Polychroniou, A. (2014). Negotiating over mobile phones: calling or being called can make the difference. Cognit. Comput. 6, 677–688. doi:10.1007/s12559-014-9267-y
Ward, N., and Tsukahara, W. (2000). Prosodic features which cue back-channel responses in English and Japanese. J. Pragmat. 32, 1177–1207. doi:10.1016/S0378-2166(99)00109-5
Keywords: non-verbal behavior, social signals, laughter, back-channel, fillers, pauses, overlapping speech, corpus analysis
Citation: Vinciarelli A, Chatziioannou P and Esposito A (2015) When the words are not everything: the use of laughter, fillers, back-channel, silence, and overlapping speech in phone calls. Front. ICT 2:4. doi: 10.3389/fict.2015.00004
Received: 10 December 2014; Accepted: 19 February 2015;
Published online: 10 March 2015.
Edited by:
Javier Jaen, Universitat Politecnica de Valencia, SpainReviewed by:
Rob Gray, Arizona State University, USAAlejandro Catala, Universitat Politecnica de Valencia, Spain
Copyright: © 2015 Vinciarelli, Chatziioannou and Esposito. This is an open-access article distributed under the terms of the Creative Commons Attribution License (CC BY). The use, distribution or reproduction in other forums is permitted, provided the original author(s) or licensor are credited and that the original publication in this journal is cited, in accordance with accepted academic practice. No use, distribution or reproduction is permitted which does not comply with these terms.
*Correspondence: Alessandro Vinciarelli, School of Computing Science, University of Glasgow, Sir A. Williams Building, Glasgow G12 8QQ, UK e-mail: vincia@dcs.gla.ac.uk