Objective methods for reliable detection of concealed depression
 Cynthia Solomon
 Michel F. Valstar
 Richard K. Morriss
 John Crowe
- 1Faculty of Engineering, University of Nottingham, Nottingham, UK
- 2School of Computer Science, University of Nottingham, Nottingham, UK
- 3Institute of Mental Health, University of Nottingham, Nottingham, UK
Recent research has shown that it is possible to automatically detect clinical depression from audio-visual recordings. Before considering integration in a clinical pathway, a key question that must be asked is whether such systems can be easily fooled. This work explores the potential of acoustic features to detect clinical depression in adults both when acting normally and when asked to conceal their depression. Nine adults diagnosed with mild to moderate depression as per the Beck Depression Inventory (BDI-II) and Patient Health Questionnaire (PHQ, Chang, 2012) were asked a series of questions and to read a excerpt from a novel aloud under two different experimental conditions. In one, participants were asked to act naturally and in the other, to suppress anything that they felt would be indicative of their depression. Acoustic features were then extracted from this data and analyzed using paired t-tests to determine any statistically significant differences between healthy and depressed participants. Most features that were found to be significantly different during normal behavior remained so during concealed behavior. In leave-one-subject-out automatic classification studies of the 9 depressed subjects and 8 matched healthy controls, an 88% classification accuracy and 89% sensitivity was achieved. Results remained relatively robust during concealed behavior, with classifiers trained on only non-concealed data achieving 81% detection accuracy and 75% sensitivity when tested on concealed data. These results indicate there is good potential to build deception-proof automatic depression monitoring systems.
1. Introduction
Mental health disorders have a devastating impact on an individual’s health and happiness. Worldwide, it is estimated that four of the ten leading causes of disability for persons aged five and older are mental disorders (US Department of Health and Human Services, 1999). Among developed nations, major depression is the leading cause of disability: according to European Union Green Papers dating from 2005 (Health and Consumer Protection Directorate General, 2005) to 2008 (Health and Consumer Protection Directorate General, 2008), mental health problems affect one in four citizens at some point during their lives. As opposed to many other illnesses, mental ill health often affects people of working age, causing significant losses and burdens to the economic system, as well as the social, educational, and justice systems. The economic burden of these illnesses exceeds $300 billion in the US alone (Insel, 2008). Despite these facts, the societal and self-stigma surrounding mental health disorders have remained pervasive, and the assessment, diagnosis, and management of these starkly contrasts with the numerous technological innovations in other fields of healthcare.
Objective methods are necessary to improve current diagnostic practice since clinical standards for diagnosis are subjective, inconsistent, and imprecise. To overcome this, researchers have started to focus on known physical cues (biomarkers) that correlate with depression, such as stress levels (Sano and Picard, 2013), head movements (Altorfer et al., 2000; Leask et al., 2013), psychomotor symptoms (Lemke and Hesse, 1998), and facial expressions (Valstar et al., 2014). Recent advances in affective computing and social signal processing promise to deliver some of these objective measurements.
Affective computing is the science of creating emotionally aware technology, including automatically analyzing affect and expressive behavior (Picard, 1997). By their very definition, mood disorders are directly related to affective state and therefore affective computing promises to be a good approach to depression analysis. Social signal processing addresses all verbal and non-verbal communicative signaling during social interactions, be they of an affective nature or not (Vinciarelli et al., 2012). Depression has been shown to correlate with the breakdown of normal social interaction, resulting in observations such as dampened facial expressive responses, avoiding eye contact, and using short sentences with flat intonation.
Although the assessment of behavior is a central component of mental health practice, it is severely constrained by individual subjective observation and lack of any real-time naturalistic measurements. It is thus only logical that researchers in affective computing and social signal processing, which aim to quantify aspects of expressive behavior such as facial muscle activations and speech rate, have started looking at ways in which their communities can help mental health practitioners. This is the fundamental promise of the newly defined research field of behaviomedics (Valstar, 2014), which aims to apply automatic analysis and synthesis of affective and social signals to aid objective diagnosis, monitoring, and treatment of medical conditions that alter one’s affective and socially expressive behavior.
For depression, recent challenges organized to measure severity of depression on a benchmark database have shown relatively impressive success in automatically assessing the severity of depression (Valstar et al., 2013, 2014). The winner of the 2014 challenge, a team from the MIT-Lincoln Lab (Williamson et al., 2014), attained an average error of 6.31 on a severity of depression score ranging between 0 and 43, indicating that even the first approaches in this direction have significant predictive value.
However, previous research has also indicated that identifying reliable indicators of depression is non-trivial. Symptoms of depression can vary greatly both within and between individuals. Moreover, people naturally modify their behavior to adapt to their social environment. This may involve hiding the true extent of someone’s feelings. While altering the social presentation of emotion may be a part of everyday life, this can be especially problematic for people with depression, particularly since people are often hesitant to ask for help given the societal stigma of mental illness, which further decreases the probability of accurate diagnosis. With the promise of behaviomedical tools to automatically screen for or even diagnose depression, a serious question that needs to be addressed is: how easy is it to fool such automatic systems?
We conducted an experiment where participants were asked to perform two tasks: read a section of a popular book, and answer a question regarding their current emotional state. This experiment was repeated by participants who were known to suffer from major depressive disorder. After the first time, participants were given a brief explanation of how an automated depression analysis system might detect depression from their voice, and participants were asked to modify their behavior so to avoid being detected as depressed. However, it turns out that while the participants did try to conceal their depression, this was not successful and our automatic depression recognition system performed almost as well as on the non-concealed data.
The research we report on in this work contains two major contributions: firstly, we show that with as little as two audio features and a simple Naive Bayes classifier we can accurately discriminate between depressed and non-depressed people with an accuracy of 82.35%. We also explore more generally which auditory features differ significantly between healthy and depressed individuals. Secondly, and perhaps more saliently, we show how these differences are impacted by an individual’s attempt to conceal their depression, and reveal for the first time experimental evidence that it may not be possible for people to conceal the cues of depression in their voice.
2. Depression
Depression is the most prevalent mental health disorder and is estimated to affect one in ten adults. Traditionally, scientific and clinical approaches classify depression based on observable changes in patient affect that are not expected reactions to loss or trauma. Although there is a wide range in both the symptoms and severity of depression, it is generally agreed upon as per the Diagnostic and Statistical Manual 4th ed. (DSM-IV)1 that to be diagnosed with major depressive disorder, a patient must exhibit five or more of the following symptoms (American Psychiatric Association, 2000):
1. Depressed mood most of the day or nearly every day.
2. Markedly diminished interest or pleasure in all or almost all activities most of the day or nearly every day.
3. Significant unintentional weight loss or gain or increase/decrease in appetite.
4. Insomnia or hypersomnia nearly every day.
5. Noticeable psychomotor agitation or retardation nearly every day.
6. Fatigue or loss of energy nearly every day.
7. Feelings of worthlessness or either excessive or inappropriate guilt nearly every day.
8. Diminished ability to think, concentrate, or make decisions nearly every day.
9. Recurrent thoughts of death, recurrent suicidal ideation without a specific plan, or a suicide attempt and specific plan.
However, depression often has a much more significant impact than just these enumerated symptoms and can affect or be affected by a variety of biological, environmental, social, or cognitive factors. Depression itself cannot be understood without taking into account the social context and environment, as nationality, ethnicity, and socio-economic status all influence the prevalence and presentation of depression (Karasz, 2005). There is also significant variation between individual experiences of depression (Lewis, 1996).
This symptom-based definition of depression makes accurate diagnosis problematic, as it is difficult to objectively measure psychological rather than physiological phenomena. Although diagnostic criteria are to some extent arbitrary, the classification itself can have a significant impact upon the recommended treatment. Additionally, depression cannot always be categorically distinguished from other mental health disorders. Depression and anxiety in particular often co-exist and exhibit similar effects on patient affect (Clark and Watson, 1991). Diagnosis requires experienced clinicians and an understanding of an individual’s history, psychological testing records, self-reporting, and assessment during clinical interviews (Yingthawornsuk, 2007). This is often a lengthy procedure, and relevant data or experts may not always be accessible.
2.1. Self-Assessment of Depression
Due to the difficulty of consistent, efficient, and accurate diagnosis, self-assessments are often used as a quick way to diagnose and monitor depression. It should be noted that whilst these methods are inherently flawed by their very nature in requiring a patient to critically and honestly assess their own behavior, they nonetheless serve as a reasonable quantifiable standard to be measured against. The two most commonly used assessments are the Beck Depression Inventory-II (BDI-II) and Patient Health Questionnaire (PHQ-9). The BDI test was created in 1961 and has been updated several times since then. The most recent version was created in 1996 and modified for better adherence to the DSM-IV criteria (Beck et al., 1961, 1996). Conversely, the PHQ-9 was created in the mid-1990s as an improvement to the lengthier Primary Care Evaluation of Mental Disorders (PRIME-MD) and expressly scores the DSM-IV criteria through self-report (Spitzer et al., 1999).
A comparison between these two assessments can be found in Table 1 (Kroenke et al., 2001; Kroenke and Spitzer, 2002; Kung et al., 2013). Numerous studies have investigated the relationship between the two tests for a range of patients with different mood disorders, backgrounds, and conditions, and have reported correlations ranging from 0.67 to 0.87 (Diez-Quevedo et al., 2001; Dum et al., 2008; Hepner et al., 2009; Furukawa, 2010; Kung et al., 2013). These tools have also been shown to correlate highly with clinician-rated depression measurements, such as the 17-item Hamilton Rating Scale for Depression (HRSD-17) (Kung et al., 2013).
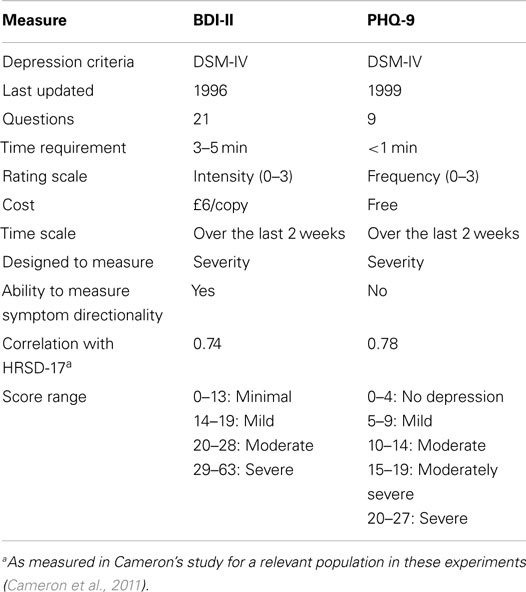
Table 1. Comparison of several characteristics of the BDI-II and PHQ-9.
Although a variety of other depression diagnostic tests exist, these two were chosen for our research, for reasons of availability and comparability. The BDI-II is used as the gold standard for measuring depression severity in the recent Audio/Visual Emotion Challenges (AVEC 2013/2014, Valstar et al., 2013, 2014). On the other hand, the PHQ-9 is a simple, efficient, and free test that is often used interchangeably with the BDI-II. Because the PHQ-9 only takes about a minute to complete, it was deemed advantageous to add as a check for reliability and to allow future researchers to freely compare their results against ours.
2.2. Emotion Regulation and Deception
In everything from normal social interactions to police investigations, people are constantly trying to discern the veracity of other’s behavior. Consequently, scientists have tried to ascertain behavioral cues that could indicate deception (DePaulo et al., 2003). However, these cues are not necessarily indicative of everyday attempts to suppress or regulate emotions and their expression. Over one’s lifetime, people learn which emotions they should feel and express in a given social context (Miller and Sperry, 1987; Harris et al., 1989). Regulating emotion is necessary for social functioning, although the extent of regulation required varies between cultures (Gross and Muñoz, 1995; Mayer and Salovey, 1995).
These implicit rules that define what is socially acceptable not only influence what people feel, but also how their feelings are perceived both personally and by others (Kirmayer, 2001). Culture can thus contribute to the pressure to deny or understate one’s feelings to be more “socially acceptable,” making diagnosis difficult. Conversely, somatic complaints have no stigma attached to them and are therefore more readily presented. A study by Kirmayer et al. (1993) demonstrated how commonly this phenomenon occurs with depression and anxiety. A majority of patients presented with exclusively somatic symptoms to their primary care physicians and only acknowledged a psychological aspect when prompted for further information. However, psychological complaints are more readily recognized and accurately diagnosed by primary care physicians. Moreover, these results were replicated in several countries, demonstrating that this suppression is persistent across numerous ethno-cultural groups (Kirmayer et al., 1993; Garcia-Campayo et al., 1998; Simon et al., 1999; Kirmayer, 2001).
3. Speech-Based Automatic Depression Detection
In previous work on automatic depression recognition, both the audio and video modalities have been used, e.g., Williamson et al. (2013) for audio and Girard et al. (2013) for video. Of the two, the audio modality has so far been the most successful, with an audio-based approach by MIT-Lincoln Lab winning the AVEC 2013 depression recognition challenge (Valstar et al., 2013; Williamson et al., 2013). While it is expected that ultimately a combination of audio and video modalities will gain the highest possible recognition rates, for simplicity we focus on audio features only in this study of concealment of depression.
3.1. Theory of Speech Production
When first trying to understand how speech is produced, it is helpful to view the human vocal apparatus as a source and filter. In voiced speech, the source is the pressure wave created from the interaction of air pushed through the larynx and the vibrating vocal cords, whereas in unvoiced speech, by definition air does not interact with the vocal cords. The vocal cords can be adjusted by controlling muscles in the larynx, although the specific geometry of the cords is speaker-dependent. When speaking, air from the lungs flows quickly enough that the cords self-oscillate, which varies the size of the glottal opening and in turn, the amount of air allowed through. The resulting glottal volume velocity ultimately defines the periodicity of speech, or fundamental frequency (Talkin, 1995). However, this frequency changes naturally when speaking through further modifications of the jaw, lips, tongue, etc. It is important to note that the actual sound produced by the larynx during phonation is not created by the vibrations themselves, but rather, by the modulated stream of air moving through the vibrating folds (see Figure 1). Understanding how speech is produced is pertinent when one considers that depression affects different aspects of motor control, which is thus reflected in articulatory changes.
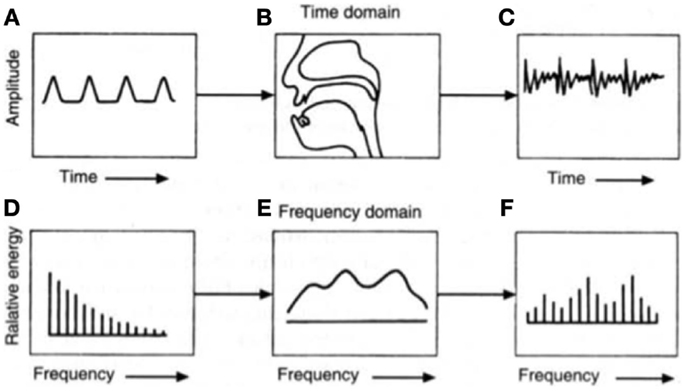
Figure 1. The source-filter theory of speech production can be traced to the glottal volume velocity, which produces (A) a glottal wave. This is then altered by (B) the shape of the vocal tract before (C) an emitted sound wave is audible. The (D) equivalent glottal spectrum can also be viewed as being affected by (E) the vocal tract transfer function to create (F) the resulting acoustic spectrum at the mouth opening. Figure taken from Chang (2012).
3.2. Related Work
Qualitative observations of depression have been well-documented, such as slower body movements, cognitive processing, and speech production, with depressed speech often described as “dead” and “listless” (Newman and Mather, 1938; Moses, 1942; Moore et al., 2004). Speech content itself changes, which can be quantified by the amount of personal references, negators, direct references, or expressions of feelings in conversation (Weintraub and Aronson, 1967; Hinchliffe et al., 1971).
In contrast, parameters derived from the recorded speech signal rather than its subject matter content have only been explored within the last 40 years, with studies often producing conflicting results. For example, some studies investigating spectral energy distributions have concluded that depression is associated with increased energy at lower frequencies (Ostwald, 1963; Tolkmitt et al., 1982) while others have found the opposite (France et al., 2000).
Other speech parameters have offered more consistent results. Fundamental frequency (F0) is one of the most widely studied parameters and has demonstrated moderate predictability of depression severity, with decreasing amplitude and variability generally indicative of higher severity (Low et al., 2010; Mundt et al., 2012; Cummins et al., 2013; Yang et al., 2013). Low et al. evaluated the resultant classification accuracy of Mel-frequency cepstral coefficients (MFCCs), energy, zero-crossing rate (ZCR), and Teager energy operators (TEO), and found a combination of MFCCs and other features most effective (Low et al., 2009a,b, 2010). Formant patterns have also been shown to reflect reduced articulatory precision due to depression (Hargreaves and Starkweather, 1964; Kuny and Stassen, 1993).
Several promising prosodic features are measures of known clinical observations. Most commonly, depressed speech is reported as quantifiably quieter, less inflected, and slower, with fewer words uttered and a lower word rate (Weintraub and Aronson, 1967). Reliable measures of this include, but are not limited to, average speech duration, total speaking time, pause duration both within speech segments and before responses, variability in pause duration, average voice level (loudness), variance of voice level across all peaks (emphasis), and variance in pitch (inflection) (Greden et al., 1981; Szabadi and Bradshaw, 1983; Cannizzaro et al., 2004; Mundt et al., 2012). Changes in these parameters can reflect temporal changes in depression severity due to treatment (Mundt et al., 2007). These results have been replicated with non-English speakers (Hardy et al., 1984).
It is important to note that experimental results generally differ if the depressed patient shows “agitated” or “retarded” symptoms. Retarded depression exhibits similar characteristics to sadness, whereas agitated depression involves a level of fear or restlessness. There is also a noticeable difference if data originate from automatic speech (counting or reading) or free speech (Alghowinem et al., 2013). The cognitive demand of free speech generally emphasizes speech abnormalities, particularly in pause time, moreover, different regions of the brain are activated during automatic and free speech (Sturim et al., 2011; Horwitz et al., 2013). Consequently, both types were used in these experiments.
4. Methodology
This work aims to not only determine audio features that differ between healthy and depressed people, but also to investigate how they change when people with depression try to conceal their true emotions. The population of interest is outlined in blue in Figure 2 below. Based on a set of optimized features, our goal was automatic depression recognition which will still be able to correctly classify a person as depressed even if they are trying to hide their depression. Healthy individuals who alter their behavior to appear depressed were not of interest in this study.
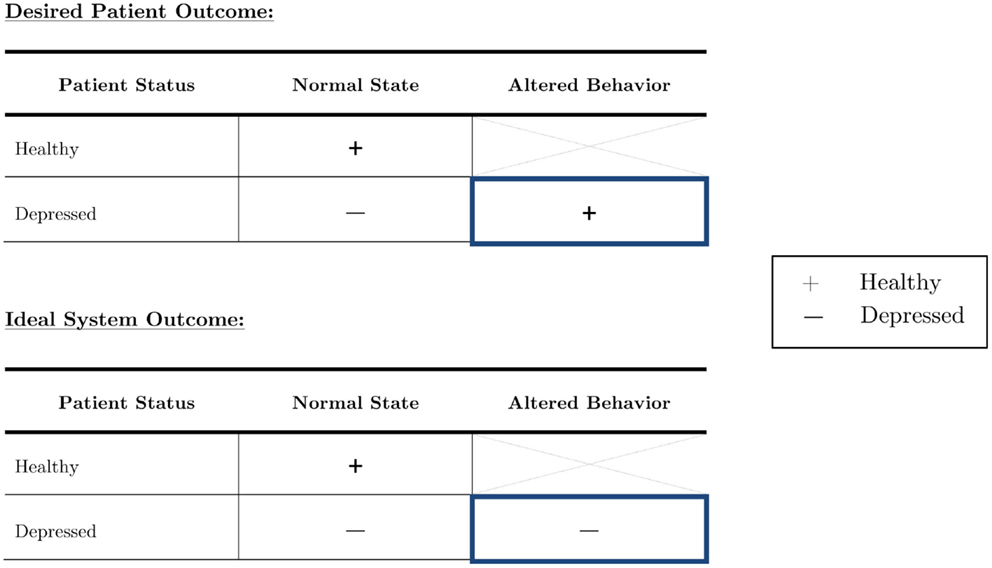
Figure 2. The depressed population can be subdivided into those who act as they feel, and those who try to outwardly suppress their symptoms. Although it is imperative to focus on both in diagnostic systems, truly robust systems should be able to accurately diagnose an individual with depression no matter the circumstance.
4.1. Data Acquisition
Participants were recruited primarily from postgraduate students at the University of Nottingham, as they were the most accessible. Advertisements were posted on social media websites, Call for Participants, and sent to a variety of different list serves. Participants self-identified as “depressed” or “healthy,” but these classifications were confirmed via PHQ-9 and BDI-II self-questionnaires. The purpose of the study was explained in full to both depressed and control participants. However, in order not to influence the participants’ behavior, the explanation did not include exactly what audio cues we were investigating as objective measures (e.g., vocal prosody, volume, etc.).
Ethics approval was obtained through the Ethics review board of the School of Computer Science at the University of Nottingham. The submission contained a consent form, information sheet, and a detailed checklist that described the experimental protocol and appropriate safeguard methods. Thirteen females (mean age 24.5 ± 3.1) and four males (mean age 25.5 ± 4.5) were recruited for this study. Of these, approximately half of both genders were classified as “healthy controls” and the other half classified as “depressed” by an initial PHQ-9 assessment and confirmed by the BDI-II. Following the questionnaire results, one participant’s classification was altered, resulting in a distribution of nine depressed and eight healthy individuals. Because this participant was either trying to conceal her depression already or simply considered herself healthy, she did not complete the same concealment task. She is referred to as the “reclassified participant” in all further discussion.
Inclusion criteria required participants to be over 18, willing to provide informed consent, and, for depressed participants, meeting the DSM-IV criteria for mild to moderate depression by either a PHQ-9 score between 5 and 15 or BDI-II score between 14 and 28. Participants were excluded if they had a pre-existing psychotic mental health disorder (bipolar disorder, depression with delusions and hallucinations, or paranoid ideation or schizophrenia or delusional disorder according to their own account), a high score on items regarding suicidal thoughts on either diagnostic test, or depression scores above the range listed previously, which would indicate moderately severe depression or higher. Medication was noted, but did not render a participant ineligible. In addition to the 17 that met the appropriate criteria, three people were deemed ineligible due to the severity of their depression.
Ideally, participants would have been ethnically and culturally uniform so as to eliminate any effects on emotion regulation, speech content, or facial expressions unrelated to depression. However, given that the available population was almost exclusively limited to postgraduate university students, of which over half are international, this was unrealistic. As a second-best alternative to a uniform population, healthy participants were recruited to match the age, gender, cultural background, and native language of each of the depressed participants. Age matching was done to the closest possible age. Some matches were exact, but for others we applied a minimum mean-square error approach. Cultural background was defined by whether a participant’s first language was English or not (in practice this meant international students vs. non-international students). In some cases, exact nationality matches could be made, but this was not possible for every participant. Smoking habits were also noted due to the damage that smoking causes to the vocal cords and larynx (Hirabayashi et al., 1990). The knowledge of who was who’s matched partner was not used in any of the statistical and machine learning analyses performed in this work.
The collection protocol of these experiments is illustrated in Figure 3. The same acquisition system, location, and interviewer were used throughout experiments to ensure a consistent, controlled environment. Eligible participants were asked two separate sets of questions. Depressed participants were instructed to act naturally when answering one set and to alter their behavior so as to hide any physical indicators of depression in the other. Healthy participants were instructed to act as naturally as possible throughout the course of the experiments. After each set of questions, participants read a one-page excerpt from the third “Harry Potter” book aloud so as to have a standard phonetic content for comparison. The order of the question sets was randomized.
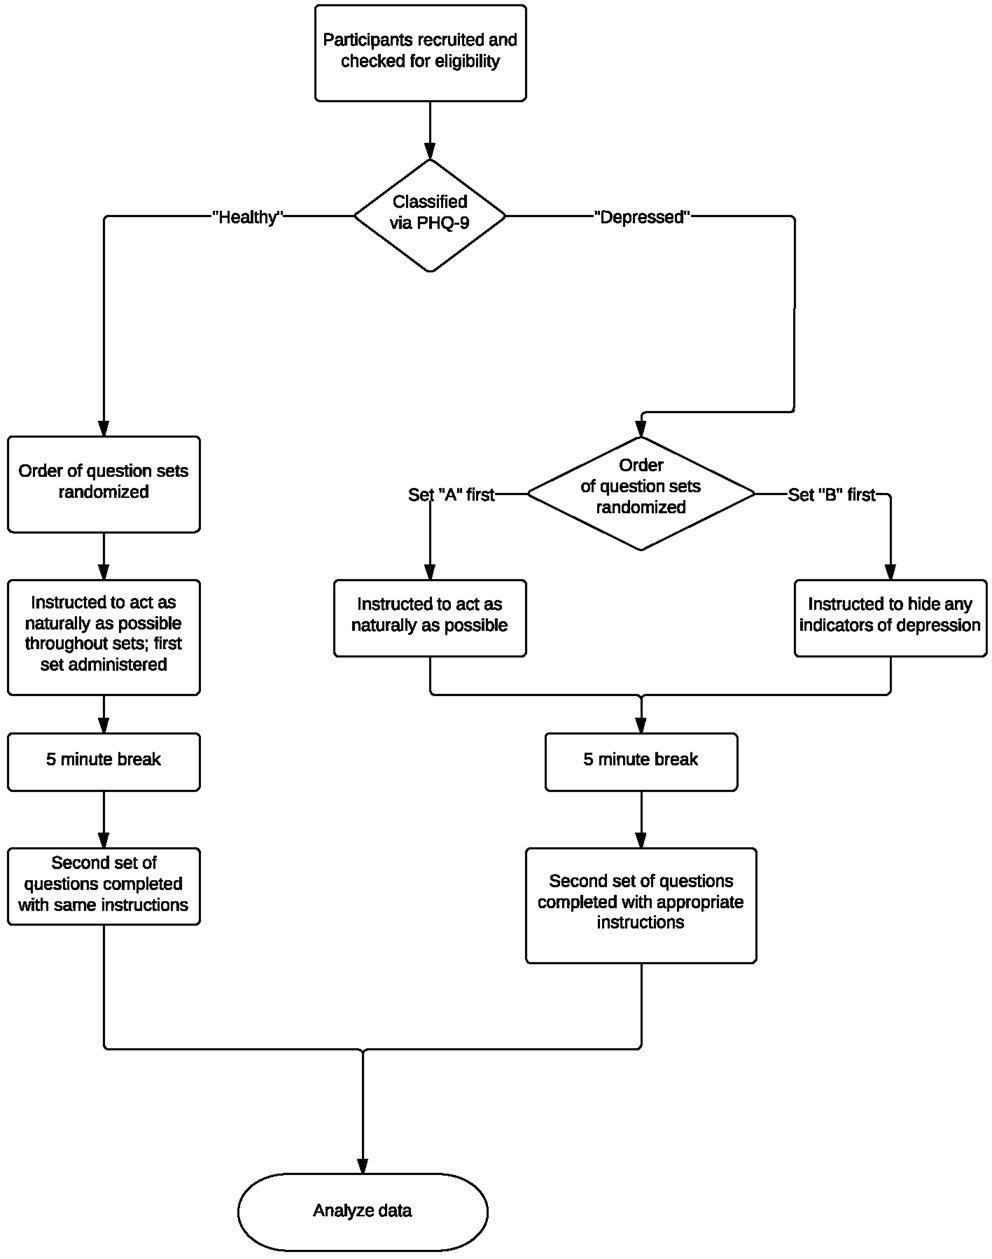
Figure 3. Overview of experimental protocol and testing process. Eligible participants were asked two separate question sets and were asked to read an excerpt from a popular book aloud. Depressed participants were instructed to act naturally when answering one set and to alter their behavior so as to hide any physical indicators of depression in the other. Healthy participants were instructed to act as naturally as possible throughout the course of the experiments. The order of the question sets was randomized.
Over the course of the experiments, participants were recorded with a webcam and microphone. Audio and video data were recorded using a Logitech C910 HD Pro Webcam and a Blue Snowball Microphone. Video was collected solely for potential use in future research in creating multimodal systems. Speech samples were digitized with a sampling rate of 44.1 kHz and 16-bits. A new AVI file was created for each set of questions and excerpt readings. The audio was then extracted into a WAV file for further processing and to ensure compatibility with a variety of software packages.
In order to provide standard conversation topics during the experiment, the interviewer asked a series of pre-set questions, taking care not to react to any of the subject’s responses. The script was designed to maximize the amount of depressive cues collected in a short period of time. Participants were given time before the interview to familiarize themselves with their surroundings and ask any final clarification questions. In both scripts, initial questions were simple and positive in tone to establish rapport between interviewer and interviewee, and were followed by two reflective, potentially negative questions. When acting naturally, depressed participants were asked what they felt were physical indicators of depression, as well as how they have tried to conceal their depression previously, the rationale being that it is easier to be honest when not consciously trying to deceive.
However, when participants were asked to conceal their depression, they were asked about a deeply emotional topic, namely to describe their experiences with depression. In turn, this simulated the corresponding difficulty of hiding strong emotions in everyday life. The last questions were more open-ended, which allowed the participants to choose the topic and thus feel more in control of the situation. This was recommended as good practice for experiments involving social psychology (Harmon-Jones et al., 2007; Quigley et al., 2014).
Control subjects were given similar questions – the only exceptions being that they were asked to describe a time when they had felt the need to conceal their emotions and how they thought it would feel to have depression. In addition to these questions, participants were also instructed to read aloud the first three paragraphs from the third “Harry Potter” novel (Rowling, 1999)2, as it is both readable and relatable across a range of cultures, and also allows for more direct comparison of speech characteristics across groups and question sets.
4.2. Feature Extraction
Due to any potential effects of equipment or environment on later analysis, signals were pre-processed before feature extraction by first manually removing voices other than the participant’s (i.e., the interviewer’s) and parsing the resultant signal into a new file for every question. Speech was then enhanced through spectral subtraction. The signal was split into frames of data approximately 25 ms long, as it was assumed that speech properties were stationary within this period, and a Hamming window was applied to each frame to remove signal discontinuity at the ends of each block. Each frame was normalized and a power spectrum was extracted to estimate the noise using a minimum mean-square error (MMSE) estimator. The noise spectra were averaged over several frames of “silence,” or segments when only noise was present, and an estimate of the noise was then subtracted from the signal but prevented from going below a minimum threshold. In turn, this helped prevent over dampening of spectral peaks. Furthermore, because this threshold was set as a SNR, it could also vary between frames. This was implemented as a modified version of the spectral subtraction function in the MATLAB toolbox VOICEBOX (Brookes, 1997).
Next, this enhanced signal was passed through a first-order high pass FIR filter for pre-emphasis. This filter was defined as:
where α was set as −0.95, which presumes that 95% of any sample originated from the prior one. Pre-emphasis serves to spectrally flatten the signal to amplify higher frequency components and offset the naturally negative spectral slope of voiced speech (Kesarkar and Rao, 2003). As human hearing is more sensitive above 1000 Hz, any further analysis is then also made more sensitive to perceptually significant aspects of speech that would otherwise be obscured by lower frequencies.
The selection of features significantly influences the accuracy of machine learning classifiers. As described in Moore et al. (2003, 2008) and Low (2011), acoustic features are often split into categories and subcategories to determine optimal feature sets. In this study, similar groupings are used and split into prosodic, spectral, cepstral, and TEO-based. A statistical analysis is then used to whittle down the number of features to only include those that are statistically significant.
4.2.1. Prosodic features: pitch and fundamental frequency
Pitch is commonly quantified by and considered equivalent to fundamental frequency (F0). F0 is a basic and readily measurable property of periodic signals that is highly correlated with perceived pitch. F0 approximates the periodic rate of glottis opening and closing in voice speech (Moore et al., 2003). However, it is difficult to measure, as it changes over time and depends on the voicing state, which is often unclear. In these experiments, a slightly modified version of Talkin’s pitch tracking algorithm in the MATLAB toolbox VOICEBOX was implemented. This algorithm is known for its relative robustness (Talkin, 1995).
4.2.2. Prosodic features: log energy
The logarithm of short-term energy is representative of signal loudness and is calculated on a per frame basis via Eq. 2 below (Low, 2011).
where m is the frame number with N samples per frame, and s(n) is the speech signal. Stress or emotion often affect measured energy.
4.2.3. Prosodic features: timing measures
Although speech is often segmented before analysis, prosodic analysis of the segment as a whole can also be useful. An automated script was written in the software package Praat (Boersma and Weenink, 2014) to extract various timing measures, calculated via Eqs 3–6. The total number of syllables in the excerpt reading was considered constant for all participants, as the content was unchanged.
These features quantified some symptoms of psychomotor retardation in depressed patients, such as difficulty in thinking, concentrating, and choosing words. It was determined that performing these tests on spontaneous speech would be an inaccurate assessment of prosody due to the extent to which some participants in both groups connected or did not connect to the question. For example, some participants responded in single sentences, which did not offer enough data for fair comparison.
4.2.4. Spectral features: spectral centroid
The spectral centroid is derived from the weighted mean of frequencies present in a signal and represents the center of the power distribution. It is calculated by Eq. 7 below:
where S(n) is the magnitude of the power spectrum for bin number n, bin center f(n), and N total bins (Low, 2011).
4.2.5. Spectral features: spectral flux
Spectral flux measures how fast power changes in a signal by comparing adjacent power spectra (Eq. 8). In theory, depressed speech should waver more than the steady voice of a healthy individual. To calculate it, the Euclidean norm of the difference in power between adjacent frames is measured:
where S(k) is the power at frequency band with corresponding index k (Low, 2011). The spectral spread of each participant is normalized 0–1.
4.2.6. Spectral features: spectral roll-off
Spectral roll-off is defined (Low, 2011) as the frequency point at which 80% of the power spectrum lies beneath it, or as in Eq. 9:
4.2.7. Cepstral features
Optimal representation of speech characterizes an individual’s unique “filter,” or vocal tract, whilst removing any influence of the source. This is problematic, as per the source-filter model, the two are inherently linked by convolution or multiplication in the time and frequency domains, respectively. However, it is possible to use logarithms to separate the two by transforming the multiplications into summations:
where X(z) and H(z) are the source and filter frequency responses (Oppenheim and Schafer, 2004). If the filter primarily contains low frequencies and the source mainly high frequencies, an additional filter can theoretically separate the two. The Z-inverse of C(z), measured in units of frequency, is called the cepstrum.
Mel-frequency cepstral coefficients (MFCCs) are features commonly used in speaker recognition. A Mel is simply a unit of measurement of perceived pitch, and takes into account the fact that humans have decreased sensitivity at higher frequencies. As with any short-term acoustic feature, the audio signal is assumed stationary over a small time scale (25 ms). If frames are shorter than this, not enough samples are present to adequately calculate speech properties, but if much longer, the signal changes too much throughout the frame. Frames are shifted by 10 ms to reflect signal continuity.
Once the FFT is computed over each frame, a Mel filter bank is defined using a set number of triangular filters uniformly spaced in the Mel-domain, and the log of the energy within the passband of each filter is calculated. Thirty filters were used based on results of prior optimization for depression classification (Low, 2011).
The discrete cosine transform (DCT) is then calculated on these logarithmic energies, and the MFCCs are the resulting coefficients. In doing so, energy is better represented according to human perception, and correlations between features are removed. Furthermore, by selecting only the first 12 coefficients, it is possible to isolate slower changes in filter bank energies, as higher frequency changes degrade recognition accuracy.
MFCC values provide information on the power spectral envelope of a sequence of frames. However, to obtain dynamic information on coefficient trajectories over time, Δ (differential) and Δ−Δ (acceleration) coefficients can be calculated by Eq. 11 below:
where dt is the Δ coefficient at time t calculated from the static coefficients c over the window size ϕ of 9 frames (Low et al., 2009a). Δ−Δ coefficients were calculated in the same manner. In theory, depression should result in decreased articulatory precision that is then reflected in these values.
4.2.8. TEO-based features
Teager energy operator (TEO)-based features are useful tools for analyzing a signal’s energy profile and the energy required to generate that signal (Kaiser, 1990). When applied to speech production, they are capable of taking into account non-linear airflow, and are thus particularly significant in stress recognition due to the turbulent (and thus non-linear) airflow at more emotional states. Two main types of vortices contribute to voice quality – the first of which results from normal flow separation due to the opening and closing of the glottis and is responsible for speaker loudness and high frequency harmonics. The second type is caused by fast air flow in emotional or stressed states, which creates vortices around the vestibular folds and consequently produces additional excitation signals unrelated to the measured fundamental frequency generated by glottal closure (Teager, 1980; Teager and Teager, 1983, 1990; Khosla et al., 2008). The operator used to generate this TEO energy profile is mathematically calculated via Eq. 12 below:
where ψ is the Teager energy operator and x[n] is the corresponding nth sample of speech (Low, 2011). Some studies have reported strong performance of these features in classifying depression (Low et al., 2009a, 2010), which prompted their use in these experiments.
4.2.9. Statistical analysis
The aforementioned features were tested for their ability to discriminate between pairwise comparisons of healthy and depressed participants using t-tests with each WAV file used as a data point. Any features that were not statistically significant at the 0.05 alpha-level were not used in later modeling. One-tailed t-tests were used if the relationship between that feature and depression was known. For example, depressed participants should exhibit lower energy levels than their healthy counterparts. If the relationship was not known, two-tailed tests were performed.
5. Results
Our analysis of relevant vocal cues of depression was done in three steps. Firstly, we performed a brief visual inspection of features that the clinical literature suggests are strong indicators of depression. Secondly, we took inspiration from a study in audio-based emotion recognition and find which of the features that are valuable for emotion recognition also are statistically significant in detecting depression. Finally, we performed a Machine Learning analysis, in which we trained two simple classifiers to do subject-independent depression recognition. In the last study, we also experimented incremental greedy feature selection.
In general, the visual inspection of what are supposed to be relevant features for depression recognition did not reveal any strong patterns. Figure 4 shows what were perhaps the most salient results, based on the Log Energy of the speech signal. Although most depressed participants seemed to generally have lower energy levels than their healthy counterparts as in Figure 4A, significant subject variations and an outlier obscured this relationship. Comparing participants directly in matched pairs proved much more revealing, as almost all of the matched pairs demonstrated lower energy levels for depressed participants when compared with their healthy counterpart (Figure 4B). Males generally had less energy than females (Figure 4C), but with a sample size of four, this trend is not statistically significant. Native English speakers seemed to have wider variations in their average energy levels than non-native speakers (Figure 4D), but again the trend is not statistically significant.
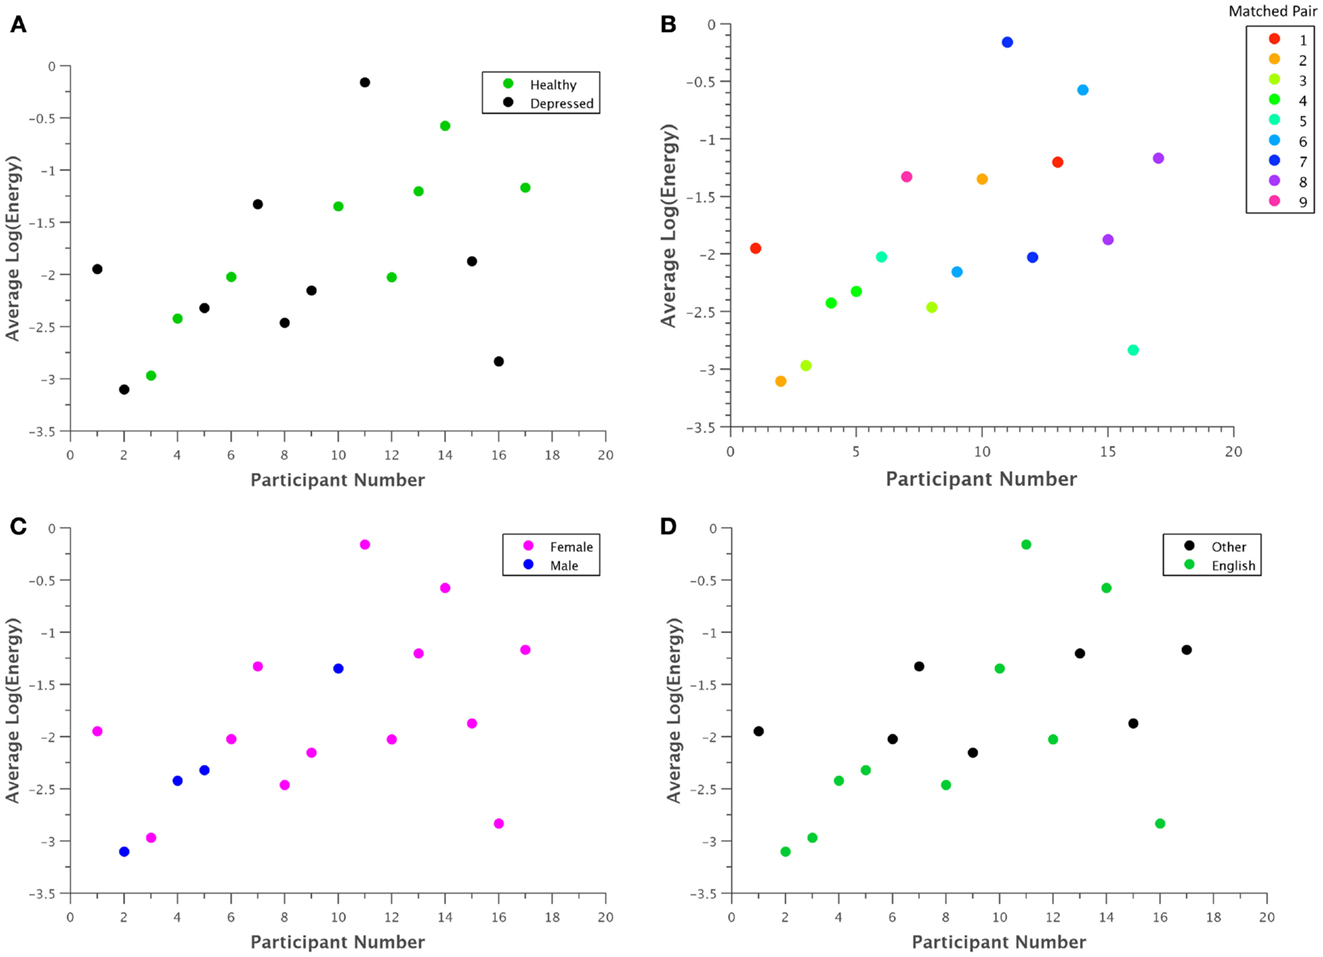
Figure 4. Average log energy was plotted for each participant grouped by (A) classification, (B) matched pairs, (C) gender, and (D) native language. Although patterns may be difficult to ascertain at first glance, in general, each depressed participant exhibited significantly lower energy than their corresponding healthy control. Due to the uneven number of total participants, one point had no matched pair.
A statistical analysis was performed on select features to capture patterns that are not apparent from visual inspection. As the full space of features is very large, we focused our study on features that have previously been found to be of significant value in emotion recognition (Iliou and Anagnostopoulos, 2010). Because depression is inherently a mood disorder, the voice should exhibit similar cues as found in some negative emotions. Therefore, we hypothesize that some of these features might also be significant for depression classification.
Each feature was compared within a matched pair of a healthy and a depressed individual, and the total number of statistically significant matched pairs is listed within each corresponding cell in Tables 2 and 3. If six or more (out of eight) pairs exhibited significant differences, the feature was deemed a potential indicator of depression and shaded in blue or teal. It was noted that this process does not necessarily imply that the difference is due to depression alone, but rather, that depression is possibly correlated with that particular feature. Both normal and concealed behavior were tested. Features that were found to be significant for both normal behavior and to detect emotion [as found by Iliou’s study (Iliou and Anagnostopoulos, 2010)] are highlighted with thicker black borders in Table 2. Twenty-four features were noted as significantly different during normal behavior.
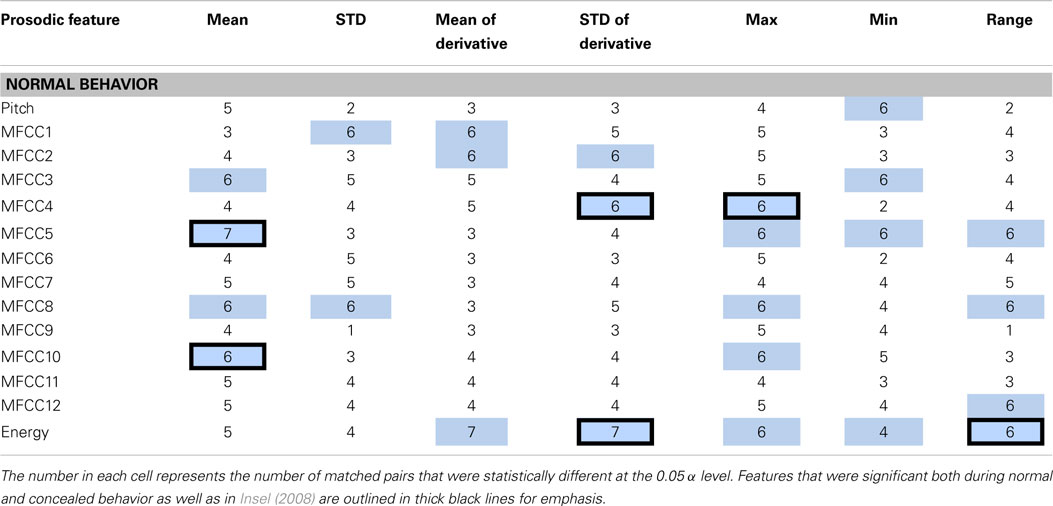
Table 2. Features determined to be significantly different between healthy and depressed matched pairs during normal behavior are shaded in blue.
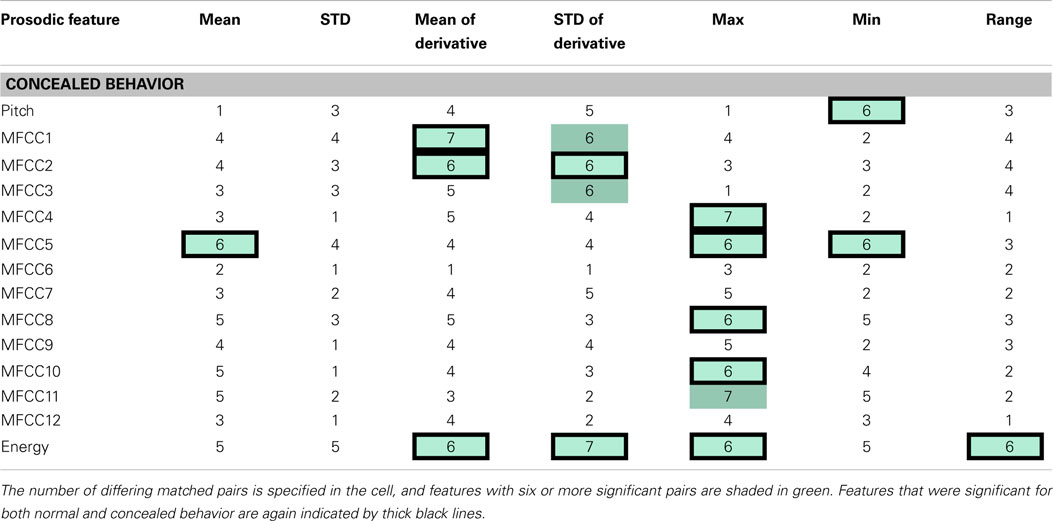
Table 3. The table indicates speech features determined to be significantly different between health and depressed matched pairs during concealed behavior.
The significance of features between normal and concealed behavior was also examined. Of the 17 features that exhibited significant differences between healthy and depressed individuals for concealed behavior, 14 were also significant during normal behavior (see Table 3). Although these features are not necessarily indicators of depression, it is nonetheless interesting that features that were considered significant for concealed behavior were almost always significant for normal behavior as well. The MFCCs were tested with a two-sided t-test whereas pitch and energy were tested with a one-sided test, as it was hypothesized that depressed participants would have lower pitch and energy values.
Log energy and its analogous statistics were some of the most distinguishing features between groups during spontaneous speech. Given that most depressed participants were generally softer-spoken than their healthy counterparts, this was somewhat expected. On the other hand, most features related to pitch and statistical functions thereof were surprisingly poor differentiators. This is perhaps due to the fact that pitch itself is extremely person dependent and might require normalization for direct comparison. Additionally, participants who were non-native English speakers generally had wider variations in pitch irrespective of their classification. It was further noted that “significance” itself was tested differently in this study than in Iliou and Anagnostopoulos (2010), which may account for some of the discrepancy.
5.1. Machine Learning Evaluation
We performed Machine learning analysis with two goals: to determine whether it is possible to detect depression even if a participant tried to conceal their depressive behavior, and to determine the minimum set of features needed to robustly discriminate between depressive and non-depressive behavior.
For the first goal, machine learning models were trained on normal behavior data to find an optimal classifier. Four different classifiers were assessed not only based on their subject-based classification accuracy, but also on their sensitivity. As these techniques would ideally be implemented in an automatic diagnostic device, it was more important to have high sensitivity (percentage of people correctly diagnosed with depression) than high specificity (percentage of people correctly identified as healthy). The trained model was then tested on the concealed data and its performance noted.
Naive Bayes, k-Nearest Neighbor, random forest, and neural network classifiers were selected because they are known to perform well on such problems, and are very well-understood. In training the models, leave-one-subject-out cross-validation was used to avoid one of the many common pitfalls in using machine learning techniques: overfitting, which can often lead to mistakenly overoptimistic results (Jain and Zongker, 1997; Guyon and Elisseeff, 2003). Thus, we trained 16 separate models on the normal behavior data, each time leaving out the data of one subject. Each model would then be tested on either the normal or concealed data of the left-out subject only. Note that in our approach, the concealed data was never used to train any of the models.
Of the four classifiers, both the Naive Bayes and kNN classifiers demonstrated remarkable classification accuracy for both normal and concealed behavior, as shown in Table 4. Although both achieved classification accuracies (CA) of 88.24% on a per-subject basis, the Naive Bayes classifier exhibited superior sensitivities of 88.89 and 75% for normal and concealed behavior respectively compared to 77.78% CA and 75% sensitivity for the kNN classifier. Results indicated that addition of the cepstral features did not improve results. Applying Occam’s razor, it was found that best results are obtained using prosodic features in this setting.
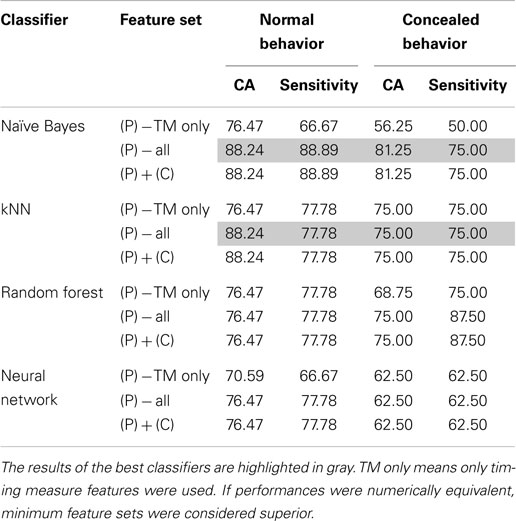
Table 4. Comparison of optimal classifier performances in terms of classification accuracy (CA) and sensitivity with the addition of prosodic (P), cepstral (C), or both categories of features.
To further refine a minimal set of robust indicators of depression, features that were found to be significant in previous sections were combined stepwise by category. For example, a model based solely on timing measures (TM) was created first, and other prosodic features of pitch and energy were incrementally added in and tested for improvement. Similarly, MFCCs were included in later iterations. The effects of feature selection are clearly shown in Table 5. The Naive Bayes model achieved a high level of accuracy using only two features: total time and average absolute deviation of pitch, whereas the kNN model required three: total time, average absolute deviation of pitch, and speaking rate. It is important to note that the reclassified participant was not included in calculations performed on the concealed task data, so results were calculated out of 16 participants instead of 17.
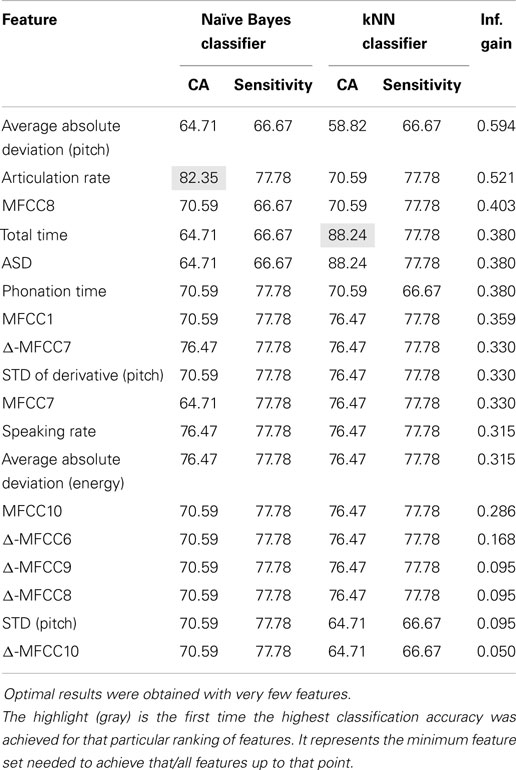
Table 5. Sequential feature selection ranked by information gain during normal behavior.
Examining the data further revealed some interesting patterns. For example, when average absolute deviation of pitch was plotted against total time, there appeared to be a general range from 16 to 22 Hz that frame-to-frame pitch deviations for healthy individuals fell within (Figure 5). Furthermore, during (Figure 5A) normal behavior, many of the depressed participants had noticeably lower pitch deviations than the control group, which logically corroborated with clinical observations. This pattern somewhat inverted during (Figure 5B) concealed behavior, although to such an extent that many depressed participants varied their pitch too much that the deviation still was not within the “normal” range.
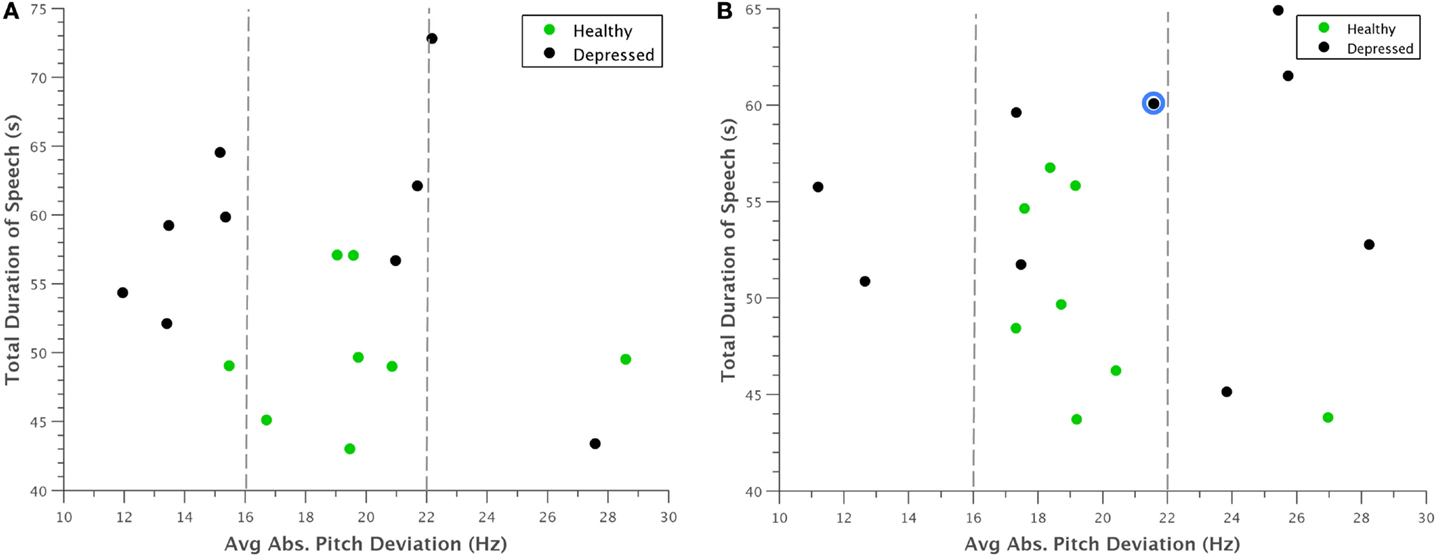
Figure 5. Scatterplot of average absolute deviation in pitch against total duration of speech for (A) normal behavior and (B) concealed behavior. Most healthy participants appeared to have pitch deviations between 16 and 22 Hz, whereas depressed participants had markedly smaller deviations during normal behavior. This trend was somewhat reversed when depressed participants were asked to conceal their depression, with many falling above this range. The reclassified participant is outlined in blue.
A potential problem with the interpretation of Figure 5 is that our experimental design only considers concealing voice control by depressed participants. The reason for this is that there is no need for non-depressed participants to appear non-depressed. Nevertheless, we want to judge whether the increased deviation in pitch of depressed also occurs in healthy controls if they conceal something from an interviewer in similar experiments. For this, we turned to the literature on lie detection. Anolli and Ciceri (1997) reported that in healthy subjects lying resulted in a greater number of pauses and words and either over-controlled reduced variation in tone or lacking control of tone (so more variable). The changes in tone within depressed subjects therefore follow the general pattern shown in healthy subjects in terms of tone that a few people do not change their tone under deception. However, the overall conclusion that the machine is not fooled still stands.
A similar clustering occurred when average absolute deviation of pitch was plotted against the first Mel-cepstral frequency coefficient (Figure 6). Although it is difficult to pinpoint a specific physical quantity that the first MFCC represents, the coefficients as a whole are used to uniquely characterize the vocal tract. This trend was thus noted as an interesting observation that could be investigated in future experiments.
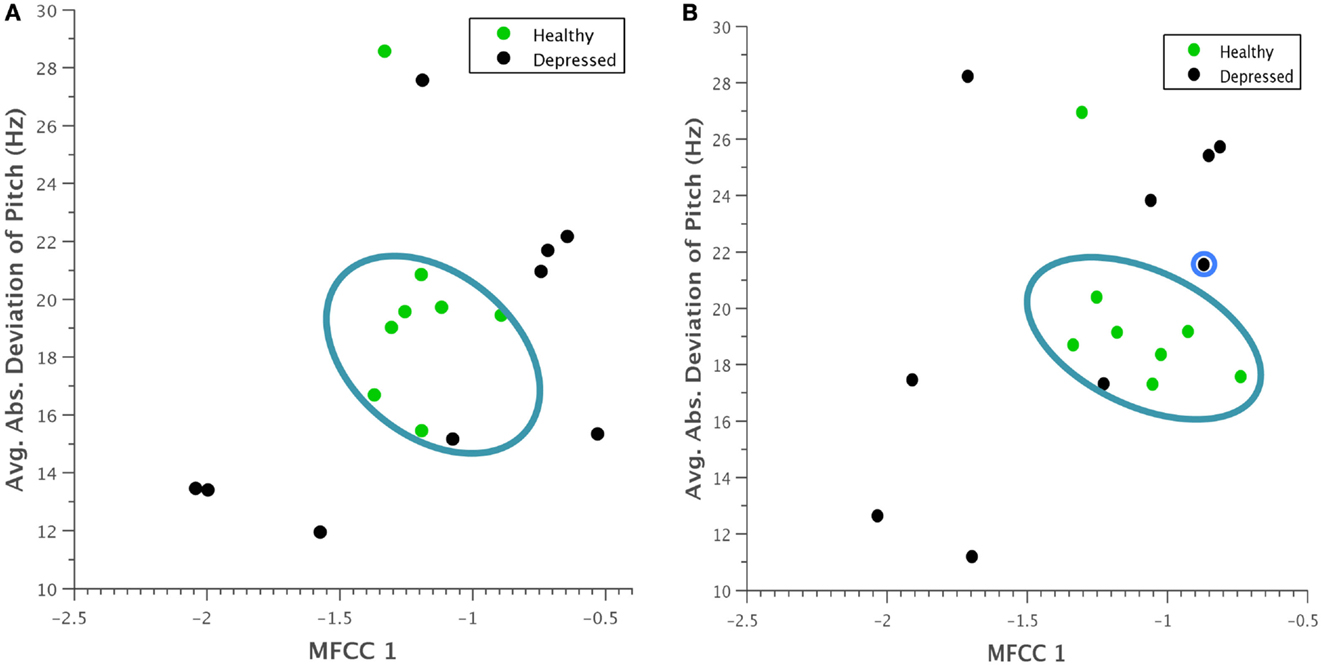
Figure 6. Scatterplot of average absolute deviation in pitch against the first Mel-frequency cepstral coefficient for (A) normal behavior and (B) concealed behavior. A clustering of healthy participants within a particular range is again evident, and during concealed behavior, depressed participants seem to vary their behavior more substantially. The reclassified participant is again outlined in blue.
Several expected clinical observations were confirmed visually by plotting some of these features against each other. For example, in Figure 7, articulation rate was plotted against total duration of speech. As indicative of the psychomotor retardation characteristic in many people with depression, depressed participants generally spoke at a slower rate and took more time to say the same phonetic content.
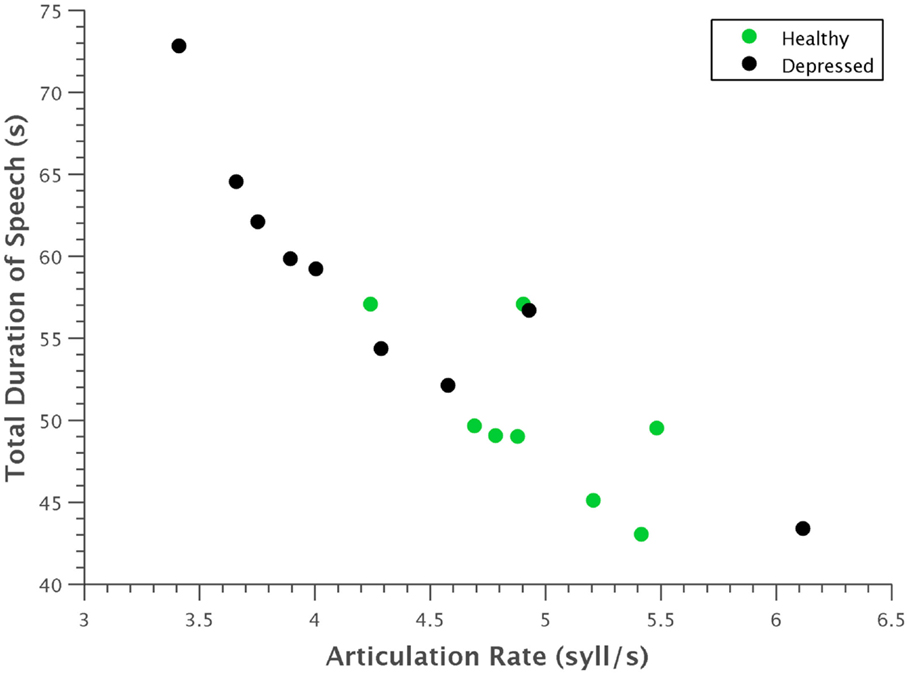
Figure 7. Scatterplot of articulation rate against total time. Depressed participants generally had a slower articulation rate and took more time to utter the same phonetic content. The strong linear correlation of these features is also evident.
6. Conclusion
We presented our results of a study that looked into the automatic detection of depression using audio features in a human–computer interaction setting. In particular, we set out to discover how hard it would be to fool or cheat such an automated system. In our study on 17 matched healthy and depressed participants, we found that depressed participants seemed to follow the predicted pattern of lower energy levels in speech. Many of the prosodic and cepstral features that have before been used in emotion recognition were also found to be significant in depression recognition. However, not all features that were significant in differentiating depressed and healthy participants were the same as with those used in emotion recognition. These inconsistencies may suggest some dependency on the data collected and the methods used to acquire it, or perhaps on more fundamental differences between emotion and depression. One important finding of our study was that almost all features found to be significant during concealed behavior were also significant during normal behavior. This indicates that it may be hard to fool an automated system for depression screening. If supported by further evidence, this finding should have major implications for the development of reliable depression screening or monitoring systems. The second important finding from our study was that we attained high classification accuracy and depression recognition precision using only simple machine learning techniques. Both k-Nearest Neighbors and Naive Bayes attained classification rates over 80% when using only 3 or 2 most salient features, respectively.
Classifications were surprisingly accurate given that only so few features were used, and remained high for concealed behavior. This may indicate that the selected features are robust indicators of depression. However, our findings are presented in full knowledge that given such a small, restricted sample size (n = 17), findings from this study do not necessarily generalize to the population as a whole. A study on a larger population will form part of our future work. In addition, we will incorporate visual cues of depression to improve the accuracy of our predictions.
Conflict of Interest Statement
The authors declare that the research was conducted in the absence of any commercial or financial relationships that could be construed as a potential conflict of interest.
Acknowledgments
The work of MV, RM, and JC is partly funded by the NIHR-HTC “MindTech.” In addition, part of MV’s work is funded by Horizon Digital Economy Research, RCUK grant EP/G065802/1. Part of RM’s work is funded by the National Institute of Healthcare Research Collaboration for Leadership in Applied Health Research and Care (NIHR CLAHRC) East Midlands.
Footnotes
- ^We adhere here to the widely accepted DSM-IV rather than DSM-V, which has been met with severe criticism to the point where the National Institute of Mental Health has decided not to adopt it.
- ^The first two novels had introductions that expressed negative views of abnormality, which could potentially have been upsetting for participants.
References
Alghowinem, S., Goecke, R., Wagner, M., Epps, J., Breakspear, M., and Parker, G. (2013). “Detecting depression: a comparison between spontaneous and read speech,” in 2013 IEEE International Conference on Acoustics, Speech and Signal Processing (ICASSP) (Vancouver, BC: IEEE), 7547–7551.
Altorfer, A., Jossen, S., Wurmle, O., Kasermann, M. L., Foppa, K., and Zimmermann, H. (2000). Measurement and meaning of head movements in everyday face-to-face communicative interaction. Behav. Res. Methods Instrum. Comput. 32, 17–32. doi: 10.3758/BF03200785
Pubmed Abstract | Pubmed Full Text | CrossRef Full Text | Google Scholar
Anolli, L., and Ciceri, R. (1997). The voice of deception: vocal strategies of naive and able liars. J. Nonverb. Behav. 4, 259–284. doi:10.1023/A:1024916214403
American Psychiatric Association (2000). Diagnostic and Statistical Manual of Mental Disorders DSM-IV-TR Fourth Edition. Washington, DC: American Psychiatric Publishing, Inc.
Beck, A. T., Steer, R. A., Ball, R., and Ranieri, W. F. (1996). Comparison of Beck depression inventories-ia and-ii in psychiatric outpatients. J. Pers. Assess. 67, 588–597. doi:10.1207/s15327752jpa6703_13
Pubmed Abstract | Pubmed Full Text | CrossRef Full Text | Google Scholar
Beck, A. T., Ward, C., Mendelson, M., Mock, J., and Erbaugh, J. (1961). Beck depression inventory (BDI). Arch. Gen. Psychiatry 4, 561–571. doi:10.1001/archpsyc.1961.01710120031004
Boersma, P., and Weenink, D. (2014). Praat: Doing Phonetics by Computer, Version 5.4, [Computer Program]. Available at: http://www.praat.org/
Brookes, M. (1997). Voicebox: Speech Processing Toolbox for MatLab. Technical Report, Imperial College, London.
Cameron, I. M., Cardy, A., Crawford, J. R., du Toit, S. W., Hay, S., Lawton, K., et al. (2011). Measuring depression severity in general practice: discriminatory performance of the PHQ-9, HADS-D, and BDI-II. Br. J. Gen. Pract. 61, e419–e426. doi:10.3399/bjgp11X583209
Pubmed Abstract | Pubmed Full Text | CrossRef Full Text | Google Scholar
Cannizzaro, M., Harel, B., Reilly, N., Chappell, P., and Snyder, P. J. (2004). Voice acoustical measurement of the severity of major depression. Brain Cogn. 56, 30–35. doi:10.1016/j.bandc.2004.05.003
Pubmed Abstract | Pubmed Full Text | CrossRef Full Text | Google Scholar
Chang, K.-H. (2012). Speech Analysis Methodologies Towards Unobtrusive Mental Health Monitoring. Ph.D. thesis, EECS Department, University of California, Berkeley.
Clark, L. A., and Watson, D. (1991). Tripartite model of anxiety and depression: psychometric evidence and taxonomic implications. J. Abnorm. Psychol. 100, 316. doi:10.1037/0021-843X.100.3.316
Pubmed Abstract | Pubmed Full Text | CrossRef Full Text | Google Scholar
Cummins, N., Epps, J., Sethu, V., Breakspear, M., and Goecke, R. (2013). “Modeling spectral variability for the classification of depressed speech,” in 14th Annual Conference of the International Speech Communication Association Interspeech. Lyon, 857–861.
DePaulo, B. M., Lindsay, J. J., Malone, B. E., Muhlenbruck, L., Charlton, K., and Cooper, H. (2003). Cues to deception. Psychol. Bull. 129, 74. doi:10.1037/0033-2909.129.1.74
Diez-Quevedo, C., Rangil, T., Sanchez-Planell, L., Kroenke, K., and Spitzer, R. L. (2001). Validation and utility of the patient health questionnaire in diagnosing mental disorders in 1003 general hospital Spanish inpatients. Psychosom. Med. 63, 679–686. doi:10.1097/00006842-200107000-00021
Pubmed Abstract | Pubmed Full Text | CrossRef Full Text | Google Scholar
Dum, M., Pickren, J., Sobell, L. C., and Sobell, M. B. (2008). Comparing the bdi-ii and the phq-9 with outpatient substance abusers. Addict. Behav. 33, 381–387. doi:10.1016/j.addbeh.2007.09.017
Pubmed Abstract | Pubmed Full Text | CrossRef Full Text | Google Scholar
France, D. J., Shiavi, R. G., Silverman, S., Silverman, M., and Wilkes, D. M. (2000). Acoustical properties of speech as indicators of depression and suicidal risk. IEEE Trans. Biomed. Eng. 47, 829–837. doi:10.1109/10.846676
Pubmed Abstract | Pubmed Full Text | CrossRef Full Text | Google Scholar
Furukawa, T. A. (2010). Assessment of mood: guides for clinicians. J. Psychosom. Res. 68, 581–589. doi:10.1016/j.jpsychores.2009.05.003
Pubmed Abstract | Pubmed Full Text | CrossRef Full Text | Google Scholar
Garcia-Campayo, J., Lobo, A., Perez-Echeverria, M. J., and Campos, R. (1998). Three forms of somatization presenting in primary care settings in Spain. J. Nerv. Ment. Dis. 186, 554–560. doi:10.1097/00005053-199809000-00006
Pubmed Abstract | Pubmed Full Text | CrossRef Full Text | Google Scholar
Girard, J. M., Cohn, J. F., Mahoor, M. H., Mavadati, S. M., Hammal, Z., and Rosenwald, D. P. (2013). Non-verbal social withdrawal in depression: evidence from manual and automatic analyses. Image Vis. Comput. 32, 641–647.
Greden, J. F., Albala, A., Smokler, I., Gardner, R., and Carroll, B. (1981). Speech pause time: a marker of psychomotor retardation among endogenous depressives. Biol. Psychiatry 16, 851–859.
Gross, J. J., and Muñoz, R. F. (1995). Emotion regulation and mental health. Clin. Psychol. Sci. Pract. 2, 151–164.
Guyon, I., and Elisseeff, A. (2003). An introduction to variable and feature selection. J. Mach. Learn. Res. 3, 1157–1182.
Hardy, P., Jouvent, R., and Widlöcher, D. (1984). Speech pause time and the retardation rating scale for depression (erd): towards a reciprocal validation. J. Affect. Disord. 6, 123–127. doi:10.1016/0165-0327(84)90014-4
Pubmed Abstract | Pubmed Full Text | CrossRef Full Text | Google Scholar
Hargreaves, W. A., and Starkweather, J. A. (1964). Voice quality changes in depression. Lang. Speech 7, 84–88.
Harmon-Jones, E., Amodio, D. M., and Zinner, L. R. (2007). “Social psychological methods of emotion elicitation,” in Handbook of Emotion Elicitation and Assessment, eds J. A. Coan and J. J. B. Allen (New York: Oxford University Press), 91–105.
Harris, P. L., Johnson, C. N., Hutton, D., Andrews, G., and Cooke, T. (1989). Young children’s theory of mind and emotion. Cogn. Emot. 3, 379–400. doi:10.1080/02699938908412713
Health and Consumer Protection Directorate General. (2005). Improving the Mental Health of the Population: Towards a Strategy on Mental Health for the European Union. Technical Report. Brussels: European Union.
Health and Consumer Protection Directorate General. (2008). Mental Health in the EU. Technical report, European Union.
Hepner, K. A., Hunter, S. B., Edelen, M. O., Zhou, A. J., and Watkins, K. (2009). A comparison of two depressive symptomatology measures in residential substance abuse treatment clients. J. Subst. Abuse Treat. 37, 318–325. doi:10.1016/j.jsat.2009.03.005
Pubmed Abstract | Pubmed Full Text | CrossRef Full Text | Google Scholar
Hinchliffe, M. K., Lancashire, M., and Roberts, F. (1971). Depression: defence mechanisms in speech. Br. J. Psychiatry 118, 471–472. doi:10.1192/bjp.118.545.471
Hirabayashi, H., Koshii, K., Uno, K., Ohgaki, H., Nakasone, Y., Fujisawa, T., et al. (1990). Laryngeal epithelial changes on effects of smoking and drinking. Auris Nasus Larynx 17, 105–114. doi:10.1016/S0385-8146(12)80192-1
Pubmed Abstract | Pubmed Full Text | CrossRef Full Text | Google Scholar
Horwitz, R., Quatieri, T. F., Helfer, B. S., Yu, B., Williamson, J. R., and Mundt, J. (2013). “On the relative importance of vocal source, system, and prosody in human depression,” in Body Sensor Networks (BSN), 2013 IEEE International Conference on (Cambridge, MA: IEEE), 1–6.
Iliou, T., and Anagnostopoulos, C.-N. (2010). Classification on speech emotion recognition-a comparative study. Int. J. Adv. Life Sci. 2, 18–28.
Insel, T. R. (2008). Assessing the economic costs of serious mental illness. Am. J. Psychiatry 165, 663–665. doi:10.1176/appi.ajp.2008.08030366
Jain, A., and Zongker, D. (1997). Feature selection: evaluation, application, and small sample performance. IEEE Trans. Pattern. Anal. Mach. Intell. 19, 153–158. doi:10.1109/34.574797
Kaiser, J. F. (1990). “On a simple algorithm to calculate the energy of a signal,” in ICASSP-90., 1990 International Conference on Acoustics, Speech, and Signal Processing, 1990 (Albuquerque: Bell Communication Research, Inc), 381.
Karasz, A. (2005). Cultural differences in conceptual models of depression. Soc. Sci. Amp Med. 60, 1625–1635. doi:10.1016/j.socscimed.2004.08.011
Kesarkar, M. P., and Rao, P. (2003). Feature Extraction for Speech Recognition. Credit Seminar Report, Electronic Systems Group, EE. Dept., IIT, Bombay.
Khosla, S., Murugappan, S., and Gutmark, E. (2008). What can vortices tell us about vocal fold vibration and voice production. Curr. Opin. Otolaryngol. Head Neck Surg. 16, 183–187. doi:10.1097/MOO.0b013e3282ff5fc5
Pubmed Abstract | Pubmed Full Text | CrossRef Full Text | Google Scholar
Kirmayer, L. J. (2001). Cultural variations in the clinical presentation of depression and anxiety: implications for diagnosis and treatment. J. Clin. Psychiatry 62, 22–30.
Kirmayer, L. J., Robbins, J. M., Dworkind, M., and Yaffe, M. J. (1993). Somatization and the recognition of depression and anxiety in primary care. Am. J. Psychiatry 150, 734–741.
Kroenke, K., and Spitzer, R. L. (2002). The phq-9: a new depression diagnostic and severity measure. Psychiatr. Ann. 32, 509–515. doi:10.3928/0048-5713-20020901-06
Kroenke, K., Spitzer, R. L., and Williams, J. B. (2001). The phq-9. J. Gen. Intern. Med. 16, 606–613. doi:10.1046/j.1525-1497.2001.016009606.x
Kung, S., Alarcon, R. D., Williams, M. D., Poppe, K. A., Jo Moore, M., and Frye, M. A. (2013). Comparing the beck depression inventory-ii (bdi-ii) and patient health questionnaire (phq-9) depression measures in an integrated mood disorders practice. J. Affect. Disord. 145, 341–343. doi:10.1016/j.jad.2012.08.017
Pubmed Abstract | Pubmed Full Text | CrossRef Full Text | Google Scholar
Kuny, S., and Stassen, H. (1993). Speaking behavior and voice sound characteristics in depressive patients during recovery. J. Psychiatr. Res. 27, 289–307. doi:10.1016/0022-3956(93)90040-9
Pubmed Abstract | Pubmed Full Text | CrossRef Full Text | Google Scholar
Leask, S. J., Park, B., Khana, P., and Dimambro, B. (2013). Head movements during conversational speech in patients with schizophrenia. Ther. Adv. Psychopharmacol. 3, 29–31. doi:10.1177/2045125312464997
Pubmed Abstract | Pubmed Full Text | CrossRef Full Text | Google Scholar
Lemke, M. R., and Hesse, A. C. (1998). Psychomotor symptoms in depression. Am. J. Psychiatry 155, 709–710. doi:10.1176/ajp.155.5.709
Lewis, S. E. (1996). The Social Construction of Depression: Experience, Discourse and Subjectivity. Ph.D. thesis, University of Sheffield.
Low, L. (2011). Detection of Clinical Depression in Adolescents’ using Acoustic Speech Analysis. Ph.D. thesis, RMIT University.
Low, L.-S., Maddage, M., Lech, M., Sheeber, L., and Allen, N. (2010). “Influence of acoustic low-level descriptors in the detection of clinical depression in adolescents,” in 2010 IEEE International Conference on Acoustics Speech and Signal Processing (ICASSP) (Dallas, TX: IEEE), 5154–5157.
Low, L.-S. A., Maddage, N. C., Lech, M., Sheeber, L., and Allen, N. (2009a). “Content based clinical depression detection in adolescents,” in Proceedings of European Signal Processing Conference (Germany: European Association for Signal, Speech, and Image Processing (EURASIP)) 2362–2365.
Low, L.-S., Maddage, M., Lech, M., and Allen, N. (2009b). “Mel frequency cepstral feature and Gaussian mixtures for modeling clinical depression in adolescents,” in 8th IEEE International Conference on Cognitive Informatics, 2009. ICCI’09 (Kowloon: IEEE), 346–350.
Mayer, J. D., and Salovey, P. (1995). Emotional intelligence and the construction and regulation of feelings. Appl. Prevent. Psychol. 4, 197–208. doi:10.1016/S0962-1849(05)80058-7
Miller, P., and Sperry, L. L. (1987). “The socialization of anger and aggression,” in Merrill-Palmer Quarterly (Detroit: Wayne State University Press), 1–31.
Moore, E., Clements, M., Peifer, J., and Weisser, L. (2003). “Analysis of prosodic variation in speech for clinical depression,” in Engineering in Medicine and Biology Society, 2003. Proceedings of the 25th Annual International Conference of the IEEE, Vol. 3 (Cancun: IEEE), 2925–2928.
Moore, E., Clements, M., Peifer, J., and Weisser, L. (2004). “Comparing objective feature statistics of speech for classifying clinical depression,” in Engineering in Medicine and Biology Society, 2004. IEMBS’04. 26th Annual International Conference of the IEEE, Vol. 1 (San Francisco, CA: IEEE), 17–20.
Moore, E., Clements, M. A., Peifer, J. W., and Weisser, L. (2008). Critical analysis of the impact of glottal features in the classification of clinical depression in speech. IEEE Trans. Biomed. Eng. 55, 96–107. doi:10.1109/TBME.2007.900562
Pubmed Abstract | Pubmed Full Text | CrossRef Full Text | Google Scholar
Moses, P. J. (1942). The study of personality from records of the voice. J. Consult. Psychol. 6, 257. doi:10.1037/h0055754
Mundt, J. C., Snyder, P. J., Cannizzaro, M. S., Chappie, K., and Geralts, D. S. (2007). Voice acoustic measures of depression severity and treatment response collected via interactive voice response (ivr) technology. J. Neurolinguistics 20, 50–64. doi:10.1016/j.jneuroling.2006.04.001
Pubmed Abstract | Pubmed Full Text | CrossRef Full Text | Google Scholar
Mundt, J. C., Vogel, A. P., Feltner, D. E., and Lenderking, W. R. (2012). Vocal acoustic biomarkers of depression severity and treatment response. Biol. Psychiatry 72, 580–587. doi:10.1016/j.biopsych.2012.03.015
Pubmed Abstract | Pubmed Full Text | CrossRef Full Text | Google Scholar
Newman, S., and Mather, V. G. (1938). Analysis of spoken language of patients with affective disorders. Am. J. Psychiatry 94, 913–942. doi:10.1176/ajp.94.4.913
Oppenheim, A. V., and Schafer, R. W. (2004). From frequency to quefrency: a history of the cepstrum. IEEE Signal Process. Mag. 21, 95–106. doi:10.1109/MSP.2004.1328092
Ostwald, P. F. (1963). Soundmaking. The Acoustic Communication of Emotion. San Francisco, CA: Charles C. Thomas.
Quigley, C. K. S., Lindquist, K. A., and Barrett, L. F. (2014). Inducing and Measuring Emotion and Affect: Tips, Tricks, and Secrets. Cambridge University Press.
Rowling, J. K. (1999). Harry Potter and the Prisoner of Azkaban. New York, NY: Arthur A. Levine Books.
Sano, A., and Picard, R. W. (2013). “Stress recognition using wearable sensors and mobile phones,” in Humane Association Conference on Affective Computing and Intelligent Interaction. Geneva. 671–676.
Simon, G. E., VonKorff, M., Piccinelli, M., Fullerton, C., and Ormel, J. (1999). An international study of the relation between somatic symptoms and depression. N Engl. J. Med. 341, 1329–1335.
Spitzer, R. L., Kroenke, K., and Williams, J. B. (1999). Validation and utility of a self-report version of prime-md: the phq primary care study. JAMA 282, 1737–1744. doi:10.1001/jama.282.18.1737
Pubmed Abstract | Pubmed Full Text | CrossRef Full Text | Google Scholar
Sturim, D. E., Torres-Carrasquillo, P. A., Quatieri, T. F., Malyska, N., and McCree, A. (2011). “Automatic detection of depression in speech using Gaussian mixture modeling with factor analysis,” in Interspeech 2011, 2981–2984.
Szabadi, E., and Bradshaw, C. (1983). Speech pause time: behavioral correlate of mood. Am. J. Psychiatry 140, 265–265. doi:10.1176/ajp.140.2.265b
Talkin, D. (1995). A robust algorithm for pitch tracking (rapt). Speech Coding Synth. 495, 518. doi:10.1109/EMBC.2013.6609942
Pubmed Abstract | Pubmed Full Text | CrossRef Full Text | Google Scholar
Teager, H. (1980). Some observations on oral air flow during phonation. IEEE Trans. Acoust. 28, 599–601. doi:10.1109/TASSP.1980.1163453
Teager, H., and Teager, S. (1990). “Evidence for non-linear sound production mechanisms in the vocal tract,” in Speech Production and Speech Modelling, eds W. J. Hardcastle and A. Marchal (Netherlands: Springer), 241–261.
Teager, H. M., and Teager, S. M. (1985). “A phenomenological model for vowel production in the vocal tract,” in Speech Science: Recent Advances, ed. R. G. Daniloff (San Diego, CA: College-Hill Press), 73–109.
Tolkmitt, F., Helfrich, H., Standke, R., and Scherer, K. R. (1982). Vocal indicators of psychiatric treatment effects in depressives and schizophrenics. J. Commun. Disord. 15, 209–222. doi:10.1016/0021-9924(82)90034-X
Pubmed Abstract | Pubmed Full Text | CrossRef Full Text | Google Scholar
US Department of Health and Human Services. (1999). Mental Health: A Report of the Surgeon General. Technical report, The Center of Mental Health Services, Substance Abuse and Mental Health Services Administration, Center for Mental Health Services, National Institutes of Health, National Institute of Mental Health, Bethesda.
Valstar, M. (2014). “Automatic behaviour understanding in medicine,” in Proceedings ACM Int’l Conf. Multimodal Interaction. Istanbul.
Valstar, M., Schuller, B., Smith, K., Almaev, T., Eyben, F., Krajewski, J., et al. (2014). “Avec 2014–3d dimensional affect and depression recognition challenge,” in The ACM International Workshop on Audio/Visual Emotion Challenge. Orlando, FL.
Valstar, M., Schuller, B., Smith, K., Eyben, F., Jiang, B., Bilakhia, S., et al. (2013). “Avec 2013 – the continuous audio/visual emotion and depression recognition challenge,” in Proc. 3rd ACM International Workshop on Audio/Visual Emotion Challenge. Barcelona. 3–10.
Vinciarelli, A., Pantic, M., Heylen, D., Pelachaud, C., Poggi, I., D’ericco, F., et al. (2012). Bridging the gap between social animal and unsocial machine: a survey of social signal processing. IEEE Trans. Affect. Comput. 3, 69–87. doi:10.1109/T-AFFC.2011.27
Weintraub, W., and Aronson, H. (1967). The application of verbal behavior analysis to the study of psychological defense mechanisms. iv: speech pattern associated with depressive behavior. J. Nerv. Ment. Dis. 144, 22–28. doi:10.1097/00005053-196701000-00005
Williamson, J. R., Quatieri, T. F., Helfer, B. S., Ciccarelli, G., and Mehta, D. D. (2014). “Vocal and facial biomarkers of depression based on motor incoordination and timing,” in Proceedings of the 4th ACM International Workshop on Audio/Visual Emotion Challenge (Orlando, FL: ACM).
Williamson, J. R., Quatieri, T. F., Helfer, B. S., Horwitz, R., Yu, B., and Mehta, D. D. (2013). “Vocal biomarkers of depression based on motor incoordination,” in Proceedings of the 3rd ACM International Workshop on Audio/Visual Emotion Challenge (New York, NY: AVEC ’13), 41–48.
Yang, Y., Fairbairn, C., and Cohn, J. F. (2013). Detecting depression severity from vocal prosody. IEEE Trans Affect Comput 4, 142–150. doi:10.1109/T-AFFC.2012.38
Keywords: behaviomedics, depression, affective computing, social signal processing, automatic audio analysis
Citation: Solomon C, Valstar MF, Morriss RK and Crowe J (2015) Objective methods for reliable detection of concealed depression. Front. ICT 2:5. doi: 10.3389/fict.2015.00005
Received: 05 December 2014; Accepted: 25 March 2015;
Published online: 15 April 2015.
Edited by:
Alessandro Vinciarelli, University of Glasgow, UKReviewed by:
Dinesh Babu Jayagopi, International Institute of Information Technology Bangalore, IndiaDilek Hakkani-Tur, Microsoft Research, USA
Copyright: © 2015 Solomon, Valstar, Morriss and Crowe. This is an open-access article distributed under the terms of the Creative Commons Attribution License (CC BY). The use, distribution or reproduction in other forums is permitted, provided the original author(s) or licensor are credited and that the original publication in this journal is cited, in accordance with accepted academic practice. No use, distribution or reproduction is permitted which does not comply with these terms.
*Correspondence: Michel F. Valstar, School of Computer Science, University of Nottingham, Jubilee Campus, Nottingham NG8 1BB, UK e-mail: michel.valstar@nottingham.ac.uk