Computer Screen Use Detection Using Smart Eyeglasses
 Florian Wahl
 Jakob Kasbauer
 Oliver Amft
- ACTLab, Chair of Sensor Technology, University of Passau, Passau, Germany
Screen use can influence the circadian phase and cause eye strain. Smart eyeglasses with an integrated color light sensor can detect screen use. We present a screen use detection approach based on a light sensor embedded into the bridge of smart eyeglasses. By calculating the light intensity at the user’s eyes for different screens and content types, we found only computer screens to have a significant impact on the circadian phase. Our screen use detection is based on ratios between color channels and used a linear support vector machine to detect screen use. We validated our detection approach in three studies. A test bench was built to detect screen use under different ambient light sources and intensities in a controlled environment. In a lab study, we evaluated recognition performance for different ambient light intensities. By using participant-independent models, we achieved an ROC AUC above 0.9 for ambient light intensities below 200 lx. In a study of typical ADLs, screen use was detected with an average ROC AUC of 0.83 assuming screen use for 30% of the time.
1. Introduction
People spend a large portion of the day looking at computer, television, or tablet screens. For example, in 2015, the average US adult spent 9 h and 52 min in front of different screens every day (eMarketer, 2016). Many office workers spend more than 6 h in front of a computer screen (PresseBox, 2008). Extended screen use often causes eye strain, the most common repetitive strain injury. For example, in the United States, 65% of the population suffer from eye strain (The Vision Council of America, 2016). In addition, screen use can influence the circadian phase. The circadian clock is entrained by timing and intensity of light exposure. Morning light exposure advances circadian clock phase, and light exposure in the evening delays it (Revell and Eastman, 2005). The circadian system is most sensitive in the blue range of the light spectrum (Brainard et al., 2001). LED-backlit screens emit high energy in the blue light spectrum compared to other wavelengths and other indoor light sources. Thus, screen use could shift circadian phase (Cajochen et al., 2011), leading to, e.g., difficulty to fall asleep at night and consequently sleep deprivation. A fundamental requirement for guidance and intervention to prevent eye- or sleep-related health problems is therefore to detect screen use when it actually occurs.
Ambient sensors, e.g., proximity sensors (Jaramillo-Garcia et al., 2014), do not suffice for screen use detection as they cannot distinguish mere presence from looking at a screen. To detect screen use, light measurements have to be taken as close as possible to the eye. Only few head-worn wearables have been proposed for context recognition that could be used to robustly detect light received at the eyes. Eyeglasses appear to be practical, everyday accessories and could house a light sensor, without changing their main function as eyeglasses or substantially modifying the eyeglasses appearance. Considering the sensor’s typical field of view of 60°, the best measurement of light actually received at the eyes may be between the eyes, i.e., at the eyeglasses bridge.
Light reaching the eyes originates from a mixture of sources, which differ in the intensity and spectral distribution. Common light intensities range over several orders of magnitude, e.g., from 500 lx at a office desk to 100,000 lx outside on a sunny day. When exposed to large amounts (above 1,000 lx) of natural or artificial light, screens may contribute a negligible share. Consequently, screen use matters if there is only dim ambient light, e.g., during evening or night hours when ambient light intensity is low. Due to the relevance of blue light energy of LED-based screens, spectral irradiance patterns could help to discriminate screen use from other light sources. Thus, a spectral decomposition of the incident light measurement is required at the sensor. The detection algorithm has to cope with noise added by head motion. In addition, a broad range of screens, content types, and ambient lighting conditions complicate the detection of screen use as screen light emissions vary.
In this article, we introduce an approach to detect screen use with smart eyeglasses that provide a color light sensor embedded into the eyeglasses bridge. Electronics to store, process, and transmit measured light data were integrated into the eyeglasses frame. Our approach involves three steps to investigate the challenges related to screen use recognition: a test bench environment was used to investigate screen use detection in a fully controlled environment, ambient light intensity, and without head motion. In a lab study, screen use was investigated with participants wearing smart eyeglasses in different ambient light intensities. Finally, a study of typical activities of daily living (ADLs) evaluated detection of screen use in unconstrained daily life situations. By using features derived from the ratios between color channels, we detect when screen use occurs.
In particular, this article provides the following contributions:
1. We analyzed screens, content type, and typical viewing distance to derive device-specific light intensity at the user’s eyes. We found that computer screens provide highest light intensities due to their size, displayed content, and typical viewing distance.
2. We analyzed screen use detection performance under different ambient light sources and intensities in a test bench environment, which indicated a perfect screen use detection.
3. We evaluated our screen use detection approach using smart eyeglasses worn by 14 participants in a lab study. For light intensities below 200 lx, an ROC AUC of above 0.9 was reached using participant-independent models.
4. We applied our approach to data recorded in a study investigating different ADLs. In seven participants, we detected screen use with an average ROC AUC of 0.83 when assuming 30% screen use.
2. Related Work
According to Duffy and Wright (2005), light is the dominant factor in entrainment of the circadian rhythm. Phase shifts of −2 to +3 h per day are possible depending on the intensity and timing of light exposure. The authors report that a misaligned circadian clock can lead to impaired performance, alertness, and upset gastrointestinal functions. Kantermann and Roenneberg (2009) found that light during night can damage DNA, and thus lead to cancer putting those in shift work especially at risk. Brainard et al. (2001) found spectral sensitivity of the circadian system to peak at 464 nm wavelength. Being exposed to blue light in the evening delays the production of melatonin and thus delays circadian phase. Screen use potentially causes circadian phase shift, e.g., when working late nights in front of a computer screen. As misaligned clocks negatively influence health, episodes of screen use could be detected automatically to support behavioral change.
The effect of screen use on the circadian rhythm has been analyzed in several studies. Cajochen et al. (2011) found a significant delay in dim light melatonin onset (DLMO) from evening exposure to LED-backlit computer screens compared to cold cathode fluorescent lamp (CCFL)-backlit computer screens. Prior to their regular bedtime, 13 participants performed a 5-h screen use episode during which melatonin was sampled every 30 min. Wood et al. (2013) conducted an experiment on 12 participants using a tablet 2 h prior to bedtime. They found that melatonin was suppressed by 23% on average after 2 h of tablet use in the evening compared to no tablet use. After 1 h of tablet use, the effect was smaller with only 7% melatonin suppression compared to no tablet use. Chang et al. (2015) investigated the influence of using light-emitting eReaders at night instead of reading print books. In their crossover protocol, 12 participants read for 4 h prior to bedtime during five consecutive evenings per device. They found that DLMO was delayed by more than 1.5 h when using the backlit eReader over the paper book. These findings confirm circadian phase shift effects through screen use in the evening. Thus, an automatic detection of screen use could inform users about their behavior and support them in implementing an effective compensation.
Studies investigating light influences on human physiology often used wrist-worn devices to record light exposure. Wahl et al. (2014) compared wrist- and head-worn light sensors and found substantial differences in measured light intensities. One core problem with wrist-worn light measurements was a frequent occlusion of the sensor by long-sleeve clothing. Another issue is that light sensor sensitivity depends on angular displacement, typically 50% sensitivity at ±60° displacement, which requires sensors to be worn in an orientation similar to the eyes. Others used head-worn devices such as the Daysimeter (Bierman et al., 2005), which offers accurate recordings but were found impractical for continuous use in everyday life due to their form factor and clip-on to eyeglasses. Regular eyeglasses are the most common vision aid, worn by many. For example, in Germany, 63.5% of the population above 16 years and 92% above 60 years wear eyeglasses (Institut für Demoskopie Allensbach, 2014). In our previous work, we embedded a multimodal, multipurpose sensing system into regular eyeglasses termed WISEglass. WISEglass was used for a wide variety of sensing applications ranging from daily activity recognition (Wahl et al., 2015c), dietary monitoring (Zhang et al., 2016) to motion-based video game control (Wahl et al., 2015a). The smart eyeglasses were validated in a study on 9 participants performing typical ADLs (Wahl et al., 2015b,c). Nine activity clusters were detected from accelerometer and gyroscope data with 77% accuracy. Screen use detection using a color light sensor showed a mean accuracy of 80%. This article provides an in-depth evaluation of screen use detection with color light sensors in three subsequent studies. We investigate different screen types, ambient light sources, and content types.
Intervention measures can be applied to minimize influence of screen use on the circadian phase. Heath et al. (2014) studied if tablet use 1 h prior to bedtime influences the circadian phase. In their study on 16 participants, unfiltered light was compared to light filtered with the f.lux application. They could not find sound proof that 1 h of tablet screen had a significant impact on the circadian phase. van der Lely et al. (2015) investigated the effect of blue light-blocking glasses on the circadian phase. In 13 young males who spent 3 h prior to going to bed in front of a computer screen for 1 week each, they found a significant increase in melatonin when using blue light-blocking glasses. There are suitable intervention measures based on either software or hardware to minimize the effect of screen use on the circadian phase. The work presented in this article could support users by reminding them to wear blue light-blocking glasses or (automatically) enabling a software-based intervention to screen light profile and light intensity.
3. Light Monitoring in Eyeglasses
The WISEglass project aims to embed a multimodal sensor system in regular eyeglasses that could be worn as an everyday accessory, just like eyeglasses are worn today. Our first prototype was based on regular eyeglasses and is shown in Figure 1A.
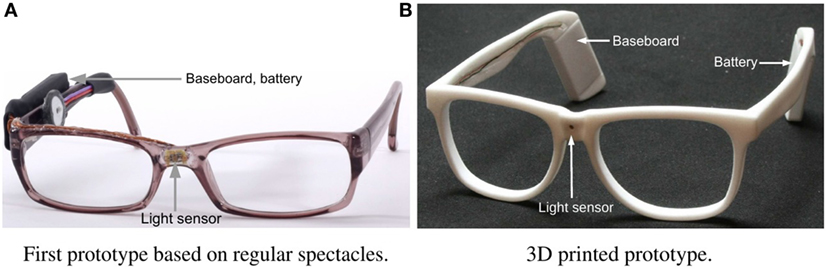
Figure 1. Eyeglasses prototypes used in this work. The eyeglasses prototypes integrate a color light sensor with red, green, blue, and clear channels into the eyeglasses bridge. In the prototype shown in panel (B), electronics for recording, transmitting, and storing sensor data were integrated into the eyeglasses frame. (A) First prototype based on regular spectacles. (B) 3D printed prototype.
Subsequently, a 3D printed version was built as shown in Figure 1B. Both prototypes were used for the analyses presented in this article. We added compartments inside the temple ends of the eyeglasses to house the baseboard and battery. Compared to our first prototype, the compartments improve balancing the component weight. The compartments disappear behind a wearer’s ears when attached; thus, WISEglass appears as regular eyeglasses to bystanders. We included a small compartment on the bridge of the eyeglasses to embed a color light sensor. The bridge location can be used to unobtrusively measure light. 3D printed eyeglasses could be fitted to the wearers head to achieve similar wearing comfort as in existing eyeglasses models.
Integrated sensors are controlled and sampled by the on-board microcontroller. Data can be stored in flash memory for later download or streamed directly via Bluetooth Smart. The battery lasts for 32 h when sampling light sensor data at 50 Hz. Sampling rates can be configured depending on the application.
4. Evaluation Methodology
In this section, we describe goals, sensing approach, recording protocol, and evaluation methodology for each of the three analysis studies.
Starting from the illuminance at the screen during PC work and TV use, we calculated the light intensity at the user’s eyes for different devices as described in Section 4.1. A test bench was used to derive a baseline of the irradiance provided by screens at regular viewing distance and under controlled environmental lighting conditions. The test bench analysis is further described in Section 4.2. In a lab study (described in Section 4.3), data were collected using the same desk setup and viewing distances for every participant while ambient light intensity varied due to weather and time of the day. The ADL study (Section 4.4) investigates a natural variability of screen use, where activities were suggested, but the execution left to participants.
In this work, we obtain data from a TCS34725 (ams AG, 2013) light sensor made by ams. Light was measured in four different spectra: red, green, blue, and clear. After downloading the raw data, virtual light channels were computed from multiple raw color channels by deriving channel ratios. As an example, the ratio of the blue to clear light channel expresses how much blue light is measured in relation to the total amount of light.
4.1. Light Intensity Calculations
The light intensity at the user’s eyes is necessary to quantify the impact of screen use on the circadian phase. We calculated the light intensity at the user’s eyes for different device types during PC and TV use at typical viewing distances. The area A was computed from the aspect ratio w:h and the diagonal length l of the screen as
The luminance L for each screen was researched online and used to compute luminous intensity I as
Different screen activities yield different light intensity levels at the user’s eyes. During high-illuminance screen activities, e.g., editing documents at a PC screen, a majority of pixels is typically bright. In contrast, low-illuminance screen activities, e.g., watching a movie, feature dark backgrounds. To reflect screen activity-dependent light intensity differences, we used two activity prototypes to describe typical screen activities: PC work for high-illuminance screen activities and watching TV for low-illuminance screen activities. To incorporate the effect of content into the textbook irradiance computations, we added the content factor μPC and μTV in equations (3) and (4), respectively. Our test bench measurements found TV content to produce one-third of the light intensity at the user’s eyes compared to PC content. Content factors were therefore set to μPC = 1 and . Finally, we used a typical viewing distance d for each device to compute light intensity at the user’s eyes during PC use EPC and TV use ETV as
For the light intensity analysis, the distance d between screen and eyes is essential. However, viewing distances differ per device type. We used the following viewing distance settings in this analysis. Smartphone users maintain an average viewing distance of 32.2 cm when web browsing (Bababekova et al., 2011). Tablets and eBook readers are typically used at 50 cm distance (Shieh and Lee, 2007; Campbell, 2013). For PC use, the German Social Accident Insurance (DGUV) recommends a viewing distance of 50 and 65 cm (Deutsche Gesetzliche Unfallversicherung e.V. (DGUV), 2015). In this investigation, we assumed 50 cm for notebooks and 60 cm for desktop PC use. Investigations on TV use found the average viewing distance to be above 200 cm (Nathan et al., 1985; Lee, 2012).
4.2. Test Bench
We built a test bench to analyze light irradiance from screens under controlled ambient lighting conditions. The test bench included four different types of dimmable ambient light sources. Movie or PC use content was displayed on a computer screen to simulate different content types. Light irradiance was measured at a distance of 50 cm, where the recommended distance for screen use at the workplace is between 50 and 65 cm (Deutsche Gesetzliche Unfallversicherung e.V. (DGUV), 2015).
4.2.1. Sensing Approach
The test bench was constructed out of wooden boards and aluminum profiles forming a cuboid of 200 cm height with a footprint of 100 cm × 100 cm. The floor panel was mounted at a height of 40 cm from the ground leaving a distance from floor to ceiling of 160 cm. The height resembles the typical distance between table surface and ceiling lamps in office spaces. The screen was mounted at the rear end of the floor panel. Irradiance was measured at 50 cm distance, resembling the typical viewing distance of computer screens. A model of the test bench is shown in Figure 2A.
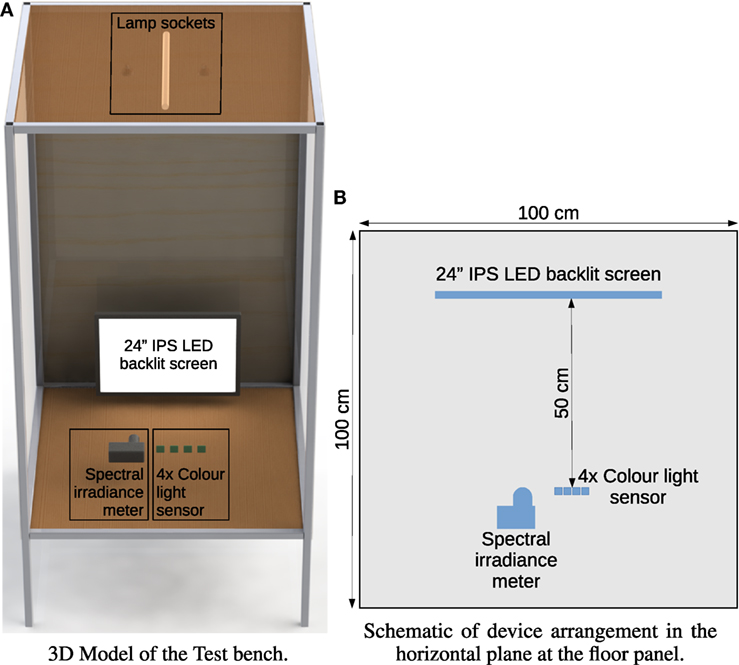
Figure 2. Test bench analysis. Different ambient light sources were mounted on the ceiling of the construction. On the floor panel screen use was simulated on a 24″ IPS LED-backlit screen. Four color light sensors were placed at 50 cm distance from the screen. Light irradiance reference measurements were recorded using a spectral irradiance meter. (A) 3D model of the test bench. (B) Schematic of device arrangement in the horizontal plane at the floor panel.
Initially, we analyzed the spectral irradiance of a typical LED-backlit screen. Here, we used the SpectraRad Xpress BSR112E-VIS miniature spectral irradiance meter by BWTEK. The recorded spectrum ranges from 380 to 750 nm wavelength with a resolution of 3 nm. Connected to a PC running the BWSpec software, samples were recorded at 26.3 Hz. Spectral measurements were averaged per second resulting in a sampling rate of 1 Hz. Dark calibration was conducted prior to recordings.
For test bench recordings, an HP EliteDisplay E241i 24″ IPS panel LED-backlit screen was used. The screen configuration was reset to factory default prior to recordings. Figure 3 depicts the spectrum of the screen with all pixels set to white. The three spectral peaks reflect the composition of the three primary colors: red, green, and blue. The intense blue peak is the characteristic for LED-backlit screens (Cajochen et al., 2011).
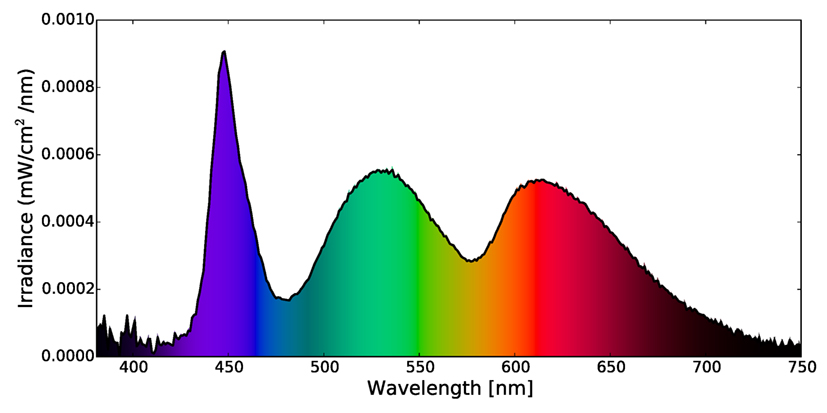
Figure 3. Test bench analysis. Spectrum of an HP EliteDisplay E241i 24″ LED-backlit IPS panel displaying a full white image. The spectrum was computed by averaging 26 samples from the spectral irradiance meter. It can be seen that the blue spectral component is more prominent than the green and red components.
Subsequently, we investigated the screen irradiance measured by a typical commercial color light sensor under different lighting conditions. Data from four TCS34725 (ams AG, 2013) color light sensors, the same as used in WISEglass, were recorded. We used four sensors to accommodate for intersensor variation. Each light sensor was connected to an Arduino via I2C bus and triggered an interrupt when a new measurement was ready. Sensor integration time was set to 50 ms resulting in a sampling rate of 20 Hz. Arduinos were connected to a computer running the CRNT software to record data (Bannach et al., 2008). Sensor gain was set to 60× resulting in a 27.6% saturation of the clear light channel at 1,000 lx indoors, a typical indoor light intensity on a sunny day. Figure 2B shows the installation on the floor panel of the test bench.
Three lamp sockets were mounted at the ceiling of the test bench for LED lamps, halogen lamps, and fluorescent lamps. We evaluated screen use detection using four different artificial light sources described in Table 1. The spectra of the lamps at full brightness are shown in Figure 4.
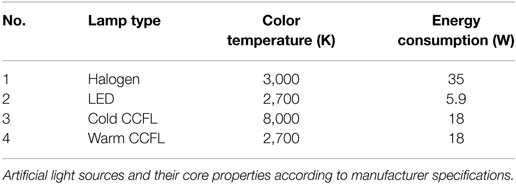
Table 1. Test bench analysis.
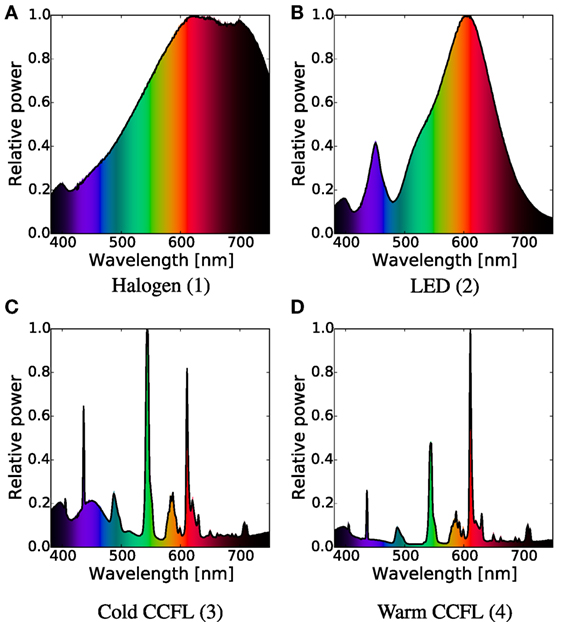
Figure 4. Test bench analysis. Spectra of the four different ambient light sources used. Spectral distribution differs per lamp type. CCFL lamps show few, relatively high-energy peaks. (A) Halogen (1), (B) LED (2), (C) cold CCFL (3), and (D) warm CCFL (4).
4.2.2. Recording Protocol
The test bench recording protocol contained three independent variables: screen state S, lamp type T, and lamp intensity D.
Screen state was set to one of the three following states: (1) off for not screen use S = off, (2) displaying TV content S = tv, or (3) displaying PC use content S = pc. To switch between S = off and S = tv, pc a xrandr script was used. The James Bond Spectre movie trailer was used to simulate TV content.1 To simulate PC content, a video tutorial on iPython notebooks was played.2 Videos were played in an endless loop.
The lamp type was either one of the four different lamps listed in Table 1 or darkness: T = {Halogen, LED, Cold CCFL, Warm CCFL, dark}. Lamp intensity was set to D = {100% …10%} in steps of 10%. We recorded 10 min of data for a total of S × T × D = 141 states (T = dark has no steps for D).
4.2.3. Evaluation Procedure
Starting from light measurements, we computed ratios between multiple color light sensor channels to become independent from absolute values. Each ratio represents one virtual light channel. Virtual light channels put each color channel in relation to others. For example, the virtual channel indicates the ratio of blue light vs. overall light intensity. We computed the virtual light channels , , , , , , , , , , , , , and , where R, G, B, and C represent the red, green, blue, and clear channel of the sensor, respectively.
Virtual light channel data were segmented using a sliding window. Different window sizes between 3 and 120 s were investigated while maintaining a fixed overlap of 50% of the window size. For each virtual light channel, 18 time domain features were calculated as listed in Figure 5, resulting in a total of 756 features per window. Features were standardized by removing mean and dividing by their SD.
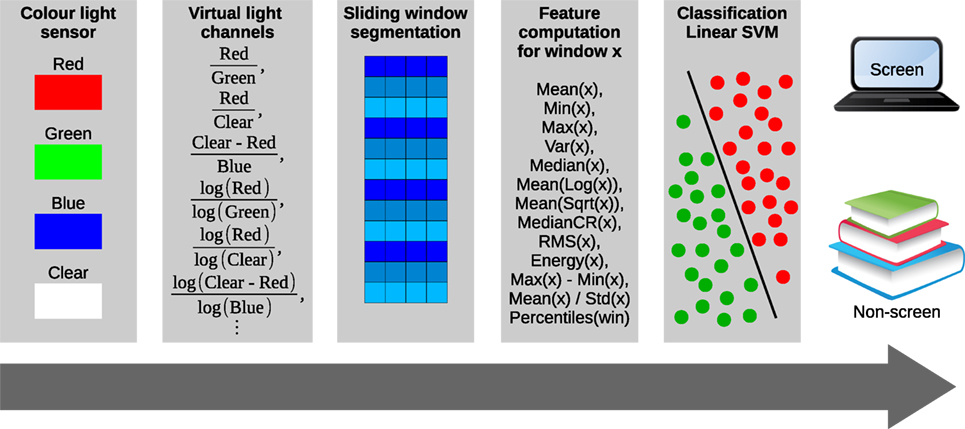
Figure 5. Data processing pipeline for light sensor data from raw color channel data to classifier output. Virtual light channels were computed from color light sensor data. After sliding window segmentation, features were extracted. In addition to features listed, the 5, 10, 25, 75, 90, and 95% percentiles were calculated. Subsequently, a linear support vector machine was used to classify screen use episodes.
A linear support vector machine (LSVM) was used to classify between screen use and no screen use. PC and TV states described in the protocol were considered as screen use class, thus making detection of screen use independent of the displayed content. After training the LSVM on data from all but one sensor, data from the remaining sensor were used for prediction. Figure 5 depicts the data-processing pipeline from raw sensor data to classifier output.
4.3. Lab Study
We evaluated screen use detection using WISEglass in the lab study. For all participants, we used the same viewing distances and devices, but did not control ambient light intensity. Fourteen participants (2 females, 12 males, between 20 and 39 years of age) were asked to read a print magazine, watch a documentary, and use a PC for 20 min per activity.
4.3.1. Sensing Approach
Color light sensor data were sampled and stored in flash memory with a sampling rate of 6.5 Hz and a gain factor of 1. Data were downloaded after each participant completed the protocol.
4.3.2. Recording Protocol
After arrival, the protocol was explained to participants in detail.
Participants would perform the following activities for 20 min each: (1) reading a print article, (2) watching a documentary about coffee on a 27″ Samsung SyncMaster P2770HD TV at 140 cm distance, and (3) browsing the Internet using an HP EliteDisplay E241i 24 in screen at 70 cm distance. The typical ergonomic distance is between 50 and 70 cm, where 50 cm was used in the test bench analysis. Figure 6 depicts the activities as performed by each participant.
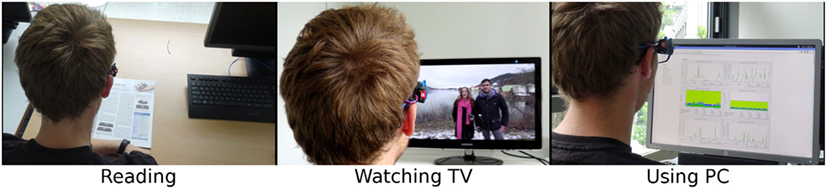
Figure 6. Lab study. Activities reading a print magazine, watching TV, and PC use were performed by participants for 20 min per activity.
Both screens were reset to factory defaults prior to recordings. Participants wore WISEglass during data recordings. Ambient light intensity was measured with a standard lux meter (AMPROBE LM-120) at the beginning of each recording. A total of 15.2 h of data were recorded during the lab study.
4.3.3. Evaluation Procedure
We applied the same evaluation procedure as described in Section 4.2.3 with the following changes. To reduce the number of features, mRMR (Peng et al., 2005) feature selection was applied. Different numbers of features were evaluated as described in Section 5. We used the same LSVM classifier as in the test bench but applied Leave-one-participant-Out (LOPO) cross-validation jointly for feature selection and classification.
4.4. ADL Study
To evaluate if screen use can be distinguished from other typical ADLs, we used data from a previous study. In total, nine participants (3 females, 6 males, between 20 and 27 years of age) were involved in the study. The ADL data set was recorded to evaluate activity recognition using the WISEglass inertial measurement unit (Wahl et al., 2015c).
4.4.1. Sensing Approach
Participants wore WISEglass for the duration of the recordings. Data from the light sensor were sampled and stored in flash memory at 6.5 Hz.
4.4.2. Recording Protocol
The study protocol was designed to include many typical ADLs across a regular day. Participants executed a scripted protocol while being followed by an observer labeling the data during recording time using the ACTLog application for Android (Spina et al., 2013). In total, 66.08 h of data were recorded. After arrival, the study protocol was explained in detail. Participants were compensated for their efforts with a 25 Euro Amazon voucher and three meals during the recordings. Data from two participants were excluded due to hardware issues during recordings leaving seven participants for the ADL analyses. Table 2 provides a listing of the performed ADLs, their total recording duration, and the activity cluster they belong to.
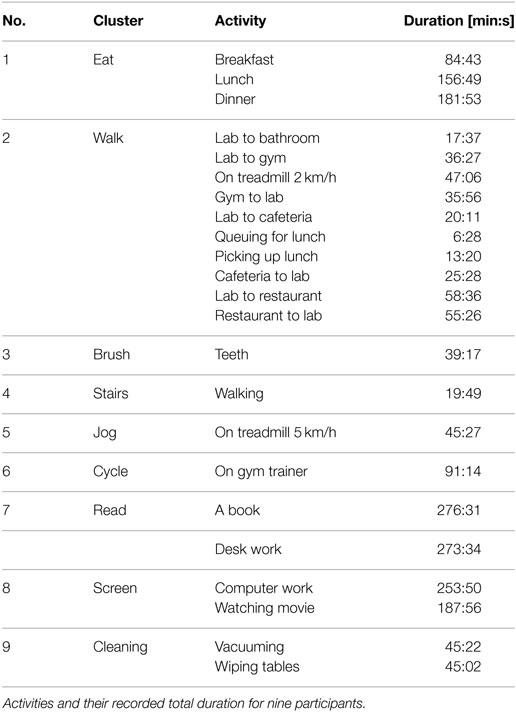
Table 2. ADL study.
To evaluate the detection of screen use, we used the computer work activity as the screen use class. We omitted data of the unlabeled class and from the watching a movie activity, where participants looked at a projector screen. Projectors are different from regular screen, use and this is not the goal of this work.
4.4.3. Evaluation Procedure
For the ADL study, we modified the evaluation procedure described in Section 4.2.3 and Section 4.3.3 as follows.
All results for the ADL data set were computed using the best 200 features selected by mRMR feature selection. Feature selection was performed on training data only for each validation fold.
The percentage of screen use in the ADL data set was approximately 11% of the entire data set. We applied downsampling to adapt the ratio of screen use per participant from 10 to 90% in steps of 10%. Downsampling was performed by randomly removing windows of 5 s of the desired class. To ensure stability of our results, we repeated the selection process 10 times per screen use ratio and averaged the results.
5. Results
In this section, we first analyze the impact of screen use depending on content and screen type. Subsequently, we present screen use evaluation results for test bench recordings, lab study, and ADL study.
5.1. Impact of Screen Content and Devices
For typical PC content, backgrounds are often white, resulting in a majority of pixels emitting light. For TV content, backgrounds are rather dark, resulting in a majority of pixels emitting little to no light. We measured irradiance using the reference spectrometer as described for the test bench investigation (Section 4.2) during PC use and watching TV activities and found average irradiance during PC use to be 3 times higher than for watching TV with 0.03 mW/cm2 for PC use and 0.01 mW/cm2 for watching TV. Thus, when using the same screen for watching TV at 200 cm distance, light exposure is 48 times lower compared to PC use at 50 cm distance.
Table 3 shows light intensity at the user’s eye for typical devices and content types. According to our results, PC use with a desktop setup has the highest light intensity at the user’s eyes and was thus investigated further. Light intensity is a primary consideration in this investigation, as intensities above 50 lx have substantial impact on the circadian phase (Wood et al., 2013). Overall, watching TV is less critical than PC use due to viewing distance and content type. Screen size was also important. While bright, smartphone screens are too small to critically influence circadian phase considering that light intensities are typically below 50 lx.
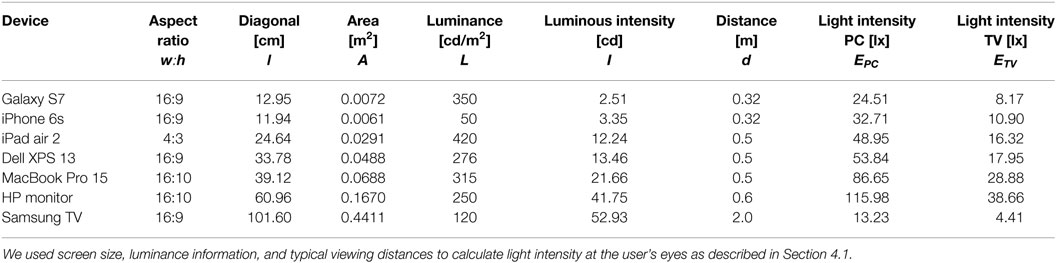
Table 3. Light intensity at the user’s eyes during PC use and watching TV for typical devices.
5.2. Test Bench Recordings
By using the extracted feature and LSVM classification, screen use could be detected independent of lamp type and ambient light intensity. Averaging over all lamp types, a receiver operating characteristic area under curve (ROC AUC) of ≈1 was achieved, indicating that screen use could be detected independent of the ambient light type. Table 4 summarizes the recognition results for the test bench recordings. For screen use ~199 h (66.6%) and for non-screen use ~99.5 h (33.3%) of data were used.
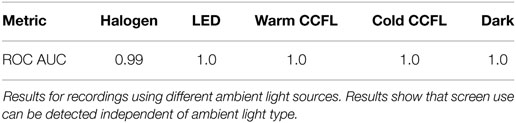
Table 4. Test bench.
5.3. Lab Study
We investigated the impact of window size on screen use detection performance for the Lab study data. For all window sizes, an ROC AUC was between 0.85 and 0.90. Windows of 5 s produced the largest ROC AUC at the shortest recognition delay. For an online implementation of screen use, detection recognition delay is crucial. Thus, we chose for 5-s windows for further analysis.
To analyze the impact of feature reduction on detection performance, we applied mRMR feature selection. Figure 7 shows the number of features used vs. ROC AUC performance. Using ≈70 or more features increased performance. For 200 features, results were stable with an average ROC AUC above 0.9.
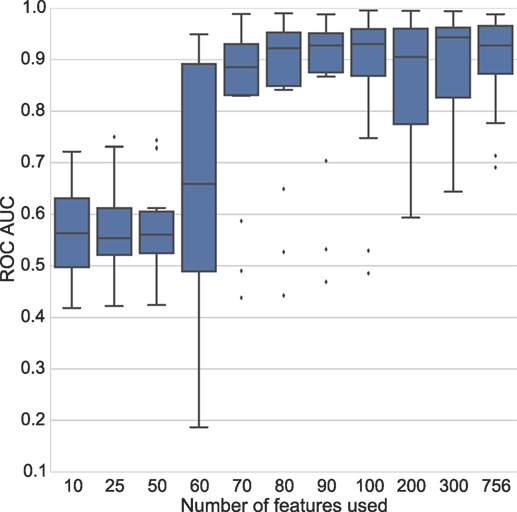
Figure 7. Lab study. ROC AUC vs. feature number is plotted where gray diamonds represent outliers. Performance drops when using less than ≈70 features.
Figure 8 shows ROC AUC over ambient light intensity. For 10 of 14 participants, an ROC AUC above 0.9 was achieved. In all 7 samples with an ambient light intensity below 200 lx, the ROC AUC was above 0.9. In 3 of 14 participants, ambient light intensity was above 500 lx, which is the recommended light intensity for working environments (Deutsche Gesetzliche Unfallversicherung e.V. (DGUV), 2015), and an ROC AUC dropped below 0.8.
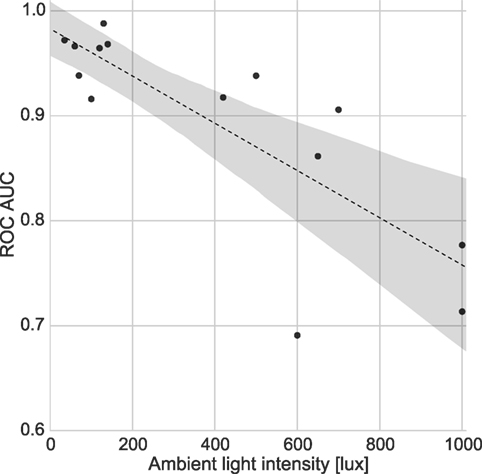
Figure 8. Lab study. Recognition performance over ambient light intensity. Each participant is represented by a dot. The dashed trend line shows the relationship between ambient light intensity and ROC AUC. The 95% confidence interval around the trend line is shaded gray. It can be seen that screen use detection performance decreased when ambient light intensity increased.
5.4. ADL Study
We evaluated screen use detection within a large variety of ADLs. Figure 9A depicts positive predictive value (PPV), true positive rate (TPR), and false positive rate (FPR) for different screen use percentages. It can be seen that PPV increases with screen use percentage from 0.45 to 0.98, while TPR and FPR did not show relevant changes.
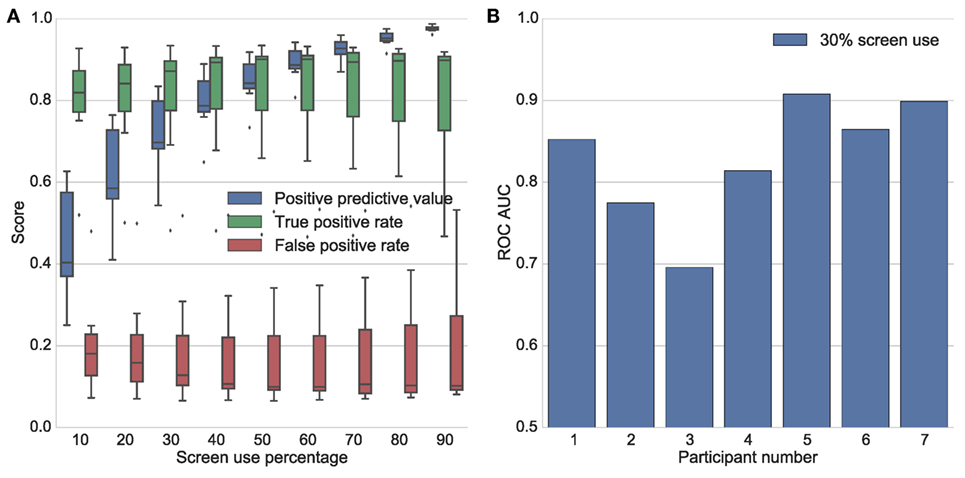
Figure 9. ADL study. (A) PPV, TPR, and FPR for 10–90% screen use. Gray diamonds represent outliers. (B) Per participant ROC AUC score at 30% screen use.
Figure 9B shows ROC AUC per participant for 30% screen use. For all participants, an ROC AUC was between 0.69 and 0.91 with an average of 0.83. ROC AUC performance was stable per participant.
6. Discussion
Today computers are on almost every desk, and the amount of work being digitalized is still growing. Further growth of screen use during the day and the evening may lead to circadian misalignment and an increase of people suffering from eyestrain. We thus expect that screen use above 30% is reasonable and potentially growing in the future. Our screen use detection results during ADL showed relevant performance with an average ROC AUC of 0.83 at 30% screen use.
Previous study protocols administered continuous screen use for 1–5 h (Cajochen et al., 2011; Heath et al., 2014; Chang et al., 2015; van der Lely et al., 2015) when investigating circadian phase shifts due to screen use. Wood et al. (2013) found measurable melatonin suppression after 2 h of tablet use. Our proposed detection only required 5 s of data, thus detecting screen use well before a measurable suppression of melatonin. Depending on real-time detection requirements, majority voting could be applied over multiple windows to smoothen the classifier result.
Circadian phase shift can be induced by light sources other than screens. For example, looking at a high-energy blue light source could also shift the circadian phase but may not be detected by our screen use detector. Smart eyeglasses measure light intensity for each spectral component and thus can measure different sources of phase shift. In contrast to other light sources, it is possible to minimize the risk of phase shift due to screen use by adapting the screen color profile. Therefore, the detection of screen use is of interest.
6.1. Performance Metrics
For screen use detection, a low false alarm rate is crucial as false alarms tend to frustrate users. While ROC AUC is a good performance measure for balanced data sets, we additionally derived precision of the screen use detection (PPV), correctly detected screen use (TPR), and falsely reported screen use (FPR). TPR reports the ratio of correctly detected screen use. FPR describes the ratio of falsely reported screen use. An ROC AUC is computed from TPR and FPR only and is thus insensitive to class skew (Fawcett, 2004). In unbalanced data, where screen use instances are rare (e.g., for 10% screen use), FPR can be low and TPR can be high, even though PPV is low.
6.2. Ambient Light
Our lab study showed that screen use detection works best for ambient light intensities below 200 lx. Interpreting light emitted by the screen as signal and ambient light as noise, an increase in ambient light adds noise, thus decreases signal-to-noise ratio. However, increased ambient light eliminates the need for screen use detection. For example, circadian phase shift induced by screen use typically occurs at low ambient light intensity only. Circadian phase response curves express impact of light exposure on circadian phase depending on its timing.
Light intensities span multiple orders of magnitude ranging from 0–1,000 lx indoors to more than 100,000 lx outdoors on a sunny day. Our screen detection approach is meant for indoor screen use. In outdoors, the sunlight already influences the circadian phase. ADL recordings included outdoor episodes of walking, and our system did not falsely report screen use due to the high brightness values.
Absolute light intensities differ depending on the environment, lamp type, viewing distance, content, time of day, and weather. Virtual light channels based on ratios of the different light color components made the feature space independent from absolute light intensities. Further calibration of the color light channels due to their different energy-related response was not needed, since the subsequent pattern analysis weights the features with respect to the classification task.
6.3. Screen Use Activities
In the test bench study, we combined PC and TV content into one screen use class to ensure that screen use could be detected independent of displayed content. For both content types, distance between screen and sensor was 50 cm. The combination of video content and close viewing distance could happen in deployment, e.g., when watching video content online using a notebook. However, our calculations (Table 3) showed that TV use, even at a short viewing distance, has no substantial impact on the circadian phase.
Section 5.1 reported on light intensity at the user’s eyes for different device and content types. Previous research investigated the influence of screen use on circadian phase (Cajochen et al., 2011) and found that screen use can induce circadian phase shifts. Wood et al. (2013) suggested 50 lx as the critical threshold for the circadian system. Our calculations showed that TVs, while typically being the largest screens used, produce less than 50 lx at the user’s eyes due to the large viewing distance. Typical TV content caused one-third of the irradiance compared to PC use. Heath et al. (2014) found that 1 h of tablet use prior to bedtime did not significantly impact circadian phase. While used at a close distance, smartphones and tablets are not large enough to reach the 50-lx threshold. PC use was the only combination of distance, content type, and screen size that could produce a light intensity of over 50 lx at the user’s eye. In contrast, the work of Chang et al. (2015) found significant melatonin suppression after 5 days of using a backlit eReader for 4 h prior to bedtime at 30 lx only. However, their control was reading a paper in ambient light conditions of less than 1 lx, the amount of ambient light in deep twilight. Such low light intensities might make reading difficult. We chose to investigate PC use with a desktop setup because it has the strongest light intensity at the user’s eyes.
6.4. Assumptions
We used PC work as the prototype activity for high irradiance screen use activities as we assumed it was the activity with yielding the highest light intensities at the user’s eyes. Typically during PC work, backgrounds are white, e.g., when editing a document or browsing the web, resulting in a majority of bright pixels.
Test bench results showed that screen use was detected well when sensors were mounted in a fixed position independent of the amount or type of artificial light, or the content being displayed on the screen. In reality, people move their head during screen use and sometimes look away from the screen for brief moments. Such movements are hard to annotate during an observational study and thus introduced noise to our screen detection. Head motion was clearly visible in the raw light sensor signal of the ADL study. Additional sensor information, e.g., from a motion sensor could be used to detect head motion and thus interruptions of screen use.
6.5. Practical Applications
Possible intervention measures have been investigated (Heath et al., 2014; van der Lely et al., 2015). The latest update of Apple iOS introduced a software feature to adapt screen color profiles to minimize unwanted circadian phase shifts. In this work, we showed that detecting screen use is feasible with the light sensor of smart eyeglasses. The screen use detection could be used to control the screen color profile.
Ambient monitoring methods could detect the presence in front of a desktop screen, e.g., camera-based face detection or ultrasound-based proximity detection (Jaramillo-Garcia et al., 2014). However, screen-based light intensity must be assigned to an individual user to implement alerts, where wearable systems are advantageous. In addition with wearable systems, privacy concerns could be easily addressed. An ambient monitoring solution requires one setup per screen, and the presence information alone is not sufficient to identify relevant screen illuminance as users may already use a software intervention tool, e.g., f.lux to adapt the screen’s spectral composition. In addition, a presence detector cannot distinguish between being next to and actually looking at a screen. With the light sensor embedded into the smart eyeglasses bridge, the wearable system captures a wearer’s field of view.
We intentionally chose eyeglasses as a sensing platform because regular eyeglasses are worn by many. Smart eyeglasses, like regular eyeglasses, are worn throughout the day. In contrast to head-worn light measurement devices such as the Daysimeter (Bierman et al., 2005), smart eyeglasses may be used for multiple applications (Amft et al., 2015). In contrast to other smart eyewear, where the focus is on interaction and displaying information, e.g., Google Glass, our work is focused on sensing. While the camera of Google Glass could be used as a color light sensor substitute, the larger power consumption may limit continuous use.
Detecting screen use is challenging as the screen-emitted light is distributed over the visible spectrum, with frequency components close to other light sources. Screen use was found to suppress evening rise in endogenous melatonin significantly and thus misaligning circadian rhythms (Cajochen et al., 2011). Screen use can also cause repetitive strain injuries (RSI), such as eye strain (The Vision Council of America, 2016). With our screen use detection, it is possible to support users by suggesting intervention measures when needed, including adapting a screen’s color profile to prevent circadian phase shifts and taking regular breaks to reduce RSI risks.
Screen use detection can be used beyond detecting impact on the circadian phase. Regular breaks are important to prevent eye strain, the most common repetitive strain injury (The Vision Council of America, 2016). Screen use detection can suggest breaks during computer work and remind users to implement the 20-20-20 rule: every 20 min of screen work take a 20-s break and look at something at least 20 feet away.
7. Conclusion
We introduced an approach for screen use detection based on a color light sensor embedded in smart eyeglasses and evaluated it on three studies. Our evaluation showed perfect results for the test bench analysis. Lab and ADL study results introduced noise due to head motion and ambient light variation.
Lab study results revealed that screen use detection performance is related to ambient light intensity. Screen use was detected with over 0.9 ROC AUC at an ambient light intensity below 200 lx. A data set of typical ADLs was used to further evaluate screen use detection. Screen use was detected with an average ROC AUC of 0.83 for 30% screen use. Detection performance was evaluated on person-independent models for lab and ADL data sets.
Our work could be applied to other wearables as few hardware components are required. A color light sensor, battery, and wireless interface could be embedded into smart jewelry, e.g., a brooch or necklace. However, it is essential that the light sensor’s field of view is aligned with the wearer’s eyes. Our screen use detection algorithm is independent of the sensor position.
The proposed system detected screen use quickly due to the short window size of 5 s. Screen use information could be used to prevent eye strain by reminding users to take regular breaks. Undesired impact of screen use, e.g., circadian phase shift, could be minimized by either notifying the user or (automatically) activating a software intervention measure, e.g., f.lux. We thus conclude that smart eyeglasses are a feasible platform for screen use detection.
Ethics Statement
Our lab study and ADL study were exempt as they were observational and non-invasive while privacy of participants was maintained. All recordings were stored anonymously meaning that names of participants were replaced by a participant ID. In the lab study, the total recording period was 1 h during which participants read, watched TV, and browsed the Internet. None of those activities posed a risk to the participants. ADL study recordings lasted approximately 10 h per participant. At all times, participants were supervised by a study manager. Typical activities of daily living were carried out, e.g., eating, sitting, walking that did not pose a risk to participants. In the lab study and the ADL study, we explained the protocol to participants in detail. Participants were then asked to sign a consent form prior to recordings. Participants knew it was possible to withdraw their consent and stop recordings at any time during recordings without facing any consequences. Not applicable as our population consisted of non-vulnerable, healthy adults only.
Author Contributions
FW and OA developed research question and study designs and wrote the manuscript. Data acquisition and analysis were done by FW and JK, guided by OA. JK commented on the manuscript.
Conflict of Interest Statement
The authors declare that the research was conducted in the absence of any commercial or financial relationships that could be construed as a potential conflict of interest.
Funding
This research was supported by the Dutch Technology Foundation STW under grant number 12184.
Footnotes
References
Amft, O., Wahl, F., Ishimaru, S., and Kunze, K. (2015). Making regular eyeglasses smart. IEEE Pervasive Comput. 14, 32–43. doi: 10.1109/MPRV.2015.60
ams AG. (2013). TCS34725. Available at: http://ams.com/eng/Products/Light-Sensors/Color-Sensor/TCS34725
Bababekova, Y., Rosenfield, M., Hue, J. E., and Huang, R. R. (2011). Font size and viewing distance of handheld smart phones. Optom. Vis. Sci. 88, 795–797. doi:10.1097/OPX.0b013e3182198792
Bannach, D., Amft, O., and Lukowicz, P. (2008). Rapid prototyping of activity recognition applications. IEEE Pervasive Comput. 7, 22–31. doi:10.1109/MPRV.2008.36
Bierman, A., Klein, T. R., and Rea, M. S. (2005). The Daysimeter: a device for measuring optical radiation as a stimulus for the human circadian system. Meas. Sci. Technol. 16, 2292–2299. doi:10.1088/0957-0233/16/11/023
Brainard, G. C., Hanifin, J. P., Greeson, J. M., Byrne, B., Glickman, G., Gerner, E., et al. (2001). Action spectrum for melatonin regulation in humans: evidence for a novel circadian photoreceptor. J. Neurosci. 21, 6405–6412.
Cajochen, C., Frey, S., Anders, D., Späti, J., Bues, M., Pross, A., et al. (2011). Evening exposure to a light-emitting diodes (LED)-backlit computer screen affects circadian physiology and cognitive performance. J. Appl. Physiol. 110, 1432–1438. doi:10.1152/japplphysiol.00165.2011
Campbell, A. (2013). How to Hold Your iPad. Available at: https://alastairc.ac/2013/02/how-to-hold-your-ipad/
Chang, A.-M., Aeschbach, D., Duffy, J. F., and Czeisler, C. A. (2015). Evening use of light-emitting eReaders negatively affects sleep, circadian timing, and next-morning alertness. Proc. Natl. Acad. Sci. U.S.A. 112, 1232–1237. doi:10.1073/pnas.1418490112
Deutsche Gesetzliche Unfallversicherung e.V. (DGUV). (2015). DGUV Information 215-410 – Bildschirm- und Büroarbeitsplätze Leitfaden für die Gestaltung. Berlin: Deutsche Gesetzliche Unfallversicherung e.V. (DGUV).
Duffy, J. F., and Wright, K. P. (2005). Entrainment of the human circadian system by light. J. Biol. Rhythms 20, 326–338. doi:10.1177/0748730405277983
eMarketer. (2016). US Adults Spend 5.5 Hours with Video Content Each Day. Available at: http://www.emarketer.com/Articles/Print.aspx?R=1012362
Fawcett, T. (2004). ROC Graphs: Notes and Practical Considerations for Researchers. Technical Report.
Heath, M., Sutherland, C., Bartel, K., Gradisar, M., Williamson, P., Lovato, N., et al. (2014). Does one hour of bright or short-wavelength filtered tablet screenlight have a meaningful effect on adolescents’ pre-bedtime alertness, sleep, and daytime functioning? Chronobiol. Int. 31, 496–505. doi:10.3109/07420528.2013.872121
Jaramillo-Garcia, P., Lopera Gonzalez, L. I., and Amft, O. (2014). Using implicit user feedback to balance energy consumption and user comfort of proximity-controlled computer screens. J. Ambient Intell. Hum. Comput. 6, 207–221. doi:10.1007/s12652-014-0222-2
Kantermann, T., and Roenneberg, T. (2009). Is light-at-night a health risk factor or a health risk predictor? Chronobiol. Int. 26, 1069–1074. doi:10.3109/07420520903223984
Lee, D.-S. (2012). Preferred viewing distance of liquid crystal high-definition television. Appl. Ergon. 43, 151–156. doi:10.1016/j.apergo.2011.04.007
Nathan, J. G., Anderson, D. R., Field, D. E., and Collins, P. (1985). Television viewing at home: distances and visual angles of children and adults. Hum. Factors J. Hum. Factors Ergon. Soc. 27, 467–476.
Peng, H., Long, F., and Ding, C. (2005). Feature selection based on mutual information criteria of max-dependency, max-relevance, and min-redundancy. IEEE Trans. Pattern Anal. Mach. Intell. 27, 1226–1238. doi:10.1109/TPAMI.2005.159
PresseBox. (2008). Deutsche sitzen lange vor dem Computer – BITKOM – Bundesverband Informationswirtschaft, Telekommunikation und neue Medien e.V. – Pressemitteilung. Available at: http://www.pressebox.de/?boxid=200275
Revell, V. L., and Eastman, C. I. (2005). How to trick mother nature into letting you fly around or stay up all night. J. Biol. Rhythms 20, 353–365. doi:10.1177/0748730405277233
Shieh, K.-K., and Lee, D.-S. (2007). Preferred viewing distance and screen angle of electronic paper displays. Appl. Ergon. 38, 601–608. doi:10.1016/j.apergo.2006.06.008
Spina, G., Roberts, F., Weppner, J., Lukowicz, P., and Amft, O. (2013). “CRNTC+: a smartphone-based sensor processing framework for prototyping personal healthcare applications,” in PH 2013: Proceedings of the 7th International Conference on Pervasive Computing Technologies for Healthcare (Venice: IEEE), 252–255.
van der Lely, S., Frey, S., Garbazza, C., Wirz-Justice, A., Jenni, O. G., Steiner, R., et al. (2015). Blue blocker glasses as a countermeasure for alerting effects of evening light-emitting diode screen exposure in male teenagers. J. Adolesc. Health 56, 113–119. doi:10.1016/j.jadohealth.2014.08.002
Wahl, F., Freund, M., and Amft, O. (2015a). “Using smart eyeglasses as a wearable game controller,” in Ubicomp 2015: Adjunct Proceedings of the 2015 ACM Conference on Pervasive and Ubiquitous Computing (Osaka: ACM), 377–380.
Wahl, F., Freund, M., and Amft, O. (2015b). “WISEglass: multi-purpose context-aware smart eyeglasses,” in Proceedings of the 2015 ACM International Symposium on Wearable Computers (Osaka: ACM), 159–160.
Wahl, F., Freund, M., and Amft, O. (2015c). “WISEglass: smart eyeglasses recognising context,” in Bodynets 2015: Proceedings of the International Conference on Body Area Networks (Sydney: ACM), 11–17.
Wahl, F., Kantermann, T., and Amft, O. (2014). “How much light do you get? Estimating daily light exposure using smartphones,” in ISWC 2014: Proceedings of the 2014 ACM International Symposium on Wearable Computers (Seattle: ACM), 43–46.
Wood, B., Rea, M. S., Plitnick, B., and Figueiro, M. G. (2013). Light level and duration of exposure determine the impact of self-luminous tablets on melatonin suppression. Appl. Ergon. 44, 237–240. doi:10.1016/j.apergo.2012.07.008
Keywords: eyewear, circadian clock, wearable sensor, activities of daily living, glasses, activity recognition, eye strain
Citation: Wahl F, Kasbauer J and Amft O (2017) Computer Screen Use Detection Using Smart Eyeglasses. Front. ICT 4:8. doi: 10.3389/fict.2017.00008
Received: 31 August 2016; Accepted: 13 April 2017;
Published: 05 May 2017
Edited by:
Koichi Kise, Osaka Prefecture University, JapanReviewed by:
Thuong Hoang, University of Melbourne, AustraliaKiyoshi Kiyokawa, Osaka University, Japan
Takashi Miyaki, Tokyo University, Japan
Copyright: © 2017 Wahl, Kasbauer and Amft. This is an open-access article distributed under the terms of the Creative Commons Attribution License (CC BY). The use, distribution or reproduction in other forums is permitted, provided the original author(s) or licensor are credited and that the original publication in this journal is cited, in accordance with accepted academic practice. No use, distribution or reproduction is permitted which does not comply with these terms.
*Correspondence: Florian Wahl, wahl@fim.uni-passau.de