Using Learning Analytics to Understand Scientific Modeling in the Classroom
 David Quigley
 Conor McNamara
 Jonathan Ostwald3
  Tamara Sumner
- 1Institute for Cognitive Science, University of Colorado Boulder, Boulder, CO, United States
- 2Department of Computer Science, University of Colorado Boulder, Boulder, CO, United States
- 3University Center for Atmospheric Research, Boulder, CO, United States
Scientific models represent ideas, processes, and phenomena by describing important components, characteristics, and interactions. Models are constructed across various scientific disciplines, such as the food web in biology, the water cycle in Earth science, or the structure of the solar system in astronomy. Models are central for scientists to understand phenomena, construct explanations, and communicate theories. Constructing and using models to explain scientific phenomena is also an essential practice in contemporary science classrooms. Our research explores new techniques for understanding scientific modeling and engagement with modeling practices. We work with students in secondary biology classrooms as they use a web-based software tool—EcoSurvey—to characterize organisms and their interrelationships found in their local ecosystem. We use learning analytics and machine learning techniques to answer the following questions: (1) How can we automatically measure the extent to which students’ scientific models support complete explanations of phenomena? (2) How does the design of student modeling tools influence the complexity and completeness of students’ models? (3) How do clickstreams reflect and differentiate student engagement with modeling practices? We analyzed EcoSurvey usage data collected from two different deployments with over 1,000 secondary students across a large urban school district. We observe large variations in the completeness and complexity of student models, and large variations in their iterative refinement processes. These differences reveal that certain key model features are highly predictive of other aspects of the model. We also observe large differences in student modeling practices across different classrooms and teachers. We can predict a student’s teacher based on the observed modeling practices with a high degree of accuracy without significant tuning of the predictive model. These results highlight the value of this approach for extending our understanding of student engagement with scientific modeling, an important contemporary science practice, as well as the potential value of analytics for identifying critical differences in classroom implementation.
1. Introduction
Scientific models represent ideas, processes, and phenomena by describing important components, their characteristics, and their interactions. Models are constructed across a broad spectrum of scientific disciplines, such as the food web in biology, the water cycle in Earth science, or the structure of the solar system in astronomy. Models are central to the work of scientists for understanding phenomena, and for constructing and communicating theories. Constructing and using models to explain scientific phenomena is also an essential practice in contemporary science classrooms. In A Framework for K–12 Science Education (National Research, 2012), developing and using models is one of the eight core practices deemed essential for science learning and instruction. According to the Framework, “[s]cientists use models… to represent their current understanding of a system (or parts of a system) under study, to aid in the development of questions and explanations, to generate data that can be used to make predictions, and to communicate ideas to others” (National Research, 2012).
Scientific models can take many forms, such as textual descriptions, visual diagrams, computer simulations, and mathematical equations. For instance, in elementary physical science, Schwarz et al. (2009) studied the development of students’ modeling practices by having students sketch models depicting how light interacts with objects to produce shadows. Bryce et al. (2016) asked students to construct a clay model of a cell. Even these simple modeling activities push students to represent their current knowledge and to use this knowledge to explain new phenomena. Models are often more complex, involving visual representations or computer simulations. Such models may focus on the complex interactions between components (e.g., predator–prey interactions in a food web) or depict how a substance changes state over time (e.g., how water changes from liquid to gas as it moves through stages in the water cycle).
However, while it is widely recognized that developing students’ modeling skills is important, learning sciences research has documented numerous challenges to implementation in the classroom. These challenges include variations in how teachers approach the topic of modeling (Krajcik et al., 1998; Jordan et al., 2017) and variations in how students engage with the practices (Schwarz et al., 2009; Bryce et al., 2016). Variations in classroom implementation can lead to differences in students’ opportunities to learn these important modeling practices (McDonnell, 1995).
Learning analytics can play a valuable role in understanding these differences in opportunities to learn. By focusing on how data streams can be used to characterize learner activity and understanding, researchers have been creating adaptive and responsive systems that leverage new insights to improve the learning experience for those students who need support. This approach has been leveraged in many learning scenarios (e.g., Chiu et al., 2017; Holstein et al., 2017) but has seen limited application in scientific modeling.
In this research, we study the development of student modeling practices using digital modeling tools in secondary biology classrooms. In these classrooms, students used a web-based software tool—EcoSurvey—to characterize organisms and their interrelationships found in their local urban ecosystem. Students use EcoSurvey to: (1) photograph, map, and characterize local species, (2) document how species interact around shared resources such as food, and (3) identify resources and species that are important to the resilience of their environment. EcoSurvey follows in a rich tradition of computer-based modeling tools (e.g., Soloway et al., 1997; Fretz et al., 2002; Ketelhut et al., 2010). These digital modeling tools provide built-in affordances that foreground important scientific modeling practices, and are explicitly designed to scaffold students’ modeling activities, through the careful design of the interface and prompts promoting reflection and appropriate action (Fretz et al., 2002; Quintana et al., 2004). As such, they support students to develop more complex models that would be difficult to create using traditional tools and these models can be quickly revised thanks to their digital nature.
Digital modeling tools also provide an opportunity for instrumentation to unobtrusively capture usage. Reflecting contemporary software architectures, EcoSurvey is a cloud-based software tool, where all changes and refinements to student models are centrally captured and stored, providing researchers with a fine-grained record of student modeling practices at scale, across potentially thousands of students in a wide range of classroom settings. These rich data offer opportunities for new learning analytic methods to better characterize student scientific modeling practices and to examine classroom level differences. In this article, we use learning analytics and machine learning techniques to answer the following questions:
(1) How can we automatically measure the extent to which students’ scientific models support complete explanations of phenomena?
(2) How does the design of student modeling tools influence the complexity and completeness of students’ models?
(3) How do clickstreams reflect and differentiate student engagement with modeling practices?
We analyzed EcoSurvey usage data collected from over 1,000 secondary students across two deployments. In the first deployment, we observed large variations in the completeness and complexity of student models, and large variations in their iterative refinement processes. We also observed large differences in student modeling practices across different classrooms and teachers, and we were able to predict a student’s teacher based on the observed modeling practices with a high degree of accuracy without significant tuning of the predictive model. In our second deployment, we saw improvements in the completeness and complexity of students’ models, suggesting benefits from improvements in modeling tool design.
These results highlight the value of this approach for extending our understanding of student engagement with scientific modeling, as well as the potential value of analytics for identifying critical differences in classroom implementation. These results shed light on potential improvements in tools and curricula. Before discussing our approach and results further, we first present the education and learning sciences theories underpinning this work and describe our research context and the EcoSurvey tool in more detail.
2. Related Work
2.1. Scientific Models That Support Complete Explanations of Phenomena
Scientific models are tools for explanation and prediction. A complete scientific explanation should “explain observed relationships between variables and describe the mechanisms that support cause and effect inferences about them” (National Research, 2012). Thus, to support student explanations, a scientific model of a phenomenon should include important components (“variables”), their interactions (“relationships”), and define the mechanisms involved. This approach is similar to the Structure–Behavior–Function model (SBF; Hmelo-Silver et al., 2007). However, the focus on interactions in our approach allows for more abstract relationships that do not rely on one particular behavior or function.
When modeling an ecosystem, these correspond to the organisms in the ecosystem (animals, plants, insects, fungi, etc.), how these organisms interact with each other and the environment (predator, prey, producer, decomposer, etc.), and the involved processes (abiotic, biotic, etc.). Professional biologists use this information to measure the biodiversity of an ecosystem in terms of species richness, evenness, and divergence (Holling, 1973; Gunderson, 2000; Mason et al., 2005).
In this work, we characterize variation in students’ models by examining the number of organisms present, the various types of organisms present, the number of interactions between organisms that students have identified, and the diversity of these interaction types. We also look at how these features are distributed within a model. These measures are used to understand the complexity of a student model. This approach is similar to prior research understanding student models, particularly work from Jordan et al. (2017). Our approach to analyzing student models primarily differs from the focus on components and interactions rather than using the SBF framework. This change allows us to automatically characterize the different pieces of models, which can be used to support real-time analysis and feedback in the future.
Interestingly, understanding the complexity of an ecosystem has been shown to support students to develop empathy and other affective stances toward nature (Kellert and Wilson, 1995). Student understanding the flow of matter and energy through ecosystems has also been shown to vary strongly across cultural boundaries (Bang et al., 2007), providing further motivation for supporting equitable opportunities to learn scientific modeling.
2.2. Strong Student Scientific Modeling Practices
Constructing scientific models is part of the “inquiry” tradition in science education, where students learn scientific concepts through hands-on “doing” (Kolodner et al., 2003). Understanding what students are doing at a fine-grained level can provide teachers with useful insights into learning processes, as well as provide teachers with feedback as to where and when students need additional assistance. Toward this end, several scholars have developed frameworks characterizing effective student modeling practices (Schwarz et al., 2009; Bryce et al., 2016). Schwarz et al. (2009) identify a series of the following seven practices: (1) identifying the anchoring phenomena to be modeled, (2) constructing a model, (3) testing the model, (4) evaluating a model, (5) comparing the model against other ideas, (6) revising the model, and (7) using the model to predict or explain phenomena. Bryce et al. (2016) identify a similar set of practices as important to support student learning during modeling, namely, (1) observation (paralleling the anchoring phenomena), (2) model construction, (3) model use, (4) model evaluation, and (5) model revision. Their research suggests that supporting students to engage in these practices can lead to positive learning outcomes (Schwarz et al., 2009).
Here, we focus on a subset of these practices—constructing, evaluating, revising, and using models—incorporating them into our analysis framework (Cukurova et al., 2016). We focus on these four practices as they are directly supported through the EcoSurvey interface and can be readily observed and tracked in the usage log. In addition to these four practices, we examine the degree to which students engaged in iterative design of their models. Iteration occurs when students cycle between the other four modeling practices, where the four practices correspond directly to individual actions in the EcoSurvey interface, such as adding an organism or relationship (construction), editing an organism or relationship (revision), or generating a graph of the entire ecosystem to support explanations (using). Iteration is an important modeling practice that is used to both expand the scope of a model and to improve its accuracy (Homer, 1996; Bryce et al., 2016). Learning analytic techniques are used to identify the degree to which students used these practices and to examine variations in student modeling practices. While these usage log analysis methods are an excellent passive way to collect data on student practices (Pelánek et al., 2016), it is important to note that these methods do not capture information about how students are reasoning with their models. Exploring student reasoning with models and how they generate explanation using models is beyond the scope of this study and would require deep exploration of students’ cognitive processes using think-alouds, cognitive interviews or other learning and cognitive sciences research methods (e.g., Schauble et al., 1995).
2.3. Learning Analytics of Student Activity
Understanding student activity is an active area of Learning Analytics research. There is a large body of work focused on detecting students’ skill acquisition using digital tools. One example of this is a study focused on young students’ ability to make numeric and fractional estimates in a number line game. In this study, they found significant gains in student accuracy over time.
One important area of research around understanding student activity focuses on detecting variance between students as a predictor of future activity. One example is Park et al. (2017), understanding student use of online classroom resources using features drawn from student clickstreams. These features focus on generalizing beyond the course content, focusing on simple frequency measures (e.g., number of clicks per day) and abstractions of how the content accessed relates to the course schedule, determining whether the content being accessed is being “previewed” or “reviewed.” The team used these metrics to categorize whether students’ engagement with online resources increased, decreased, or stayed the same, creating three different categories of students. Overall, they found that students who specifically increased their engagement with the tool had a better success rate in the class.
While these aggregate features are useful in understanding activity, another approach to understanding this activity and variance is the use of sequence modeling (Xing et al., 2010). This approach focuses on a fine-grained distinction of different activities and analyzes patterns in how activities lead into one another. This approach parallels that used by d’Aquin and Jay (2013), where they used sequential pattern mining to study student course enrollment patterns.
These innovations inspire my approach to analyzing student engagement with modeling practices. By adapting the approaches of aggregate activity and sequence analysis to scientific modeling in the classroom, I develop new insights into how students participate in this crucial activity.
2.4. Scaffolds
Scaffolding, or the use of external supports to help a person accomplish a task, is a common approach in the learning sciences. Vygotsky (1980) discussed such supports when describing the zone of proximal development for apprentices in trade fields. Scaffolds are natural extensions of this idea, tools that support a learner in this process, providing guidance or removing levels of complexity from the problem. These scaffolds can then be removed from the application, setting, or activity when the learner is ready to move on.
This scaffolding approach has been adopted in software-supported learning scenarios (e.g., Quintana et al., 2004; Gadiraju and Dietze, 2017). One particular line of work has focused on digital applications that support scientific inquiry. Quintana et al. (2004) describe the following three phases of scaffolding scientific inquiry:
(1) Characterizing the cognitive tasks, social interactions, tools, and artifacts that constitute the scientific practices in which learners are engaged.
(2) Characterizing the aspects of these practices in which learners encounter obstacles.
(3) Characterizing scaffolding guidelines that specify ways that tools can alter the task to address the obstacles by helping make tasks more tractable and productive for learners.
Our work naturally builds on these guidelines. By focusing the design of EcoSurvey around the practices outlined in learning science literature on modeling in the classroom, we naturally connect to the real practices of the task. Our analytics are designed to automatically measure how successful students are at engaging with these practices and the points at which students run into difficulty. We have used this feedback in design, and our results show that students are using the revised modeling tool to create more complete models of their local ecosystem.
3. Context
EcoSurvey was developed as part of a larger collaborative design-based research project called the Inquiry Hub, which is focused on supporting teachers in developing student-centered approaches to curriculum and teaching (Penuel et al., 2016; Severance et al., 2016). Inquiry Hub Biology is a digital high school biology curriculum developed in partnership with a large urban school district in the Midwestern United States. Within the ecosystems unit of this curriculum, students are asked to choose a tree to plant on their school grounds or other designated site that will improve their local ecosystem’s biodiversity and resilience. Classes use EcoSurvey to create a collective model of their local ecosystem. They use these models to provide evidence and construct arguments to support their choice about the type of tree they choose to plant. The recommended type of tree is then planted on the site, in collaboration with the local Parks and Recreation Department, based on the students’ arguments and evidence. Thus, the models students create using EcoSurvey support them to construct arguments with real world consequences. To illustrate the use of EcoSurvey within this context, we follow the experience of Maria, a fictional student in Ms. Smith’s 3rd period class.
3.1. Data Collection and Creating the Model
Ms. Smith instructs students to map the ecosystem within a selected site on their school grounds or in the local area, taking pictures and making field notes on the organisms and interactions between organisms that they observe. Maria’s group makes observations along the creek that runs next to the school. They find a lady beetle, a honey locust tree, some mushrooms, a gray squirrel, and a few other organisms. Using their smartphones, they take pictures of these organisms and upload them to EcoSurvey, creating a “card” for each organism while out in the field. Each card automatically captures information about the date, time, and location of the observation being recorded. Cards also include a “relations” field to capture interactions between organisms and information about the organism’s role in the ecosystem. Students begin entering this information as they observe it in the field, and then continue to augment this information back in the classroom through additional research. In Figure 1, we see Maria’s lady beetle card under construction. While in the field, she created the card, uploaded a picture, and added details about interactions they saw. At the same time, her team members are also creating cards for other organisms they are observing.
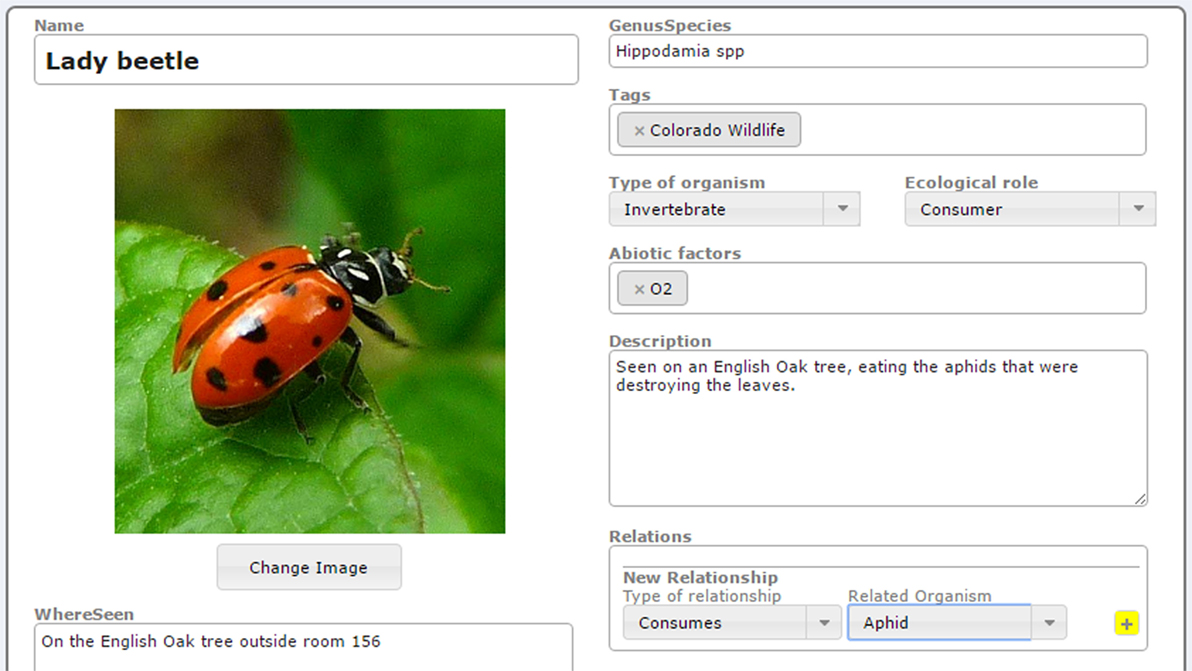
Figure 1. The edit view for Maria’s Lady Beetle card.
3.2. Evaluating the Model
As students create cards, their organisms are added to a shared class “survey.” The survey view shows all of the organism cards and their detailed information, ordered by how recently they were edited. Maria can see that her classmates have created many cards, including a Blue Jay card (Figure 2).
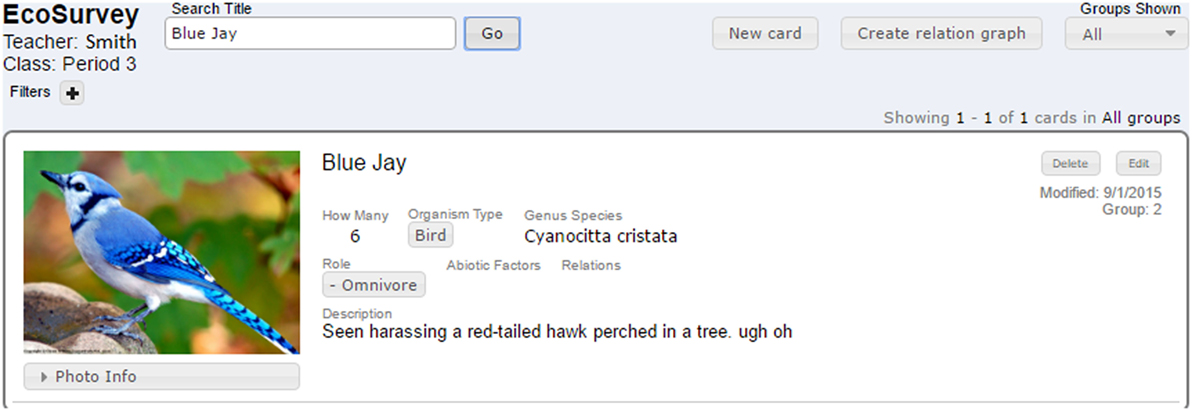
Figure 2. The main view of Ms. Smith’s class survey.
Ms. Smith organizes the student groups into pairs and asks each group to review the other’s cards for correctness and completeness. Maria’s group is paired with Group 2, who completed several cards. Andre, a member of Group 2, asks Maria to first review the blue jay card he created. Maria uses the search feature of the survey view to quickly find the blue jay among the cards. She notices that this card is missing many details, including interactions with other organisms.
3.3. Revising the Model
Maria recommends that Group 2 do further research into how the blue jay contributes to the local ecosystem. She also takes the chance to update her group’s honey locust card. She discovered that blue jays nest in honey locust trees during her earlier research. She did not realize that their school ecosystem included blue jays until she reviewed the work of her classmates, as her group did not see one. Once Maria has completed editing her group’s cards, she continues her review of Group 2’s cards. She uses the group select function to view only the cards created by members of Group 2.
Group 2 notices that two people in Maria’s group created duplicate lady beetle cards. Maria decides to add her lady beetle information to the other card, since it is more detailed, and uses the delete function to remove her lady beetle card from the model.
3.4. Iterating the Model
In reviewing Group 2 cards, Maria sees a card for geese, but notices that the group did not add a predatory relationship to grass, even though she observed geese eat the grass on the soccer field. She uses the search functionality and discovers that no one in class created a card to document grass as an observed organism. Maria adds a new card for grass and includes a predatory-prey relationship with geese. By cycling back through earlier modeling practices (creating new cards), Maria is iteratively improving the class model to be more complete and accurate.
3.5. Using the Model
Once the class has created a robust model of their local ecosystem, students use this model to construct arguments for choosing a particular tree to plant. Maria presses the “create relation graph” button, which generates the graph representation of the model and exports it to a digital graphing tool (Figure 3). Maria and her team study the resulting diagram that enables them to visualize the relationships (links) between all the organisms (nodes) they have cataloged. It is clear from looking at her graph that the English Oak trees are an important keystone species in their site, involved in a large number of relationships with a wide variety of organisms. The geospatial locations in the observational data indicate that there are only two English Oak trees located in their site; Maria and her group recommend planting an additional tree of this type.
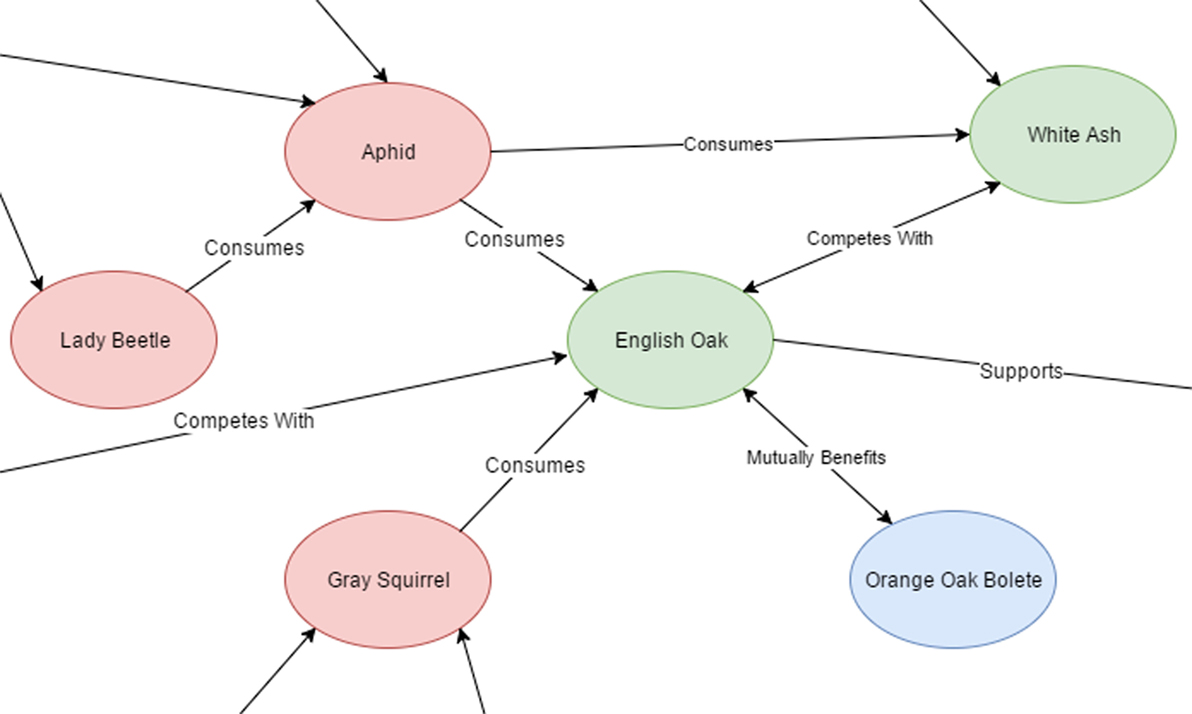
Figure 3. A section of Maria’s final graph.
Maria’s scenario illustrates how EcoSurvey supports students to engage in the practices of creating, evaluating, revising, iterating, and using models. To use a learning analytics approach to study modeling practices, we must map specific actions, or sequences of actions, taken in the EcoSurvey interface to specific modeling practices. Table 1 describes the mapping between modeling practices and specific EcoSurvey interface actions that we use in our analyses. As students interact with EcoSurvey, the system captures and logs each of the actions shown in Table 1. Each log entry includes the time, user, survey, and action type.
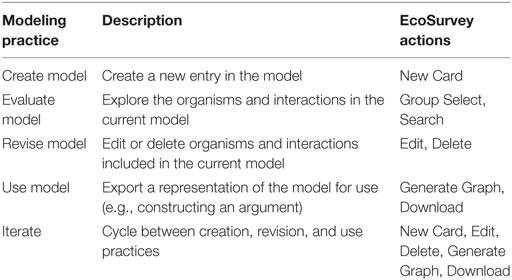
Table 1. EcoSurvey actions.
3.6. EcoSurvey Design Iteration
Consistent with a design-based research approach, we are iteratively improving the design of the EcoSurvey tool and the supporting curriculum after each field deployment. Classroom observations, feedback from users, and analysis of the usage patterns from the first version drove several important changes.
The foremost change is the redesign of the survey view, incorporating the graph representation of the model into the students’ main workflow as seen in Figure 4. This view presents the model as a collection of components (organisms) and interactions (relationships). This development grew from results from our first deployment that students failed to engage with relationships for many organisms in their models, and many classrooms showed limited engagement with exporting their models to the graph view. Therefore, we designed the graph layout to emphasize the relationships between organisms, naturally promoting the task of adding relationships to disconnected cards.
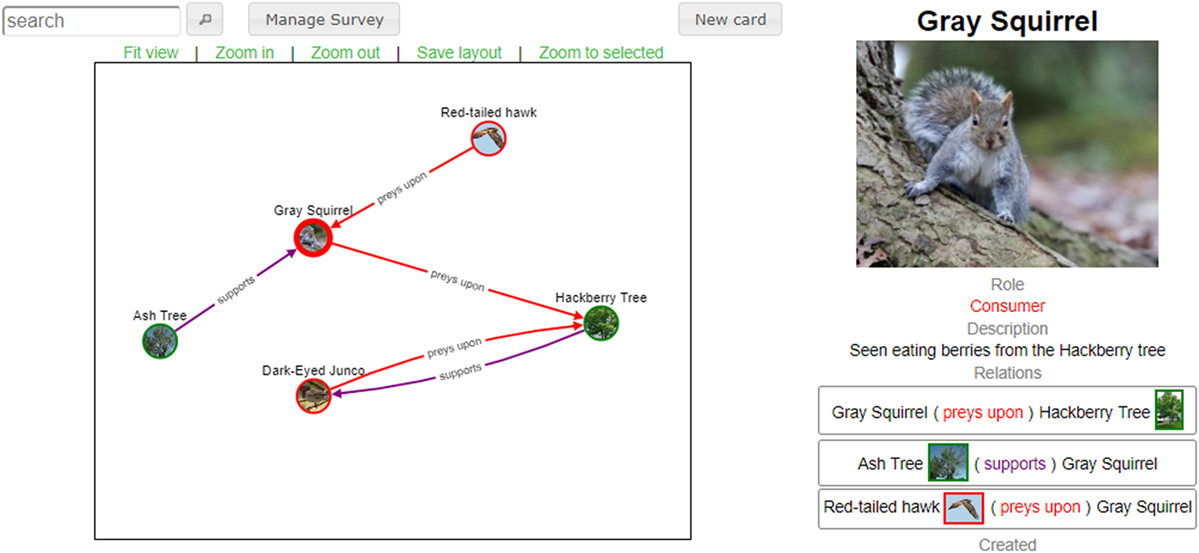
Figure 4. The graph view in version 2.
The second change we made was to the types of relationships that could be added as seen in Figure 5. In the first version, the relationship field was open and would accept any response. This led to a wide variety of responses, many of which did not accurately reflect possible relationships (e.g., “brown trout” is not a relationship type). While we normalized the relationships for analysis (as discussed below), this still left a large number of “unknown” relationships. By using a closed list of relationship options based on language from the science standards, version 2 of EcoSurvey scaffolds student model development and scientific understanding by driving them to consider how their intuitive representation of the relationship maps to the terms used by scholars in the field.
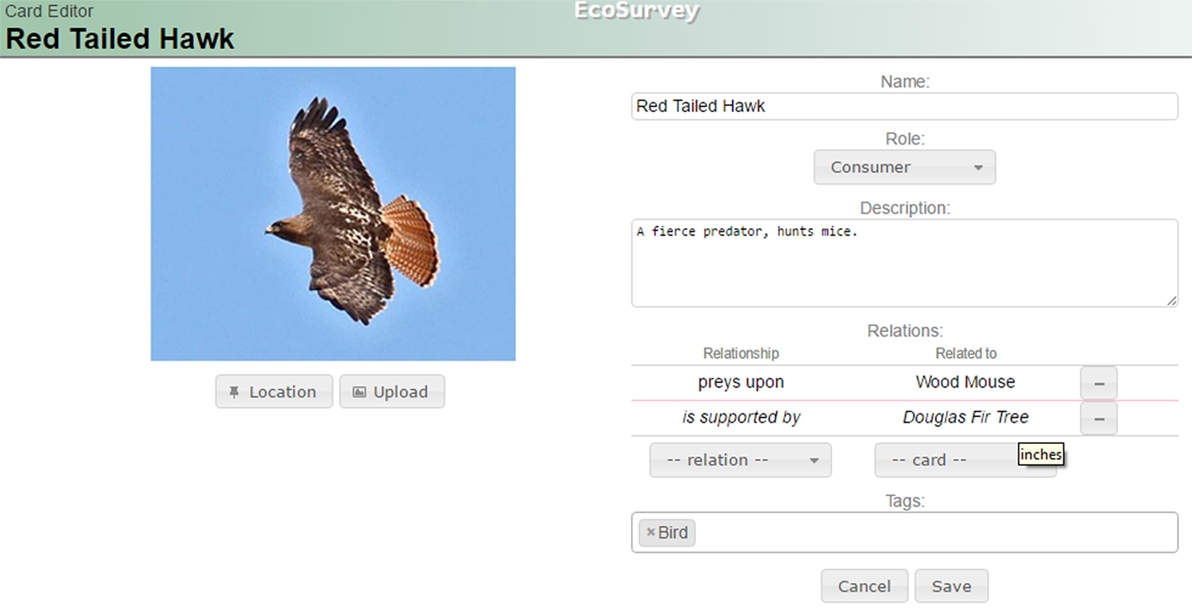
Figure 5. The card edit view in version 2.
4. Methods
Here, we describe data used in our analyses as well as the specific analytic techniques used to answer each of our three research questions.
This study was reviewed and approved by the University of Colorado Boulder Institutional Review Board, and all activities were conducted according to their rules and guidelines. Teachers gave written informed consent, and all student data were collected anonymously in the course of normal classroom activities. The University of Colorado Boulder Institutional Review Board waived the need for written informed consent to be obtained from the students’ parents/legal guardians. All teachers’ names are pseudonyms.
4.1. Study Data
The work presented here builds on two deployments, one of each version of EcoSurvey. Both deployments took place in the same district and with the same professional development routines. However, the data we have analyzed for each deployment used a separate cadre of teachers, which allows us to avoid effects due to previous experience with using EcoSurvey in the classroom.
For our first deployment, EcoSurvey usage log data were collected across 10 high school classrooms during Fall 2015. A total of 9 models were created, which included 586 organism cards and 545 interactions. Our second deployment in Fall 2016 featured final models from students in 35 classes across 11 teachers. These models included 4,136 organism cards and 4,701 interactions.
The deployment of the first version of EcoSurvey also incorporated activity logging. From the sample, we recorded actions for 204 students generating 3,160 action logs, whereas 58 students did not record any activity. All classrooms in both samples followed a 3:1 device deployment where three students used one laptop together; thus it is not surprising that there are students with no recorded activity.
4.2. Model Complexity Analysis
Our first research question examines variation within student models, focusing specifically on the richness of students’ models in terms of the number of organisms and their relationships. We analyze the relative number of organisms and interactions within each class survey. We also look at the balance of interactions per organism by evaluating both the average number of interactions per organism and variance in the distribution of interactions. Examining variance allows us to distinguish different patterns in the assignment of interactions to organisms. Some classes may create models where most organisms have a similar number of interactions, whereas other classes may create models where only a few organisms have been assigned many interactions.
We also analyze the distribution of relationship types using evenness. This measure considers how each type of relationship is represented within the survey. We calculated evenness using the Shannon index, the same formula for species evenness in the study of ecosystems (Shannon and Weaver, 1998). The Shannon index gives an evenness score from zero to one. A survey with an equal number of relationships of each type would have a perfect evenness score of one. Conversely, a survey with many predator–prey relationships and few others would have a low program type evenness score. The Shannon index is calculated using the following formula:
where
where pi = proportion of relationships of type i in the surveys and
where Si = total number of relationships in the surveys.
4.3. Influence of Tool Design on Models
Our second research question seeks to understand how design changes in digital modeling tools can have an impact on students’ models. These measures are important for the iterative process of our design-based research approach, providing evidence of what impact the design changes have on students’ models.
To evaluate the impacts of design, we aim to compare directly across deployments of different versions of EcoSurvey. We run the same statistical comparisons for each version and compare across conditions. In cases where direct comparison of means and variance is possible, we use a standard Student’s t-test (Student, 1908) to determine significance.
4.4. Variation in Modeling Practices
Our last research question examines variation in student modeling practices, focusing on action variety, frequency, and iteration. Action variety refers to the range of actions a student performed. For example, some students may have only created and edited cards, whereas others may have used the full range of EcoSurvey actions. Frequency refers to the total number of actions completed by an individual student and the number of usage sessions they engaged in. Sessions are defined by a series of actions from a single user without a large break in activity (greater than 2 h). Defining a session using a 2 h gap allows for any student activity within a long class period to occur within one session; several of our classrooms employ 1.5 h block periods.
To characterize iteration practices, we look for evidence of design cycles within the log information. Design cycles can be recognized when students engage in multiple sequences of construct–revise–use practices. This focus on a sequence of practices is consistent with Schwarz et al. (2009), which characterized modeling practices as a series of steps. By extension, a design cycle consists of returning to a previous modeling step after moving on in the sequence (e.g., creating a new card after editing a different card). We counted the number of cycles as a measure of iteration.
Combined, these three metrics—action variety, frequency, and iteration—yield an eight feature vector for each student consisting of total number of EcoSurvey actions, total number of create actions, total number of evaluate actions, total number of revise actions, total number of use actions, total number of EcoSurvey action types taken, number of sessions, and number of iterations. We combined the feature vectors for students with the same teacher, and performed a Kruskal–Wallis H test (Kruskal and Wallis, 1952) for each feature to determine differences between teachers. A Kruskal–Wallis H test is a non-parametric adaptation of an ANOVA to compare samples of different sizes, as we have in our groups. We further explored these differences using Tukey’s HSD test (Tukey, 1949) to test the significance of pairwise differences between teachers.
4.5. Predictive Value of Modeling Practices
This understanding of modeling practice allows us to characterize the variation in student activity in EcoSurvey. To expand on this characterization, we examine the degree to which we can use sequences of student modeling actions to predict that student’s teacher. We plan to use this prediction in a support system for students and teachers embedded within the tool.
For this prediction task, we use the previously described features of variety, frequency, and iteration as well as automatically extracted sequence patterns. In our work, a sequence pattern consists of a series of EcoSurvey actions (e.g., “New Card,” “Edit,” “Generate Graph”) embedded within a student’s complete action log. To extract sequence patterns, we used the Colibri Core (van Gompel and van den Bosch, 2016) software package. This software package, originally designed for natural language processing tasks, treats every action as a token and determines the frequency of consecutive token sequences (n-grams) from student usage logs. These token sequences can include wildcard actions (skip-grams). For instance, the software will extract the sequence “New Card,” “Edit,” “Generate Graph” as either an n-gram or as the skip-gram “New Card,” {*}, “Generate Graph.” This skip-gram will capture similar sequence patterns, where one action occurs between New Card and Generate Graph actions. This yielded 2,893 unique sequence patterns, which occurred at least three times, across all student usage logs. Once we extracted these sequence patterns, we used them as a new series of features to augment each student’s existing feature vector.
To understand which features that characterize a student’s modeling actions are most predictive of his or her teacher, we input subsets of each student’s feature vector into four Naive Bayes classifiers using Weka (Hall et al., 2009). The first classifier used the eight features related to variety, frequency, and iteration of actions. The second classifier used the full set of sequence pattern extracted by Colibri Core for each student. The third classifier implemented a best-first search (Hall and Holmes, 2003), which automatically reduced the full set of sequence patterns to the eighteen most predictive features. The last classifier combines the eight varieties, frequency, and iteration features with the eighteen most predictive sequence patterns. Each test was run using 10-fold cross validation.
5. Results
Our results are divided into sections based on the type of analysis performed. In the first two sections, results are further broken up by deployment version, allowing us to present each set of results independently and then discuss how they relate to our second question about the impact of design on student models.
5.1. Model Complexity Analysis
5.1.1. Version 1
As shown in Table 2, there are substantial variations in the models created by students in different classrooms. We see that Anderson’s students documented many more organisms (155) and interactions (264) than all other classes. Although Anderson had both of her classes work together to create one survey, the total number of students contributing to this model is comparable to the number of students contributing in other classrooms. We also see that students in Baker’s three classes each documented significantly fewer organisms and interactions. One class only documented 19 organisms (less than one per student) and did not document any interactions. Chavez’s classes exhibit wide variation, particularly in the numbers of interactions documented by each class.
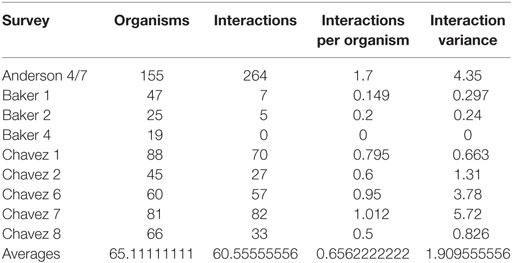
Table 2. Version 1 final models.
The number of interactions per organism, a broad measure of model complexity, further illustrates apparent classroom differences, with Anderson’s class creating more complex models than Baker’s and Chavez’s classes. To better understand classroom differences, we examine variance in the number of interactions per organism. In Anderson’s class, we see a high variance in comparison to the interactions per organism metric, which indicates that there are a small number of organisms with lots of interactions and many organisms with few interactions.
Chavez’s P1 and P7 classes provide a particularly interesting case to examine this variation. On reviewing Table 2, we see that the variance in the number of interactions assigned to each organism is significantly lower in P1 than in P7, whereas the actual number of organisms and interactions are comparable. Further analyses reveal that students in Chavez’s P1 did not assign any interactions for 39% of their organisms, whereas students in P7 did not assign interactions to 74% of their organisms. A similar analysis revealed that 42% of the organisms documented in Anderson’s model did not include interactions. In most classes, the majority of organisms have no documented interactions. It appears that students engaged significantly more with describing organisms, and spent far less time consistently documenting interactions.
5.1.2. Version 2
The models generated during the second deployment with our second group of teachers (as summarized in Table S1 in Supplementary Material) of EcoSurvey demonstrated both parallels and contrasts. First and foremost, the average number of organisms and interactions are both higher in our second deployment group (as seen in Table 3), with the number of organisms showing a trend toward significance (p = 0.09). Furthermore, the ratio of relationships per organism tends to be significantly higher, demonstrating significantly more complex models.
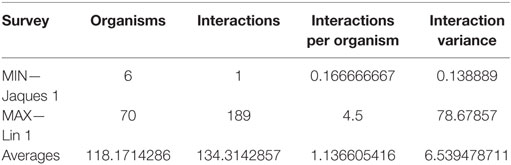
Table 3. Version 2 final models.
The variance in relationships per organism once again also leads to some interesting results. The high levels of variance across classes highlight continued imbalance in the distribution of assigned relationships; students are once again focusing on key cards when creating relationships. However, the wide range of percentages of cards without relationships (17–88%) demonstrates that classes are engaging with relationships in different patterns. Nevertheless, the average percentage of orphaned cards (50%) is lower than the first deployment.
5.2. Relationship Analysis
5.2.1. Version 1
Students did successfully engage with adding relationships to their models in the first version of EcoSurvey. However, analysis (as seen in Figure 6) did suggest several trends of use that did motivated changes to the relationship system in EcoSurvey’s design. First and foremost, there were a large number of “unknown” relationships that could not be normalized. This trend represents the ambiguity in students’ models, which leads to an inability to construct explanations and arguments using the model. Second, we see an imbalance of relationship types (evenness = 0.749), with a particular emphasis toward predator–prey connections (55.8%). This indicates that students were not engaging deeply with exploring other types of relationships, particularly competitive relationships (5.7%) that are important for maintaining organism balance. Finally, this analysis emphasized that important bidirectional connections between organisms, such as symbiotic relationships of mutual beneficence, were not properly incorporated into EcoSurvey.
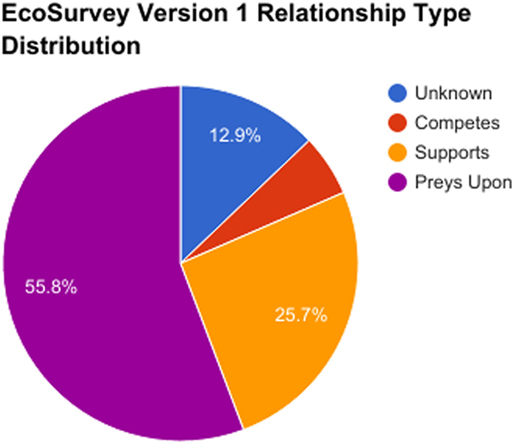
Figure 6. The relationship type distribution for Version 1.
5.2.2. Version 2
Version 2 showed remarkable improvement in the evenness of relationship types (Figure 7, evenness = 0.803), even with the added complexity of a new “mutually benefits” relationship type. In particular, we see a remarkable decrease in the relative abundance of predator–prey relationships (down 26.5%) and a substantial increase in the use of all other valid relationship types. In addition, although version 2 incorporated the ability to denote unknown relationships, this feature saw very little use (1.1%).
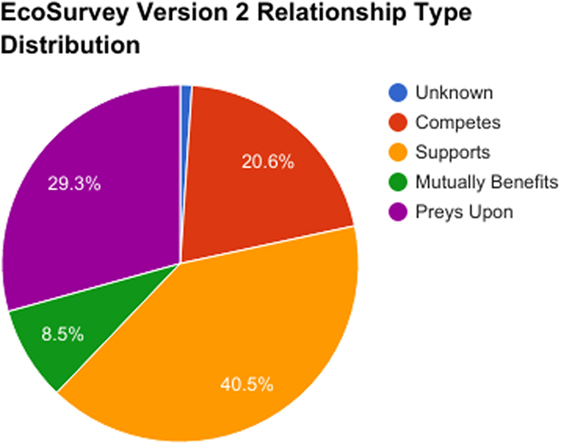
Figure 7. The relationship type distribution for Version 2.
5.3. Practices Analysis
5.3.1. Analysis of Teacher Differences
There are significant differences between the student action sequences of our three teachers on all eight metrics related to variety, frequency, and iteration (p < 0.001). Our Tukey’s HSD test for each feature shows that the three groups are each distinct to a significant degree in Create, Revision, and Iteration frequency (Figure 8A, p < 0.05), as well as Overall Actions, Session Count, and Action Variety (Figure 8B, p < 0.05). We also see Anderson’s students performed significantly more Evaluate and Use actions than the other two teachers’ students (Figure 8A, p < 0.05), although the differences between Baker’s and Chavez’s students are not significant. Anderson’s class also used EcoSurvey twice as much, as measured by session counts. Overall, Anderson’s students engaged in more modeling practices than both of the other two groups, and Chavez’s students engaged in more modeling practices than Baker’s.
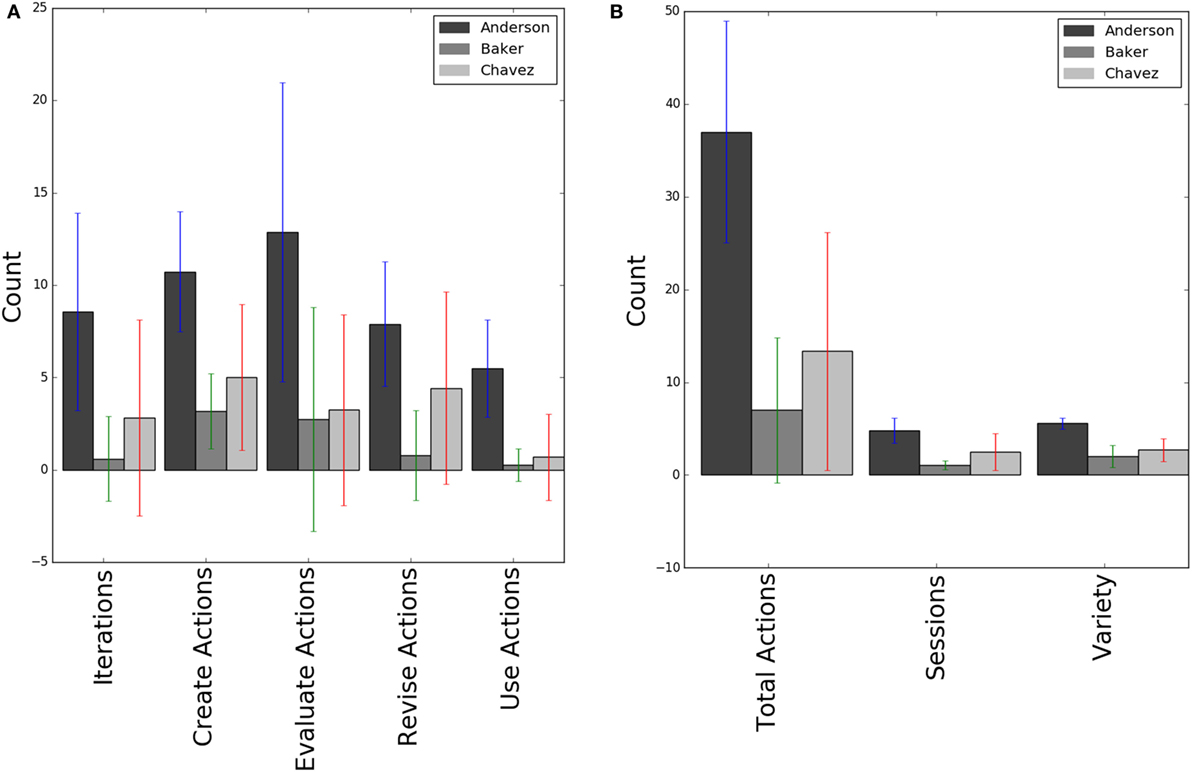
Figure 8. Student modeling practices for each teacher’s students. (A) The average number of actions by modeling practice type. (B) The average number of actions, types of actions, and action sessions.
There were also differences in the modeling practices that students employed. Students in Baker’s classes rarely engaged in three of the five modeling practices we are studying: revisions, iteration, or use. Chavez’s class engaged with four of the five practices, but appeared to rarely use their models.
5.3.2. Predictive Value of Practices
As shown in Table 4, student action sequences can predict their teacher with varying degrees of reliability depending upon the features used. Our baseline assumes that each student is in one of Chavez’s classes; almost 52% of the students in this study were in one of his classes. All of the feature sets we studied improved performance over the baseline. Classifying based on all 2,893 sequence patterns improved our classification accuracy by almost 12%, whereas classifying solely based on our variety, frequency, and iteration features improved performance by over 15%. We also trained a model on the best sequence patterns, that is, the 18 most predictive patterns identified by Weka’s Attribute Selection tool (Hall and Holmes, 2003); this yielded a nearly 25% improvement in performance. The best performing model was one that combined the most predictive sequence patterns with our variety, frequency, and iteration features. This combination resulted in a 30% improvement over baseline, correctly predicting a student’s teacher 80% of the time.
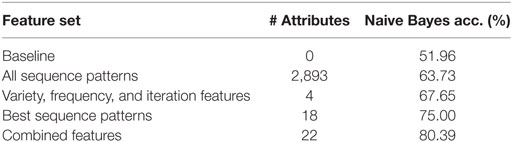
Table 4. Predictive accuracy of each action sequence feature set.
The most useful features for classification accuracy are the 18 “best” sequence patterns (Table 5). A closer examination reveals that these sequence patterns correspond to our five modeling practices in interesting ways. These patterns prioritize model revision, evaluation, and iteration as distinguishing features, which correspond to the differences in classroom modeling practices discussed under research question 2.
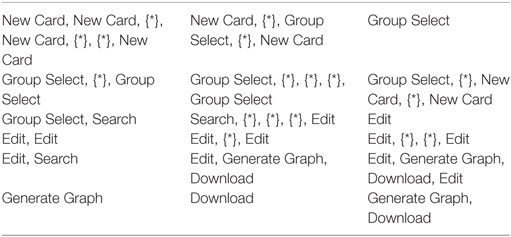
Table 5. The most predictive action sequences.
To better understand the types of errors that our best performing model makes, we generated a confusion matrix (Table 6). We see that 75% of the errors are due to the misclassification of 30 of Chavez’s students as Baker’s students. One possible reason for this misclassification is that some students in Chavez’s classes performed very few modeling actions overall, similarly to the majority of students in Baker’s classes.
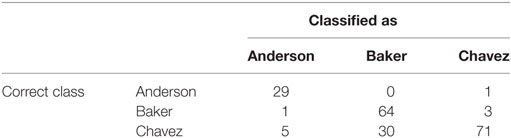
Table 6. Combined features confusion table.
6. Discussion
Overall, these results demonstrate the capabilities of our analytic techniques to help us understand scientific modeling in the classroom. We have been able to discover the variance in students’ models, the impact of design features on those models, and the variance in student engagement with modeling practices. These results inform work in learning analytics, modeling tool design, and the design of curricula and professional development for the Next Generation Science Standards.
While the second deployment showed limited evidence of improved student contribution, there is still large variance in the number of organisms and interactions documented at the classroom and teacher level. These differences could be due to various factors, such as the time allocated to modeling during class, the teacher’s dispositions and knowledge about scientific modeling, or the teacher’s capability to support student use of EcoSurvey. These possibilities can be addressed through curriculum and professional development design around supporting student modeling, as well as through the interface design and the inclusion of teacher supports within digital modeling tools like EcoSurvey.
Our analysis of student models also revealed a disturbing similarity across all classrooms and teachers: all the models contained significant percentages of organisms that did not have a single defined interaction with another organism. Thus, these student models are missing critical elements of a complete and sound ecosystem model. It is unlikely that these models can support students to develop comprehensive explanations and predictions as called out in the Framework (National Research, 2012). There are multiple possible explanations for these behaviors, including weaknesses in the Inquiry Hub curriculum, the associated teacher professional development, or the design of the EcoSurvey tool.
In developing the second version of EcoSurvey, we made key design changes that we hypothesized would improve student models. As a first step, we made major changes in designing EcoSurvey version 2 to make it easier for students to establish relationships from multiple parts of the interface, to visualize established relationships through an integrated graph view, and to see which organisms are not connected to others in the model. In the second version, we did see gains in the level of completeness and complexity of students’ models, as well as a more even distribution of relations mapped in the system. However, these changes have only slightly reduced the isolated organism phenomenon. This result suggests that further mechanisms will be necessary to address these issues. Our planned approach is to incorporate adaptive feedback mechanisms within EcoSurvey, providing scaffolds for struggling students.
The large variance we observed in student modeling practices provides evidence of significant teacher-level differences. Clearly, these teachers are implementing EcoSurvey and the corresponding lessons differently in their classrooms, with wildly varying results. When teachers devoted more time to modeling, as measured by sessions, their students’ engaged in a richer variety of modeling practices. Prior research suggests that there is a linkage between student engagement in modeling practices and future learning outcomes (Schwarz et al., 2009; Bryce et al., 2016). Thus, it appears that students in several of our participating classrooms lacked critical opportunities to learn (McDonnell, 1995; Mo et al., 2013), which could ultimately impact their academic performance. In future work, we plan to examine the relationships between student engagement in modeling practices and their learning outcomes as measured by end-of-course school district assessments.
Our predictive analysis provided further evidence of significant teacher-level differences. The feature selection algorithm honed in on the presence or absence of three modeling practices—evaluation, revision, and iteration—as the features that best predicted a student’s teacher. This suggests that future professional development and curriculum design should focus on these specific practices, ensuring that all students get an opportunity to participate in these parts of the modeling process. The most accurate classifier also benefited from additional features characterizing action variety, frequency (number of actions), and iteration. These features further highlight differences in student engagement, with some students missing the opportunity to explore, develop, and use their models over time.
In EcoSurvey version 2, we expanded features designed to support evaluation, revision, and iteration practices. By facilitating students to use (visualize) their models more frequently, we hope that this will prompt them to notice shortcomings and engage in modeling practices that were previously underutilized. A parallel clickstream analysis of our redesigned interface is a necessary next step in our future research.
While this study yielded many results that have informed our partnership design work, there are several limitations that are important to note. First, we cannot attribute our observed variation in models and modeling practices to student-level differences, due to the shared and collaborative nature of the deployment. All our participating classrooms asked students to work in groups and each group shared a single laptop computer; we are actually observing the collaborative modeling practices of small groups rather than individual students. Second, our practices analysis is only available for students in our first deployment cycle. This limited set shows potential for capturing differences in modeling engagement, but further data collection is required to explore the generalizability of these findings.
While our technique is designed to generalize across tools, our investigations thus far have only explored student use of EcoSurvey, limiting our ability to generalize our findings. Nevertheless, a core aspect of our analytic approach explicitly linked specific user interface actions in the EcoSurvey tool to individual modeling practices identified through prior research: creating, evaluating, revising, using, and iterating (Homer, 1996; Schwarz et al., 2009; Bryce et al., 2016). This approach enabled us to work with theoretically and empirically sound features identified through prior classroom research. And, this approach enabled us to interpret the action sequences identified as salient by our algorithms in a theoretically informed way, enabling us to link our findings back to instructional concerns, such as curriculum design and professional development. This method of linking interface actions to identified modeling practices can support generalizing this analytic approach to other tools that support scientific modeling, such as Model-It! (Jackson et al., 2000), Dragoon (VanLehn et al., 2017), or activities within the Wallcology unit (Lui and Moher, 2017).
7. Conclusion
In this study, we demonstrated the utility of learning analytic methods for characterizing variation in students’ scientific models and their modeling practices. We also showed that an individual student’s modeling action sequences can be used to predict this or her teacher. Our results support Windschitl et al.’s findings documenting large variations in how teachers implement modeling in their classrooms (Windschitl et al., 2008). While we did not conduct formalized classroom observations, our analysis revealed profound, quantifiable differences in the models that students constructed across different classrooms and significant differences in their classroom learning experiences as depicted in the range of modeling practices that they engaged in. This result confirms and expands upon the conclusions of Jordan et al. (2017) that modeling is handled differently across classrooms but provides evidence that the variance is not only attributable to the teacher. The variance in model complexity within each teacher shows that student and class level variance can sometimes have a higher impact than teacher-level variance.
One important aspect we plan to address in future work is the impact of modeling activities on student learning. Our team has been developing assessments to embed three dimensional assessments (Council et al., 2014) within the ecosystems curriculum. Within this body of questions, we have designed prompts to elicit student understandings of modeling as a science and engineering practice as well as a cross-cutting concept, allowing us to measure student development of these skills while using EcoSurvey and the accompanying curriculum. In addition, we have developed protocols to evaluate students’ final reports related to the unit-level challenge of choosing a tree to plant on their school grounds. By analyzing how students incorporate their models of the local ecosystem into their final choice, we can measure the impact of EcoSurvey on students’ explanations of ecosystem phenomena (National Research, 2012).
We are also incorporating these findings into the next iteration of design and deployment of our modeling tool. Our biggest improvement is to provide these analytics in real-time feedback systems within EcoSurvey. We plan to work with preservice and active teachers to design interfaces that support the needs of students in successfully developing complete models of their ecosystem, as well as interfaces to support teachers in understanding the activity and contributions of students toward their models.
Ethics Statement
This study was reviewed and approved by the University of Colorado Boulder Institutional Review Board, and all activities were conducted according to their rules and guidelines. Teachers gave written informed consent, and all student data were collected anonymously in the course of normal classroom activities. The University of Colorado Boulder Institutional Review Board waived the need for written informed consent to be obtained from the students’ parents/legal guardians. All teachers’ names are pseudonyms.
Author Contributions
All the authors contributed to the design and development of EcoSurvey tools and analytics. David Quigley took the lead on writing, but all the authors took part in drafting and reviewing content.
Conflict of Interest Statement
The authors declare that the research was conducted in the absence of any commercial or financial relationships that could be construed as a potential conflict of interest.
The reviewer MH and handling editor declared their shared affiliation.
Acknowledgments
This work builds on Quigley et al. (2017). This material is based in part upon work supported by the National Science Foundation under Grant Numbers 1555550 and 1147590. Any opinions, findings, and conclusions or recommendations expressed in this material are those of the author(s) and do not necessarily reflect the views of the National Science Foundation. In addition, the authors would like to thank the Gordon and Betty Moore Foundation for their support.
Supplementary Material
The Supplementary Material for this article can be found online at http://www.frontiersin.org/article/10.3389/fict.2017.00024/full#supplementary-material.
References
Bang, M., Medin, D. L., and Atran, S. (2007). Cultural mosaics and mental models of nature. Proc. Natl. Acad. Sci. U.S.A. 104, 13868–13874. doi: 10.1073/pnas.0706627104
Bryce, C., Baliga, V. B., de Nesnera, K., Fiack, D., Goetz, K., Tarjan, L. M., et al. (2016). Exploring models in the biology classroom. Am. Biol. Teach. 8, 35–42. doi:10.1525/abt.2016.78.1.35.THE
Chiu, M. M., Chow, B. W.-Y., and Joh, S. W. (2017). “How to assign students into sections to raise learning,” in Proceedings of the Seventh International Learning Analytics & Knowledge Conference (Vancouver: ACM), 95–104.
Cukurova, M., Avramides, K., Spikol, D., Luckin, R., and Mavrikis, M. (2016). “An analysis framework for collaborative problem solving in practice-based learning activities: a mixed-method approach,” in Proceedings of the Sixth International Conference on Learning Analytics & Knowledge, LAK ’16 (Edinburgh: ACM), 84–88.
d’Aquin, M., and Jay, N. (2013). “Interpreting data mining results with linked data for learning analytics: motivation, case study and direction,” in Proceedings of the Sixth International Conference on Learning Analytics & Knowledge, Edinburgh, UK.
Fretz, E. B., Wu, H.-K., Zhang, B., Davis, E. A., Krajcik, J. S., and Soloway, E. (2002). An investigation of software scaffolds supporting modeling practices. Res. Sci. Educ. 32, 567–589. doi:10.1023/A:1022400817926
Gadiraju, U., and Dietze, S. (2017). “Improving learning through achievement priming in crowdsourced information finding microtasks,” in Proceedings of the Seventh International Learning Analytics & Knowledge Conference (Vancouver: ACM), 105–114.
Gunderson, L. H. (2000). Ecological resilience—in theory and application. Annu. Rev. Ecol. Syst. 31, 425–439. doi:10.1146/annurev.ecolsys.31.1.425
Hall, M., Frank, E., Holmes, G., Pfahringer, B., Reutemann, P., and Witten, I. H. (2009). The WEKA data mining software. ACM SIGKDD Explor. 11, 10–18. doi:10.1145/1656274.1656278
Hall, M., and Holmes, G. (2003). Benchmarking attribute selection techniques for data mining. IEEE Trans. Knowl. Data Eng. 15, 1437–1447. doi:10.1109/TKDE.2003.1245283
Hmelo-Silver, C. E., Marathe, S., and Liu, L. (2007). Fish swim, rocks sit, and lungs breathe: expert-novice understanding of complex systems. J. Learn. Sci. 16, 307–331. doi:10.1080/10508400701413401
Holling, C. S. (1973). Resilience and stability of ecological systems. Annu. Rev. Ecol. Syst. 4, 1–23. doi:10.1146/annurev.es.04.110173.000245
Holstein, K., McLaren, B. M., and Aleven, V. (2017). “Intelligent tutors as teachers’ aides: exploring teacher needs for real-time analytics in blended classrooms,” in Proceedings of the Seventh International Learning Analytics & Knowledge Conference (Vancouver: ACM), 257–266.
Homer, J. B. (1996). Why we iterate: scientific modeling in theory and practice. Syst. Dyn. Rev. 12, 1–19. doi:10.1002/(sici)1099-1727(199621)12:1<1:aid-sdr93>3.0.co;2-p
Jackson, S., Krajcik, J., and Soloway, E. (2000). “Model-it: a design retrospective,” in Advanced Designs for the Technologies of Learning: Innovations in Science and Mathematics Education, eds M. Jacobson, and R. Kozma (Hillsdale, NJ: Lawrence Erlbaum Associates, Inc.), 77–115.
Jordan, R. C., Gray, S., Sorensen, A. E., Pasewark, S., Sinha, S., and Hmelo-Silver, C. E. (2017). Modeling with a conceptual representation: is it necessary? Does it work? Front. ICT 4:1–8. doi:10.3389/fict.2017.00007
Ketelhut, D. J., Nelson, B. C., Clarke, J., and Dede, C. (2010). A multi-user virtual environment for building and assessing higher order inquiry skills in science. Br. J. Educ. Technol. 41, 56–68. doi:10.1111/j.1467-8535.2009.01036.x
Kolodner, J. L., Camp, P. J., Crismond, D., Fasse, B., Gray, J., Holbrook, J., et al. (2003). Problem-based learning meets case-based reasoning in the middle-school science classroom: putting learning by design(tm) into practice. J. Learn. Sci. 12, 495–547. doi:10.1207/S15327809JLS1204_2
Krajcik, J., Blumenfeld, P., Marx, R., Bass, K., Fredricks, J., and Soloway, E. (1998). Inquiry in project-based science classrooms: initial attempts by middle school students. J. Learn. Sci. 7, 313–350. doi:10.1080/10508406.1998.9672057
Kruskal, W. H., and Wallis, W. A. (1952). Use of ranks in one-criterion variance analysis. J. Am. Stat. Assoc. 47, 583–621. doi:10.1080/01621459.1952.10483441
Lui, M., and Moher, T. (2017). Learning to Model Ecosystems with Interaction Food Webs in Middle School Classrooms. Philadelphia, PA: International Society of the Learning Sciences.
Mason, N. W. H., Mouillot, D., Lee, W. G., Wilson, J. B., and Setälä, H. (2005). Functional richness, functional evenness and functional divergence: the primary components of functional diversity. Oikos 111, 112–118. doi:10.1111/j.0030-1299.2005.13886.x
McDonnell, L. M. (1995). Opportunity to learn as a research concept and a policy instrument. Educ. Eval. Policy Anal. 17, 305–322. doi:10.3102/01623737017003305
Mo, Y., Singh, K., and Chang, M. (2013). Opportunity to learn and student engagement: a HLM study on eighth grade science achievement. Educ. Res. Policy Pract. 12, 3–19. doi:10.1007/s10671-011-9126-5
National Research Council. (2012). A Framework for K-12 Science Education: Practices, Crosscutting Concepts, and Core Ideas. Washington, DC: The National Academies Press.
National Research Council, Division of Behavioral and Social Sciences and Education, Board on Testing and Assessment and Board on Science Education, Committee on Developing Assessments of Science Proficiency in K-12. (2014). Developing Assessments for the Next Generation Science Standards, eds J. W. Pellegrino, M. R. Wilson, J. A. Koenig, and A. S. Beatty. Washington, DC: The National Academies Press.
Park, J., Denaro, K., Rodriguez, F., Smyth, P., and Warschauer, M. (2017). “Detecting changes in student behavior from clickstream data,” in Proceedings of the Seventh International Learning Analytics & Knowledge Conference (Vancouver: ACM), 21–30.
Pelánek, R., Rihák, J., and Papoušek, J. (2016). “Impact of data collection on interpretation and evaluation of student models,” in Proceedings of the Sixth International Conference on Learning Analytics & Knowledge, Edinburgh, 40–47.
Penuel, W. R., Van Horne, K., Severance, S., Quigley, D., and Sumner, T. (2016). “Students’ responses to curricular activities as indicator of coherence in project-based science,” Proceedings of the 12th International Conference of the Learning Sciences. (Vol. 2). eds C.-K. Looi, J. L. Polman, U. Cress, and P. Reimann (Singapore: International Society of the Learning Sciences), 855–858.
Quigley, D., Ostwald, J., and Sumner, T. (2017). “Scientific modeling: using learning analytics to examine student practices and classroom variation,” in The 7th International Conference on Learning Analytics & Knowledge (Vancouver: ACM), 1–10.
Quintana, C., Reiser, B. J., Davis, E. A., Krajcik, J., Fretz, E., Duncan, R. G., et al. (2004). A scaffolding design framework for software to support science inquiry. J. Learn. Sci. 13, 337–386. doi:10.1207/s15327809jls1303
Schauble, L., Glaser, R., Duschl, R. A., Schulze, S., and John, J. (1995). Students’ understanding of the objectives and procedures of experimentation in the science classroom. J. Learn. Sci. 4, 131–166. doi:10.1207/s15327809jls0402_1
Schwarz, C. V., Reiser, B. J., Davis, E. A., Kenyon, L., Achér, A., Fortus, D., et al. (2009). Developing a learning progression for scientific modeling: making scientific modeling accessible and meaningful for learners. J. Res. Sci. Teach. 46, 632–654. doi:10.1002/tea.20311
Severance, S., Penuel, W. R., Sumner, T., and Leary, H. (2016). Organizing for teacher agency in curricular co-design. J. Learn. Sci. 25, 531–564. doi:10.1080/10508406.2016.1207541
Shannon, C. E., and Weaver, W. (1998). The Mathematical Theory of Communication. Urbana, IL: University of Illinois Press.
Soloway, E., Pryor, A. Z., Krajcik, J. S., Jackson, S., Stratford, S. J., Wisnudel, M., et al. (1997). Scienceware’s model-it: technology to support authentic science inquiry. T.H.E. J. 25, 54–56.
Tukey, J. W. (1949). Comparing individual means in the analysis of variance. Biometrics 5, 99–114. doi:10.2307/3001913
van Gompel, M., and van den Bosch, A. (2016). Efficient n-gram, skipgram and flexgram modelling with colibri core. J. Open Res. Software 4, e30. doi:10.5334/jors.105
VanLehn, K., Wetzel, J., Grover, S., and van de Sande, B. (2017). Learning how to construct models of dynamic systems: an initial evaluation of the dragoon intelligent tutoring system. IEEE Trans. Learn. Technol. 10, 154–167. doi:10.1109/TLT.2016.2514422
Vygotsky, L. S. (1980). Mind in Society: The Development of Higher Psychological Processes. Cambridge, MA: Harvard University Press.
Windschitl, M., Thompson, J., and Braaten, M. (2008). Beyond the scientific method: model-based inquiry as a new paradigm of preference for school science investigations. Sci. Educ. 92, 941–967. doi:10.1002/sce.20259
Keywords: learning analytics, scientific modeling, sequential models, classification, instructional equity
Citation: Quigley D, McNamara C, Ostwald J and Sumner T (2017) Using Learning Analytics to Understand Scientific Modeling in the Classroom. Front. ICT 4:24. doi: 10.3389/fict.2017.00024
Received: 21 May 2017; Accepted: 02 October 2017;
Published: 09 November 2017
Edited by:
Monika Akbar, University of Texas at El Paso, United StatesReviewed by:
Adamantios Koumpis, University of Passau, GermanyMahmud Shahriar Hossain, University of Texas at El Paso, United States
Copyright: © 2017 Quigley, McNamara, Ostwald and Sumner. This is an open-access article distributed under the terms of the Creative Commons Attribution License (CC BY). The use, distribution or reproduction in other forums is permitted, provided the original author(s) or licensor are credited and that the original publication in this journal is cited, in accordance with accepted academic practice. No use, distribution or reproduction is permitted which does not comply with these terms.
*Correspondence: David Quigley, daqu3650@colorado.edu