 Eva Szymanska Mroczek1
 Gregory C. Ippolito2
 Tobias Rogosch3
 Kam Hon Hoi4,5
 Tracy A. Hwangpo6
 Marsha G. Brand6Yingxin Zhuang6Cun Ren Liu6
 David A. Schneider7
 Michael Zemlin3
 Elizabeth E. Brown8
 George Georgiou2,4,5
 Harry W. Schroeder Jr.1,6*
- 1Department of Microbiology, University of Alabama at Birmingham, Birmingham, AL, USA
- 2Department of Molecular Biosciences, University of Texas at Austin, Austin, TX, USA
- 3Laboratory for Neonatology and Pediatric Immunology, Department of Pediatrics, Philipps-University, Marburg, Germany
- 4Department of Chemical Engineering, University of Texas at Austin, Austin, TX, USA
- 5Department of Biomedical Engineering, University of Texas at Austin, Austin, TX, USA
- 6Department of Medicine, University of Alabama at Birmingham, Birmingham, AL, USA
- 7Department of Biochemistry and Molecular Genetics, University of Alabama at Birmingham, Birmingham, AL, USA
- 8Department of Epidemiology, University of Alabama at Birmingham, Birmingham, AL, USA
The vast initial diversity of the antibody repertoire is generated centrally by means of a complex series of V(D)J gene rearrangement events, variation in the site of gene segment joining, and TdT catalyzed N-region addition. Although the diversity is great, close inspection has revealed distinct and unique characteristics in the antibody repertoires expressed by different B cell developmental subsets. In order to illustrate our approach to repertoire analysis, we present an in-depth comparison of V(D)J gene usage, hydrophobicity, length, DH reading frame, and amino acid usage between heavy chain repertoires expressed by immature, transitional, mature, memory IgD+, memory IgD−, and plasmacytes isolated from the blood of a single individual. Our results support the view that in both human and mouse, the H chain repertoires expressed by individual, developmental B cell subsets appear to differ in sequence content. Sequencing of unsorted B cells from the blood is thus likely to yield an incomplete or compressed view of what is actually happening in the immune response of the individual. Our findings support the view that studies designed to correlate repertoire expression with diseases of immune function will likely require deep sequencing of B cells sorted by subset.
Introduction
Production of a highly diverse, polyclonal immunoglobulin repertoire plays a central role in the ability of B cells to produce antibodies specific to a diverse range of foreign and self-antigens (1, 2). The antigen-binding sites of these antibodies are created by the juxtaposition of six hypervariable loops, termed complementarity determining regions (CDRs): three from the heavy (H) and three from the light (L) chain V domains. Because the third CDR of the H chain, termed CDR-H3 (2–5), is the direct product of V(D)J joining and N-region addition, it is the most variable component of the pre-immune immunoglobulin repertoire. The location of CDR-H3 at the center of the antigen-binding site allows this interval to play a key role in antigen recognition and binding (6–8).
Developing B cells pass through a series of checkpoints designed to test the functionality and antigen specificity of the immunoglobulin (9–14). In adults, this process begins in the bone marrow, and then continues in the periphery where it is heavily influenced by exposure to both self and foreign antigens. Immature B cells are released into the blood and in the periphery pass through a transitional stage prior to entering specific anatomic sites, such as the splenic marginal zone and the splenic and lymph node follicles (15, 16). Maturation is associated with the co-expression of IgM and IgD (17). Mature cells exposed to antigen can become either memory cells or plasmacytes. Both types of cells circulate through the blood on their way to their specific anatomic niches (18–21). IgM bearing memory cells can be divided into two populations, those that express IgD concurrently and those that do not (22–25). The IgM+IgD− memory B cell population includes conventional, follicular B cells, whereas the IgM+IgD+memory B cell population includes marginal zone-like B cells that play a more immediate role in response to foreign antigens (26–28).
Recent studies in mice have shown that the composition of CDR-H3 exhibits preferred patterns in amino acid composition, length, and charge distribution that differ by developmental stage and B cell subset (29–33). These categorical constraints are initially imposed by natural selection of the germline V, D, and J gene sequence; and alteration of the sequence of these gene segments can give rise to dramatically different CDR-H3 repertoires (34–36). D gene sequence-specific changes in CDR-H3 content lead to altered patterns of B cell development, antigen-specific antibody production, and levels of protection against infectious agents (31, 37, 38), which underscores the important role played by the composition of the CDR-H3 repertoire in the regulation and function of the humoral immune response.
Given the importance of CDR-H3 to antigen recognition and antibody specificity, and the observation that CDR-H3 content can differ by peripheral developmental stage in the mouse; we sought to test whether V(D)J usage and CDR-H3 content would also differ by developmental stage in human. We used surface expression of CD19, CD27, IgD, CD24, and CD38 expression to identify and sort immature, transitional, mature, memory IgD+, memory IgD− B cell subsets, and plasmacytes from the blood of a healthy female subject. We then used RT-PCR followed by Roche GS-FLX 454 deep sequencing to clone and sequence Cμ and Cγ-containing transcripts from the sorted cells. As in the mouse, we found that the distribution of V, D, and J utilization, and CDR-H3 length, amino acid usage, and average hydrophobicity differed between developmentally and functionally distinct B cell subsets. We conclude that studies of differences between healthy individuals and patients with diseases referable to the humoral immune response will likely require comparisons of the B cell repertoire by subset.
Materials and Methods
Subject Description and Isolation of B Cell Subsets
One healthy female subject, age 56, was recruited for antibody repertoire high throughput sequencing using the 454 platform. The subject is Caucasian, a lifelong native of the state of Alabama, and was without a history of illness or repeated infection that could be related to abnormal immune function. The complete blood count was well within normal limits. Serum immunoglobulin levels were IgM 382, IgG 1,680, and IgA 368 mg/dL, respectively. Venous blood (100 cm3) was drawn by routine venipuncture and mononuclear cells were isolated using Ficoll-Paque Plus (GE Healthcare). CD19+ magnetic beads (Miltenyi Biotec MACS) were used to enrich for B cells. These CD19+ cells were further fractionated by CD27± populations using CD27 magnetic beads (Miltenyi Biotec MACS) according to the manufacturer’s protocol. CD19+CD27+ B cells were stained with CD19 APC780 (eBioscience), CD27 PE–Cy7 (BD Pharmingen), CD24 APC (BioLegend), and IgD FITC (Southern Biotech), and sorted into IgD+ memory B cells (CD19+/CD27+/IgD+/CD24+), IgD− memory B cells (CD19+/CD27+/IgD−/CD24+), and plasmacytes (CD19+/CD27+/CD24−) using a high speed sorting cytometer (FACSAria III; Becton Dickinson). CD19+/CD27− B cells were stained with CD19 APC780 (eBioscience), CD24 APC (BioLegend), CD38 PE (BioLegend), and IgD FITC (Southern Biotech) and sorted into mature/naïve (CD19+/CD27−/IgD+/CD38+/CD24+), transitional (CD19+/CD27−/IgD+/CD38+++/CD24+++), and immature (CD19+/CD27−/IgD−) B cell subsets. Each B cell subset was then individually resuspended in 1 mL TRI reagent (Ambion) and archived at −80°C until processed for total RNA extraction. This work was performed in accordance with an Institutional Review Board approved protocol and informed consent was obtained from the subject at the University of Alabama at Birmingham, Birmingham, AL, USA.
Generation of IgH Libraries
For RNA extraction, 0.2 mL chloroform was added to the 1 mL sample, vortexed for 15 s, left to stand at room temperature for 5 min, then spun at 12,000 × g for 10 min at 4°C. The aqueous phase (~400 μL) was removed and to this an equal volume of 70% ethanol was added and then mixed by pipetting. This was applied immediately to an RNA-binding silica spin-column and subsequently processed according to the manufacturer’s protocol (Qiagen RNeasy micro column; catalog no. 74004). Purified total RNA was eluted in 14 μL RNase-free water. Oligo-dT primer was used to generate first-strand cDNA from ~100 ng input RNA using the SuperScript RT II synthesis kit (Invitrogen; catalog no. 11904-018) per the manufacturer’s protocol.
FastStart high fidelity PCR system (Roche; catalog no. 03-553-361-001) and an equimolar mix of eight optimized VH-FWD primers previously described for human IgH amplification (39, 40) coupled with a multiplex of 10-nucleotide uniquely barcoded CH-REV primers: IgM-rev, 5′-10 nt ID-GGTTGGGGCGGATGCACTCC-3′, and IgG-all-rev, 5′-10 nt ID-SGATGGGCCCTTGGTGGARGC-3′ were used to amplify V(D)JCμ and V(D)JCγ cDNAs from the cDNA template. Cycling conditions were as follows: 95°C denaturation for 3 min; 92°C for 1 min, 50°C for 1 min, 72°C for 1 min for 4 cycles; 92°C for 1 min, 55°C for 1 min, 72°C for 1 min for 4 cycles; 92°C for 1 min, 63°C for 1 min, 72°C for 1 min for 22 cycles; 72°C for 7 min. PCR amplicons were gel-purified (Zymo Research) before sequencing.
High-Throughput Sequencing of IgH Repertoires and Bioinformatic Analysis
The University of Texas Genomics Sequencing and Analysis Facility performed Roche GS-FLX 454 deep sequencing. CH-REV barcodes were examined to verify the integrity of each library after filtering raw data for read quality. Sequences were submitted to the ImMunoGeneTics (IMGT) database and IMGT/high V-QUEST web-based analysis tool (version 1.0.3) (41). The 11 CSV text files outputted by IMGT/highV-QUEST were then imported into IgAT immunoglobulin analysis tool for further deconstruction (42). Differences between populations were assessed, where appropriate, by Student’s t-test, two tailed; Fisher’s exact test, two tailed and d; χ2, or Levene’s test for the homogeneity of variance. Analysis was performed with PRISM version 5 (Graph Pad). The standard deviation accompanies mean. Raw 454 sequence files were deposited to the NCBI Sequence Read Archive (Accession SRP037774).
Results
Isolation of B Lineage Cells and 454 High-Throughput Sequencing of IgH Transcripts from Peripheral Blood
CD19+ cells bearing the cell surface markers characteristic of immature, transitional, mature, memory IgD+, memory IgD−, and plasmacytes were isolated from the blood of a healthy female subject (43–47) (Figure 1). Following total RNA extraction, PCR was used to amplify cDNA copies of V(D)JCμ and V(D)JCγ transcripts using optimized VH-FWD primers previously described for human IgH amplification (39, 40). We obtained a total of 15,433 immature, 37,396 transitional, 47,781 mature, 43,558 memory IgD+, 28,142 memory IgD−, and 43,824 plasmacyte unique and in-frame IgH heavy chain reads. Of these, we obtained 1,240 immature, 1,354 transitional, 1,250 mature, 1,244 memory IgD+, 833 memory IgD−, and 1,714 plasmacyte reads that were of sufficient length to be identified as Igμ sequences, and 1,879 memory IgD− and 3,347 plasmacyte reads that were of sufficient length to be identified as Igγ sequences. All of the unique Igμ and Igγ reads were deconstructed to assess the presence and extent of changes in these repertoires that had occurred as B cells progressed through the various developmental checkpoints.
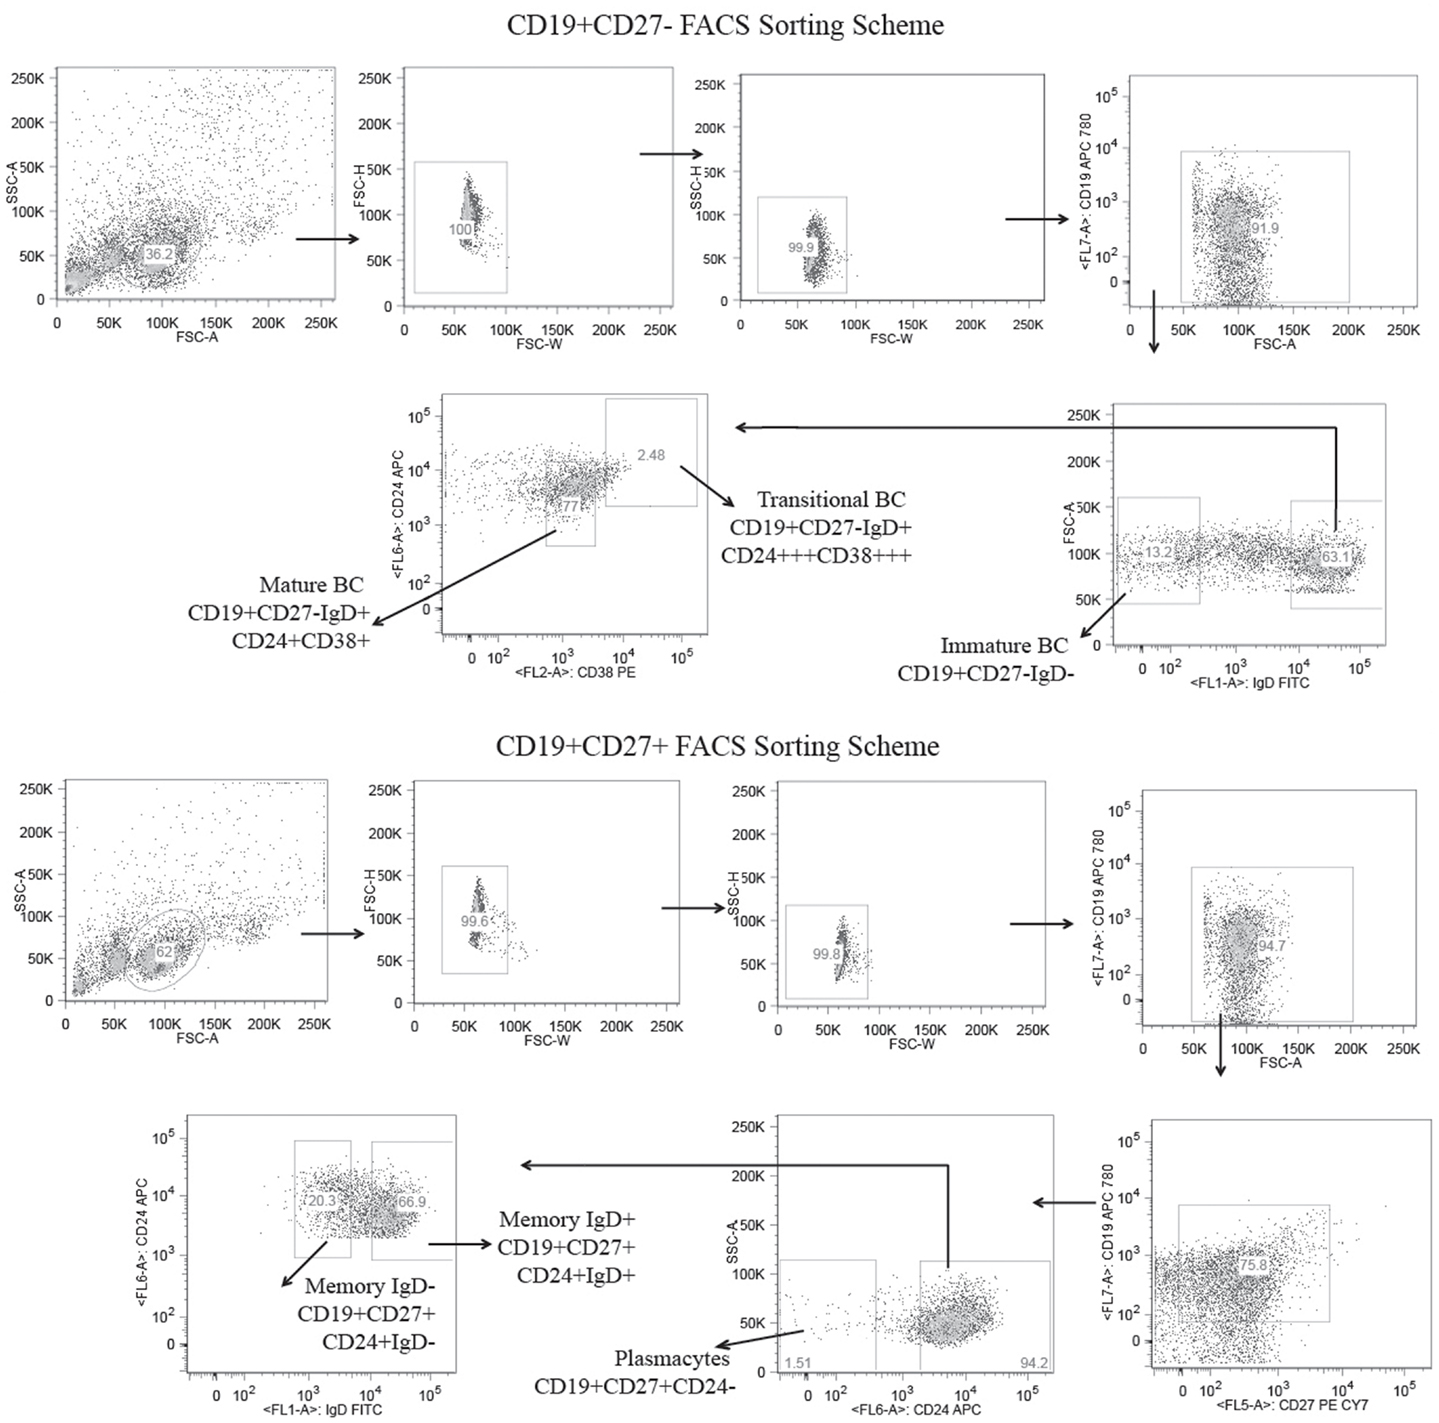
Figure 1. Flow cytometric gates for the collection of six distinct B cell lineage populations from the peripheral blood of a healthy adult human subject. B cells were separated from the total lymphocytes using CD19+ magnetic beads and further separated into CD27± populations using CD27 magnetic beads. The CD19+CD27+ B cells were stained with CD19 APC780, CD27 PE-Cy7, CD24 APC, and IgD FITC and sorted into IgD+ memory B cells (CD19+/CD27+/IgD+/CD24+), IgD− memory B cells (CD19+/CD27+/IgD−/CD24+), and plasmacytes (CD19+/CD27+/CD24−) using the high speed sorting cytometer. The CD19+/CD27− B cells were stained with CD19, APC 780, CD24 APC, CD38 PE, and IgD FITC, and sorted into mature (CD19+/CD27−/IgD+/CD38+/CD24+), transitional (CD19+/CD27−/IgD+/CD38+++/CD24+++), and immature (CD19+/CD27−/IgD−) B cell subsets.
The Immature B Cell Receptor Repertoire Utilizes Shortest Contribution of Germline Gene VJ Segments and Favors V1–18, D2–15, D4–23, and D5–12
The immature B cell subset is primarily composed of recent bone marrow emigrants. It expressed a highly diverse repertoire that differed from the subsequent transitional stage in that it contained the smallest contribution of germline V and J gene sequence to the CDR-H3 region (Figure 2). By family, VH4 gene segments contributed the most, followed by VH3, VH1, VH5, VH2, and VH6 (Figure 3). By individual V gene segments, V1–18, V1–69, V3–73, and V4–59 were most common. Across subsets, the immature B cell subset was enriched for V1–18, V3–30–3, and V3–74 (Figure 4). By DH family, DH3 was the most common, followed by DH2 and DH6 (Figure 5). By individual D gene segment, D2–2, D3–3, D3–22, D6–13, and D6–19 were favored. Across subsets, D1–26, D2–15, D3–10, D4–23, and D5–12 were more commonly used in the immature B cell lineage (Figure 6). By JH gene segment, JH4 was the most common, followed by JH6, JH5, and JH3. Across subsets, immature B cells used JH5 more frequently (Figure 7).
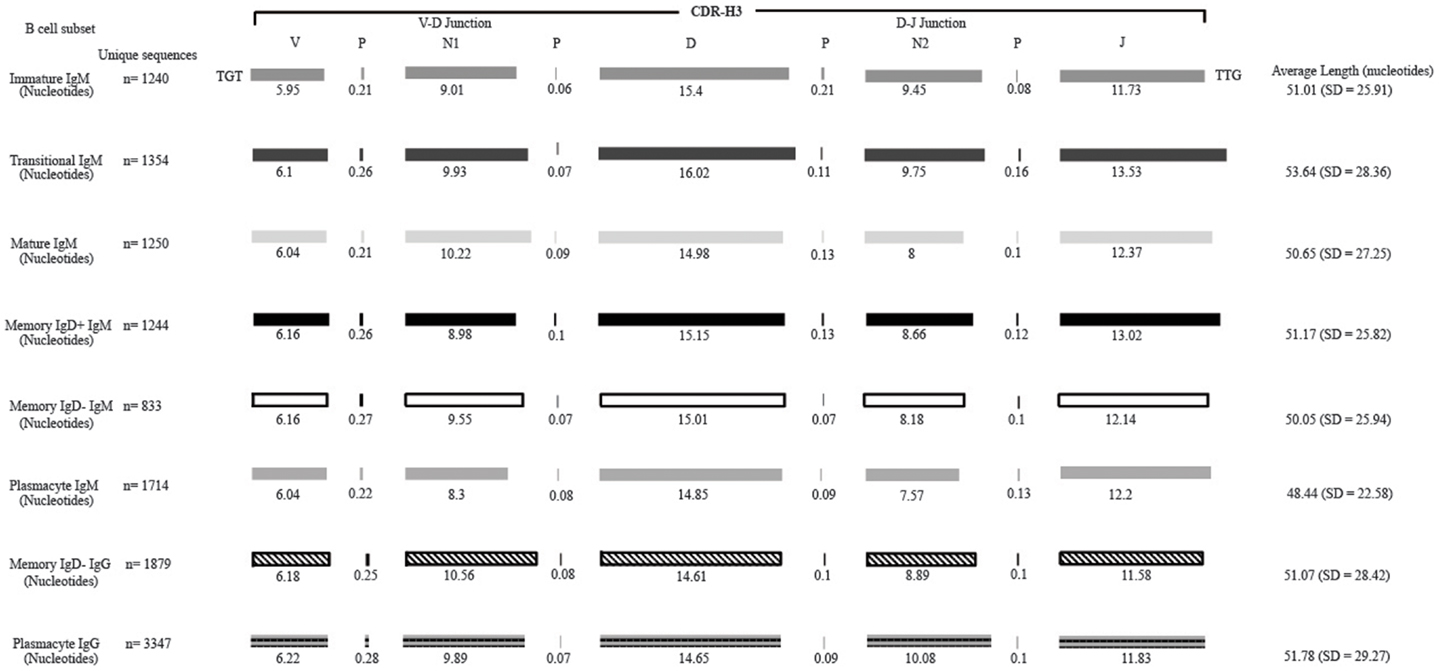
Figure 2. Deconstruction of the contributing components to CDR-H3 length in Igμ and Igγ reads containing identifiable DH gene segments as a function of B cell development in the peripheral blood. The contributions of nucleotides provided by the VH, DH, and JH gene segments, by P junctions, and by the extent of N addition at the VH → DH and DH → JH junctions to the CDR-H3 length are illustrated. The IgAT (42) identified the CDR-H3 as amino acids 105–117, according to the IMGT unique numbering system. The average length was calculated with the components of the CDR-H3, namely the V length, P-nucleotides 3′ of the V, N1 nucleotides, P-nucleotides 5′ of D, D length, P-nucleotides 3′ of D, N2 nucleotides, P-nucleotides 3′ of J, and J length. The deconstructed CDR-H3 segments shown are of CDR-H3 sequences with identifiable DH gene segments. The reported average length is the average length of all CDR-H3 sequences (with the identifiable DH and without identifiable DH gene segments) accompanied by the standard deviation.
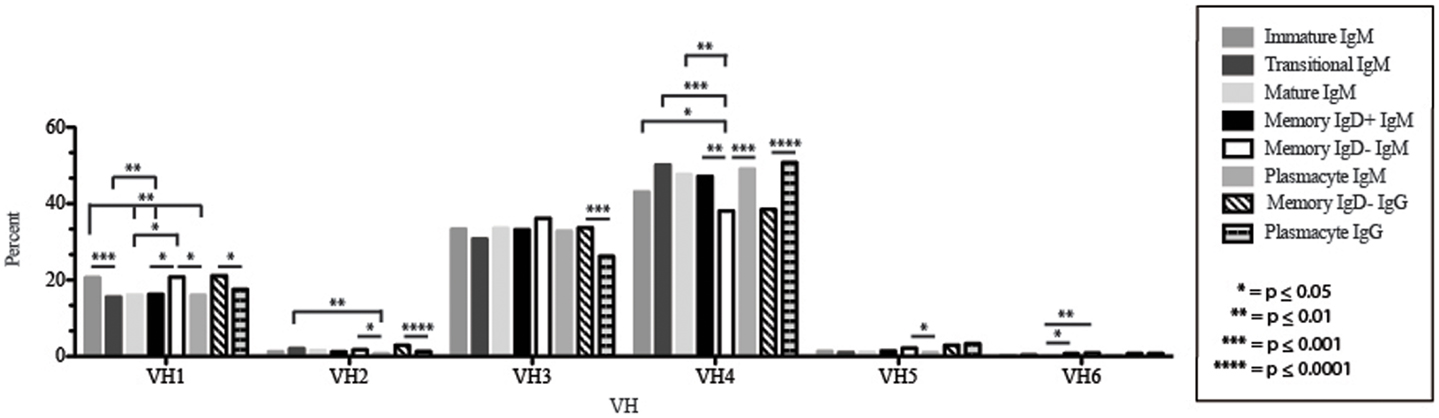
Figure 3. VH gene segment usage in Igμ and Igγ transcripts from selected B cell populations in the blood of a normal, healthy human. VH gene segments are arranged according to their position relative to the JH locus in the genome. Percent of unique, in-frame sequences using the VH gene segment specified in the peripheral blood from immature, transitional, mature, memory IgD+, memory IgD− B cells, and plasmacytes are displayed. All comparisons were made using χ2-test or Fisher’s exact test as appropriate. Significant differences among each fraction in the different mice are indicated by asterisks: *p ≤ 0.05, **p ≤ 0.01, ***p ≤ 0.001, ****p ≤ 0.0001.
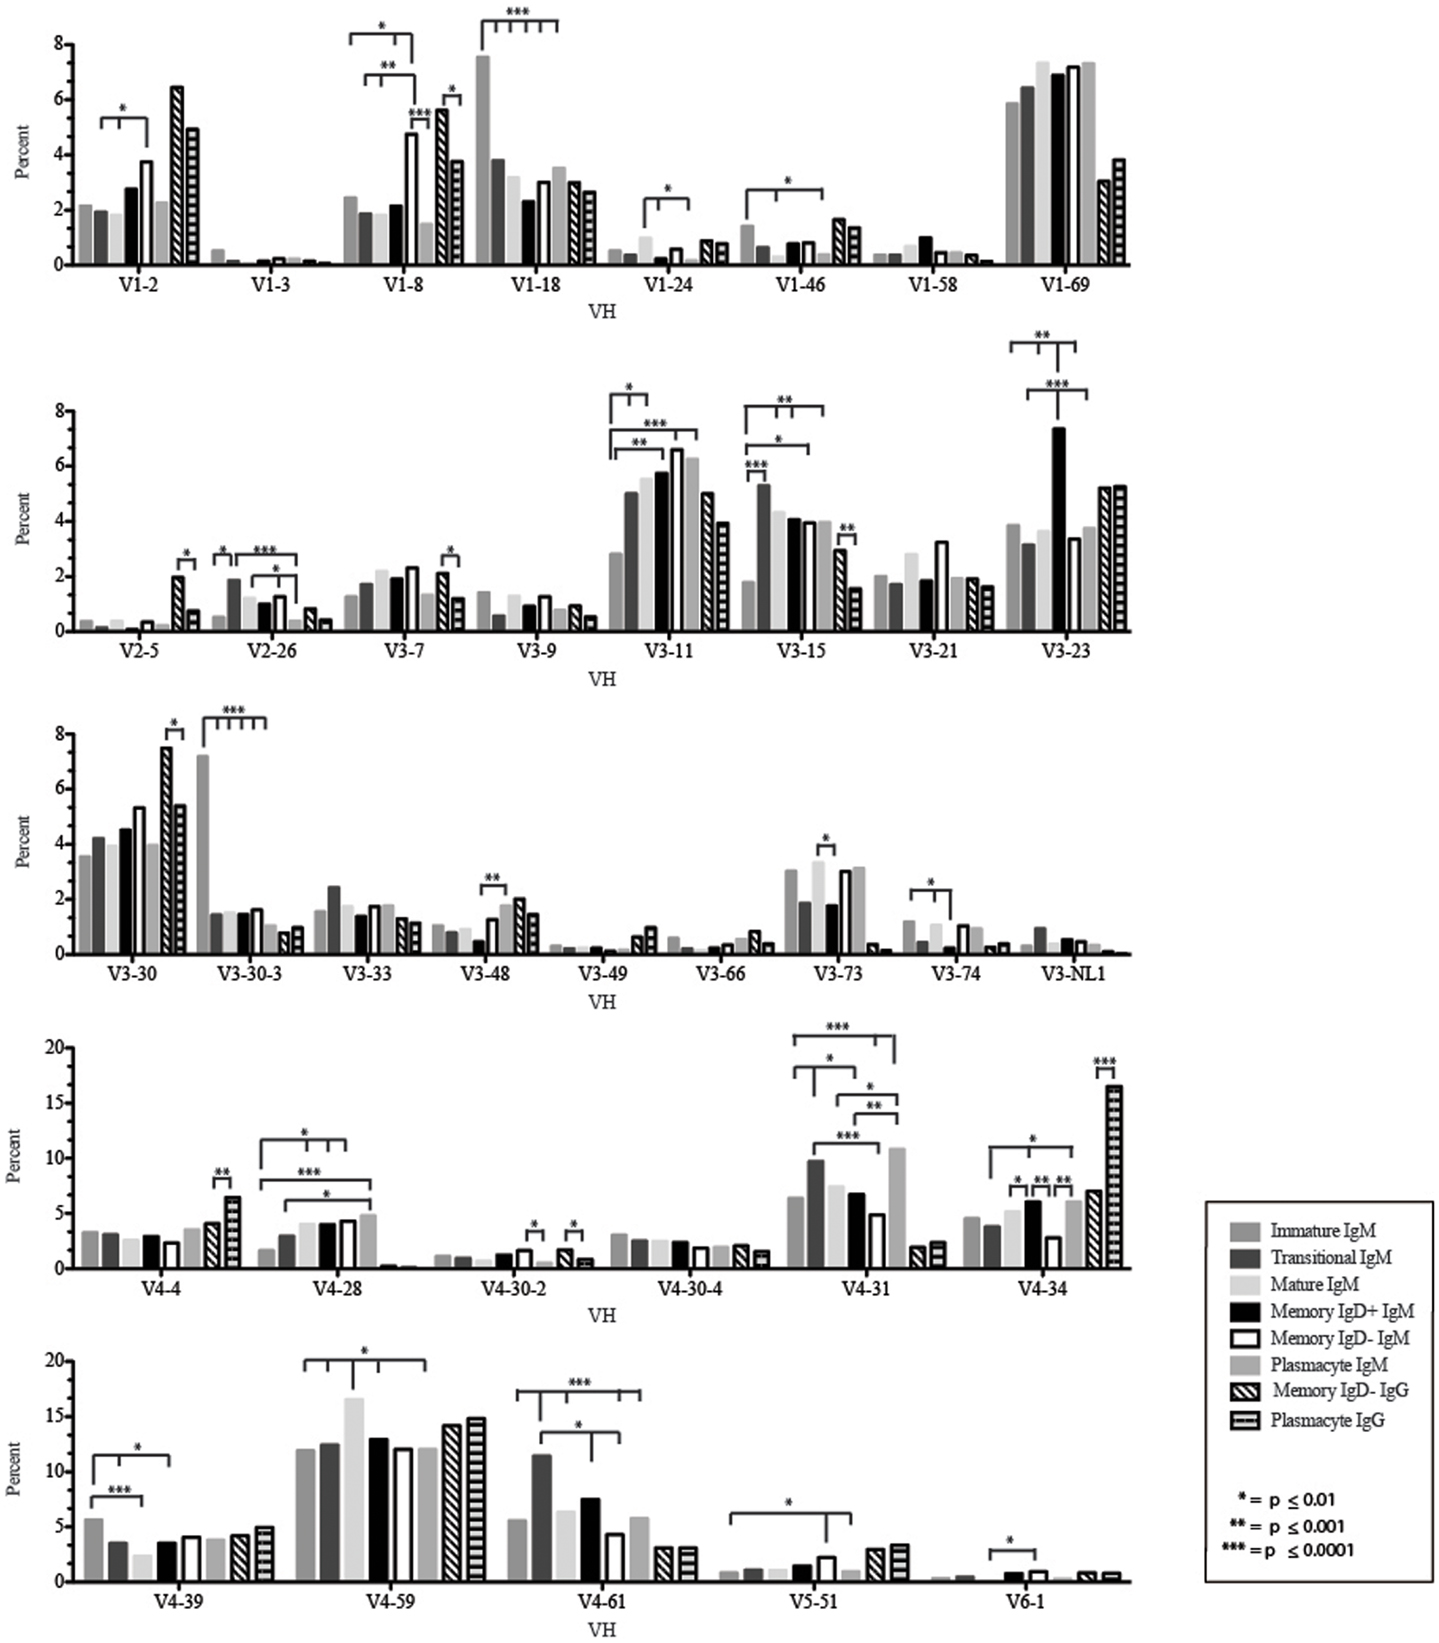
Figure 4. Individual VH gene segment usage in Igμ and Igγ transcripts from selected B cell populations in the blood of a normal, healthy human. Percent of unique, in-frame sequences using the individual VH gene segments specified in the peripheral blood from immature, transitional, mature, memory IgD+, memory IgD− B cells, and plasmacytes are displayed. All comparisons were made using χ2-test or Fisher’s exact test as appropriate. Significant differences among each fraction in the different mice are indicated by asterisks: *p ≤ 0.01, **p ≤ 0.001, ***p ≤ 0.0001.
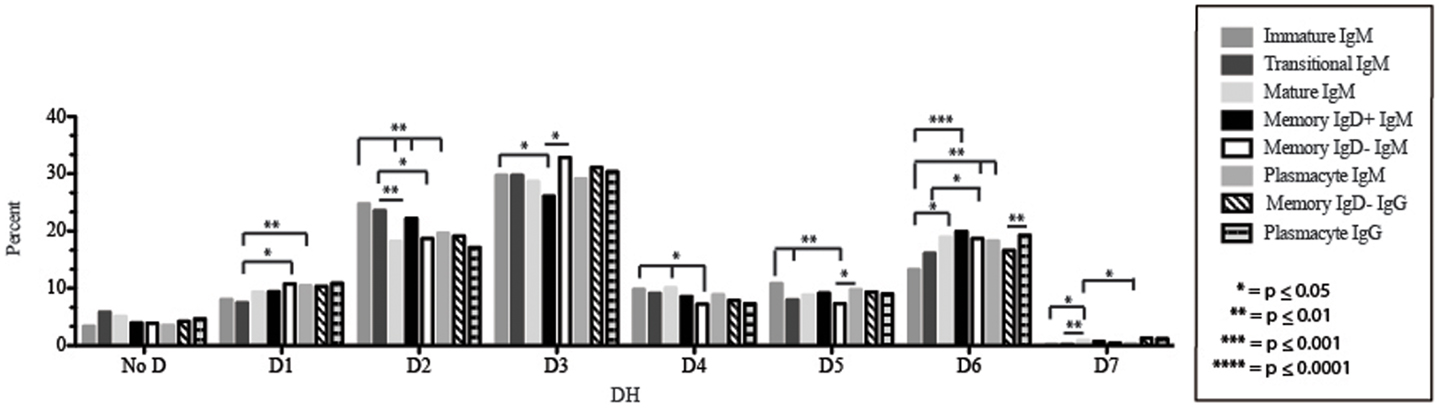
Figure 5. DH family usage in Igμ and Igγ transcripts from selected B cell populations in the blood of a normal, healthy human. The percent of sequences using members of the specified DH family among in-frame reads obtained from the peripheral blood from immature, transitional, mature, memory IgD+, memory IgD− B cells, and plasmacytes are displayed. All comparisons were made using χ2-test or Fisher’s exact test as appropriate. Significant differences among each fraction in the different mice are indicated by asterisks: *p ≤ 0.05, **p ≤ 0.01, ***p ≤ 0.001, ****p ≤ 0.0001.
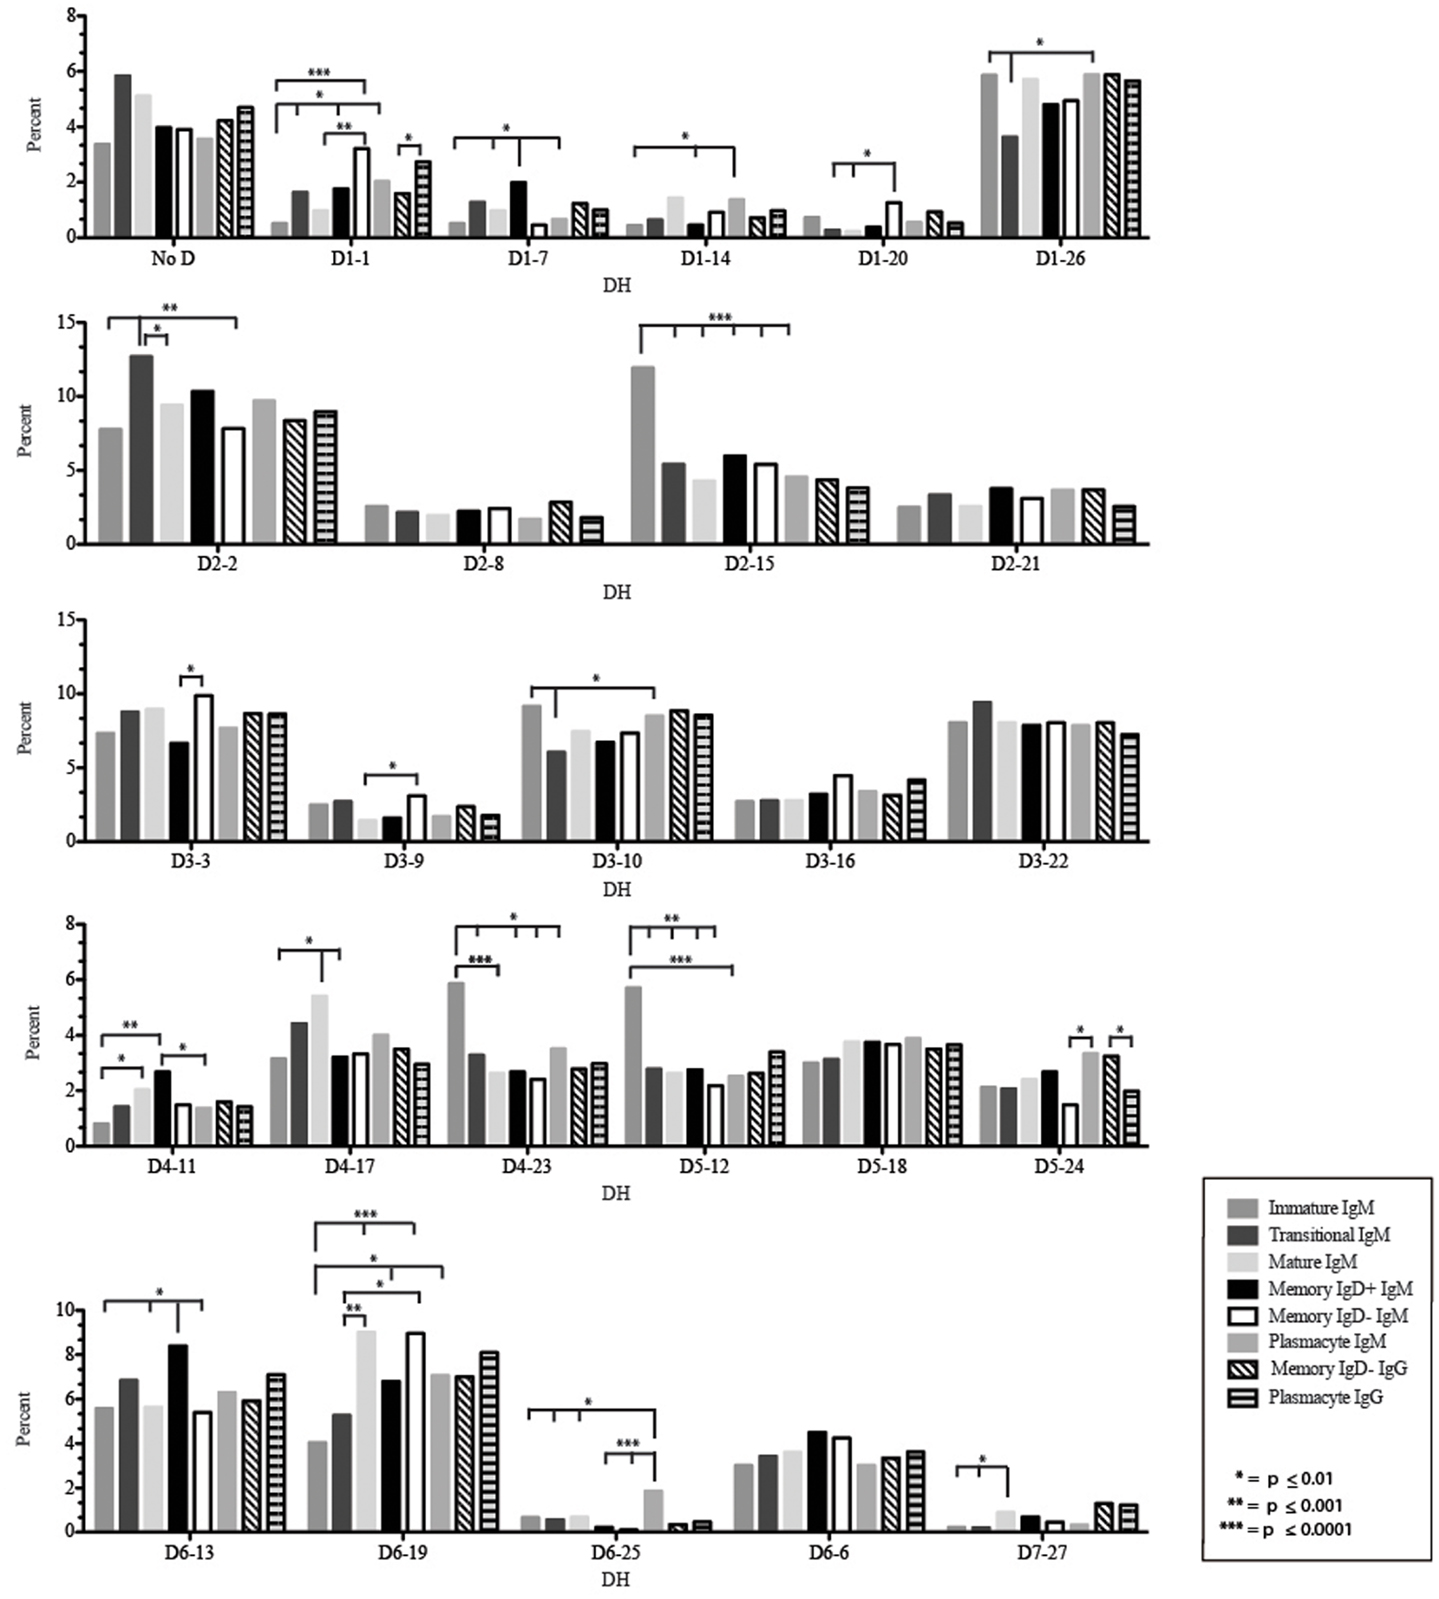
Figure 6. Individual DH gene segment usage in Igμ and Igγ transcripts from selected B cell populations in the blood of a normal, healthy human. Percent of unique, in-frame reads using the individual DH gene segments specified in the peripheral blood from immature, transitional, mature, memory IgD+, memory IgD− B cells, and plasmacytes are displayed. All comparisons were made using χ2-test or Fisher’s exact test as appropriate. Significant differences among each fraction in the different mice are indicated by asterisks: *p ≤ 0.01, **p ≤ 0.001, ***p ≤ 0.0001.
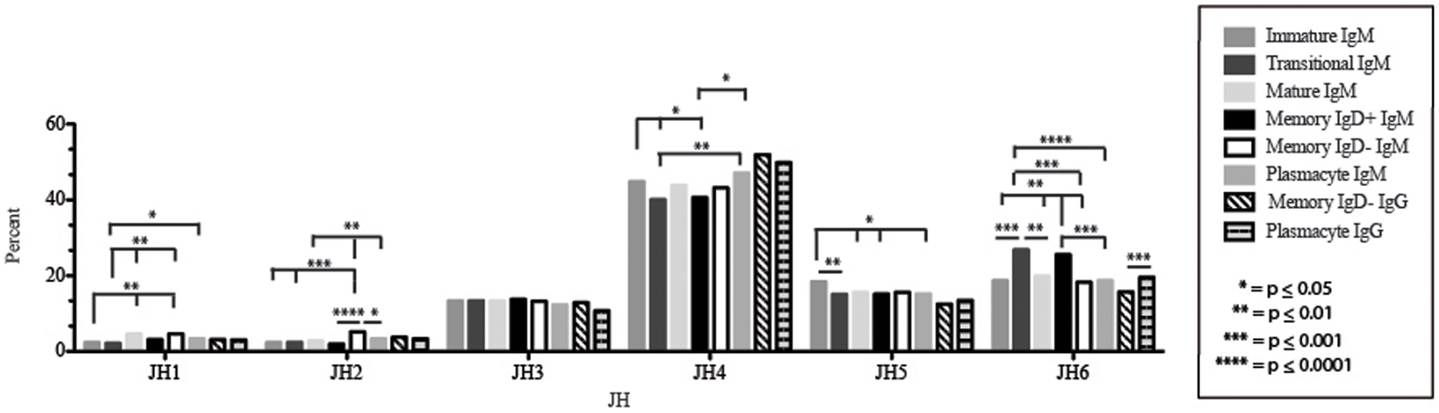
Figure 7. JH usage in Igμ and Igγ transcripts from selected B cell populations in the blood of a normal, healthy human. The percent of sequences using JH1 through JH6 among in-frame reads cloned from the peripheral blood from immature, transitional, mature, memory IgD+, memory IgD− B cells, and plasmacytes are displayed. All comparisons were made using χ2-test or Fisher’s exact test as appropriate. Significant differences among each fraction in the different mice are indicated by asterisks: *p ≤ 0.05, **p ≤ 0.01, ***p ≤ 0.001, ****p ≤ 0.0001.
Amino acid usage in the CDR-H3 loops expressed by these immature B cells varied within a narrow range. When compared to transitional cells, immature B cells used less arginine, asparagine (p = 0.02), aspartic acid (0.04), glutamine (p = 0.009), glutamic acid (p = 0.02), tyrosine (p = 0.002), threonine (p = 0.0039), cysteine (p < 0.0001), and leucine (p = 0.02) (Figure 8). As a result of the decrease in the use of hydrophobic and hydrophilic amino acids, the immature repertoire exhibited the lowest prevalence of highly hydrophobic (hydrophobicity >0.7) CDR-H3 loops (p < 0.05) and the lowest prevalence of the highly hydrophilic (hydrophobicity ≤0.7) CDR-H3 loops of the six subsets examined (Figure 9).
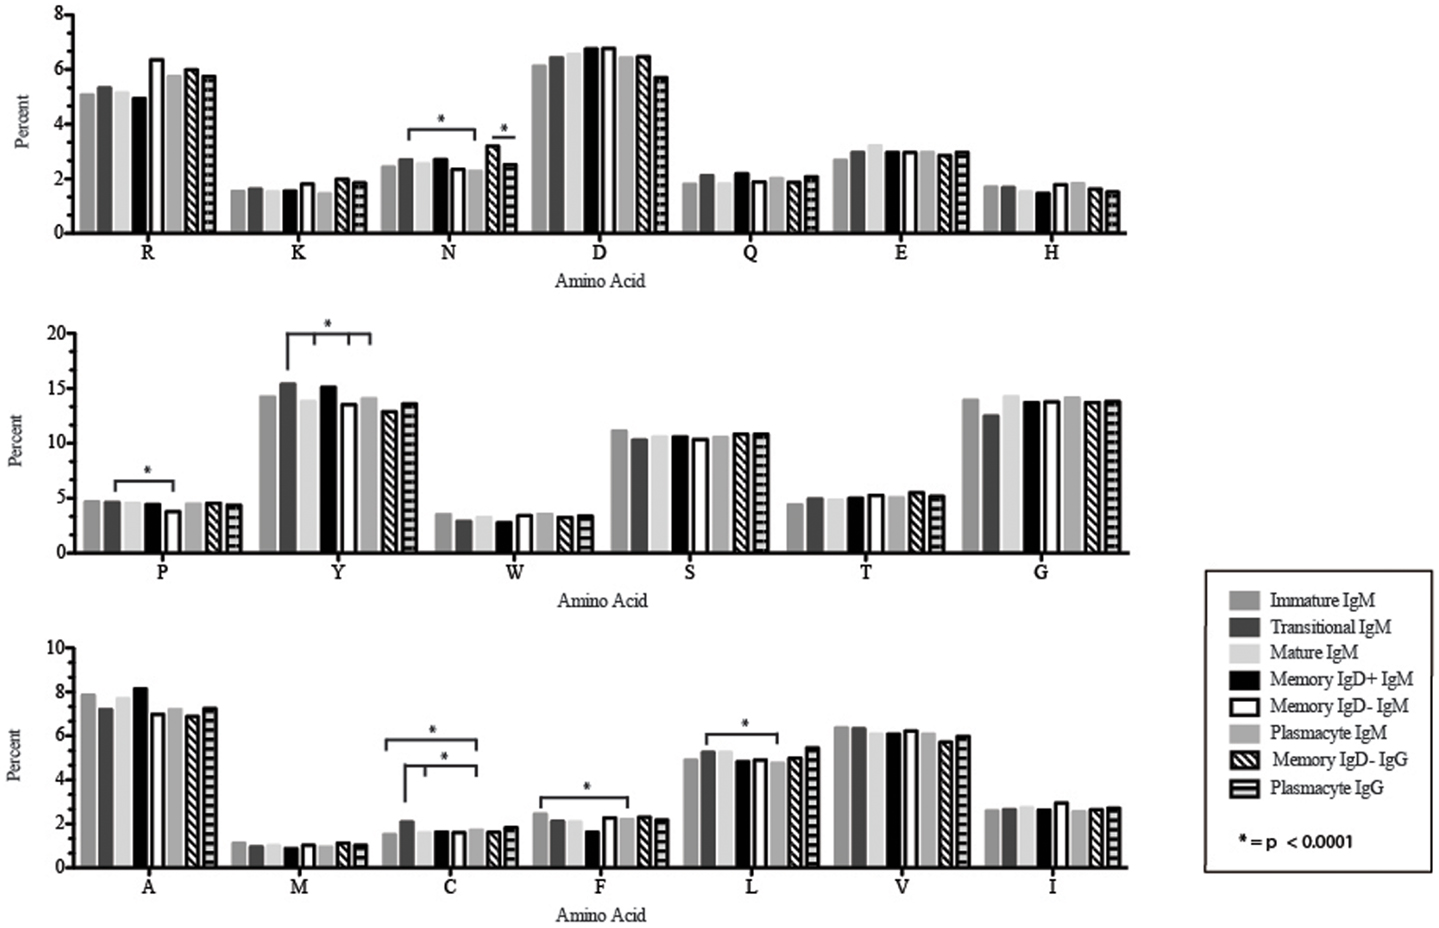
Figure 8. Amino acid usage in the CDR-H3 loop of Igμ and Igγ transcripts from selected B cell populations in the blood of a normal, healthy human. The distribution of individual amino acids is displayed. All comparisons were made using χ2-test or Fisher’s exact test as appropriate. Significant differences among each fraction in the different mice are indicated by asterisk: *p < 0.0001.
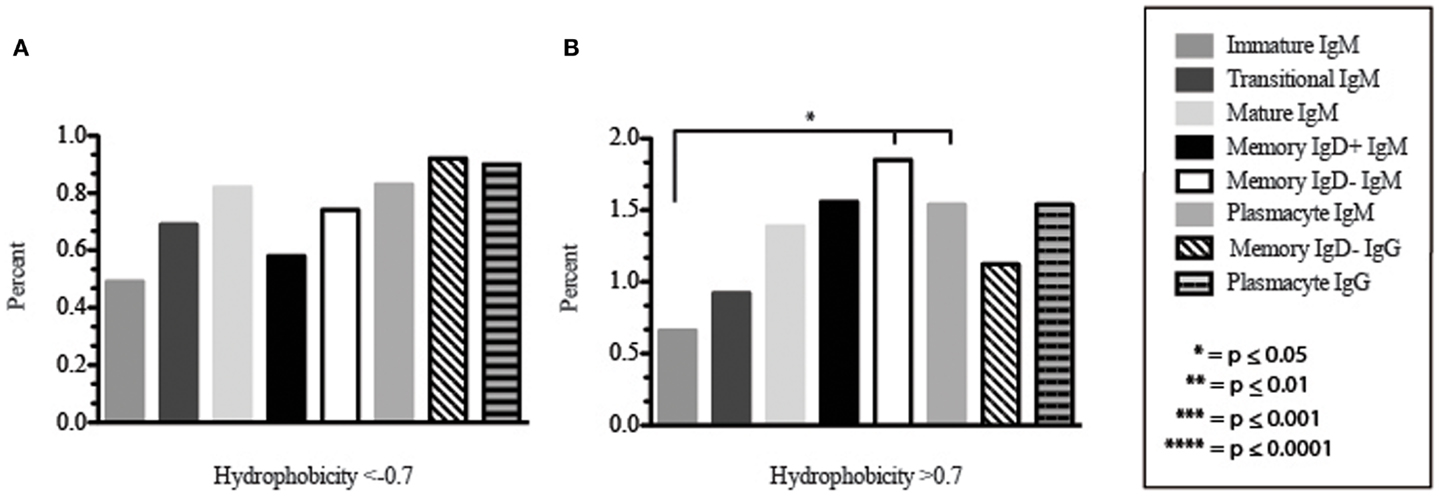
Figure 9. The prevalence of highly charged and highly hydrophobic CDR-H3 loops of Igμ and Igγ transcripts from selected B cell populations in the blood of a normal, healthy human. (A) Prevalence of CDR-H3 loops with an average hydrophobicity of ≤0.7 is displayed. (B) Prevalence of CDR-H3 loops with an average hydrophobicity of >0.7 is displayed. The normalized Kyte–Doolittle hydrophobicity scale (48) and normalized by Eisenberg (49) has been used to calculate average hydrophobicity (23). Prevalence is reported as the percent of the sequenced population of unique, in-frame, open transcripts from each B lineage fraction. All comparisons were made using χ2-test or Fisher’s exact test as appropriate. Significant differences among each fraction in the different mice are indicated by asterisks: *p ≤ 0.05, **p ≤ 0.01, ***p ≤ 0.001, ****p ≤ 0.0001.
The Transitional B Cell Repertoire is Characterized by the Longest CDR-H3 Loop Length, Increased Use of D2–2, and Increased Use of Tyrosine
Of the six subsets examined, the transitional CDR-H3 repertoire was the most heavily enriched for longest CDR-H3 loops (Figure 2). This bias for increased length reflects greater preservation of V(D)J gene segment sequence (Figure 2). Conversely, transitional B cell CDR-H3s were enriched for N nucleotide addition, averaging total 19.68 nucleotides and 9.75 nucleotides at the D → J junction (Figure 2). This was the first in a general pattern of diminishing N addition with maturation. Compared to the immature B cell fraction, there was a significant decrease for VH1 family gene segments (p < 0.001) (Figure 3). By V gene segment, the use of V1–69, V2–26, V3–7, V3–11, V3–15, V3–21, V3–30, V3–33, V3–NL1, V4–28, V4–31, V4–61 was greater than in immature B cells, whereas use of V1–2, V1–3, V1–8, V1–18, V1–24, V1–46, V1–58, V2–5, V3–9, V3–21, V3–23, V3–30–3, V3–48, V3–66, V3–73, V3–74, V4–34, and V4–39 was decreased (Figure 4). The transitional B cell CDR-H3 loop utilized higher levels of DH6 gene segments (not significant), with lower levels of DH5 (p = 0.005) than immature B cells (Figure 5). By D gene assignment, a significant increase in D1–1 (p = 0.09) and D2–2 (p = 0.0002) usage in transitional B cells was observed when compared with the immature fraction, with a compensatory decrease in D1–26 (p = 0.01), D2–15 (p < 0.0001), D3–10 (p = 0.005), D4–23 (p = 0.0026), and D5–12 (p = 0.0004) (Figure 6). The use of JH6 (p = 0.0008) was greater than in immature B cells, while the use of JH4 (p = 0.01) and JH5 (p = 0.09) was decreased (Figure 7).
CDR-H3 loops of these transitional cells used more arginine, lysine, asparagine (p = 0.02), aspartic acid (p = 0.04), glutamine (p = 0.009), glutamic acid (p = 0.02), tyrosine (p = 0.001), threonine (p = 0.003), cysteine (p < 0.0001), and leucine (p = 0.02), while using less tryptophan, serine, glycine, alanine, methionine, and phenylalanine than immature B cells (Figure 8). Of the six subsets studied, transitional B cells exhibited the higher prevalence of charged sequences as compared to the immature fraction (Figure 9). The contrast to the immature population was the most striking, suggesting specific gain of charged CDR-H3s in the transition from the immature to the transitional B cell stage. Conversely, the prevalence of highly hydrophobic CDR-H3s increased when compared to the immature B cell fraction.
The Mature B Cell Subset Demonstrates a Decrease in the Usage of DH2 and JH6, and an Increase in the Percentage of Highly Hydrophobic and Charged CDR-H3 Loops
The mature B cell population was at the median for total CDR-H3 length and for the relative contributions of germline (Figure 2). Conversely, mature B cell CDR-H3s were enriched for N nucleotide addition, averaging 18.22 nucleotides total and 10.22 nucleotides at the V → D junction (Figure 2). In comparison to the transitional B cell repertoire, mature B cells exhibited similar expression of VH family gene usage (Figure 3). An increase in V4–59 (p = 0.01) and a decrease in the use of V4–61 (p < 0.0001), respectively, were observed when compared to the transitional and mature fractions (Figure 4). Use of the DH2 (p = 0.01) family in general, and the D2–2 gene segment (p = 0.01) in particular, was lower than in transitional cells (Figures 5 and 6). There was an increase in the use of JH1 (p = 0.0004) with a decrease in the use of JH6 (p = 0.002) (Figure 7).
CDR-H3 loops demonstrated an increase in the use of glutamine (p = 0.007), with a decrease in tyrosine (p = < 0.0001), cysteine (p = 0.0001), and valine (p = 0.04) (Figure 8). As a result, the mature B cell repertoire was enriched for the use of hydrophobic and charged CDR-H3 loops when compared with immature and transitional subsets (Figure 9).
Memory IgD+ and IgD− B Cells Display Divergent Igμ Repertoires
The Igμ repertoires of the memory IgD+ and memory IgD− blood B cells were distinguishable and divergent from both mature B cells and from each other. The memory IgD+B cell CDR-H3 region exhibited a greater contribution of germline DH and JH gene sequences than memory IgD− (Figure 2). Memory IgD+ B cells used VH4 (p = 0.008) family gene segments more frequently than memory IgD− B cells, and VH1 (p = 0.03) family gene segments less frequently. The memory IgD− B cells used VH1 (p = 0.03) gene segments more frequently and VH4 (p = 0.03) gene segments less frequently than mature B cells (Figure 3). By individual gene VH gene segment, the most prominent differences between memory IgD+and IgD− reflected increased use of V3–23 (p = 0.0003), V4–34 (p = 0.001), V4–61 (p = 0.004) in the former, and decreased use of V1–8 (p = 0.002) and V4–74 (p = 0.02) in the latter (p < 0.0001) (Figure 4), with the exception of V4–31 (p = 0.02, memory IgD−) and V4–59 (p = 0.02, memory IgD+ and p = 0.01, memory IgD−), which was increased among mature B cells (Figure 4).
Igμ from memory IgD+ B cells used D3 (p = 0.01) family DH gene segments less frequently than memory IgD− cells (Figure 5). When compared with mature B cells, the memory IgD+ Igμ repertoire also used D2 and family DH gene segments more frequently and D3 family DH gene segments less frequently (not significant). Finally, memory IgD− B cells appeared to use D3 family DH gene segments more frequently than mature B cells, although this preference did not achieve statistical significance. By individual DH gene segment, the memory IgD+ Igμ repertoire displayed increased use of D6–13 (p = 0.01); and a decrease in use of D3–3 (p = 0.01) (Figure 6). Divergent usage of JH2 and JH6 was also observed (Figure 7). The memory IgD+ Igμ repertoire used JH6 more frequently than the memory IgD− (p = 0.001) or mature B cell Igμ repertoire (p = 0.009); and JH2 (p < 0.0001) less frequently than memory IgD−. JH usage in the memory IgD− Igμ repertoire was very similar to that observed in mature B cells, with the exception of an increase in memory IgD− JH2 usage as compared to the mature B cells (p = 0.007) (Figure 7).
The CDR-H3 loop of the memory IgD+ B Igμ repertoire contained more proline (p = 0.01), tyrosine (p = 0.01), and alanine (p = 0.005); but less arginine (p = 0.001), and tryptophan (p = 0.04) than memory IgD− B cells (Figure 8). The increase in tyrosine reflected increased use of JH6, rather than increased use of reading frame 1. Indeed, use of reading frame 1, 2, and 3 were similar between the memory fractions (Figure 10). When compared to mature B cells, the memory IgD+ Igμ repertoire was similarly enriched for glutamine (p = 0.02) and tyrosine (p = 0.03), and depleted of phenylalanine (p = 0.01). The memory IgD− Igμ repertoire also contained more arginine (p = 0.005) and less proline (p = 0.01) than the mature B cell Igμ repertoire. The memory IgD− Igμ repertoire relatively contained a higher percentage of highly charged CDR-H3s (hydrophobicity >0.7) (1.85%) when compared to the Igμ repertoires of subsequent B cell fractions (Figure 9).
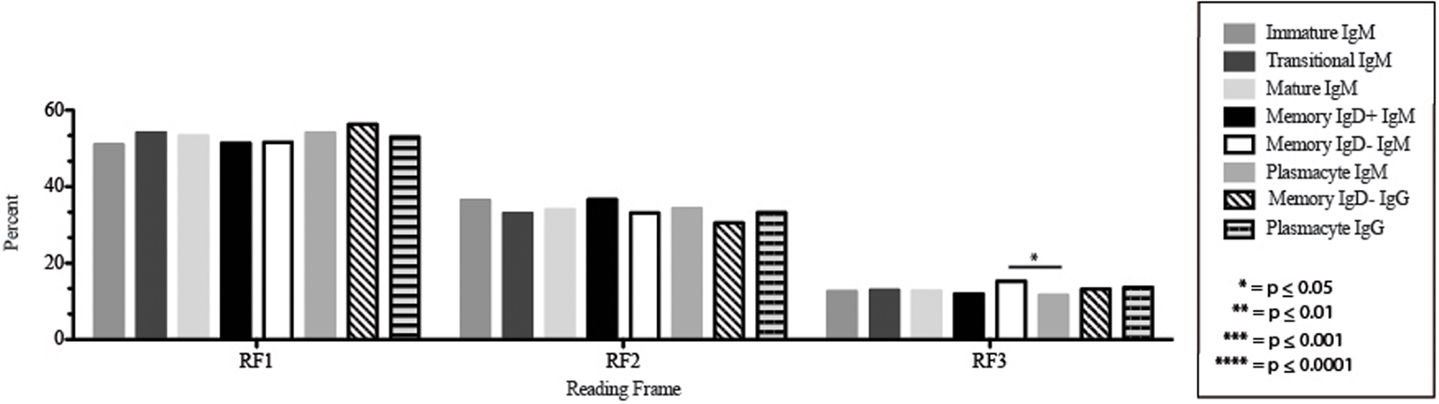
Figure 10. DH reading frame usage in Igμ and Igγ transcripts from selected B cell populations in the blood of a normal, healthy human. The percent of sequences using members of the specified DH family members in reading frames 1, 2, or 3 among in-frame sequences cloned from the peripheral blood from immature B cells through plasmacytes are displayed. All comparisons were made using χ2-test or Fisher’s exact test as appropriate. Significant differences among each fraction in the different mice are indicated by asterisks: *p ≤ 0.05, **p ≤ 0.01, ***p ≤ 0.001, ****p ≤ 0.0001.
The Plasmacyte Igμ Repertoire Diverged from Both the Memory IgD+ and IgD− Igμ Repertoire, as Well as from the Mature B Cell Igμ Repertoire
In comparison to the other Igμ and Igγ repertoires, the CDR-H3 component of the plasmacyte Igμ repertoire exhibited the fewest N nucleotides at both the V → D and D → J junctions, respectively. As a result, not only the Igμ repertoire relatively enriched for germline V(D)J sequence, but also exhibited the shortest average length (Figure 2).
By VH family, plasmacytes exhibited higher usage of VH4 than either memory B cell population, and lower usage of VH2, VH3, and VH5 (Figure 3). These differences were most affected by increased use of V4–34 (p = 0.007, p < 0.0001) when compared to both the memory IgD− and IgD+Igμ repertoires and decreased use of V5–51 (p = 0.01) when compared to the memory IgD− Igμ repertoire (Figure 4).
The distribution of DH gene family usage among the plasmacyte Igμ repertoire was similar to that of the mature B cell Igμ repertoire, but differed for individual families with the two memory B cell Igμ repertoires. There were no statistically significant differences in the use of DH gene segments between the memory IgD+ and the plasmacyte Igμ repertoires. When compared to the memory IgD− Igμ repertoire, the plasmacyte Igμ repertoire used DH5 gene segments more frequently (p = 0.04) (Figure 5). By individual DH gene segment, plasmacytes used D6–25 more frequently (p = 0.006) and D7–27 less frequently (p = 0.03) than mature B cells. Plasmacytes used D6–25 more frequently (p < 0.0001), and D4–11 (p = 0.01), D6–13 (p = 0.04), and D6–6 (p = 0.03) less frequently than the IgD+ memory Igμ repertoire. Finally, plasmacytes used D5–24 (p = 0.007) and D6–25 (p = 0.0001) more frequently, and D3–9 (p = 0.03) less frequently than the memory IgD− Igμ repertoire (Figure 6).
By JH gene segment, the plasmacyte Igμ repertoire displayed similar levels of J gene segments when compared to the mature B cell Igμ repertoire. Plasmacytes expressed higher levels of JH2 (p = 0.01), JH4 (p = 0.01); and lower levels of JH6 than memory IgD+ B cells (p = 0.0004). Finally, plasmacytes expressed lower levels of JH2 (p = 0.04) than memory IgD− B cells (Figure 7).
When compared with the mature B cell Igμ repertoire, plasmacytes expressed lower levels of asparagine (p = 0.02), alanine (p = 0.01), and leucine (p = 0.007) in the CDR-H3 loop. When compared with memory IgD+ B cells, plasmacytes expressed lower levels of asparagine (p = 0.001), aspartic acid (p = 0.02), glutamine (p = 0.04), tyrosine (p = 0.001), and alanine (p = 0.0002); and higher levels of tryptophan (p = 0.02) and phenylalanine (p = 0.01). When compared with the memory IgD− Igμ repertoire, plasmacytes expressed lower levels of arginine (p = 0.02), lysine (p = 0.009), and isoleucine (p = 0.02) (Figure 8).
When comparing the relative prevalence of either highly charged or highly hydrophobic CDR-H3 loops, plasmacytes were enriched for charged CDR-H3 loops (0.84%) in comparison to the five other Igμ repertoires (Figures 9 and 11). The distribution of highly hydrophobic CDR-H3 loops decreased in plasmacytes (1.54%) as compared to memory IgD− B cells (1.85%), and returned to the comparable levels of memory IgD+ B cells (1.56%) (Figure 9).
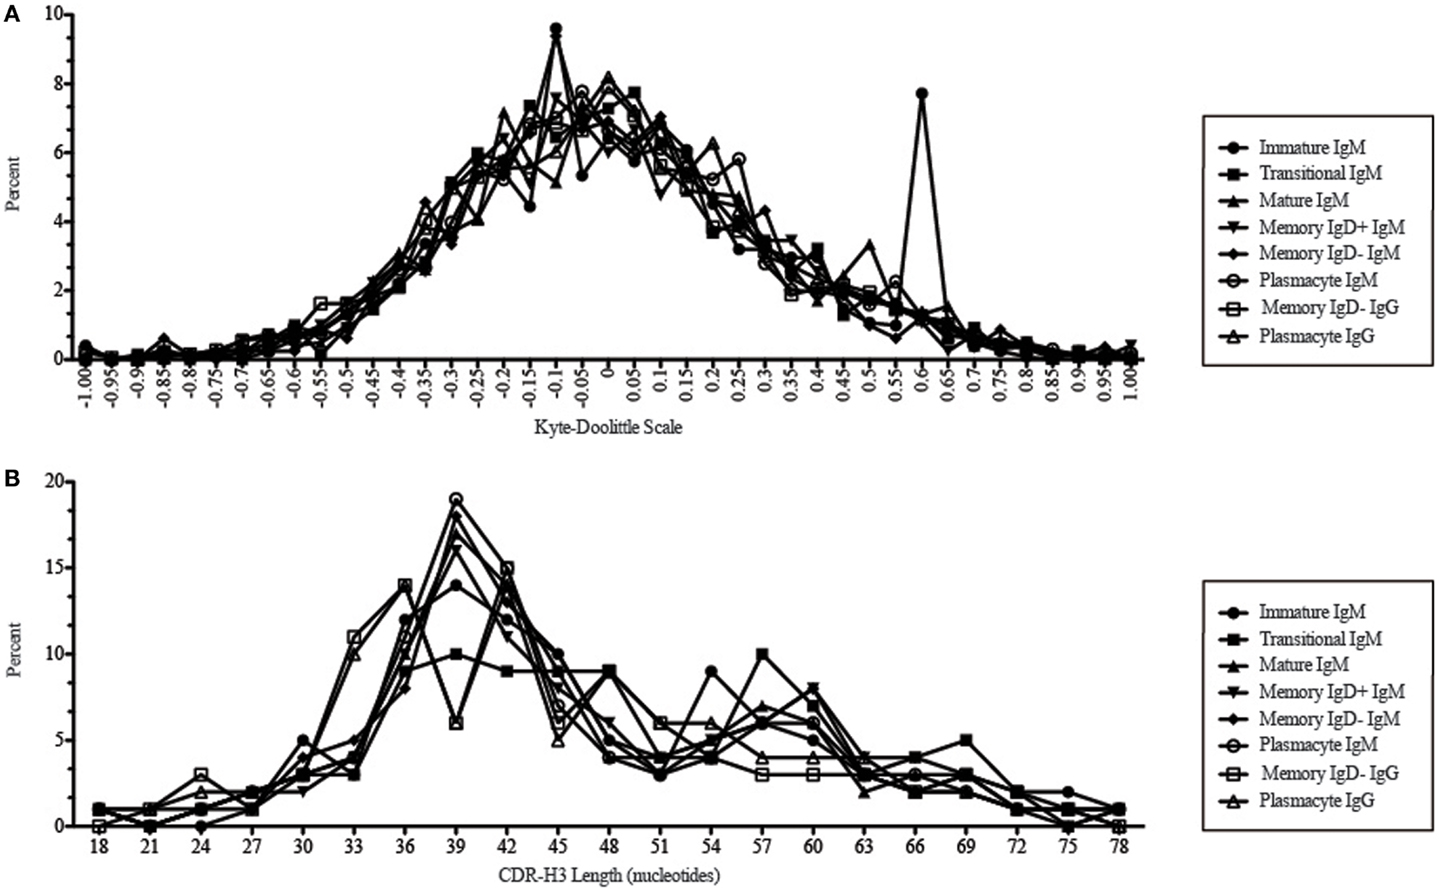
Figure 11. CDR-H3 loop charge and length as a function of B cell development in the peripheral blood of this adult subject. (A) Distribution of CDR-H3 hydrophobicities in Igμ and Igγ transcripts from peripheral blood as a function of B cell development. The Kyte–Doolittle hydrophobicity scale (48) as normalized by Esienberg (49) has been used to calculate average hydrophobicity (30). Although this scale ranges from −1.3 to +1.7, only the range from –1.0 (charged) to +1.0 (hydrophobic) is shown. Prevalence is reported as the percent of the sequenced population of unique, in-frame, open transcripts from each B lineage fraction. (B) Distribution of CDR-H3 lengths in nucleotides of μ and γ H chain transcripts is displayed.
The Plasmacyte Igγ Repertoire Diverged from IgD− IgD+ Memory B Cells
The Igγ repertoires expressed by memory IgD− B cells and plasmacytes were distinguishable and uniquely different from each other. While the average length and V(D)J gene segment length was very similar between the memory IgD− and plasmacytes, differences in the N-region additions were observed. The memory IgD− B cell CDR-H3 region exhibited a greater number of N nucleotide addition at the V-D junction (10.56 nucleotides) as compared to the plasmacytes. Conversely, plasmacytes contained more N nucleotide addition at the D–J junction than memory IgD− B cells (10.08 nucleotides) (Figure 2). Memory IgD− B cells used VH1 (p = 0.03), VH2 (p = 0.0001), and VH3 (p = 0.0003) family gene segments more frequently than plasmacyte; and VH4 (p < 0.0001) family gene segments less frequently (Figure 3). This pattern is due to an increase in individual gene VH gene segment, the most prominent differences between memory IgD− and plasmacytes reflected increased use of V1–2 (p = 0.03), V1–8 (p = 0.003), V2–5 (p = 0.0003), V3–7 (p = 0.01), V3–15 (p = 0.001), V3–30 (p = 0.005), and V4–40–2 (p = 0.01), in the former, and decreased use of V4–4 (p = 0.0007) and V4–34 (p < 0.0001) in the latter (Figure 4).
The memory IgD− Igγ repertoire used D6 (p = 0.01) family DH gene segments less frequently than plasmacyte Igγ (Figure 5). By individual DH gene segment, the memory IgD− Igγ repertoire displayed increased use of D5–24 (p = 0.005) and decreased use of D2–21 (p = 0.03) (Figure 6). The memory IgD− Igγ repertoire used JH6 less frequently than plasmacytes (p = 0.0006) (Figure 7).
The CDR-H3 loop of the memory IgD− Igγ repertoire contained more asparagine (p < 0.0001) and aspartic acid (p = 0.01); but less tyrosine (p = 0.04), cysteine (p = 0.03), and leucine (p = 0.01) than plasmacyte Igγ (Figure 8). The plasmacyte Igγ repertoire was relatively enriched for hydrophobic amino acids, which was reflected by a higher percentage of hydrophobic CDR-H3s (hydrophobicity > 0.7) (1.54%) when compared to the memory IgD− (1.12%) (Figure 9).
The Igμ and Igγ repertoires of analyzed cell types expressed similar distribution of DH reading frames, with reading frame 1 having greatest preference, followed by reading frame 2 and reading frame 3 (Figure 10), while the μH chain plasmacytes used reading frame 3 less likely than memory IgD− B cells (p = 0.03) (Figure 10).
Discussion
In both mice and humans, the composition of the antibody repertoire varies by ontogeny and by developmental stage (29, 37, 50). In order to study this process in detail, we developed a series of tools to evaluate the development of the repertoire in mice. This approach enabled us to identify constraints on V(D)J gene segment preference and CDR-H3 composition that are first established in early B cell progenitors, and then focused as the B lineage cells pass through various developmental checkpoints. The constraints are a reflection of the specific sequence from the contributing gene segments that vary in usage as a function of development (29, 30, 51–55).
Differences in the individual V–D–J gene usage, length, and amino acid composition of the adult human germline repertoires from peripheral blood and specific tissues have been previously reported (37, 50, 56–62), but comparative studies of repertoire development in human blood have been sparse. The difficulty of study is compounded by the enhanced variability of the human repertoire when compared to mice, especially in CDR-H3. This reflects both a greater diversity of the germline sequence of the DH gene segment sequences and an increase in the extent of N addition when compared to mouse. In this work, we sought to use the same tools we had developed for the study of the mouse repertoire to perform a comparative analysis of the expressed in both the Igμ and Igγ repertoires in the blood of a normal, healthy human female in order to gain insight into the forces that shape the repertoire during its passage through the different stages of B cell ontogeny.
While similarities have been reported between the frequency of naïve and memory B cell repertoire usage of the V–D–J gene segments (58, 61, 62), our analysis focuses on a more detailed examination of the repertoires. Our results of low JH1 and JH2 usage across B cell development is consistent with previous published reports of low JH1 and JH2 usage in transitional, naïve, switched, and IgM memory B cell repertoires (Figure 7) (61). Altered expression of individual VH gene segments have been previously also reported in the transitional, naïve, switched, and IgM memory B cell antibody repertoires (61). As in mice, we found changes in V(D)J gene segment usage and CDR-H3 hydrophobicity in the progression from immature to transitional to mature (Figures 3, 5, 7, 9, and 11). These observations support the view that the B cell receptor repertoire continues to be selected throughout early and late B cell development in the peripheral blood. Unlike mice, however, the prevalence of highly charged CDR-H3 loops increased during maturation from the immature to mature cell subsets and memory IgD− to plasmacyte subsets (Figure 9). Also unlike mice, the prevalence of highly hydrophobic CDR-H3 loops also increased in our human study subject. This may reflect a greater tolerance or preference for the use of amino acids encoded by hydrophobic DH reading frame 2 in human B cells exposed to self and non-self antigens (35%) when compared to mice (10%), or a property specific to this particular individual, since patterns of regulation have been shown to differ in mouse strains (Figure 10) (34, 63).
We observed a decrease in the length of CDR-H3 during maturation (Figures 2 and 11). This appears to be part of a continuum of focusing CDR-H3 length in developing B cells in the bone marrow (50) and has been observed by others, as well (61). The use of long CDR-H3 loops has been previously associated with enhanced autoreactivity and polyreactivity (38, 64–66), which are presumably the features of this component of the antibody repertoire that somatic selection are designed to minimize by apoptosis or anergy.
Selection past the mature B cell stage is considered to reflect both endogenous and exogenous antigen exposure. In this regard, the most striking findings of our study were the distinctly different repertoires expressed by the memory IgD+Igμ, the memory IgD− Igμ, and Igγ repertoires; and the plasmacyte Igμ and Igγ repertoires. We did not sort memory B cells or plasmacytes by Igμ or Igγ expression, but were able to identify unique Igμ or Igγ reads through the use of Igμ and Igγ specific primers.
The memory IgD+ and memory IgD− Igμ repertoires displayed differences in virtually all of the features of the repertoire that we evaluated, including V(D)J usage, N addition, DH reading frame usage, CDR-H3 length, CDR-H3 loop amino acid content, and CDR-H3 hydrophobicity (Figures 3–11). Differences in IgD+ and IgD− Igμ repertoires in VH1 gene family usage (p = 0.03) (Figure 3) have been reported previously (61). We observed a similar decrease in usage of VH3–23 (p = 0.0003) between the memory IgD+ and memory IgD− Igμ repertoires (Figure 4) (61). Differences between these two memory Igμ repertoires were further enhanced by altered amino acid usage, especially an increase in arginine (p = 0.001) and decrease of tyrosine (p = 0.01) in the memory IgD− Igμ cell subset as compared to the memory IgD+ Igμ cell subset (Figure 8) (61). The memory IgD− Igμ repertoire exhibited enhanced use of charged amino acids and hydrophobic amino acids (Figure 8). As a result, there was a higher percentage of CDR-H3s with excess charge when compared to the memory IgD+ Igμ repertoire (Figure 9). These observations are consistent with a previous report showing that IgD+ memory cells had levels of negatively charged amino acids comparable to transitional and naïve B cells, while switched memory had more negatively charged residues (Figures 8 and 9) (61).
The vast majority of the IgD+ memory B cell pool also expresses IgM, whereas the IgD− pool expresses class-switched Ig in addition to IgM. Memory B cells expressing both IgM and IgD are considered to be the circulating equivalents of the marginal zone B cell subset in mice; whereas memory B cells restricted to IgM production are considered to represent the more conventional B cell pool, which also is the primary source for class-switched B cells. Thus, our observations regarding the differences in repertoire between the IgD+ and IgD− memory B cell pools fit well within the view that the IgM+IgD+ and IgM+IgD− memory subsets are the products of very different immune responses. In this regard, the marginal zone-like repertoire expressed by our female study subject diverges from the marginal zone repertoire expressed in BALB/c mice in that BALB/c appears tolerant for charged CDR-H3s (35), whereas in our study subject B cells expressing charged CDR-H3s were more likely to be found in the memory IgD− population. Whether this difference represents a common difference between human and mouse, or reflects variation within the outbred human population is unclear and will require analysis of additional study subjects.
The plasmacyte pool represents the products of recently activated mature B cells as well as memory IgD+ and IgD− B cells that have been reactivated. This observation may explain why the plasmacyte repertoire appears intermediate between the memory IgD+ and IgD− repertoires and the mature B cell population. At present, the tools do not exist to separate plasmacytes by derivation. Moreover, the content of the memory and plasmacyte populations are likely to have been heavily influenced by several decades exposure to a variety of endogenous and exogenous antigens as well as by the anatomic niches in which the disparate subsets reside. Our study focused on bulk sequencing rather than analysis of repertoire in cells that were isolated by specific antigen reactivity, thus we cannot define the precise nature of the response to specific antigens. However, the most striking difference between the plasmacyte population and the other subsets in bulk was the decrease in the contribution of N nucleotides to the final product. Coupled with the observation that the greatest contribution of non-germline encoded nucleotides among the six subsets studied was found in the immature B cell fraction, final enrichment for germline V(D)J sequence among plasmacytes supports the view that the germline V domain repertoire has been selected by evolution for maximal advantage in responding to antigen (34–36).
As in mouse, the repertoires expressed by distinct B cell subset appear to differ in human. Sequencing of unsorted B cells from the blood is thus likely to yield an incomplete view of what is actually happening in the immune response of the individual. Our findings support the view that determination of whether diseases of immune function reflect abnormal regulation of these various B cell subsets will require considerable effort to perform deep sequencing of sorted cells from a variety of healthy individuals and patients with immune-mediated disorders (14, 38).
Conflict of Interest Statement
The authors declare that the research was conducted in the absence of any commercial or financial relationships that could be construed as a potential conflict of interest.
Acknowledgments
This work was supported in part by AI090902 and AI007051.
References
1. Hozumi N, Tonegawa S. Evidence for somatic rearrangement of immunoglobulin genes coding for variable and constant regions. Proc Nat Acad Sci U S A (1976) 73:3628–32. doi:10.1073/pnas.73.10.3628
2. Tonegawa S. Somatic generation of antibody diversity. Nature (1983) 302:575–81. doi:10.1038/302575a0
3. Yancopoulos GD, Desiderio SV, Paskind M, Kearney JF, Baltimore D, Alt FW. Preferential utilization of the most JH-proximal VH gene segments in pre-B cell lines. Nature (1984) 311:727–33. doi:10.1038/311727a0
4. Alt FW, Baltimore D. Joining of immunoglobulin heavy chain gene segments: implications from a chromosome with evidence of three D-J heavy fusions. Proc Natl Acad Sci U S A (1982) 79:4118–22. doi:10.1073/pnas.79.13.4118
5. Rajewsky K. Clonal selection and learning in the antibody system. Nature (1996) 381:751–8. doi:10.1038/381751a0
6. Kabat EA, Wu TT. Identical V region amino acid sequences and segments of sequences in antibodies of different specificities: relative contributions of VH and VL genes, minigenes, and complementarity-determining regions to binding of antibody-combining sites. J Immunol (1991) 147:1709–19.
7. Padlan EA. Anatomy of the antibody molecule. Mol Immunol (1994) 31:169–217. doi:10.1016/0161-5890(94)90001-9
8. Xu JL, Davis MM. Diversity in the CDR3 region of V(H) is sufficient for most antibody specificities. Immunity (2000) 13:37–45. doi:10.1016/S1074-7613(00)00006-6
9. Burrows PD, Stephan RP, Wang YH, Lassoued K, Zhang Z, Cooper MD. The transient expression of pre-B cell receptors governs B cell development. Semin Immunol (2002) 14:343–9. doi:10.1016/S1044-5323(02)00067-2
10. Hardy RR, Hayakawa K. B cell development pathways. Annu Rev Immunol (2001) 19:595–621. doi:10.1146/annurev.immunol.19.1.595
11. Keyna U, Beck-Engeser GB, Jongstra J, Applequist SE, Jack HM. Surrogate light chain-dependent selection of Ig heavy chain V regions. J Immunol (1995) 155:5536–42.
12. Kline GH, Hartwell L, Beck-Engeser GB, Keyna U, Zaharevitz S, Klinman NR, et al. Pre-B cell receptor-mediated selection of pre-B cells synthesizing functional mu heavy chains. J Immunol (1998) 161:1608–18.
13. Martin DA, Bradl H, Collins TJ, Roth E, Jack HM, Wu GE. Selection of Ig mu heavy chains by complementarity-determining region 3 length and amino acid composition. J Immunol (2003) 171:4663–71.
14. Meffre E, Casellas R, Nussenzweig MC. Antibody regulation of B cell development. Nat Immunol (2000) 1:379–85. doi:10.1038/80816
15. Kraus M, Alimzhanov MB, Rajewsky N, Rajewsky K. Survival of resting mature B lymphocytes depends on BCR signaling via the Ig α/β heterodimer. Cell (2004) 117:787–800. doi:10.1016/j.cell.2004.05.014
16. Zikherman J, Parameswaran R, Weiss A. Endogenous antigen tunes the responsiveness of naive B cells but not T cells. Nature (2012) 489:160–4. doi:10.1038/nature11311
17. Loder F, Mutschler B, Ray RJ, Paige CJ, Sideras P, Torres R, et al. B cell development in the spleen takes place in discrete steps and is determined by the quality of B cell receptor-derived signals. J Exp Med (1999) 190:75–89. doi:10.1084/jem.190.1.75
18. Liu YJ, Zhang J, Lane PJ, Chan EY, MacLennan IC. Sites of specific B cell activation in primary and secondary responses to T cell-dependent and T cell-independent antigens. Eur J Immunol (1991) 21:2951–62. doi:10.1002/eji.1830211209
19. Jacob J, Kassir R, Kelsoe G. In situ studies of the primary immune response to (4-hydroxy-3-nitrophenyl)acetyl. I. The architecture and dynamics of responding cell populations. J Exp Med (1991) 173:1165–75. doi:10.1084/jem.173.5.1165
20. Garside P, Ingulli E, Merica RR, Johnson JG, Noelle RJ, Jenkins MK. Visualization of specific B and T lymphocyte interactions in the lymph node. Science (1998) 281:96–9. doi:10.1126/science.281.5373.96
21. Jacob J, Kelsoe G. In situ studies of the primary immune response to (4-hydroxy-3-nitrophenyl)acetyl. II. A common clonal origin for periarteriolar lymphoid sheath-associated foci and germinal centers. J Exp Med (1992) 176:679–687. doi:10.1084/jem.176.3.679
22. Klein U, Küppers R, Rajewsky K. Evidence for a large compartment of IgM-expressing memory B cells in humans. Blood (1997) 89:1288–98.
23. Klein U, Rajewsky K, Küppers R. Human immunoglobulin (Ig)M+ IgD+ peripheral blood B cells expressing the CD27 cell surface antigen carry somatically mutated variable region genes: CD27 as a general marker for somatically mutated (memory) B cells. J Exp Med (1998) 188:1679–89. doi:10.1084/jem.188.9.1679
24. Tangye SG, Liu YJ, Aversa G, Phillips JH, de Vries JE. Identification of functional human splenic memory B cells by expression of CD148 and CD27. J Exp Med (1998) 188:1691–703. doi:10.1084/jem.188.9.1691
25. Shi Y, Agematsu K, Ochs HD, Sugane K. Functional analysis of human memory B-cell subpopulations: IgD+ CD27+ B cells are crucial in secondary immune response by producing high affinity IgM. Clin Immunol (2003) 108:128–37. doi:10.1016/S1521-6616(03)00092-5
26. Paus D, Pham RG, Chan TD, Gardam S, Basten A, Brink R. Antigen recognition strength regulates the choice between extrafollicular plasma cell and germinal center B cell differentiation. J Exp Med (2006) 203:1081–91. doi:10.1084/jem.20060087
27. Berek C, Berger A, Apel M. Maturation of the immune response in germinal centers. Cell (1991) 67:1121–9. doi:10.1016/0092-8674(91)90289-B
28. Dal Porto JM, Haberman AM, Shlomchik MJ, Kelsoe G. Antigen drives very low affinity B cells to become plasmacytes and enter germinal centers. J Immunol (1998) 161:5373–81.
29. Schroeder HW Jr, Ippolito GC, Shiokawa S. Regulation of the antibody repertoire through control of HCDR3 diversity. Vaccine (1998) 16:1383–90. doi:10.1016/S0264-410X(98)00096-6
30. Ippolito GC, Schelonka RL, Zemlin M, Ivanov II, Kobayashi R, Zemlin C, et al. Forced usage of positively charged amino acids in immunoglobulin CDR-H3 impairs B cell development and antibody production. J Exp Med (2006) 203:1567–78. doi:10.1084/jem.20052217
31. Ivanov II, Schelonka RL, Zhuang Y, Gartland GL, Zemlin M, Schroeder HW Jr. Development of the expressed immunoglobulin CDR-H3 repertoire is marked by focusing of constraints in length, amino acid utilization, and charge that are first established in early B cell progenitors. J Immunol (2005) 174:7773–80.
32. Schelonka RL, Ivanov II, Jung DH, Ippolito GC, Nitschke K, Zhuang Y, et al. A single DH gene segment creates its own unique CDR-H3 repertoire and is sufficient for B cell development and immune function. J Immunol (2005) 175(10):6624–32.
33. Schelonka RL, Zemlin M, Kobayashi R, Szalai A, Ippolito GC, Zhuang Y, et al. Preferential use of DH reading frame 2 alters B cell development and antigen-specific antibody production. J Immunol (2008) 181:8409–15.
34. Khass M, Buckley K, Kapoor P, Schelonka RL, Watkins LS, Zhuang Y, et al. Recirculating bone marrow B cells in C57BL/6 mice are more tolerant of highly hydrophobic and highly charged CDR-H3s than those in BALB/c mice. Eur J Immunol (2013) 43(3):629–40. doi:10.1002/eji.201242936
35. Raaphorst FM, Raman CS, Tami J, Fischbach M, Sanz I. Human Ig heavy chain CDR3 regions in adult bone marrow pre-B cells display an adult phenotype of diversity: evidence for structural selection of DH amino acid sequences. Int Immunol (1997) 9:1503–15. doi:10.1093/intimm/9.10.1503
36. Schroeder HW Jr, Zemlin M, Khass M, Nguyen HH, Schelonka RL. Genetic control of DH reading frame and its effect on B-cell development and antigen-specific antibody production. Crit Rev Immunol (2010) 30:327–44. doi:10.1615/CritRevImmunol.v30.i4.20
37. Ivanov II, Link JM, Ippolito GC, Schroeder HW Jr. Constraints on hydropathicity and sequence composition of HCDR3 are conserved across evolution. In: Zanetti M, Capra JD, editors. The Antibodies. London: Taylor and Francis Group (2002). p. 43–67.
38. Wardemann H, Yurasov S, Schaefer A, Young JW, Meffre E, Nussenzweig MC. Predominant autoantibody production by early human B cell precursors. Science (2003) 301:1374–7. doi:10.1126/science.1086907
39. Lim PS, Shannon MF, Hardy K. Epigenetic control of inducible gene expression in the immune system. Epigenomics (2010) 2:775–95. doi:10.2217/epi.10.55
40. Ippolito GC, Hoi KH, Reddy ST, Carroll SM, Ge X, Rogosch T, et al. Antibody repertoires in humanized NOD-SCID-IL2Rγ(null) mice and human B cells reveals human-like diversification and tolerance checkpoints in the mouse. PLoS One (2012) 7:e35497. doi:10.1371/journal.pone.0035497
41. Brochet X, Lefranc MP, Giudicelli V. IMGT/V-QUEST: the highly customized and integrated system for IG and TR standardized V-J and V-D-J sequence analysis. Nucleic Acids Res (2008) 36:W503–8. doi:10.1093/nar/gkn316
42. Rogosch T, Kerzel S, Hoi KH, Zhang Z, Maier RF, Ippolito GC, et al. Immunoglobulin analysis tool: a novel tool for the analysis of human and mouse heavy and light chain transcripts. Front Immunol (2012) 3:1–14. doi:10.3389/fimmu.2012.00176
43. Foerster C, Voelxen N, Rakhmamov M, Keller B, Gutenberger S, Goldacker S, et al. B cell receptor mediated calcium signaling is impaired in B lymphocytes of Type Ia patients with common variable immunodeficiency. J Immunol. (2010) 184:7305–13. doi:10.4049/jimmunol.1000434
44. Manjarrez-Orduno N, Quach TD, Sanz I. B cells and immunological tolerance. J Invest Dermatol (2009) 129:278–88. doi:10.1038/jid.2008.240
45. Palanichamy A, Barnard J, Zheng B, Owen T, Quach T, Wei C, et al. Novel human transitional B cell populations revealed by B cell depletion therapy. J Immunol (2009) 182:7982–3. doi:10.4049/jimmunol.0801859
46. Sanz I, Wei C, Lee FEH, Anolik J. Phenotypic and functional heterogeneity of human memory B cells. Semin Immunol (2008) 20:67–82. doi:10.1016/j.smim.2007.12.006
47. Warnatz K, Denz A, Drager R, Braun M, Groth C, Wolff-Vorbeck G, et al. Severe deficiency of switched memory B cells (CD27+IgM-IgD-) in subgroups of patients with common variable immunodeficiency: a new approach to classify a heterogeneous disease. Blood (2002) 99(5):1544–51. doi:10.1182/blood.V99.5.1544
48. Kyte J, Doolittle RF. A simple method for displaying the hydropathic character of a protein. J Mol Biol (1982) 157:105–32. doi:10.1016/0022-2836(82)90515-0
49. Eisenberg D. Three-dimensional structure of membrane and surface proteins. Annu Rev Biochem (1984) 53:595–623. doi:10.1146/annurev.bi.53.070184.003115
50. Schroeder HW Jr. Similarity and divergence in the development and expression of the mouse and human antibody repertoires. Dev Comp Immunol (2005) 30:119–35. doi:10.1016/j.dci.2005.06.006
51. Asma GE, van den Bergh RL, Vossen JM. Characterization of early lymphoid precursor cells in the human fetus using monoclonal antibodies and anti-terminal deoxynucleotidyl transferase. Clin Exp Immunol (1986) 64:356–63.
52. Logtenberg T, Schutte MEM, Ebeling SB, Gmelig-Meyling FHJ, Van Es JH. Molecular approaches to the study of human B-cell and (auto)antibody repertoire generation and selection. Immunol Rev (1992) 128:23–47. doi:10.1111/j.1600-065X.1992.tb00831.x
53. Schelonka RL, Ivanov II, Jung D, Ippolito GC, Nitschke L, Zhuang Y, et al. A single DH gene segment is sufficient for B cell development and immune function. J Immunol (2005) 175:6624–32.
54. Terrell TG, Holmberg CA, Osburn BI. Immunologic surface markers on nonhuman primate lymphocytes. Am J Vet Res (1977) 38:503–7.
55. Zemlin M, Schelonka RL, Ippolito GC, Zemlin C, Zhuang Y, Gartland GL, et al. Regulation of repertoire development through genetic control of DH reading frame preferences. J Immunol (2008) 181:8416–24.
56. Arnaout R, Lee W, Cahill P, Honan T, Sparrow T, Weiand M, et al. High-resolution description of antibody heavy chain repertoires in humans. PLoS One (2011) 6:e22365. doi:10.1371/journal.pone.0022365
57. Boyd SD, Gaeta BA, Jackson KJ, Fire AZ, Marshall EL, Merker JD, et al. Individual variation in the germline Ig gene repertoire inferred from variable region gene rearrangements. J Immunol (2010) 184:6986–92. doi:10.4049/jimmunol.1000445
58. Briney BS, Willis JR, McKinney BA, Crowe JE Jr. High-throughput antibody sequencing reveals genetic evidence of global regulation of the naïve and memory repertoires that extends across individuals. Genes Immun (2012) 13:469–73. doi:10.1038/gene.2012.20
59. Kraj P, Friedman DF, Stevenson F, Silberstein LE. Evidence for the overexpression of the VH4-34 (VH4.21) Ig gene segment in the normal adult human peripheral blood B cell repertoire. J Immunol (1995) 154:6406–20.
60. Stewart AK, Huang C, Stollar BD, Schwartz RS. High-frequency representation of a single VH gene in the expressed human B cell repertoire. J Exp Med (1993) 177:409–18. doi:10.1084/jem.177.2.409
61. Wu YC, Kipling D, Leong HS, Martin V, Ademokun AA, Dunn-Walters DK. High-throughput immunoglobulin repertoire analysis distinguishes between human IgM memory and switched memory B cell populations. Blood (2010) 116:1070–8. doi:10.1182/blood-2010-03-275859
62. Larimore K, McCormick MW, Robins HS, Greenberg PD. Shaping of human germline IgH repertoires revealed by deep sequencing. J Immunol (2012) 189:3221–30. doi:10.4049/jimmunol.1201303
63. Zemlin M, Ippolito GC, Zemlin C, Link J, Monestier M, Schroeder HW Jr. Adult lupus-prone MRL/MpJ2+ mice express a primary antibody repertoire that differs in CDR-H3 length distribution and hydrophobicity from that expressed in the C3H parental strain. Mol Immunol (2005) 42(7):789–98. doi:10.1016/j.molimm.2004.07.049
64. Aguilera I, Melero J, Nunez-Roldan A, Sanchez B. Molecular structure of eight human autoreactive monoclonal antibodies. Immunology (2001) 102:273–80. doi:10.1046/j.1365-2567.2001.01159.x
65. Ichiyoshi Y, Casali P. Analysis of the structural correlates for antibody polyreactivity by multiple reassortments of chimeric human immunoglobulin heavy and light chain V segments. J Exp Med (1994) 180:885–95. doi:10.1084/jem.180.3.885
Keywords: human antibody repertoire, CDR-H3, B cells subsets
Citation: Mroczek ES, Ippolito GC, Rogosch T, Hoi KH, Hwangpo TA, Brand MG, Zhuang Y, Liu CR, Schneider DA, Zemlin M, Brown EE, Georgiou G and Schroeder HW Jr. (2014) Differences in the composition of the human antibody repertoire by B cell subsets in the blood. Front. Immunol. 5:96. doi: 10.3389/fimmu.2014.00096
Received: 11 November 2013; Accepted: 23 February 2014;
Published online: 19 March 2014.
Edited by:
Ignacio Sanz, University of Rochester, USAReviewed by:
I-Hsin Su, Nanyang Technological University, SingaporeMasaki Hikida, Kyoto University, Japan
Copyright: © 2014 Mroczek, Ippolito, Rogosch, Hoi, Hwangpo, Brand, Zhuang, Liu, Schneider, Zemlin, Brown, Georgiou and Schroeder. This is an open-access article distributed under the terms of the Creative Commons Attribution License (CC BY). The use, distribution or reproduction in other forums is permitted, provided the original author(s) or licensor are credited and that the original publication in this journal is cited, in accordance with accepted academic practice. No use, distribution or reproduction is permitted which does not comply with these terms.
*Correspondence: Harry W. Schroeder Jr., Department of Medicine, University of Alabama at Birmingham, SHEL 176, 1530 3rd Avenue South, Birmingham, AL 35294-2182, USA e-mail: hwsj@uab.edu