 Liesbet M. Peeters*†
 Marjan Vanheusden†
 Veerle SomersBart Van WijmeerschPiet Stinissen
 Bieke Broux
 Niels Hellings
- School of Life Sciences, Biomedical Research Institute, Hasselt University, Transnationale Universiteit Limburg, Diepenbeek, Belgium
Multiple sclerosis (MS) is the leading cause of chronic neurological disability in young adults. The clinical disease course of MS varies greatly between individuals, with some patients progressing much more rapidly than others, making prognosis almost impossible. We previously discovered that cytotoxic CD4+ T cells (CD4+ CTL), identified by the loss of CD28, are able to migrate to sites of inflammation and that they contribute to tissue damage. Furthermore, in an animal model for MS, we showed that these cells are correlated with inflammation, demyelination, and disability. Therefore, we hypothesize that CD4+ CTL drive progression of MS and have prognostic value. To support this hypothesis, we investigated whether CD4+ CTL are correlated with worse clinical outcome and evaluated the prognostic value of these cells in MS. To this end, the percentage of CD4+CD28null T cells was measured in the blood of 176 patients with relapsing-remitting MS (=baseline). Multimodal evoked potentials (EP) combining information on motoric, visual, and somatosensoric EP, as well as Kurtzke expanded disability status scale (EDSS) were used as outcome measurements at baseline and after 3 and 5 years. The baseline CD4+CD28null T cell percentage is associated with EP (P = 0.003, R2 = 0.28), indicating a link between these cells and disease severity. In addition, the baseline CD4+CD28null T cell percentage has a prognostic value since it is associated with EP after 3 years (P = 0.005, R2 = 0.29) and with EP and EDSS after 5 years (P = 0.008, R2 = 0.42 and P = 0.003, R2 = 0.27). To the best of our knowledge, this study provides the first direct link between the presence of CD4+ CTL and MS disease severity, as well as its prognostic value. Therefore, we further elaborate on two important research perspectives: 1° investigating strategies to block or reverse pathways in the formation of these cells resulting in new treatments that slow down MS disease progression, 2° including immunophenotyping in prediction modeling studies to aim for personalized medicine.
Introduction
Multiple sclerosis (MS) is a chronic autoimmune disease of the central nervous system (CNS) characterized by inflammation, demyelination, and axonal loss (1). The leading hypothesis states that peripheral autoreactive T cells are activated after encountering self-antigens, after which they migrate across the blood–brain barrier into the CNS (2). Here, these T cells are re-activated, leading to a perpetuation of the local immune response, causing migration of other immune cells to the CNS and ultimately triggering tissue damage (3).
We hypothesize that cytotoxic CD4+ T cells (CTL) drive progression of MS and have prognostic value. CD4+ CTLs are increased in inflammatory conditions and while they protect against infections and tumors, they contribute to progression of autoimmunity and cardiovascular disease (Table 1). Here, we use the loss of the costimulatory molecule CD28 as a hallmark to define cytotoxic CD4+ T cells (CTLs), since this phenotype is very well described in various pathologies. Normally, CD28 costimulation is necessary for the activation, proliferation, and differentiation of T cells. In contrast, CD4+CD28null T cells are costimulation-independent and are still able to participate in immune responses (4). Chronic antigen stimulation leads to the gradual loss of CD28 on CD4+ T cells and induces several phenotypic and functional changes. Expanded CD4+CD28null T cells are found in about 20% of both MS patients as well as healthy controls without obvious differences in numbers (5). CD4+CD28null T cells have shorter telomeres, limited TCR diversity, increased resistance to apoptosis and expression of natural killer (NK) receptors. Furthermore, they produce large amounts of IFN-γ and cytotoxic molecules such as granzyme B and perforin (6).
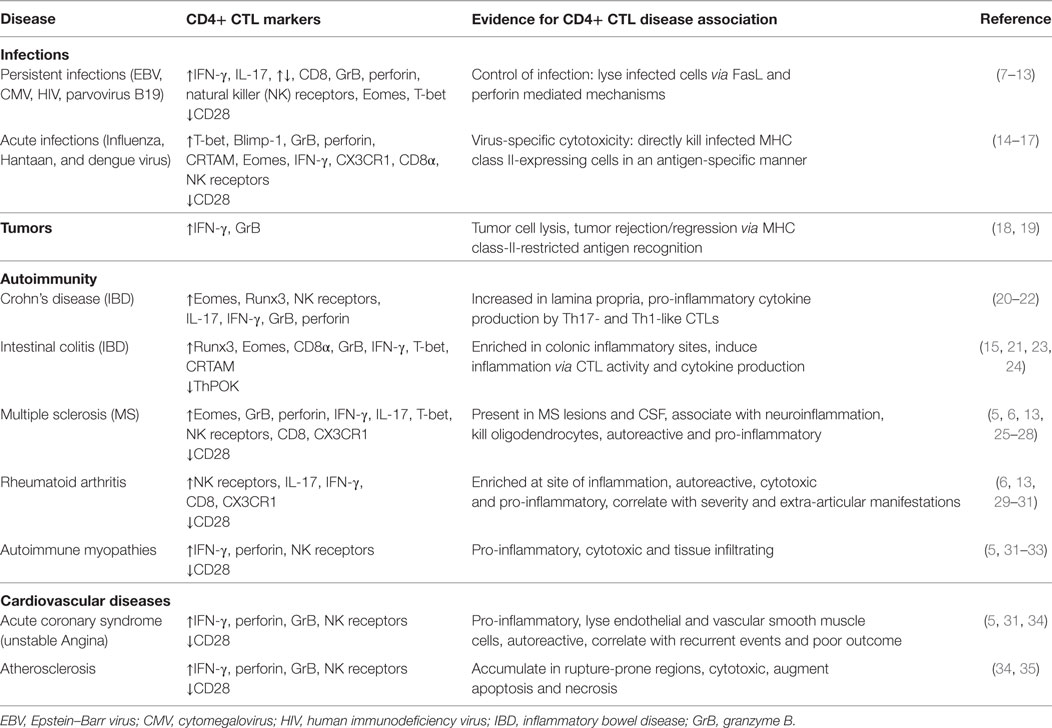
Table 1. Involvement of CD4+ CTLs in different diseases.
To determine the correlation of CD4+CD28null T cells with MS progression, we first assessed whether the presence of these cells is associated with higher disease severity using Kurtzke expanded disability status scale (EDSS) and multimodal evoked potentials (EP) as outcome measures. Second, to identify their prognostic value, we investigated the correlation between the baseline CD4+CD28null T cell percentage and the aforementioned outcome measures 3 and 5 years after baseline assessment.
CD4+CD28null T Cells Drive MS Progression
Expansion of CD4+CD28null T cells is found in several autoimmune and chronic inflammatory diseases, including atherosclerosis (36), RA (37) Graves’ disease (38), Wegener’s granulomatosis (39) and sporadic inclusion body myositis (33) (Table 1). Importantly, the presence of these cells has been shown to be associated with disease severity and poor prognosis in atherosclerosis and RA (40). Recently, we showed that CD4+CD28null T cells are found in the CSF (unpublished data) and brain lesions of MS patients and migrate toward the inflamed CNS (5, 41) and correlate with disability in experimental autoimmune encephalomyelitis (EAE), an animal model of MS (42). While a direct link with MS disease severity was not demonstrated so far, indirect evidence, such as their target tissue infiltrating capacity and cytotoxic activity toward oligodendrocytes, certainly alludes to this (5, 26).
The Presence of CD4+CD28null T Cells is Associated with Disease Severity
We investigated whether the CD4+CD28null T cell percentage is associated with a worse clinical disease course in 176 patients with relapsing-remitting MS (RRMS). Two clinical outcomes were measured: EDSS and multimodal EP combining information on motoric, visual, and somatosensoric EP. Baseline CD4+CD28null T cell percentage is associated with multimodal EP (P = 0.004, R2 = 0.28, Figure 1A), but not with EDSS (P = 0.47, R2 = 0.10, Figure 1D). EP are a more sensitive clinical outcome measure compared to EDSS. EP permit a quantitative assessment of the function of a few well-defined pathways of the CNS, reveal early infra-clinical lesions on the long sensory–motor pathways and have a predictive value regarding the evolution of disability (43–45). Indeed, several research groups have shown that multimodal EP allow monitoring of MS disability, both in cross-sectional and longitudinal studies (43, 44, 46, 47). EDSS and conventional magnetic resonance imaging (MRI) are the most widely used measures of disability. However, the potential limitations of these measures have received increasing attention. Indeed, EDSS appears to be insufficiently sensitive to robust changes in disability over short time frames and its application depends on the interpretation of the neurologist who performs the neurological examination. MRI shows of poor correlation with disability progression (48) and limited predictive value beyond the time of confirmation of diagnosis (49).
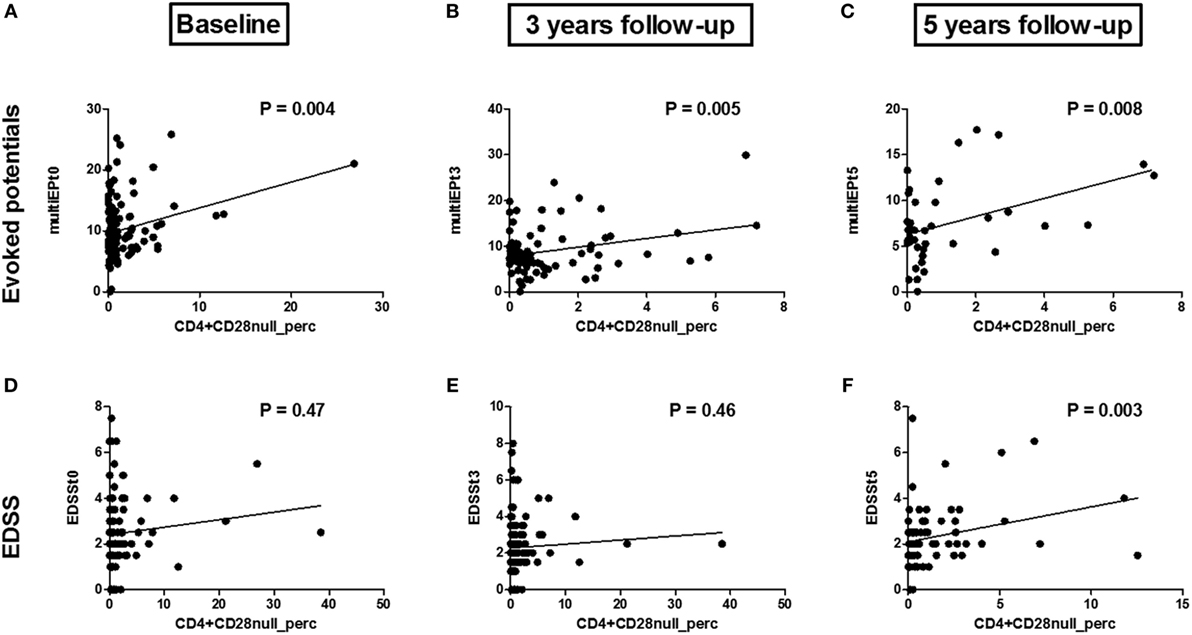
Figure 1. Associations between the CD4+CD28null T cell percentage and multi evoked potential (multiEP) and expanded disability status scale (EDSS): Association between the CD4+CD28null T cell percentage at baseline [(A), t0, N = 109], 3 years [(B), t3, N = 82], and 5 years [(C), t5, N = 39] with multimodal evoked potentials (multiEP). Association between the CD4+CD28null T cell percentage and EDSS at baseline [(D), t0, N = 121], EDSS 3 years post sampling [(E), t3, N = 122], and 5 years post sampling [(F), t5, N = 110]. P-values are corrected for disease duration and gender.
To the best of our knowledge, this is the first time a direct link between CD4+CD28null T cells and MS disease severity has been described. Other researchers have found indirect indications: NKG2D+CD4+ T cells were suggested to be associated with disease activity, since they are increased in the CSF of RRMS patients, with even higher frequencies in the active phases of MS (25). Furthermore, cytotoxic NKG2C+CD4+ T cells are more abundantly present in the blood and brain of MS patients (26). Eomes+CD4+ T cells were also increased in the peripheral blood and CSF of MS patients in the progressive phase of the disease (28). Perforin producing CD4+ T cells are activated and increased in active MS disease, again suggesting that CD4+ CTL may play a role in MS pathogenesis (50). Other CD4+ CTLs, namely cytolytic CD4+ T lymphocyte precursors and NKT cells, were also increased in MS patients (51).
Mechanism(s) of CD4+ CTL Driven MS Progression
We propose that CD4CD28null T cells migrate toward the CNS to exert their cytotoxic and pro-inflammatory functions, in line with our recent finding that CD4+granzyme B+ T cells are present in the spinal cord of EAE mice and their percentages correlate with the extent of demyelination (42). Further research is necessary to elucidate by which mechanism(s) CD4+CD28null T cells contribute to the inflammatory response in autoimmune diseases such as MS. The observed impact of these cells on MS disease severity could be explained by a combination of following mechanisms: (1) production of pro-inflammatory cytokines, thereby augmenting inflammation, (2) infiltration into the CNS, leading to destruction of target tissue and cells via their cytotoxic activity leading to axonal loss similar as described by CD8+ T cells (52), and (3) recruitment of other harmful immune cells (e.g., macrophages) that contribute to inflammation (53, 54). In addition, it remains unknown whether these cells affect regulatory T cells, or whether they contribute to the differentiation of pathogenic T cell subsets (e.g., Th1, Th17).
Inhibiting the Formation of CD4+ CTL could slow down MS Disease Progression
Investigating strategies to block or reverse pathways in the formation of these cytotoxic CD4 T cells may result in new treatments that slow down MS disease progression. Van Oosten et al. showed that intravenous treatment with an anti-CD4 monoclonal antibody was not able to reduce MS activity (55). However, they suggest that a more aggressive depletion of CD4+ cells might lead to a more substantial reduction in MRI activity. In addition, they did not investigate the presence of, or the effect of anti-CD4 antibodies on CD4+ CTL. CD4+CD28null T cells are only present in 20% of the general population (5) and are more resistant to apoptosis (6). Therefore, it is of interest to investigate the differentiation path from CD4+pre-CTLs to CD4+CD28null T cells, the probable end stage of CD4+ CTLs. CD4+ CTLs may originate either from naïve CD4+ T cells or through plasticity of CD4+ effector T helper cells (Figure 2). The formation of CD4+ CTLs is controlled by a combined action of transcriptional regulation and extracellular cues. These extracellular cues could consist of cytokines, T cell receptor stimulation and costimulatory signals, which lead to cytosolic signaling cascades (PI3K pathway and metabolic programs), ultimately altering gene transcriptional programs (17, 56). CD4+ CTL express part of the CD8 T cell lineage transcriptional program (10). Both CD4+ and CD8+ CTLs express, e.g., T-bet, Eomes, Runx3, and Hobit at higher levels compared to their naïve counterparts (57–60). Investigating the pathways involved in the formation of these cells could identify precursor cells defined by the expression of a certain transcription factor or phenotypic marker. Pre-CTLs may be used as an indicator for future expansion of CD4+CD28null T cells, making it more feasible to identify donors at risk of developing aberrant CD4+CTLs. Still, it should be kept in mind that these CD4+pre-CTLs still need to become cytotoxic, indicating that not all pre-CTLs lead to worse disease. Future studies are, therefore, warranted to provide clarity.
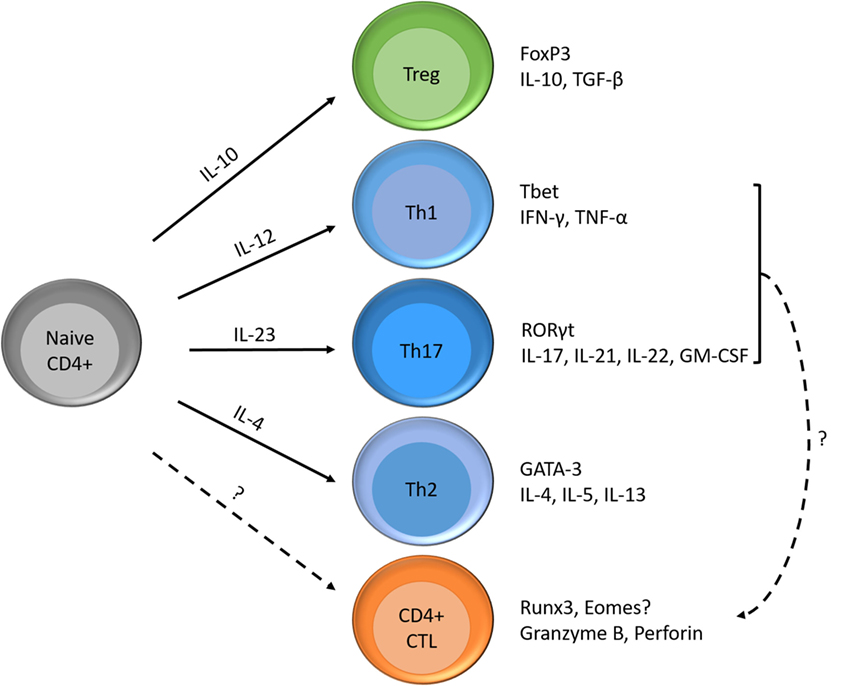
Figure 2. Differentiation possibilities of naïve CD4+ T cells and formation of CD4+ CTLs. Naïve CD4+ T cells can differentiate into T helper cells (e.g., Th1, Th2, and Th17), regulatory T cells and cytotoxic T cells according to the cytokines in their environment. Each subset has its specific transcription factor and produces its signature cytokines. Next to the differentiation of naïve T cells into CD4+ CTLs, Th1, or Th17 cells are also thought to become cytotoxic.
CD4+ CTL have Prognostic Value and Should be Included in Personalized Prediction Models
The prognostic value of CD4+CD28null T cell percentage was tested by measuring EDSS and multimodal EP 3 and 5 years post sampling. After 3 years, there is a significant correlation between baseline CD4+CD28null T cells and multimodal EP (P = 0.005, R2 = 0.29, Figure 1B), but not with EDSS (P = 0.46, R2 = 0.06, Figure 1E). After 5 years, there is a significant correlation with both multimodal EP (P = 0.008, Figure 1C) and EDSS (P = 0.003, R2 = 0.27, Figure 1F). Several studies have shown the validity of multimodal EP in predicting disease severity in MS (43, 44, 61).
There is an urgent need for predictive tools that enable individualized prognostication and thus support personalized clinical decision-making. Considerable effort has been made to identify prognostic factors that estimate baseline risk, but the precision with which this can be done is still limited (62–64). For the era of personalized medicine to move forward in MS, the identification of personalized pathobiology will be critical to steer rational treatment selection (62). Decision support systems built on multidisciplinary data—clinical, laboratory, and genomic—may improve individualized prognostication and lead to better clinical management and decision-making. As shown for other diseases (65), phenotyping of immunological subsets could be valuable approach to help predict disease progression in MS.
Conclusion
In conclusion, CD4+CD28null T cells are associated with MS disease severity and measuring circulating blood levels has prognostic value. It remains unclear to date how CD4+CD28null T cells arise, and at what stage CD4+ T cells acquire irreversible, full-blown cytotoxic activity that contributes to tissue damage and subsequent disease progression in MS. Finding the crucial factors that drive the process of CD4 CTL formation could feed the development of novel therapies to intervene with this process. Moreover, further research should focus on early identification of CD4+ CTL to identify these cells in more MS patients and earlier in the course of the disease thereby facilitating its use as prognostic factor.
Ethics Statement
This study was approved by the ethical committee of the University Hasselt and informed consents were obtained from all donors.
Author Contributions
LP analyzed the data and wrote the manuscript. MV determined the CD4+CD28null T cell percentages and contributed in writing the manuscript. VS, BW, PS, BB, and NH revised the manuscript, participated in the design, and cooperation of the project.
Conflict of Interest Statement
The authors declare that the research was conducted in the absence of any commercial or financial relationships that could be construed as a potential conflict of interest.
Acknowledgments
The authors thank Daisy Mobers for excellent technical assistance.
Funding
This work was supported by the Scientific Research Flanders (FWO, no G021412N). LP is supported by Interuniversity Attraction Pole (IUAP, no IAP VII/39) from the Belspo Agency. BB is an ECTRIMS postdoctoral fellow.
References
1. Ransohoff RM, Hafler DA, Lucchinetti CF. Multiple sclerosis-a quiet revolution. Nat Rev Neurol (2015) 11:134–42. doi:10.1038/nrneurol.2015.14
2. Broux B, Stinissen P, Hellings N. Which immune cells matter? The immunopathogenesis of multiple sclerosis. Crit Rev Immunol (2013) 33:283–306. doi:10.1615/CritRevImmunol.2013007453
3. Sospedra M, Martin R. Immunology of multiple sclerosis. Annu Rev Immunol (2005) 23:683–747. doi:10.1146/annurev.immunol.23.021704.115707
4. Bryl E, Vallejo AN, Weyand CM, Goronzy JJ. Down-regulation of CD28 expression by TNF-alpha. J Immunol (2001) 167:3231–8. doi:10.4049/jimmunol.167.6.3231
5. Broux B, Pannemans K, Zhang X, Markovic-Plese S, Broekmans T, Eijnde BO, et al. CX(3)CR1 drives cytotoxic CD4(+)CD28(-) T cells into the brain of multiple sclerosis patients. J Autoimmun (2012) 38:10–9. doi:10.1016/j.jaut.2011.11.006
6. Broux B, Markovic-Plese S, Stinissen P, Hellings N. Pathogenic features of CD4(+)CD28(-) T cells in immune disorders. Trends Mol Med (2012) 18:446–53. doi:10.1016/j.molmed.2012.06.003
7. Kumar A, Perdomo MF, Kantele A, Hedman L, Hedman K, Franssila R. Granzyme B mediated function of Parvovirus B19-specific CD4(+) T cells. Clin Transl Immunol (2015) 4:e39. doi:10.1038/cti.2015.13
8. van de Berg PJ, Yong SL, Remmerswaal EB, van Lier RA, ten Berge IJ. Cytomegalovirus-induced effector T cells cause endothelial cell damage. Clin Vaccine Immunol (2012) 19:772–9. doi:10.1128/CVI.00011-12
9. Workman AM, Jacobs AK, Vogel AJ, Condon S, Brown DM. Inflammation enhances IL-2 driven differentiation of cytolytic CD4 T cells. PLoS One (2014) 9:e89010. doi:10.1371/journal.pone.0089010
10. Johnson S, Eller M, Teigler JE, Maloveste SM, Schultz BT, Soghoian DZ, et al. Cooperativity of HIV-specific cytolytic CD4 T cells and CD8 T cells in control of HIV viremia. J Virol (2015) 89:7494–505. doi:10.1128/JVI.00438-15
11. Mou D, Espinosa JE, Stempora L, Iwakoshi NN, Kirk AD. Viral-induced CD28 loss evokes costimulation independent alloimmunity. J Surg Res (2015) 196:241–6. doi:10.1016/j.jss.2015.02.033
12. Verma S, Weiskopf D, Gupta A, McDonald B, Peters B, Sette A, et al. Cytomegalovirus-specific CD4 T cells are cytolytic and mediate vaccine protection. J Virol (2016) 90:650–8. doi:10.1128/JVI.02123-15
13. Waschbisch A, Sammet L, Schroder S, Lee DH, Barrantes-Freer A, Stadelmann C, et al. Analysis of CD4+ CD8+ double-positive T cells in blood, cerebrospinal fluid and multiple sclerosis lesions. Clin Exp Immunol (2014) 177:404–11. doi:10.1111/cei.12345
14. Ma Y, Yuan B, Zhuang R, Zhang Y, Liu B, Zhang C, et al. Hantaan virus infection induces both Th1 and ThGranzyme B+ cell immune responses that associated with viral control and clinical outcome in humans. PLoS Pathog (2015) 11:e1004788. doi:10.1371/journal.ppat.1004788
15. Takeuchi A, Badr Mel S, Miyauchi K, Ishihara C, Onishi R, Guo Z, et al. CRTAM determines the CD4+ cytotoxic T lymphocyte lineage. J Exp Med (2016) 213:123–38. doi:10.1084/jem.20150519
16. Weiskopf D, Bangs DJ, Sidney J, Kolla RV, De Silva AD, de Silva AM, et al. Dengue virus infection elicits highly polarized CX3CR1+ cytotoxic CD4+ T cells associated with protective immunity. Proc Natl Acad Sci U S A (2015) 112:E4256–63. doi:10.1073/pnas.1505956112
17. Hua L, Yao S, Pham D, Jiang L, Wright J, Sawant D, et al. Cytokine-dependent induction of CD4+ T cells with cytotoxic potential during influenza virus infection. J Virol (2013) 87:11884–93. doi:10.1128/JVI.01461-13
18. Quezada SA, Simpson TR, Peggs KS, Merghoub T, Vider J, Fan X, et al. Tumor-reactive CD4(+) T cells develop cytotoxic activity and eradicate large established melanoma after transfer into lymphopenic hosts. J Exp Med (2010) 207:637–50. doi:10.1084/jem.20091918
19. Lai Y, Jeng C, Chen C. The roles of CD4+ T cells in tumor immunity. Int Scholar Res Network Immunol (2011) 2011:6. doi:10.5402/2011/497397
20. Pariente B, Mocan I, Camus M, Dutertre CA, Ettersperger J, Cattan P, et al. Activation of the receptor NKG2D leads to production of Th17 cytokines in CD4+ T cells of patients with Crohn’s disease. Gastroenterology (2011) 141:.e1–2. doi:10.1053/j.gastro.2011.03.061
21. Riaz T, Sollid LM, Olsen I, de Souza GA. Quantitative proteomics of gut-derived Th1 and Th1/Th17 clones reveal the presence of CD28+ NKG2D- Th1 cytotoxic CD4+ T cells. Mol Cell Proteomics (2016) 15:1007–16. doi:10.1074/mcp.M115.050138
22. Allez M, Tieng V, Nakazawa A, Treton X, Pacault V, Dulphy N, et al. CD4+NKG2D+ T cells in Crohn’s disease mediate inflammatory and cytotoxic responses through MICA interactions. Gastroenterology (2007) 132:2346–58. doi:10.1053/j.gastro.2007.03.025
23. Lupar E, Brack M, Garnier L, Laffont S, Rauch KS, Schachtrup K, et al. Eomesodermin expression in CD4+ T cells restricts peripheral Foxp3 induction. J Immunol (2015) 195:4742–52. doi:10.4049/jimmunol.1501159
24. Reis BS, Rogoz A, Costa-Pinto FA, Taniuchi I, Mucida D. Mutual expression of the transcription factors Runx3 and ThPOK regulates intestinal CD4(+) T cell immunity. Nat Immunol (2013) 14:271–80. doi:10.1038/ni.2518
25. Ruck T, Bittner S, Gross CC, Breuer J, Albrecht S, Korr S, et al. CD4+NKG2D+ T cells exhibit enhanced migratory and encephalitogenic properties in neuroinflammation. PLoS One (2013) 8:e81455. doi:10.1371/annotation/e93fa4e6-ee8f-468a-8552-0e0aa505beaa
26. Zaguia F, Saikali P, Ludwin S, Newcombe J, Beauseigle D, McCrea E, et al. Cytotoxic NKG2C+ CD4 T cells target oligodendrocytes in multiple sclerosis. J Immunol (2013) 190:2510–8. doi:10.4049/jimmunol.1202725
27. Legroux L, Arbour N. Multiple sclerosis and T lymphocytes: an entangled story. J Neuroimmune Pharmacol (2015) 10(4):528–46. doi:10.1007/s11481-015-9614-0
28. Raveney BJ, Oki S, Hohjoh H, Nakamura M, Sato W, Murata M, et al. Eomesodermin-expressing T-helper cells are essential for chronic neuroinflammation. Nat Commun (2015) 6:8437. doi:10.1038/ncomms9437
29. Andersson AK, Sumariwalla PF, McCann FE, Amjadi P, Chang C, McNamee K, et al. Blockade of NKG2D ameliorates disease in mice with collagen-induced arthritis: a potential pathogenic role in chronic inflammatory arthritis. Arthritis Rheum (2011) 63:2617–29. doi:10.1002/art.30460
30. Groh V, Bruhl A, El-Gabalawy H, Nelson JL, Spies T. Stimulation of T cell autoreactivity by anomalous expression of NKG2D and its MIC ligands in rheumatoid arthritis. Proc Natl Acad Sci U S A (2003) 100:9452–7. doi:10.1073/pnas.1632807100
31. Dumitriu IE. The life (and death) of CD4+ CD28(null) T cells in inflammatory diseases. Immunology (2015) 146:185–93. doi:10.1111/imm.12506
32. Fasth AE, Dastmalchi M, Rahbar A, Salomonsson S, Pandya JM, Lindroos E, et al. T cell infiltrates in the muscles of patients with dermatomyositis and polymyositis are dominated by CD28null T cells. J Immunol (2009) 183:4792–9. doi:10.4049/jimmunol.0803688
33. Pandya JM, Fasth AE, Zong M, Arnardottir S, Dani L, Lindroos E, et al. Expanded T cell receptor Vbeta-restricted T cells from patients with sporadic inclusion body myositis are proinflammatory and cytotoxic CD28null T cells. Arthritis Rheum (2010) 62:3457–66. doi:10.1002/art.27665
34. Mou D, Espinosa J, Lo DJ, Kirk AD. CD28 negative T cells: is their loss our gain? Am J Transplant (2014) 14:2460–6. doi:10.1111/ajt.12937
35. Li Y, To K, Kanellakis P, Hosseini H, Deswaerte V, Tipping P, et al. CD4+ natural killer T cells potently augment aortic root atherosclerosis by perforin- and granzyme B-dependent cytotoxicity. Circ Res (2015) 116:245–54. doi:10.1161/CIRCRESAHA.116.304734
36. Dumitriu IE, Kaski JC. The role of T and B cells in atherosclerosis: potential clinical implications. Curr Pharm Des (2011) 17:4159–71. doi:10.2174/138161211798764834
37. Schmidt D, Goronzy JJ, Weyand CM. CD4+ CD7- CD28- T cells are expanded in rheumatoid arthritis and are characterized by autoreactivity. J Clin Invest (1996) 97:2027–37. doi:10.1172/JCI118638
38. Sun Z, Zhong W, Lu X, Shi B, Zhu Y, Chen L, et al. Association of Graves’ disease and prevalence of circulating IFN-gamma-producing CD28(-) T cells. J Clin Immunol (2008) 28:464–72. doi:10.1007/s10875-008-9213-4
39. Moosig F, Csernok E, Wang G, Gross WL. Costimulatory molecules in Wegener’s granulomatosis (WG): lack of expression of CD28 and preferential up-regulation of its ligands B7-1 (CD80) and B7-2 (CD86) on T cells. Clin Exp Immunol (1998) 114:113–8. doi:10.1046/j.1365-2249.1998.00695.x
40. Scarsi M, Ziglioli T, Airo P. Decreased circulating CD28-negative T cells in patients with rheumatoid arthritis treated with abatacept are correlated with clinical response. J Rheumatol (2010) 37:911–6. doi:10.3899/jrheum.091176
41. Thewissen M, Somers V, Hellings N, Fraussen J, Damoiseaux J, Stinissen P. CD4+CD28null T cells in autoimmune disease: pathogenic features and decreased susceptibility to immunoregulation. J Immunol (2007) 179:6514–23. doi:10.4049/jimmunol.179.10.6514
42. Vanheusden M, Broux B, Welten SP, Peeters LM, Panagioti E, Van Wijmeersch B, et al. Cytomegalovirus infection exacerbates autoimmune mediated neuroinflammation. Sci Rep (2017) 7:663. doi:10.1038/s41598-017-00645-3
43. Giffroy X, Maes N, Albert A, Maquet P, Crielaard JM, Dive D. Multimodal evoked potentials for functional quantification and prognosis in multiple sclerosis. BMC Neurol (2016) 16:83. doi:10.1186/s12883-016-0608-1
44. Leocani L, Rovaris M, Boneschi FM, Medaglini S, Rossi P, Martinelli V, et al. Multimodal evoked potentials to assess the evolution of multiple sclerosis: a longitudinal study. J Neurol Neurosurg Psychiatry (2006) 77:1030–5. doi:10.1136/jnnp.2005.086280
45. Schlaeger R, D’Souza M, Schindler C, Grize L, Kappos L, Fuhr P. Combined evoked potentials as markers and predictors of disability in early multiple sclerosis. Clin Neurophysiol (2012) 123:406–10. doi:10.1016/j.clinph.2011.06.021
46. Fuhr P, Kappos L. Evoked potentials for evaluation of multiple sclerosis. Clin Neurophysiol (2001) 112:2185–9. doi:10.1016/S1388-2457(01)00687-3
47. Schlaeger R, Hardmeier M, D’Souza M, Grize L, Schindler C, Kappos L, et al. Monitoring multiple sclerosis by multimodal evoked potentials: numerically versus ordinally scaled scoring systems. Clin Neurophysiol (2016) 127:1864–71. doi:10.1016/j.clinph.2015.11.041
48. Barkhof F. The clinico-radiological paradox in multiple sclerosis revisited. Curr Opin Neurol (2002) 15:239–45. doi:10.1097/00019052-200206000-00003
49. Barkhof F, Filippi M. MRI – the perfect surrogate marker for multiple sclerosis? Nat Rev Neurol (2009) 5:182–3. doi:10.1038/nrneurol.2009.31
50. Hamilton JA. GM-CSF in inflammation and autoimmunity. Trends Immunol (2002) 23:403–8. doi:10.1016/S1471-4906(02)02260-3
51. Weber WE, Buurman WA, Vandermeeren MM, Medaer RH, Raus JC. Fine analysis of cytolytic and natural killer T lymphocytes in the CSF in multiple sclerosis and other neurologic diseases. Neurology (1987) 37:419–25. doi:10.1212/WNL.37.3.419
52. Bitsch A, Schuchardt J, Bunkowski S, Kuhlmann T, Bruck W. Acute axonal injury in multiple sclerosis. Correlation with demyelination and inflammation. Brain (2000) 123(Pt 6):1174–83. doi:10.1093/brain/123.6.1174
53. Ivanova EA, Orekhov AN. T helper lymphocyte subsets and plasticity in autoimmunity and cancer: an overview. Biomed Res Int (2015) 2015:327470. doi:10.1155/2015/327470
54. Maly K, Schirmer M. The story of CD4+CD28− T cells revisited:solved or still ongoing? J Immunol Res (2015) 2015:11. doi:10.1155/2015/251657
55. van Oosten BW, Lai M, Hodgkinson S, Barkhof F, Miller DH, Moseley IF, et al. Treatment of multiple sclerosis with the monoclonal anti-CD4 antibody cM-T412: results of a randomized, double-blind, placebo-controlled, MR-monitored phase II trial. Neurology (1997) 49:351–7. doi:10.1212/WNL.49.2.351
56. DuPage M, Bluestone JA. Harnessing the plasticity of CD4(+) T cells to treat immune-mediated disease. Nat Rev Immunol (2016) 16:149–63. doi:10.1038/nri.2015.18
57. Braun J, Frentsch M, Thiel A. Hobit and human effector T-cell differentiation: the beginning of a long journey. Eur J Immunol (2015) 45:2762–5. doi:10.1002/eji.201545959
58. Cruz-Guilloty F, Pipkin ME, Djuretic IM, Levanon D, Lotem J, Lichtenheld MG, et al. Runx3 and T-box proteins cooperate to establish the transcriptional program of effector CTLs. J Exp Med (2009) 206:51–9. doi:10.1084/jem.20081242
59. Knox JJ, Cosma GL, Betts MR, McLane LM. Characterization of T-bet and eomes in peripheral human immune cells. Front Immunol (2014) 5:217. doi:10.3389/fimmu.2014.00217
60. Yu SF, Zhang YN, Yang BY, Wu CY. Human memory, but not naive, CD4+ T cells expressing transcription factor T-bet might drive rapid cytokine production. J Biol Chem (2014) 289:35561–9. doi:10.1074/jbc.M114.608745
61. Schlaeger R, D’Souza M, Schindler C, Grize L, Dellas S, Radue EW, et al. Prediction of long-term disability in multiple sclerosis. Mult Scler (2012) 18:31–8. doi:10.1177/1352458511416836
62. Gafson A, Craner MJ, Matthews PM. Personalised medicine for multiple sclerosis care. Mult Scler (2017) 23:362–9. doi:10.1177/1352458516672017
63. Sormani MP, Rio J, Tintore M, Signori A, Li D, Cornelisse P, et al. Scoring treatment response in patients with relapsing multiple sclerosis. Mult Scler (2013) 19:605–12. doi:10.1177/1352458512460605
64. Tintore M, Rovira A, Rio J, Otero-Romero S, Arrambide G, Tur C, et al. Defining high, medium and low impact prognostic factors for developing multiple sclerosis. Brain (2015) 138:1863–74. doi:10.1093/brain/awv105
Keywords: multiple sclerosis, prognosis, multimodal evoked potentials, CD4+CD28null T cells, personalized medicine, prognostic risk factor
Citation: Peeters LM, Vanheusden M, Somers V, Van Wijmeersch B, Stinissen P, Broux B and Hellings N (2017) Cytotoxic CD4+ T Cells Drive Multiple Sclerosis Progression. Front. Immunol. 8:1160. doi: 10.3389/fimmu.2017.01160
Received: 03 July 2017; Accepted: 01 September 2017;
Published: 20 September 2017
Edited by:
Bert A. ’T Hart, Biomedical Primate Research Centre, NetherlandsReviewed by:
Clara Ballerini, University of Florence, ItalyDavid Axel Laplaud, University of Nantes, France
Copyright: © 2017 Peeters, Vanheusden, Somers, Van Wijmeersch, Stinissen, Broux and Hellings. This is an open-access article distributed under the terms of the Creative Commons Attribution License (CC BY). The use, distribution or reproduction in other forums is permitted, provided the original author(s) or licensor are credited and that the original publication in this journal is cited, in accordance with accepted academic practice. No use, distribution or reproduction is permitted which does not comply with these terms.
*Correspondence: Liesbet M. Peeters, liesbet.peeters@uhasselt.be
†Shared first author.