
95% of researchers rate our articles as excellent or good
Learn more about the work of our research integrity team to safeguard the quality of each article we publish.
Find out more
ORIGINAL RESEARCH article
Front. Immunol. , 05 February 2018
Sec. Inflammation
Volume 9 - 2018 | https://doi.org/10.3389/fimmu.2018.00166
This article is part of the Research Topic Mediators and Organ Crosstalk in Sterile and Infectious Inflammation View all 26 articles
 Eszter Pakai1,2Valeria Tekus3,4Csaba Zsiboras1Zoltan Rumbus1Emoke Olah1Patrik Keringer1Nora Khidhir1Robert Matics1Laszlo Deres4,5Katalin Ordog4,5Nikolett Szentes3,4Krisztina Pohoczky3,4Agnes Kemeny4,6Peter Hegyi1,2,7Erika Pinter3,4Andras Garami1*
Neurokinin (NK) signaling is involved in various inflammatory processes. A common manifestation of systemic inflammation is fever, which is usually induced in animal models with the administration of bacterial lipopolysaccharide (LPS). A role for the NK1 receptor was shown in LPS-induced fever, but the underlying mechanisms of how the NK1 receptor contributes to febrile response, especially in the early phase, have remained unknown. We administered LPS (120 µg/kg, intraperitoneally) to mice with the Tacr1 gene, i.e., the gene encoding the NK1 receptor, either present (Tacr1+/+) or absent (Tacr1−/−) and measured their thermoregulatory responses, serum cytokine levels, tissue cyclooxygenase-2 (COX-2) expression, and prostaglandin (PG) E2 concentration. We found that the LPS-induced febrile response was attenuated in Tacr1−/− compared to their Tacr1+/+ littermates starting from 40 min postinfusion. The febrigenic effect of intracerebroventricularly administered PGE2 was not suppressed in the Tacr1−/− mice. Serum concentration of pyrogenic cytokines did not differ between Tacr1−/− and Tacr1+/+ at 40 min post-LPS infusion. Administration of LPS resulted in amplification of COX-2 mRNA expression in the lungs, liver, and brain of the mice, which was statistically indistinguishable between the genotypes. In contrast, the LPS-induced augmentation of COX-2 protein expression was attenuated in the lungs and tended to be suppressed in the liver of Tacr1−/− mice compared with Tacr1+/+ mice. The Tacr1+/+ mice responded to LPS with a significant surge of PGE2 production in the lungs, whereas Tacr1−/− mice did not. In conclusion, the NK1 receptor is necessary for normal fever genesis. Our results suggest that the NK1 receptor contributes to the early phase of LPS-induced fever by enhancing COX-2 protein expression in the periphery. These findings advance the understanding of the crosstalk between NK signaling and the “cytokine-COX-2-prostaglandin E2” axis in systemic inflammation, thereby open up the possibilities for new therapeutic approaches.
The neurokinin-1 (NK1) receptor, formerly also known as substance P (SP) receptor, plays an important role in mediation of local and systemic inflammatory processes (1). As part of systemic inflammation the most often developing thermoregulatory response is fever, which is commonly induced in experimental animals by the administration of bacterial lipopolysaccharide (LPS). In the development of the febrile response to LPS several molecular mechanisms have been already identified (2, 3). In brief, LPS triggers the activation of peripheral macrophages, which then produce inflammatory cytokines such as interleukin (IL)-1β, IL-6, and tumor necrosis factor (TNF)-α and induce the activation of the arachidonic acid cascade. Arachidonic acid is produced from membrane phospholipids by the action of phospholipases A2 [PLA2; reviewed in Ref. (4)] and via alternative pathways, such as monoacylglycerol lipase-dependent hydrolysis (5). In the next step of febrigenesis, the cyclooxygenase-2 (COX-2) enzyme is of crucial importance as it has been shown that selective blockade of COX-2 completely abolishes the fever response (6, 7). Among the end products of the cascade, prostaglandin (PG) E2 is synthesized by terminal PGE synthases, which can be microsomal and cytosolic (8). PGE2 is a key mediator, since it is produced in the periphery already in the early stage of fever (9) and because its binding to EP3 receptors in the hypothalamus triggers the activation of thermogenesis and cutaneous vasoconstriction, thereby resulting in fever (10, 11). In addition to the aforementioned mechanisms, various further substances have been identified as mediators of fever, which also include SP signaling (3, 12).
Indicating the role of SP in fever, when the effects of SP were antagonized with peptide SP analogs, the fever response to LPS was blocked in guinea pigs (13) and in rats (14). Similar attenuation of the LPS-induced fever was observed in rats after administration of the NK1 receptor antagonists CP-96,345 (15) and SR140333B (16). These studies strongly support that SP signaling contributes to the development of LPS-induced fever, but it has remained largely unknown which mediators of the febrile process are influenced by SP or its receptors. In all of these studies, the authors used antagonists, which can be problematic because of their short half-lives, poor brain penetration, and off-target effects (17). In an earlier study, SP inhibited pancreatic bicarbonate secretion via NK2 and NK3 receptors (18), suggesting that the effects of SP or its peptide analog antagonists are not solely mediated by NK1 receptors. In the case of the non-peptide antagonists, it was shown that at higher doses CP-96,345 and SR140333B also block L-type calcium channels (19, 20). Alternative approaches, such as the use of knockout mice, can help to complement the findings with antagonists about the contribution of the NK1 receptor to fever. In addition to complementing the earlier findings with antagonists, by using knockout mice our main goal was to better clarify which step(s) of the classical molecular mechanisms of fever are influenced by the NK1 receptor.
In the present work, we studied how genetic ablation of the NK1 receptor influences the LPS-induced fever response in mice. In thermophysiological experiments, we recorded changes in deep body temperature (Tb) and in the activity of autonomic thermoeffectors in response to LPS and PGE2. To identify the involved molecular mechanisms, we measured serum cytokine levels, as well as tissue COX-2 mRNA and protein expression, and PGE2 concentration in the same animal model.
The experiments were performed in 174 adult mice of both sexes. To minimize the possibility that gender of the mice has an influence on our results, male and female mice were approximately equally distributed in age-matched experimental groups. Of the mice, 86 had the Tacr1 gene, i.e., the gene encoding the NK1 receptor, homozygously present (Tacr1+/+), while 88 absent (Tacr1−/−) due to a targeted disruption (21). The Tacr1−/− mice were generated at the University of Liverpool as described in detail elsewhere (21). The original breeding pairs of the Tacr1−/− mice were donated to the University of Pecs by Dr. John Quinn (University of Liverpool). Their breeding and backcrossing on a C57BL/6 background (for at least 10 generations) were reported in our recent study (22). The mice were housed in standard plastic cages kept in a room with an ambient temperature maintained at 25–27°C and with a humidity of 30–40%. The room was on a 12 h light–dark cycle (lights on at 5:00 a.m.). Standard rodent chow and tap water were available ad libitum. At the time of the experiments, the Tacr1+/+ and Tacr1−/− mice weighed 21 ± 2 and 19 ± 2 g, respectively.
The mice were extensively handled and then habituated to staying inside wire-mesh cylindrical confiners. The cylindrical confiner prevented the animal from turning around, but allowed for some back-and-forth movements; it was used in the thermocouple and respirometry setups (see Experimental Setups).
All procedures were conducted under protocols approved by Institutional Animal Use and Care Committee of the University of Pecs and were in accordance with the directives of the National Ethical Council for Animal Research and those of the European Communities Council (86/609/EEC).
Mice were anesthetized with the intraperitoneal (i.p.) administration of a ketamine–xylazine cocktail (81.7 and 9.3 mg/kg, respectively) and received antibiotic protection intramuscularly (gentamycin, 6 mg/kg). During surgery, a mouse was heated with a temperature-controlled heating pad (model TMP-5a; Supertech Instruments UK Ltd., London, UK) placed under a surgery board. For pain management, ketoprofen (5 mg/kg) was administered subcutaneously at the end of surgery and on the next day. The experiments were performed 4–7 days after the surgery.
For i.p. catheter implantation, a small midline incision was made on the abdominal wall, and then a polyethylene (PE)-50 catheter filled with pyrogen-free saline was inserted into the peritoneal cavity. The internal end of the catheter was fixed to the left side of the abdominal wall with a suture; the free end of the catheter was tunneled under the skin to the nape where it was exteriorized and heat-sealed. The surgical wound was sutured in layers. The catheter was flushed with 0.1 ml of saline on the day after the surgery and every other day thereafter. No sign of discomfort or inflammation was associated with this procedure in the present study and in our other studies in mice (23, 24) and in rats (24, 25).
For intracerebroventricular (i.c.v.) cannula implantation, each mouse was fixed to a stereotaxic apparatus similarly as in our earlier study (26). The scalp was incised over the sagittal suture; the periosteum was excised; the skull was cleaned and dried; two supporting microscrews were driven into the skull; and a small hole was drilled in the skull 0.5 mm posterior from bregma and 1.0 mm lateral from midline. A 22-G steel guide cannula (Plastics One, Roanoke, VA, USA) was attached to a plastic tube fitted into a stereotaxic manipulator (Narishige Scientific Instruments Laboratory, Tokyo, Japan), which was used to insert the cannula into the brain through the bone hole. The tip of the cannula was placed within the right lateral ventricle (2.0 mm from dura). The cannula was secured to the supporting microscrews with dental cement and released from the manipulator. The guide cannula was closed by a dummy cannula.
The thermophysiological experiments were performed in the thermocouple or in the respirometry setup.
In the thermocouple setup, the mouse was placed in a cylindrical confiner and equipped with copper-constantan thermocouples (Omega Engineering, Stamford, CT, USA) to measure colonic temperature (a form of deep Tb) and tail skin temperature (Tsk). The colonic thermocouple was inserted 3 cm deep beyond the anal sphincter and was fixed to the base of the tail with a loop of adhesive tape. The skin thermocouple was positioned on the lateral surface of tail at the border between the proximal and middle third of the tail and secured in place with tape. The thermocouples were plugged into a data logger device (Cole-Palmer, Vernon Hills, IL, USA) connected to a computer. Mice in their confiners were then placed into a temperature-controlled incubator (model MIDI F230S; PL Maschine Ltd., Tarnok, Hungary) set to an ambient temperature of 31°C, which is at the lower end of the thermoneutral zone for mice in this setup. When present, the i.p. catheter was connected to a PE-50 extension filled with the drug of interest. When the mouse had an i.c.v. cannula, a needle injector was fitted into the guide cannula and connected to a PE-50 extension. The extension was passed through a port of the chamber and connected to a syringe. In a separate set of experiments, the mice were exposed to heat or cold by applying similar protocols as in our earlier studies (26, 27). The mice in their confiners were placed into a biochemistry incubator (model BJPX-Newark; Biobase, Jinan, China) initially set to an ambient temperature of 33°C, which was then either raised to 39°C or decreased to 15°C over ~30 min and maintained at 39 or 15°C to expose the mice to heat or cold, respectively.
A mouse designated for an experiment in the respirometry setup was equipped with thermocouples and placed in a confiner as in experiments in the thermocouple setup. Then, the mouse in its confiner was transferred to a Plexiglas chamber of the four-chamber open-circuit calorimeter integrated system (Oxymax Equal Flow, Columbus Instruments), as in our earlier studies (25, 27). The chamber was sealed, submerged into a temperature-controlled (31°C) water bath, and continuously ventilated with room air (200 ml/min). The fractional concentration of oxygen was measured in the air entering and exiting the chamber, and the rate of oxygen consumption (VO2) was calculated according to the manufacturer’s instructions using the Oxymax Windows software (version 3.1). The extension of the i.p. catheter or the i.c.v. needle injector was passed through a port of the chamber and connected to a syringe, which was placed in a syringe pump (model 975; Harvard Apparatus Inc., Holliston, MA, USA).
Lipopolysaccharide from Escherichia coli 0111:B4 was purchased from Sigma-Aldrich (St. Louis, MO, USA). A stock suspension of LPS (5 mg/ml) in pyrogen-free saline was stored at −20°C. On the day of the experiment, the stock was diluted to a final concentration of 36 µg/ml. The diluted LPS suspension or saline was infused (26 µl/min for 4 min) through the extension of the i.p. catheter to deliver LPS at a final dose of 120 µg/kg. Deep Tb, tail Tsk, and VO2 were monitored for 6 h after the injection.
Substance P and PGE2 were purchased from Tocris Bioscience (Bristol, UK). Aliquots of ethanolic stock solutions of SP and PGE2 (10 and 12.5 mg/ml, respectively) were stored at −80°C. On the day of the experiment, the stock solutions were diluted with ethanol and saline to give working solutions of SP and PGE2 (1,000 and 33 µg/ml, respectively) in 10% ethanol. By infusing these solutions into the lateral ventricle (1 µl/min for 3 min), a total dose of either 100 µg/kg SP or 3.3 µg/kg PGE2 was delivered i.c.v. Control mice were infused with the vehicle (10% ethanol in saline). For the infusion, the dummy injector was removed from the preimplanted guide cannula and replaced with a 28-G injector needle (Plastics One) connected to a 10-µl Hamilton syringe by a PE-50 extension. The injector needle protruded 1.0 mm beyond the tip of the guide cannula.
Administration of the substances was carried out between 10:30 a.m. and 12:00 p.m. in the experiments.
Each mouse was implanted with an i.p. catheter and extensively adapted to the experimental setup. On the day of experiment, each mouse was placed in a confiner and transferred to an incubator chamber, which was set to an ambient temperature of 31°C. The i.p. catheter was connected to a PE-50 extension filled with LPS or saline. The extension was passed through a port of the chamber and connected to a syringe, which was placed in a syringe pump (Harvard Apparatus Inc.). Mice were left to acclimate for ~2 h and then infused with LPS or saline as in the thermophysiological experiments. Forty minutes after infusion, the mice were anesthetized with ketamine–xylazine cocktail, which was injected through the extension of the i.p. catheter. Blood samples were collected from the left ventricle. Each sample was transferred to an ice-cold Eppendorf tube containing EDTA (40 µl) and trasylol (20 µl). The collected blood was immediately centrifuged at 1,000 rpm for 5 min, then at 4,000 rpm for 10 min, and the resulting plasma was stored at −80°C. For collection of lung, liver, and brain tissue samples for RT-qPCR, Western blot, and immunoassay protocols, each mouse was perfused through the left ventricle with 0.1 M phosphate-buffered saline. Samples of the liver and the right lung were collected rapidly and snap frozen in liquid nitrogen. The anesthetized mouse was decapitated, its entire brain was removed and frozen. All tissue samples were stored at −80°C.
The serum level of TNF-α was determined with enzyme-linked immunosorbent assay (ELISA) by using a commercially available mouse TNF ELISA kit (BD OptEIA catalog nr: 560478; BD Biosciences, San Jose, CA, USA), which had a detection limit of 31 pg/ml for TNF-α. PGE2 concentrations in the lungs, liver, and brain were measured by ELISA using a commercially available kit (catalog nr: 514010; Cayman Chemical, Ann Arbor, MI, USA); the samples were prepared according to the manufacturer’s instructions. The assay had a sensitivity of 15 pg/ml for PGE2. Detections were performed by using the Labsystem Multiskan RC plate reader (Thermo Scientific, Waltham, MA, USA), as in our earlier study (22).
Serum concentrations of granulocyte-macrophage colony-stimulating factor (GM-CSF) and IL-6 were determined by Luminex’s xMAP® Technology using a multiplex bead immunoassay kit (catalog nr: LMC0003; Invitrogen, Carlsbad, CA, USA). After thawing, serum samples were centrifuged (1,000 g for 10 min) to prevent clogging of the filter plate. The measurement was performed according to the manufacturer’s instructions. Following previous optimizations, all samples were tested undiluted in a blind fashion. Luminex 100 (Luminex Corporation, Austin, TX, USA) was used for the immunoassay and Luminex 100 IS software to analyze the bead median fluorescence intensity, as in our recent study (28). All the tests were run in duplicate. 50 µl of each sample or standard solution was added to a 96-well filter plate (provided with the kit) containing 25 µl of antibody-coated fluorescent beads. Biotinylated secondary antibodies and streptavidin-PE were added to the samples with alternate incubation and washing steps. After the last washing, 100 µl of working wash solution was added to the wells. The plate was read on the Luminex 100 array reader. The detection limits for IL-6 and GM-CSF with this method were 29 and 18 pg/ml, respectively. Data were analyzed with the MasterPlex 2.0 software, using a five-PL regression curve to plot the standard curve.
As in previous studies by our group (28, 29), total RNA was prepared using the TRI Reagent (Molecular Research Center, Inc., Cincinnati, OH, USA) and Direct-Zol™ RNA isolation kit (Zymo Research, Irvine, CA, USA) following the manufacturer’s instructions. Then, the samples were treated with DNase I (Zymo Research, Irvine, CA, USA) to remove contaminating genomic DNA and quantified with a NanoDrop ND-2000 spectrophotometer (NanoDrop Technologies, Wilmington, DE, USA). One microgram of total RNA was reverse transcribed with a Maxima™ First Strand cDNA Synthesis Kit for RT-qPCR (Thermo Scientific). Reactions were performed on Stratagene Mx3000P QPCR System (Agilent Technologies, Santa Clara, CA, USA), using glyceraldehyde 3-phosphate dehydrogenase (GAPDH) as the reference gene. GAPDH was chosen because of its stable expression and because it was successfully used in earlier studies to measure relative COX-2 mRNA expression in LPS-induced fever (30–32). Each reaction contained 2 µl of cDNA, 10 µl Luminaris Color HiGreen Low ROX qPCR Master Mix (Thermo Scientific), 0.3 µM of each primer (10 µM), and 6.8 µl of water. The following primer pairs were used to amplify the target loci: GAPDH sense: 5'-TTCACCACCATGGAGAAG-3' and antisense: 5'-GGCATGGACTGTGGTCATGA-3'. COX-2 sense: 5'-GGGTTGCTGGGGGAAGAAA-3' and antisense: 5'- CTCTGCTCTGGTCAATGGAGG-3'. Amplification was carried out under the following conditions: 95°C for 10 min, followed by 40 cycles of 95°C for 30 s, 60°C for 45 s, and 72°C for 45 s. All RT-PCR reactions were carried out in triplicate and included a melt curve analysis to ensure specificity of signal. Relative expression ratios were calculated using MxPro QPCR Software (Agilent Technologies) with the ΔΔCt method, using samples of untreated animals, as a control. Primer efficiencies were taken into account when calculating gene expression ratios (33).
Western blot procedures were carried out according to the protocols used in our recent study (34). Lung, liver, and brain tissue samples (~50 mg) were homogenized in ice-cold Tris buffer (50 mM, pH 8.0), containing protease inhibitor cocktail (1:100) and 50 mM of sodium vanadate (Sigma-Aldrich).
Brain samples required additional preparation procedures. To each brain sample, 625 µl of a methanol:chloroform (2:1) mixture was added, and the samples were incubated for 10 min at room temperature with slight agitation. Then, without inhibitors an equal volume (208 µl) of chloroform and Tris buffer (50 mM) was added to each brain sample, and the samples were centrifuged for 10 min (13,000 rpm, room temperature). The supernatants were removed from the protein disks into a new Eppendorf tube, and the bottom layer (containing chloroform) was discarded. Then, the supernatants and protein disks were sonicated on ice twice for 3 s. Trichloroacetic acid was added to the samples at a final concentration of 5% followed by incubation on ice for 10 min. The precipitates were pelleted by centrifugation for 10 min (13,000 rpm, room temperature). The supernatants were discarded, and the pellets were redissolved in Tris buffer (70 mM, pH 8.0). The sonication was repeated as described earlier.
Then, the lung, liver, and prepared brain samples were processed similarly. To each sample, 2× concentrated sodium dodecyl sulfate (SDS)-polyacrylamide gel electrophoresis sample buffer was added. Proteins were separated on 10% SDS-polyacrylamide gel and transferred to nitrocellulose membranes. After blocking (1 h with 2% non-fat milk in Tris-buffered saline), membranes were probed overnight at 4°C with primary antibodies (1:1,000) binding to the 75-kDa COX-2 protein (catalog nr: ab15191; Abcam Plc., Cambridge, UK). Based on the previous studies measuring LPS-induced COX-2 protein expression with Western blot (30, 35, 36), we used GAPDH as the loading reference. Membranes were washed six times for 5 min in Tris-buffered saline, containing 0.1% Tween before addition of goat anti-rabbit horseradish peroxidase-conjugated secondary antibody (1:3,000 dilution; Bio-Rad, Budapest, Hungary). Membranes were washed again as before, and the antibody–antigen complexes were visualized by enhanced chemiluminescence. After scanning, the results were quantified by using ImageJ software (NIH, Bethesda, MD, USA).
Data on deep Tb, tail Tsk, and VO2 were compared by three-way ANOVA, while for comparison of serum cytokine levels, COX-2 expression, and PGE2 concentrations two-way ANOVA was used. As in our previous studies (25, 26), ANOVA was followed by the Fisher least significant difference post hoc test. For statistical analysis, Sigmaplot 11.0 (Systat Software, San Jose, CA, USA) software was used. The effects were considered significant when P < 0.05. All data are reported as mean ± SE.
The basal deep Tb of the mice was nearly identical regardless of either gender or genotype in the thermocouple setup throughout the time period when substance administrations were performed in the fever experiments (Figure S1 in Supplementary Material).
To evaluate whether Tacr1−/− mice can appropriately activate warmth- and cold-defense mechanisms, we studied the thermoregulatory response of these mice to ambient heating and cooling, respectively. To reveal even a small deficiency in heat defenses, we used a severe heat exposure model that results in ~6°C rise in deep Tb. When exposed to heat, the mice of both genotypes (Tacr1+/+ and Tacr1−/−) responded with rapid, near-maximal tail skin vasodilation with Tsk approaching 41°C (Figure S2A in Supplementary Material). Neither the Tsk response nor the Tb response differed between the genotypes. Hence, Tacr1−/− mice are fully capable of increasing heat loss through their tails and defending their deep Tb against heat.
To reveal even a small deficiency in cold defenses, we used a severe cold exposure model that results in a pronounced drop in deep Tb. When exposed to cold in this model, the mice of both genotypes responded with tail skin vasoconstriction (a decrease in Tsk), but even so their Tb decreased by ~6°C (Figure S2B in Supplementary Material). The response dynamics did not differ between the two genotypes. Hence, the thermoregulatory response of Tacr1−/− mice to cooling is unaltered.
In thermophysiological experiments, we compared the fever response between Tacr1+/+ and Tacr1−/− mice. When treated with LPS (120 µg/kg, i.p.), the mice of both genotypes developed fever as compared to saline-treated mice (Figures 1A,B). However, the effects of both the treatment × time interaction [ANOVA, F(42,1376) = 2.114, P < 0.001] and treatment × genotype interaction [F(1,1376) = 40.908, P < 0.001] were significant on their Tb response. LPS-treated Tacr1+/+ mice responded with a typical fever response: their deep Tb started to increase at 20 min, plateaued (~38.5°C) between 40 and 100 min, then it gradually decreased, but remained elevated compared to saline treatment throughout the experiment (Fisher LSD test, P < 0.05 at 30–360 min). These findings are in line with those reported previously (37). In Tacr1−/− mice, the LPS-induced fever response was less pronounced than in Tacr1+/+ mice, reaching the level of significance at 40–110 min compared to saline treatment (Fisher LSD test, P < 0.05) (Figure 1A). The LPS-induced increase in deep Tb was brought about by an elevation of VO2, changing with parallel dynamics as Tb in both genotypes (Figures 1A,B). Similar to Tb, the effects of both the treatment × time interaction [ANOVA, F(42,1161) = 1.618, P < 0.01] and treatment × genotype interaction [F(1,1161) = 15.802, P < 0.001] were significant on the VO2 of the mice. After LPS treatment, the VO2 was significantly higher compared to saline at 40–350 min in Tacr1+/+ mice (Fisher LSD test, P < 0.05) and at 40–140 min in Tacr1−/− mice (Fisher LSD test, P < 0.05). Since the experiments were carried out at the lower end of the thermoneutral zone, the mice exhibited cutaneous vasoconstriction (as indicated by their low tail Tsk), thus no further decrease in tail Tsk was observed. Importantly, the Tb of the LPS-treated Tacr1−/− mice was markedly (0.5–0.7°C) lower than that of Tacr1+/+ mice starting from 40 min post-LPS infusion until the end of the experiment. Parallel with Tb, the LPS-induced elevation of VO2 was also suppressed in Tacr1−/− mice compared to their Tacr1+/+ littermates (Figure 1A). The LPS-induced elevation of both parameters was significantly attenuated in Tacr1−/− mice compared to Tacr1+/+ mice at 40–120 min (Fisher LSD test, P < 0.05 for intergenotype difference) (Figure 1A). The infusion of saline did not cause any effect on deep Tb, tail Tsk, and VO2 in the mice of either genotype (Figure 1B). Our results demonstrate that LPS-induced fever is attenuated in Tacr1−/− mice already in the early stage (i.e., starting from ~40 min). Next, we wanted to know the suppression of which part of the “pyrogenic cytokine-COX-2-PGE2 axis” is responsible for attenuating the fever response in the absence of Tacr1.
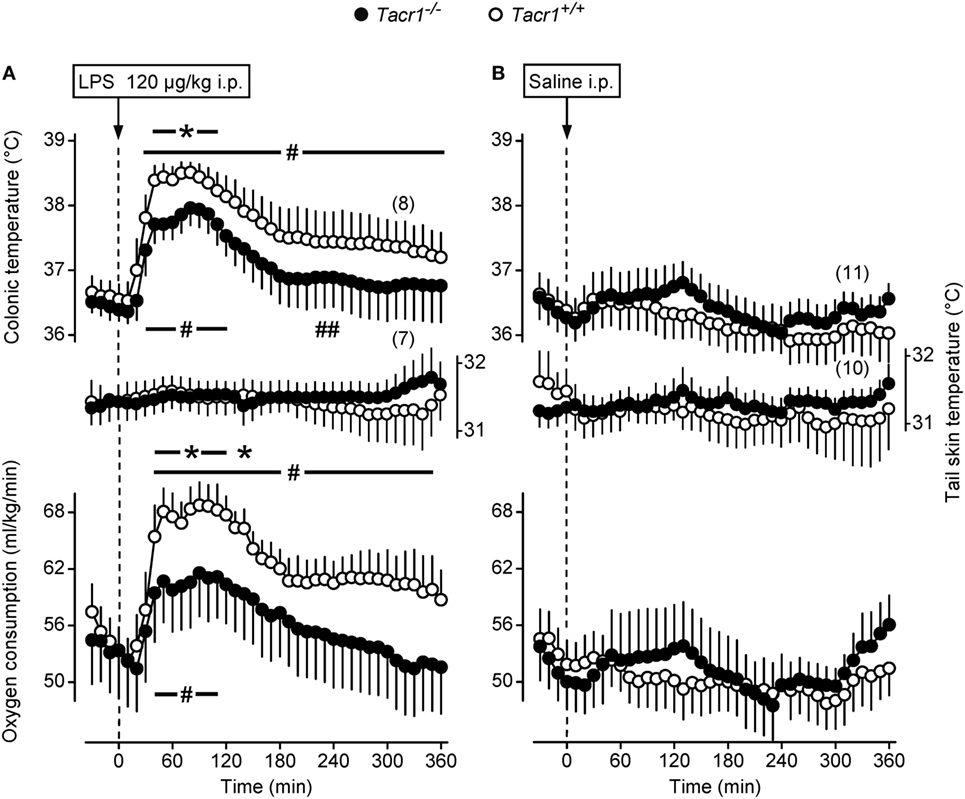
Figure 1. Thermoeffector and colonic temperature responses of Tacr1+/+ and Tacr1−/− mice to lipopolysaccharide (LPS) (A) or saline (B) administered intraperitoneally (i.p.). The changes in colonic temperature [a form of deep body temperature (Tb)] are shown in the upper panel; alterations in the activity of the two main autonomic thermoeffectors, skin temperature (Tsk) and rate of oxygen consumption (VO2) are depicted in the middle and lower panels, respectively. These experiments were performed in the respirometry setup at an ambient temperature of 31°C. Number of animals in the corresponding groups are indicated in the figure. *P < 0.05, intergenotype difference in the response to LPS. #P < 0.05, LPS vs. saline difference within the same genotype as determined by the Fisher LSD test.
First, we studied whether the effect of PGE2, i.e., the key mediator of fever (2), is also reduced in the Tacr1−/− mice. As the main site of the febrigenic action of PGE2 is situated in the preoptic area of the hypothalamus (10), we compared the thermoregulatory effects of i.c.v. injected PGE2 between Tacr1+/+ and Tacr1−/− mice. In response to PGE2 the mice of both genotypes rapidly developed a marked elevation in deep Tb and VO2 (Figure 2A), while administration of the vehicle did not cause any effects in either genotype (Figure 2B). The effect of the treatment × time interaction was significant with regard to both Tb and VO2 [ANOVA, F(18,380) = 29.406, P < 0.001 and F(18,380) = 11.922, P < 0.001, respectively], whereas the effects of the genotype or the treatment × genotype interaction were not significant on either deep Tb or VO2. Of note, there was no attenuation in either the Tb or VO2 rise in the Tacr1−/− mice compared to their Tacr1+/+ littermates. These experiments were conducted under identical conditions as those with LPS, including the ambient temperature (31°C) near the lower end of the thermoneutral zone, which can explain why we did not observe any change in the tail Tsk in the mice of either genotype. Our results with PGE2 rule out the possibility that Tacr1−/− mice are unable to activate their thermogenesis and increase their Tb to stimuli other than LPS. More importantly, the lack of attenuation in the PGE2-induced thermoregulatory response of the Tacr1−/− mice suggests that their reduced fever response to LPS is due to a more upstream suppression in the febrigenic molecular pathway.
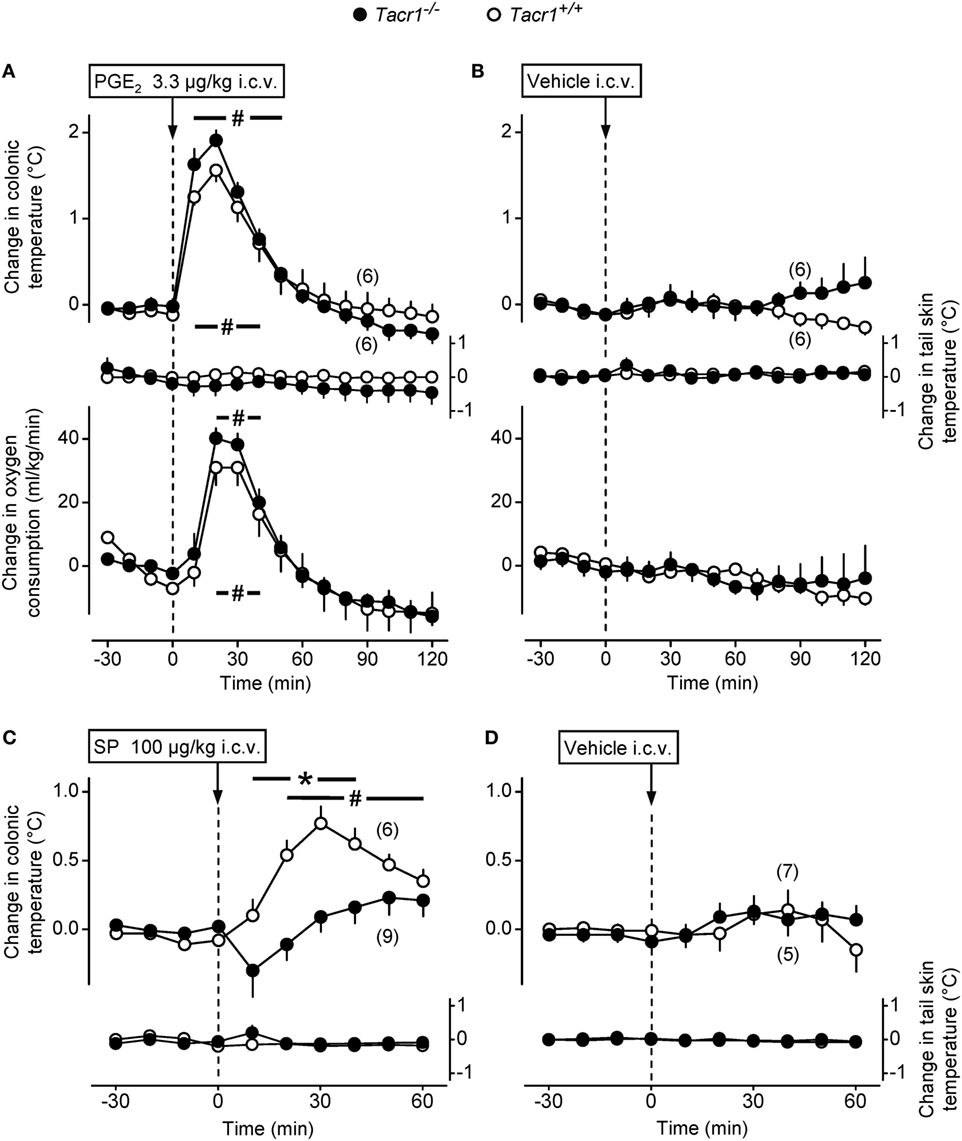
Figure 2. The thermoregulatory response of Tacr1+/+ and Tacr1−/− mice to prostaglandin (PG) E2 and substance P (SP) administered intracerebroventricularly (i.c.v.). Changes in colonic temperature (upper panel), skin temperature (Tsk) (middle panel), and rate of oxygen consumption (VO2) (bottom panel) in response to PGE2 (dose indicated) (A) and its vehicle (B) in Tacr1+/+ and Tacr1−/− mice. The experimental conditions were identical to those described in Figure 1 (respirometry setup, ambient temperature of 31°C). At the time of the injection, the values of colonic temperature of the Tacr1+/+ and Tacr1−/− mice were, respectively, 37.0 ± 0.2 and 37.1 ± 0.1°C for PGE2-treated mice and 36.8 ± 0.3 and 36.9 ± 0.2°C for vehicle-treated mice. These values did not differ statistically from each other. Changes in colonic temperature and Tsk in response to SP (dose indicated) (C) and its vehicle (D) in Tacr1+/+ and Tacr1−/− mice. These experiments were performed in the thermocouple setup at an ambient temperature of 33°C. At the time of the injection, the values of colonic temperature of the Tacr1+/+ and Tacr1−/− mice were, respectively, 37.2 ± 0.2 and 37.1 ± 0.2°C for SP-treated mice and 37.3 ± 0.3 and 37.3 ± 0.1°C for vehicle-treated mice. These values did not differ statistically from each other. Number of animals in the corresponding groups are indicated in the figure. *P < 0.05, intergenotype difference in the response to SP. #P < 0.05, treatment (PGE2 or SP) vs. vehicle difference within the same genotype as determined by the Fisher LSD test.
In a separate set of experiments, we confirmed the absence or presence of functional NK1 receptors in the Tacr1−/− and Tacr1+/+ mice, respectively. It has been repeatedly shown that SP evokes an increase in deep Tb by acting on the NK1 receptor (15, 16), therefore, we injected SP (100 µg/kg, i.c.v.) or its vehicle to Tacr1+/+ and Tacr1−/− mice and compared their Tb responses (Figures 2C,D). We found that the SP-induced increase in deep Tb was practically absent in Tacr1−/− mice, whereas it was significant in Tacr1+/+ mice at 20–60 min compared to vehicle treatment (Fisher LSD test, P < 0.05) (Figures 2C,D). The effects of both the genotype [ANOVA, F(1,260) = 10.538, P < 0.01] and the treatment × genotype interaction [F(1,260) = 13.233, P < 0.001] were significant. In the SP-treated mice, there was a significant difference between the Tb of Tacr1+/+ and Tacr1−/− mice at 10–40 min (Fisher LSD test, P < 0.05), which confirms the validity of this animal model.
One of the early steps in LPS-induced fever signaling is the activation of innate immune cells, including macrophages, leukocytes, and dendritic cells, which, in turn leads to augmented production of inflammatory cytokines, including TNF-α and IL-6 (3). Thus, in our next experiments we measured serum concentrations of TNF-α and IL-6 in the Tacr1+/+ and Tacr1−/− mice to assess whether the LPS-induced cytokine production is suppressed in the absence of the NK1 receptor. The serum concentrations of TNF-α and IL-6 did not differ between the genotypes after the infusion of saline (Figures 3A,B). The administration of LPS resulted in a substantial upsurge of TNF-α (Fisher LSD test, P < 0.001 vs. saline for both genotypes) (Figure 3A) and IL-6 (P < 0.01 for Tacr1+/+ mice and P < 0.001 for Tacr1−/− mice) (Figure 3B). Importantly, we did not detect any significant difference in the TNF-α and IL-6 concentrations between Tacr1+/+ and Tacr1−/− mice (Figures 3A,B).
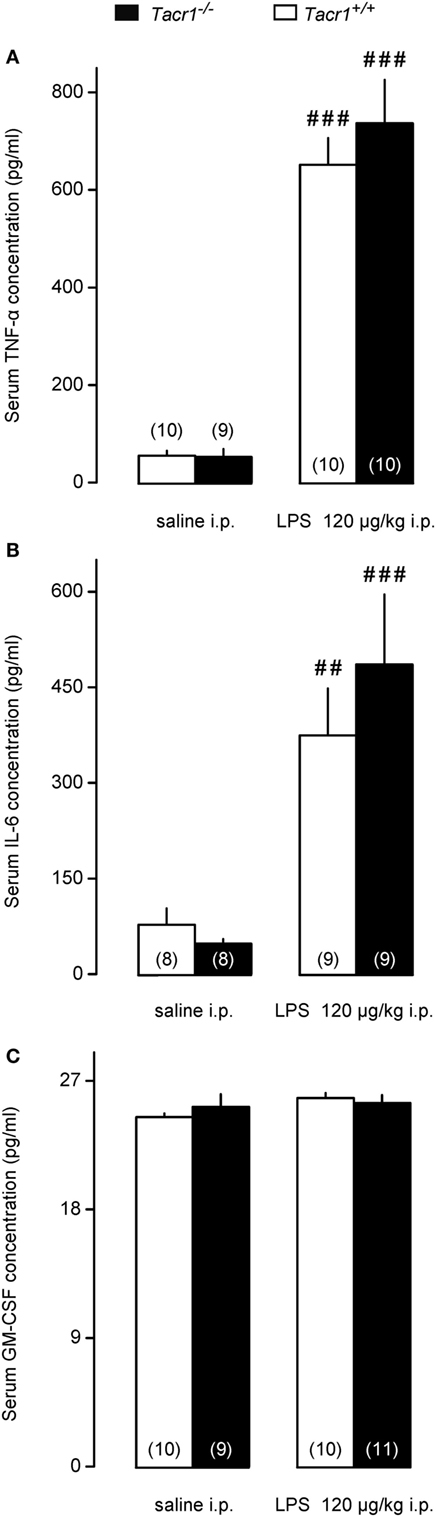
Figure 3. Serum cytokine concentrations in Tacr1+/+ and Tacr1−/− mice. (A) Serum tumor necrosis factor (TNF)-α concentrations in Tacr1+/+ and Tacr1−/− mice in response to lipopolysaccharide (LPS) (dose indicated) or saline. (B) Serum IL-6 concentrations in Tacr1+/+ and Tacr1−/− mice in response to LPS (dose indicated) or saline. (C) Serum granulocyte-macrophage colony-stimulating factor (GM-CSF) concentrations in Tacr1+/+ and Tacr1−/− mice in response to LPS (dose indicated) or saline. Blood samples were collected at 40 min postinfusion. Number of animals in the corresponding groups are indicated in the figure. Within each genotype, significant differences in the response to LPS (as compared to saline) are marked as ##P < 0.01 or ###P < 0.001 as determined by the Fisher LSD test.
It was shown that LPS can induce the secretion of GM-CSF in mice, which, in turn, can stimulate the production of inflammatory cytokines, such as TNF-α (38). We wanted to know whether changes in serum GM-CSF concentration can play a role in the attenuated fever response of the Tacr1−/− mice to LPS. In our experimental model, we did not find any difference in the serum concentrations of GM-CSF between LPS-treated and saline-treated mice of either genotype (Figure 3C). The absence of a surge in GM-CSF concentration in response to LPS could be due to the early time point (40 min post-LPS infusion) chosen for blood collection in our experiments.
These data indicate that impaired pyrogenic cytokine production does not contribute to the attenuated fever response of Tacr1−/− mice to LPS.
We moved downstream in the fever signaling pathway and compared the LPS-induced expression of COX-2 between Tacr1+/+ and Tacr1−/− mice. At the mRNA level, COX-2 expression is upregulated in rats already in the early phase of the febrile response (~30–40 min after LPS infusion) both in peripheral organs (lungs and liver) and to a lesser extent in the brain (31). In the present study, our experiments with LPS revealed that the fever response of Tacr1−/− mice was attenuated already at ~40 min post-LPS infusion (Figure 1A), and therefore, we collected lung, liver, and brain samples at this time point and studied the COX-2 mRNA expression in these tissues. As compared with the values of expression in saline-treated mice, the administration of LPS caused transcriptional upregulation of COX-2 mRNA in the lungs (Figure 4A), in the liver (Figure 4B), and in the brain (Figure 4C) of Tacr1+/+ and Tacr1−/− mice (Fisher LSD test, P < 0.001 vs. saline for all three tissues). There was no significant difference between the genotypes in any of the three tissue samples. The magnitude of the LPS-induced increase in the level of COX-2 expression was not the same in the three organs studied: ~5-fold in the lungs, 17–20-fold in the liver, and 2-fold in the brain (Figures 4A–C). These results are well in accordance with earlier findings on the dynamics of LPS-induced COX-2 mRNA expression (31), but cannot explain the attenuation of the febrile response in the Tacr1−/− mice.
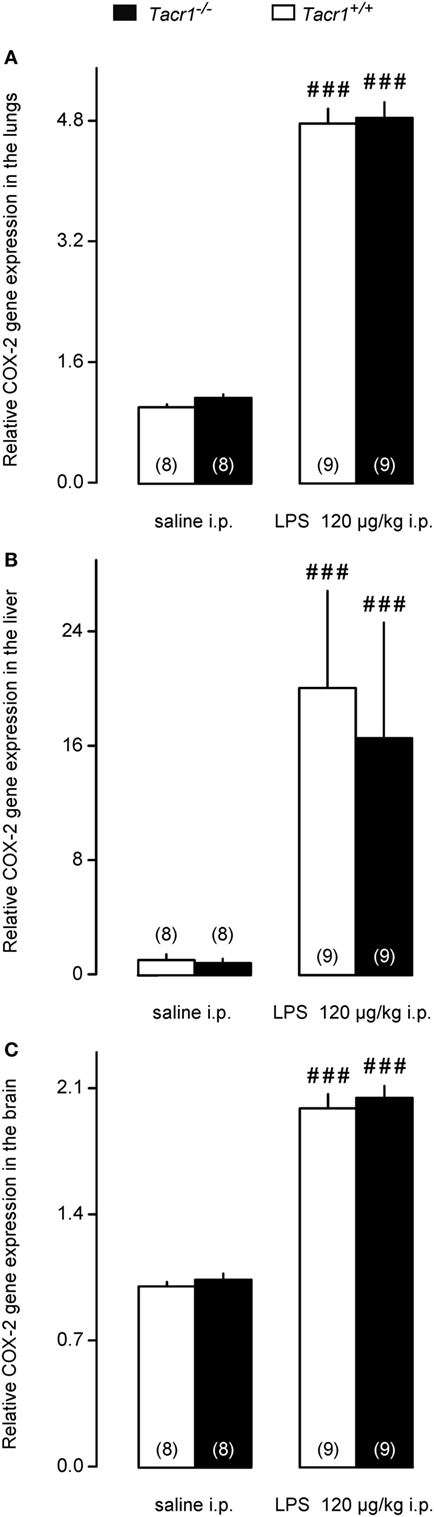
Figure 4. Relative cyclooxygenase-2 (COX-2) gene expression in the lungs (A), liver (B), and in the brain (C) of Tacr1+/+ and Tacr1−/− mice after infusion of lipopolysaccharide (LPS) (dose indicated) or saline. Tissue samples were collected at 40 min postinfusion. Number of animals in the corresponding groups are indicated in the figure. Within each genotype, significant differences in the response to LPS (as compared to saline) are marked as ###P < 0.001 as determined by the Fisher LSD test.
Besides the LPS-induced amplified expression of COX-2 mRNA, the expression of the COX-2 protein was also found to increase in the periphery (but not in the brain) already in the early phase of the febrile response (9). Therefore, we also compared the COX-2 protein expression between LPS-treated Tacr1+/+ and Tacr1−/− mice (Figure 5). In the lungs, the effects of both the treatment [ANOVA, F(1,26) = 6.165, P < 0.05] and genotype [F(1,26) = 8.532, P < 0.01] were significant (Figure 5A). In the liver, the effect of treatment was also significant [ANOVA, F(1,28) = 6.555, P < 0.05] (Figure 5B), whereas no significant change was found in the brain (Figure 5C). In Tacr1+/+ mice, the administration of LPS resulted in a marked increase in COX-2 protein expression in the lungs (Fisher LSD test, P < 0.01 vs. saline) and in the liver (Fisher LSD test, P < 0.05), but not in the brain (Fisher LSD test, P = 0.264). In contrast with the Tacr1+/+ mice, the COX-2 protein expression did not change significantly in either the lungs or the liver of LPS-treated Tacr1−/− mice as compared to saline treatment. In LPS-treated mice, the COX-2 protein expression was attenuated in the lungs of Tacr1−/− mice compared with their Tacr1+/+ littermates (Fisher LSD test, P < 0.01), while in the liver there was a tendency for reduced COX-2 expression in the LPS-treated Tacr1−/− mice (Fisher LSD test, P = 0.101). These findings indicate that the absence of the NK1 receptor interferes with the augmentation of COX-2 expression at the protein level.
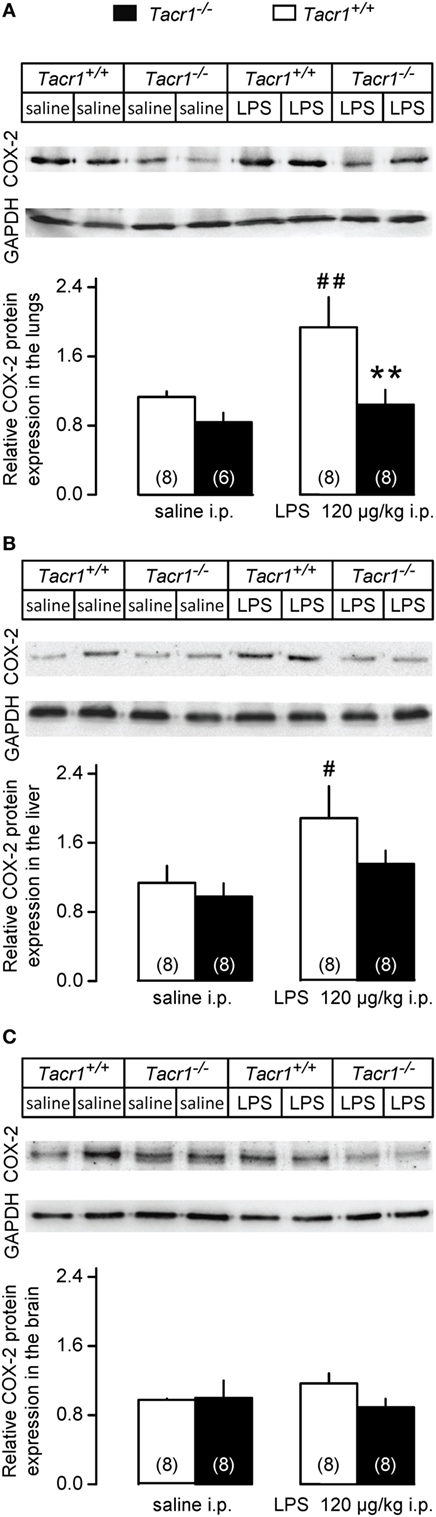
Figure 5. Relative cyclooxygenase-2 (COX-2) protein expression in the lungs (A), liver (B), and in the brain (C) of Tacr1+/+ and Tacr1−/− mice after infusion of lipopolysaccharide (LPS) (dose indicated) or saline. Tissue samples were collected at 40 min postinfusion. Number of animals in the corresponding groups are indicated in the figure. **P < 0.01, intergenotype difference in the response to LPS; #P < 0.05 or ##P < 0.01, LPS vs. saline difference within the same genotype as determined by the Fisher LSD test.
To assess whether the attenuated expression of COX-2 protein results in reduced production of PGE2 in the LPS-treated Tacr1−/− mice, we measured PGE2 concentrations in the lungs, liver, and brain of the mice. We found that the LPS treatment resulted in the biggest (~80%) increase in PGE2 concentration in the lungs (Figure 6A), followed by the liver (~40%) (Figure 6B), and then by the brain (~10%) (Figure 6C). The effect of treatment was significant in the lungs [ANOVA, F(1,15) = 7.065, P < 0.05], but not in the other two organs. Post hoc analysis revealed that the LPS-induced increase in PGE2 concentration was significant in the lungs of Tacr1+/+ mice compared with saline (Fisher LSD test, P < 0.05), whereas in the lungs of Tacr1−/− mice the PGE2 level did not increase significantly in response to LPS (Fisher LSD test, P = 0.275 vs. saline). These results suggest that in the lungs of Tacr1−/− mice the LPS-induced surge in PGE2 concentration is reduced.
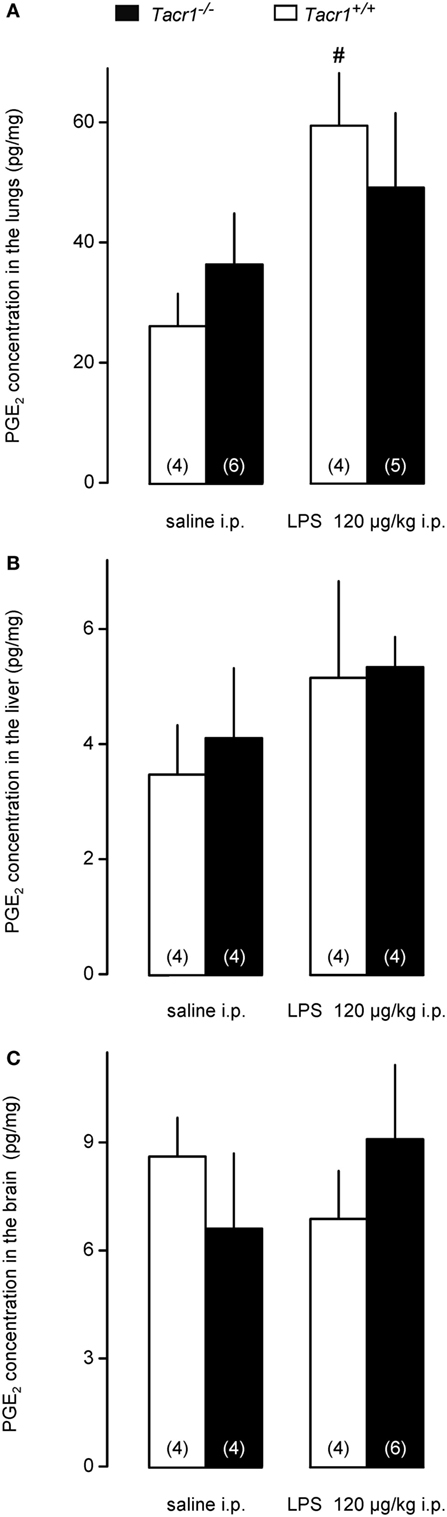
Figure 6. Prostaglandin (PG) E2 concentration in the lungs (A), liver (B), and in the brain (C) of Tacr1+/+ and Tacr1−/− mice after infusion of lipopolysaccharide (LPS) (dose indicated) or saline. Tissue samples were collected at 40 min postinfusion. Number of animals in the corresponding groups are indicated in the figure. #P < 0.05, LPS vs. saline difference within the same genotype as determined by the Fisher LSD test.
In our study, we showed that the absence of the NK1 receptor results in the attenuation of LPS-induced fever for the first time by using Tacr1−/− mice. Our experimental model allowed us to detect the suppression of the febrile response already in the early phase of fever (starting from ~40 min post-LPS infusion), which is also a novel finding. When we looked at the molecular mechanism, we did not find a difference in the PGE2-induced febrile response between Tacr1+/+ and Tacr1−/− mice. The LPS-induced serum cytokine production and COX-2 mRNA expression in the lungs, liver, and brain of the mice were also statistically indistinguishable between the genotypes. In contrast with mRNA, when we measured COX-2 expression at the protein level, we found that the LPS-induced surge was significantly attenuated in the lungs and tended to be suppressed in the liver of Tacr1−/− mice as compared with their Tacr1+/+ littermates.
The involvement of SP signaling and the NK1 receptor in experimental fever was reported in earlier studies (13–16, 39). Antagonists of SP reduced the febrile response to LPS in rats and guinea pigs from the beginning of the response, which was detectable 45–90 min after LPS infusion (13, 14). However, when the authors looked at the mechanisms connecting the NK1 receptor with the fever signaling pathway, they focused on the later phases of fever (i.e., 2 h or more post-LPS infusion), presumably, because the early phase was absent in their experiments due to stress–hyperthermia as a consequence of stressful (needle-pinch) drug injection (16). In the present study, we conducted the experiments under such conditions (extensive habituation, moderate LPS dose, non-stressful substance administration, and near neutral ambient temperature) that allowed us to study LPS-induced fever from 40 to 360 min postinfusion in mice, thus we could detect the attenuation of the response already at 40 min in the absence of Tacr1 gene. A caveat in knockout mouse models is that compensatory mechanisms may develop. With regard to alteration of other NK receptors in mice genetically lacking the NK1 receptor, it was shown with RT-PCR and immunostaining that the expression of NK3 receptors was unchanged in the retina of Tacr1−/− mice as compared with Tacr1+/+ mice (40). However, in a mouse model of meningoencephalitis, the effects of combined treatment with NK2 and NK3 receptor antagonists were reduced on the neuroinflammatory scores in Tacr1−/− mice compared with similarly treated Tacr1+/+ mice (41). It was concluded that in the genetic absence of NK1 receptors, tachykinins may utilize NK2 and NK3 receptors (41), although expression of the NK receptors was not measured. Taken together, in Tacr1−/− mice the expression of other NK receptors is presumably unchanged, but there might be an alteration in the utilization of NK2 and NK3 receptor-mediated mechanisms, which warrants for further characterization of the tachykinin pathways in this mouse model.
The later phases of fever are mediated mostly by increased PGE2 production in the brain, and it is well established that brain-derived PGE2 is an important mediator for the maintenance of LPS-induced fever (32, 42–44). However, the early phase of fever is triggered from peripheral organs such as the lungs and the liver (9, 31). Therefore, our results suggest that the genetic blockade of the NK1 receptor interferes with fever signaling at a peripheral site of action in the early phase of LPS-induced fever. We further supported the peripheral action site of NK1 receptor in fever by showing that the Tacr1−/− mice were equally able to increase their thermogenesis and deep Tb in response to i.c.v. administration of PGE2. We focused the second part of our study on exploring which step of fever signaling is altered in the Tacr1−/− mice. In the periphery, SP signaling has been shown to play a role in the induction of pyrogenic cytokine production by macrophages (45) and in pulmonary macrophage activation (46). In acute lung injury after burns, SP was found to upregulate COX-2 activity (47). The expression of the NK1 receptor by macrophages is well documented (48–53), but it was also found in various other immune cells (1). With regard to leukocytes, neutrophil accumulation was significantly inhibited in Tacr1−/− mice in lung injury induced by immune complexes (54) or acute pancreatitis (55). Attenuated leukocyte recruitment and lung injury were also observed with the NK1 receptor antagonist SR140333 in a murine model of polymicrobial sepsis induced by cecal ligation and puncture (56). In the same model, the authors later showed that the SP-induced pro-inflammatory response was mediated mainly by protein kinase C (PKC)-α (57). Whether the NK1 receptor-mediated leukocyte recruitment occurs via a direct action on granulocytes or indirectly through other cell types (e.g., endothelial cells and bronchial epithelial cells) remains a question of debate [for a review, see Ref. (58)]. On the one hand, the expression of functional NK1 receptors was demonstrated on granulocytes in mice (59) and humans (60). In the latter study, it was also shown that the SP-induced COX-2 expression was mediated by NK1 receptors (60). On the other hand, different authors failed to detect the presence of NK1 receptors in human granulocytes (52, 61), which indicates that the NK1 receptor-mediated granulocyte migration develops via a primary effect of SP on other cell types. In line with such scenario, expression of the NK1 receptor was shown in several types of stromal cells in the lung, including bronchial glands, bronchial vessels, and bronchial smooth muscle (62), as well as airway epithelial cells (63, 64) and postcapillary venular endothelial cells (65). With the help of nested PCR, the expression of the NK1 receptor was demonstrated also in the liver, predominantly in non-parenchymal cells, most likely macrophages, lymphocytes, and granulocytes, but also in hepatocytes (53), which contradicted earlier studies reporting no detectable expression of the NK1 receptor in the liver by using classical techniques (66–68). In lung epithelial cell cultures, SP via NK1 receptors stimulated neutrophil adherence (69) and pro-inflammatory cytokine production (70). Moreover, LPS enhanced the SP-induced neutrophil adherence and associated cytokine release via an involvement of NK1 receptors (71). Taken together, it is possible that LPS-induced leukocyte trafficking is reduced in Tacr1−/− mice, which may be caused either by a direct effect of the NK1 receptor’s absence on leukocytes or indirectly through other cell types such as lung epithelial cells. The reduced trafficking and therefore a reduced cellular infiltrate within the lung and the liver might contribute to reduced expression of COX-2.
As discussed earlier, many peripheral events of the fever response can be influenced by SP signaling. In the present study, we did not find difference in the serum levels of inflammatory cytokines (TNF-α and IL-6) between the LPS-treated Tacr1+/+ and Tacr1−/− mice, which indicates that the activation of macrophages and their cytokine production is not impaired in the absence of the NK1 receptor. We did not measure the levels of the third major pro-inflammatory cytokine, IL-1β, because it has been shown that it exerts its pyrogenic actions independently from the NK1 receptor (16). LPS can also modulate COX-2 transcriptionally and posttranscriptionally in macrophages independently from inflammatory cytokines (72). When we determined the COX-2 mRNA expression, we found that at this early time point (~40 min) it was greatly amplified in the lungs and liver, and to lesser extent in the brain of the mice, which results are in harmony with the previous findings (31). The lack of difference between the genotypes indicates that transcriptional upregulation of COX-2 is not influenced by the NK1 receptor. The correlation of mRNA and protein levels in biological samples is often poor (73), moreover, the expression of COX-2 is regulated not only at the level of transcription but also at the levels of post-transcription and translation (72, 74, 75). Therefore, we also determined the expression of the COX-2 protein in the lungs, liver, and brain of the mice. In accordance with previous reports showing augmented expression of the COX-2 protein in the periphery (9), we also detected LPS-induced amplification of the COX-2 protein expression in the lungs and liver of Tacr1+/+ mice as compared with saline treatment, whereas we did not find significant increase in their brain. Importantly, however, the LPS-induced amplification of the expression of the COX-2 protein was attenuated in the lungs and tended to be suppressed in the liver of Tacr1−/− mice as compared with their Tacr1+/+ littermates. In accordance with the different COX-2 protein expression between the genotypes, the administration of LPS caused a significant surge of PGE2 concentration in the lungs of Tacr1+/+ mice, which was absent in the Tacr1−/− mice. It can be expected that the observed difference in pulmonary PGE2 synthesis also results in different plasma concentrations of PGE2 between the genotypes. The sensitive site where PGEs produce fever is located within the region of the brain that includes the organum vasculosum laminae terminalis and the surrounding preoptic area of the hypothalamus (76). Peripherally borne PGE2 can broadly penetrate in the perivascular space in the periventricular organs (such as the organum vasculosum laminae terminalis) and activate neurons or non-neural cells, thus trigger the febrile response (77). It has to be noted that fever signaling was not examined at later time points in the current experiments due to the study design, and therefore it cannot be excluded that COX-2 expression and PGE2 production in the brain are also affected by the blockade of the NK1 receptor, especially during the maintenance phase of fever. The experimental confirmation of the LPS-induced temporospatial distribution of PGE2 in the plasma, cerebrospinal fluid, and specific brain regions in the absence of the NK1 receptor remains subjects for future studies.
Our results demonstrate for the first time that at the onset of the fever response the NK1 receptor contributes to the augmentation of COX-2 protein expression in peripheral organs. In accordance with our findings, the modulation of COX-2 protein expression by SP signaling has been shown in several human cell lines, including polymorphonuclear leukocytes (60), colonic epithelial cells (78), and endothelial cells (79). Furthermore, an autocrine circuitry between SP and PGE2 production was recently suggested in the fever response to endogenous pyrogens (39). The exact mechanism, how SP signaling interacts with COX-2 expression remains to be elucidated in future studies. It is possible that the absence of the NK1 receptor leads to alterations in the expression of enzymes upstream (e.g., PLA2) or downstream of COX-2 (e.g., PGE synthases). An alteration in the phosphorylation (i.e., activation) of the cytosolic (c) form of PLA2 could be of particular interest, as in the fundamental study by Steiner et al. (9) LPS increased the contents of phosphorylated cPLA2 and COX-2 in the lung, but did not alter the protein level of constitutively expressed microsomal PGE2 synthase-1. In Chinese hamster ovary cells stably expressing NK1 receptors, SP induced the release of arachidonic acid, presumably by the activation of cPLA2, which was blocked by an antagonist of the NK1 receptor (80). Furthermore, in a mouse model of nerve injury, the enhanced activation of cPLA2 was abolished by NK1 receptor antagonist in neurons and possibly microglia in the spinal cord (81). These data indicate a link between activation of cPLA2 and NK1 receptor-mediated SP signaling at least in some cell types. Further studies are needed to assess whether the LPS-induced phosphorylation of cPLA2 is altered in the lungs of Tacr1−/− mice in addition to the decreased COX-2 protein expression as shown in this study. A potential link in signal transduction between SP and COX-2 may coexist through PKC, as it was shown earlier that inhibitory effects of SP are mediated, at least in part by PKC isoenzymes (82), which play a key role in the biosynthesis of PGE2, likely by regulating the induction of COX-2 (83).
The findings of the present study further advance our understanding about the interactions between SP signaling and the “cytokine-COX-2-PGE2” axis in experimental fever. As a perspective, our results can help to identify NK1 receptor as a drug target to suppress peripheral COX-2 activity.
All procedures were conducted under protocols approved by Institutional Animal Use and Care Committee of the University of Pecs and were in accordance with the directives of the National Ethical Council for Animal Research and those of the European Communities Council (86/609/EEC).
Eszter P, PH, Erika P, and AG designed the study; Eszter P, VT, CZ, ZR, EO, PK, NK, RM, LD, KO, NS, KP, AK, and AG performed experiments; PH and Erika P provided compounds, mice, and analytic tools; Eszter P, VT, EO, RM, LD, KP, AK, and AG processed and analyzed data; and Eszter P, VT, LD, KP, AK, and AG wrote the paper. All the authors reviewed and finally approved the manuscript.
The authors declare that the research was conducted in the absence of any commercial or financial relationships that could be construed as a potential conflict of interest.
The reviewer DC and handling editor declared their shared affiliation.
The authors thank Drs. John Quinn and Andreas Zimmer for donating the Tacr1−/− mice. The authors are grateful to Aniko Varnagyne Rozsafi for the excellent technical assistance.
This research has been supported by the National Research, Development and Innovation Office (grant FK 124483 to AG), the Medical School, University of Pecs (grant KA-2016-15 to AG), and the New National Excellence Program of the Hungarian Ministry of Human Capacities (grants UNKP-16-4-III and UNKP-17-4-III-PTE-33 to AG, UNKP-17-3-III-PTE-166 to KP, and UNKP-17-4-I-PTE-209 to LD).
The Supplementary Material for this article can be found online at http://www.frontiersin.org/articles/10.3389/fimmu.2018.00166/full#supplementary-material.
COX, cyclooxygenase; GAPDH, glyceraldehyde 3-phosphate dehydrogenase; GM-CSF, granulocyte-macrophage colony-stimulating factor; i.c.v., intracerebroventricular(ly); i.p., intraperitoneal(ly); IL, interleukin; LPS, lipopolysaccharide; NK, neurokinin; PG, prostaglandin; PKC, protein kinase C; PLA2, phospholipase A2 (e.g., cytosolic, cPLA2); SP, substance P; Tb, body temperature; Tsk, skin temperature; PE, polyethylene; TNF, tumor necrosis factor; VO2, rate of oxygen consumption.
1. Steinhoff MS, von Mentzer B, Geppetti P, Pothoulakis C, Bunnett NW. Tachykinins and their receptors: contributions to physiological control and the mechanisms of disease. Physiol Rev (2014) 94:265–301. doi:10.1152/physrev.00031.2013
2. Ivanov AI, Romanovsky AA. Prostaglandin E2 as a mediator of fever: synthesis and catabolism. Front Biosci (2004) 9:1977–93. doi:10.2741/1383
3. Roth J, Blatteis CM. Mechanisms of fever production and lysis: lessons from experimental LPS fever. Compr Physiol (2014) 4:1563–604. doi:10.1002/cphy.c130033
4. Dennis EA, Cao J, Hsu YH, Magrioti V, Kokotos G. Phospholipase A2 enzymes: physical structure, biological function, disease implication, chemical inhibition, and therapeutic intervention. Chem Rev (2011) 111:6130–85. doi:10.1021/cr200085w
5. Nomura DK, Morrison BE, Blankman JL, Long JZ, Kinsey SG, Marcondes MC, et al. Endocannabinoid hydrolysis generates brain prostaglandins that promote neuroinflammation. Science (2011) 334:809–13. doi:10.1126/science.1209200
6. Steiner AA, Hunter JC, Phipps SM, Nucci TB, Oliveira DL, Roberts JL, et al. Cyclooxygenase-1 or -2 – which one mediates lipopolysaccharide-induced hypothermia? Am J Physiol Regul Integr Comp Physiol (2009) 297:R485–94. doi:10.1152/ajpregu.91026.2008
7. Steiner AA, Rudaya AY, Robbins JR, Dragic AS, Langenbach R, Romanovsky AA. Expanding the febrigenic role of cyclooxygenase-2 to the previously overlooked responses. Am J Physiol Regul Integr Comp Physiol (2005) 289:R1253–7. doi:10.1152/ajpregu.00371.2005
8. Ueno N, Takegoshi Y, Kamei D, Kudo I, Murakami M. Coupling between cyclooxygenases and terminal prostanoid synthases. Biochem Biophys Res Commun (2005) 338:70–6. doi:10.1016/j.bbrc.2005.08.152
9. Steiner AA, Ivanov AI, Serrats J, Hosokawa H, Phayre AN, Robbins JR, et al. Cellular and molecular bases of the initiation of fever. PLoS Biol (2006) 4:e284. doi:10.1371/journal.pbio.0040284
10. Lazarus M, Yoshida K, Coppari R, Bass CE, Mochizuki T, Lowell BB, et al. EP3 prostaglandin receptors in the median preoptic nucleus are critical for fever responses. Nat Neurosci (2007) 10:1131–3. doi:10.1038/nn1949
11. Oka T, Oka K, Kobayashi T, Sugimoto Y, Ichikawa A, Ushikubi F, et al. Characteristics of thermoregulatory and febrile responses in mice deficient in prostaglandin EP1 and EP3 receptors. J Physiol (2003) 551:945–54. doi:10.1113/jphysiol.2003.048140
12. Zampronio AR, Soares DM, Souza GE. Central mediators involved in the febrile response: effects of antipyretic drugs. Temperature (Austin) (2015) 2:506–21. doi:10.1080/23328940.2015.1102802
13. Blatteis CM, Xin L, Quan N. Neuromodulation of fever. A possible role for substance P. Ann N Y Acad Sci (1994) 741:162–73. doi:10.1111/j.1749-6632.1994.tb23097.x
14. Szelenyi Z, Szekely M, Balasko M. Role of substance P (SP) in the mediation of endotoxin (LPS) fever in rats. Ann N Y Acad Sci (1997) 813:316–23. doi:10.1111/j.1749-6632.1997.tb51713.x
15. Balasko M, Szekely M, Szelenyi Z. The effect of CP-96,345, a non-peptide substance-P antagonist, on thermoregulation and the development of endotoxin-fever in rats. J Therm Biol (2000) 25:1–4. doi:10.1016/S0306-4565(99)00035-2
16. Reis RC, Brito HO, Fraga D, Cabrini DA, Zampronio AR. Central substance P NK(1) receptors are involved in fever induced by LPS but not by IL-1beta and CCL3/MIP-1alpha in rats. Brain Res (2011) 1384:161–9. doi:10.1016/j.brainres.2011.02.001
17. Rupniak NM, Carlson EJ, Webb JK, Harrison T, Porsolt RD, Roux S, et al. Comparison of the phenotype of NK1R-/- mice with pharmacological blockade of the substance P (NK1) receptor in assays for antidepressant and anxiolytic drugs. Behav Pharmacol (2001) 12:497–508. doi:10.1097/00008877-200111000-00011
18. Kemeny LV, Hegyi P, Rakonczay Z Jr, Borka K, Korompay A, Gray MA, et al. Substance P inhibits pancreatic ductal bicarbonate secretion via neurokinin receptors 2 and 3 in the guinea pig exocrine pancreas. Pancreas (2011) 40:793–5. doi:10.1097/MPA.0b013e3182161d05
19. Guard S, Boyle SJ, Tang KW, Watling KJ, McKnight AT, Woodruff GN. The interaction of the NK1 receptor antagonist CP-96,345 with L-type calcium channels and its functional consequences. Br J Pharmacol (1993) 110:385–91. doi:10.1111/j.1476-5381.1993.tb13821.x
20. Rupniak NM, Carlson EJ, Shepheard S, Bentley G, Williams AR, Hill A, et al. Comparison of the functional blockade of rat substance P (NK1) receptors by GR205171, RP67580, SR140333 and NKP-608. Neuropharmacology (2003) 45:231–41. doi:10.1016/S0028-3908(03)00157-6
21. De Felipe C, Herrero JF, O’Brien JA, Palmer JA, Doyle CA, Smith AJ, et al. Altered nociception, analgesia and aggression in mice lacking the receptor for substance P. Nature (1998) 392:394–7. doi:10.1038/32904
22. Borbely E, Sandor K, Markovics A, Kemeny A, Pinter E, Szolcsanyi J, et al. Role of capsaicin-sensitive nerves and tachykinins in mast cell tryptase-induced inflammation of murine knees. Inflamm Res (2016) 65:725–36. doi:10.1007/s00011-016-0954-x
23. Almeida MC, Hew-Butler T, Soriano RN, Rao S, Wang W, Wang J, et al. Pharmacological blockade of the cold receptor TRPM8 attenuates autonomic and behavioral cold defenses and decreases deep body temperature. J Neurosci (2012) 32:2086–99. doi:10.1523/JNEUROSCI.5606-11.2012
24. Garami A, Pakai E, McDonald HA, Reilly RM, Gomtsyan A, Corrigan JJ, et al. TRPV1 antagonists that cause hypothermia, instead of hyperthermia, in rodents: compounds’ pharmacological profiles, in-vivo targets, thermoeffectors recruited, and implications for drug development. Acta Physiol (Oxf) (2018) (in press). doi:10.1111/apha.13038
25. Banki E, Pakai E, Gaszner B, Zsiboras C, Czett A, Bhuddi PR, et al. Characterization of the thermoregulatory response to pituitary adenylate cyclase-activating polypeptide in rodents. J Mol Neurosci (2014) 54:543–54. doi:10.1007/s12031-014-0361-0
26. Garami A, Pakai E, Oliveira DL, Steiner AA, Wanner SP, Almeida MC, et al. Thermoregulatory phenotype of the Trpv1 knockout mouse: thermoeffector dysbalance with hyperkinesis. J Neurosci (2011) 31:1721–33. doi:10.1523/JNEUROSCI.4671-10.2011
27. de Oliveira C, Garami A, Lehto SG, Pakai E, Tekus V, Pohoczky K, et al. Transient receptor potential channel ankyrin-1 is not a cold sensor for autonomic thermoregulation in rodents. J Neurosci (2014) 34:4445–52. doi:10.1523/JNEUROSCI.5387-13.2014
28. Horvath A, Menghis A, Botz B, Borbely E, Kemeny A, Tekus V, et al. Analgesic and anti-inflammatory effects of the novel semicarbazide-sensitive amine-oxidase inhibitor SzV-1287 in chronic arthritis models of the mouse. Sci Rep (2017) 7:39863. doi:10.1038/srep39863
29. Pohoczky K, Kun J, Szalontai B, Szoke E, Saghy E, Payrits M, et al. Estrogen-dependent up-regulation of TRPA1 and TRPV1 receptor proteins in the rat endometrium. J Mol Endocrinol (2016) 56:135–49. doi:10.1530/JME-15-0184
30. Engstrom Ruud L, Wilhelms DB, Eskilsson A, Vasilache AM, Elander L, Engblom D, et al. Acetaminophen reduces lipopolysaccharide-induced fever by inhibiting cyclooxygenase-2. Neuropharmacology (2013) 71:124–9. doi:10.1016/j.neuropharm.2013.03.012
31. Ivanov AI, Pero RS, Scheck AC, Romanovsky AA. Prostaglandin E2-synthesizing enzymes in fever: differential transcriptional regulation. Am J Physiol Regul Integr Comp Physiol (2002) 283:R1104–17. doi:10.1152/ajpregu.00347.2002
32. Eskilsson A, Mirrasekhian E, Dufour S, Schwaninger M, Engblom D, Blomqvist A. Immune-induced fever is mediated by IL-6 receptors on brain endothelial cells coupled to STAT3-dependent induction of brain endothelial prostaglandin synthesis. J Neurosci (2014) 34:15957–61. doi:10.1523/JNEUROSCI.3520-14.2014
33. Pfaffl MW. A new mathematical model for relative quantification in real-time RT-PCR. Nucleic Acids Res (2001) 29:e45. doi:10.1093/nar/29.9.e45
34. Riba A, Deres L, Eros K, Szabo A, Magyar K, Sumegi B, et al. Doxycycline protects against ROS-induced mitochondrial fragmentation and ISO-induced heart failure. PLoS One (2017) 12:e0175195. doi:10.1371/journal.pone.0175195
35. Kessen UA, Schaloske RH, Stephens DL, Killermann Lucas K, Dennis EA. PGE2 release is independent of upregulation of Group V phospholipase A2 during long-term stimulation of P388D1 cells with LPS. J Lipid Res (2005) 46:2488–96. doi:10.1194/jlr.M500325-JLR200
36. Steenport M, Khan KM, Du B, Barnhard SE, Dannenberg AJ, Falcone DJ. Matrix metalloproteinase (MMP)-1 and MMP-3 induce macrophage MMP-9: evidence for the role of TNF-alpha and cyclooxygenase-2. J Immunol (2009) 183:8119–27. doi:10.4049/jimmunol.0901925
37. Rudaya AY, Steiner AA, Robbins JR, Dragic AS, Romanovsky AA. Thermoregulatory responses to lipopolysaccharide in the mouse: dependence on the dose and ambient temperature. Am J Physiol Regul Integr Comp Physiol (2005) 289:R1244–52. doi:10.1152/ajpregu.00370.2005
38. Tiegs G, Barsig J, Matiba B, Uhlig S, Wendel A. Potentiation by granulocyte macrophage colony-stimulating factor of lipopolysaccharide toxicity in mice. J Clin Invest (1994) 93:2616–22. doi:10.1172/JCI117274
39. Brito HO, Barbosa FL, Reis RC, Fraga D, Borges BS, Franco CR, et al. Evidence of substance P autocrine circuitry that involves TNF-alpha, IL-6, and PGE2 in endogenous pyrogen-induced fever. J Neuroimmunol (2016) 293:1–7. doi:10.1016/j.jneuroim.2016.01.016
40. Catalani E, Dal Monte M, Gangitano C, Lucattelli M, Fineschi S, Bosco L, et al. Expression of substance P, neurokinin 1 receptors (NK1) and neurokinin 3 receptors in the developing mouse retina and in the retina of NK1 knockout mice. Neuroscience (2006) 138:487–99. doi:10.1016/j.neuroscience.2005.11.020
41. Kennedy PG, Rodgers J, Bradley B, Hunt SP, Gettinby G, Leeman SE, et al. Clinical and neuroinflammatory responses to meningoencephalitis in substance P receptor knockout mice. Brain (2003) 126:1683–90. doi:10.1093/brain/awg160
42. Engstrom L, Ruud J, Eskilsson A, Larsson A, Mackerlova L, Kugelberg U, et al. Lipopolysaccharide-induced fever depends on prostaglandin E2 production specifically in brain endothelial cells. Endocrinology (2012) 153:4849–61. doi:10.1210/en.2012-1375
43. Rummel C, Matsumura K, Luheshi GN. Circulating IL-6 contributes to peripheral LPS-induced mPGES-1 expression in the rat brain. Brain Res Bull (2011) 86:319–25. doi:10.1016/j.brainresbull.2011.09.006
44. Rummel C, Sachot C, Poole S, Luheshi GN. Circulating interleukin-6 induces fever through a STAT3-linked activation of COX-2 in the brain. Am J Physiol Regul Integr Comp Physiol (2006) 291:R1316–26. doi:10.1152/ajpregu.00301.2006
45. Lotz M, Vaughan JH, Carson DA. Effect of neuropeptides on production of inflammatory cytokines by human monocytes. Science (1988) 241:1218–21. doi:10.1126/science.2457950
46. Boichot E, Germain N, Emonds-Alt X, Advenier C, Lagente V. Effects of SR 140333 and SR 48968 on antigen and substance P-induced activation of guinea-pig alveolar macrophages. Clin Exp Allergy (1998) 28:1299–305. doi:10.1046/j.1365-2222.1998.00398.x
47. Sio SW, Ang SF, Lu J, Moochhala S, Bhatia M. Substance P upregulates cyclooxygenase-2 and prostaglandin E metabolite by activating ERK1/2 and NF-kappaB in a mouse model of burn-induced remote acute lung injury. J Immunol (2010) 185:6265–76. doi:10.4049/jimmunol.1001739
48. Ho WZ, Lai JP, Zhu XH, Uvaydova M, Douglas SD. Human monocytes and macrophages express substance P and neurokinin-1 receptor. J Immunol (1997) 159:5654–60.
49. Lai JP, Douglas SD, Ho WZ. Human lymphocytes express substance P and its receptor. J Neuroimmunol (1998) 86:80–6. doi:10.1016/S0165-5728(98)00025-3
50. Bost KL, Breeding SA, Pascual DW. Modulation of the mRNAs encoding substance P and its receptor in rat macrophages by LPS. Reg Immunol (1992) 4:105–12.
51. Marriott I, Bost KL. IL-4 and IFN-gamma up-regulate substance P receptor expression in murine peritoneal macrophages. J Immunol (2000) 165:182–91. doi:10.4049/jimmunol.165.1.182
52. Klassert TE, Pinto F, Hernandez M, Candenas ML, Hernandez MC, Abreu J, et al. Differential expression of neurokinin B and hemokinin-1 in human immune cells. J Neuroimmunol (2008) 196:27–34. doi:10.1016/j.jneuroim.2008.02.010
53. Bang R, Sass G, Kiemer AK, Vollmar AM, Neuhuber WL, Tiegs G. Neurokinin-1 receptor antagonists CP-96,345 and L-733,060 protect mice from cytokine-mediated liver injury. J Pharmacol Exp Ther (2003) 305:31–9. doi:10.1124/jpet.102.043539
54. Bozic CR, Lu B, Hopken UE, Gerard C, Gerard NP. Neurogenic amplification of immune complex inflammation. Science (1996) 273:1722–5. doi:10.1126/science.273.5282.1722
55. Bhatia M, Saluja AK, Hofbauer B, Frossard JL, Lee HS, Castagliuolo I, et al. Role of substance P and the neurokinin 1 receptor in acute pancreatitis and pancreatitis-associated lung injury. Proc Natl Acad Sci U S A (1998) 95:4760–5. doi:10.1073/pnas.95.8.4760
56. Hegde A, Zhang H, Moochhala SM, Bhatia M. Neurokinin-1 receptor antagonist treatment protects mice against lung injury in polymicrobial sepsis. J Leukoc Biol (2007) 82:678–85. doi:10.1189/jlb.0407217
57. Hegde A, Koh YH, Moochhala SM, Bhatia M. Neurokinin-1 receptor antagonist treatment in polymicrobial sepsis: molecular insights. Int J Inflam (2010) 2010:601098. doi:10.4061/2010/601098
58. Maggi CA. The effects of tachykinins on inflammatory and immune cells. Regul Pept (1997) 70:75–90. doi:10.1016/S0167-0115(97)00029-3
59. Kaltreider HB, Ichikawa S, Byrd PK, Ingram DA, Kishiyama JL, Sreedharan SP, et al. Upregulation of neuropeptides and neuropeptide receptors in a murine model of immune inflammation in lung parenchyma. Am J Respir Cell Mol Biol (1997) 16:133–44. doi:10.1165/ajrcmb.16.2.9032120
60. Gallicchio M, Benetti E, Rosa AC, Fantozzi R. Tachykinin receptor modulation of cyclooxygenase-2 expression in human polymorphonuclear leucocytes. Br J Pharmacol (2009) 156:486–96. doi:10.1111/j.1476-5381.2008.00033.x
61. Marazziti D, Giannaccini G, Baroni S, Betti L, Giusti L, Lucacchini A, et al. Absence of NK1 receptors in human blood lymphocytes and granulocytes. Neuropsychobiology (2004) 50:221–5. doi:10.1159/000079974
62. Mapp CE, Miotto D, Braccioni F, Saetta M, Turato G, Maestrelli P, et al. The distribution of neurokinin-1 and neurokinin-2 receptors in human central airways. Am J Respir Crit Care Med (2000) 161:207–15. doi:10.1164/ajrccm.161.1.9903137
63. Adcock IM, Peters M, Gelder C, Shirasaki H, Brown CR, Barnes PJ. Increased tachykinin receptor gene expression in asthmatic lung and its modulation by steroids. J Mol Endocrinol (1993) 11:1–7. doi:10.1677/jme.0.0110001
64. Chu HW, Kraft M, Krause JE, Rex MD, Martin RJ. Substance P and its receptor neurokinin 1 expression in asthmatic airways. J Allergy Clin Immunol (2000) 106:713–22. doi:10.1067/mai.2000.109829
65. Bowden JJ, Garland AM, Baluk P, Lefevre P, Grady EF, Vigna SR, et al. Direct observation of substance P-induced internalization of neurokinin 1 (NK1) receptors at sites of inflammation. Proc Natl Acad Sci U S A (1994) 91:8964–8. doi:10.1073/pnas.91.19.8964
66. Cook GA, Elliott D, Metwali A, Blum AM, Sandor M, Lynch R, et al. Molecular evidence that granuloma T lymphocytes in murine Schistosomiasis mansoni express an authentic substance P (NK-1) receptor. J Immunol (1994) 152:1830–5.
67. Hershey AD, Krause JE. Molecular characterization of a functional cDNA encoding the rat substance P receptor. Science (1990) 247:958–62. doi:10.1126/science.2154852
68. Tsuchida K, Shigemoto R, Yokota Y, Nakanishi S. Tissue distribution and quantitation of the mRNAs for three rat tachykinin receptors. Eur J Biochem (1990) 193:751–7. doi:10.1111/j.1432-1033.1990.tb19396.x
69. DeRose V, Robbins RA, Snider RM, Spurzem JR, Thiele GM, Rennard SI, et al. Substance P increases neutrophil adhesion to bronchial epithelial cells. J Immunol (1994) 152:1339–46.
70. Williams R, Zou X, Hoyle GW. Tachykinin-1 receptor stimulates proinflammatory gene expression in lung epithelial cells through activation of NF-kappaB via a G(q)-dependent pathway. Am J Physiol Lung Cell Mol Physiol (2007) 292:L430–7. doi:10.1152/ajplung.00475.2005
71. Kuo HP, Lin HC, Hwang KH, Wang CH, Lu LC. Lipopolysaccharide enhances substance P-mediated neutrophil adherence to epithelial cells and cytokine release. Am J Respir Crit Care Med (2000) 162:1891–7. doi:10.1164/ajrccm.162.5.9911065
72. Barrios-Rodiles M, Tiraloche G, Chadee K. Lipopolysaccharide modulates cyclooxygenase-2 transcriptionally and posttranscriptionally in human macrophages independently from endogenous IL-1 beta and TNF-alpha. J Immunol (1999) 163:963–9.
73. Maier T, Guell M, Serrano L. Correlation of mRNA and protein in complex biological samples. FEBS Lett (2009) 583:3966–73. doi:10.1016/j.febslet.2009.10.036
74. Park YK, Hong H, Jang BC. Transcriptional and translational regulation of COX-2 expression by cadmium in C6 glioma cells. Int J Mol Med (2012) 30:960–6. doi:10.3892/ijmm.2012.1052
75. Ristimaki A, Garfinkel S, Wessendorf J, Maciag T, Hla T. Induction of cyclooxygenase-2 by interleukin-1 alpha. Evidence for post-transcriptional regulation. J Biol Chem (1994) 269:11769–75.
76. Oka T. Prostaglandin E2 as a mediator of fever: the role of prostaglandin E (EP) receptors. Front Biosci (2004) 9:3046–57. doi:10.2741/1458
77. Romanovsky AA, Ivanov AI, Karman EK. Blood-borne, albumin-bound prostaglandin E2 may be involved in fever. Am J Physiol (1999) 276:R1840–4.
78. Koon HW, Zhao D, Zhan Y, Rhee SH, Moyer MP, Pothoulakis C. Substance P stimulates cyclooxygenase-2 and prostaglandin E2 expression through JAK-STAT activation in human colonic epithelial cells. J Immunol (2006) 176:5050–9. doi:10.4049/jimmunol.176.8.5050
79. Gallicchio M, Rosa AC, Benetti E, Collino M, Dianzani C, Fantozzi R. Substance P-induced cyclooxygenase-2 expression in human umbilical vein endothelial cells. Br J Pharmacol (2006) 147:681–9. doi:10.1038/sj.bjp.0706660
80. Garcia M, Sakamoto K, Shigekawa M, Nakanishi S, Ito S. Multiple mechanisms of arachidonic acid release in Chinese hamster ovary cells transfected with cDNA of substance P receptor. Biochem Pharmacol (1994) 48:1735–41. doi:10.1016/0006-2952(94)90459-6
81. Ma L, Nagai J, Chun J, Ueda H. An LPA species (18:1 LPA) plays key roles in the self-amplification of spinal LPA production in the peripheral neuropathic pain model. Mol Pain (2013) 9:29. doi:10.1186/1744-8069-9-29
82. Hegyi P, Rakonczay Z Jr, Tiszlavicz L, Varro A, Toth A, Racz G, et al. Protein kinase C mediates the inhibitory effect of substance P on HCO3- secretion from guinea pig pancreatic ducts. Am J Physiol Cell Physiol (2005) 288:C1030–41. doi:10.1152/ajpcell.00430.2003
Keywords: fever, thermoregulation, systemic inflammation, endotoxin, cyclooxygenase, autonomic thermoeffectors, substance P, Tacr1
Citation: Pakai E, Tekus V, Zsiboras C, Rumbus Z, Olah E, Keringer P, Khidhir N, Matics R, Deres L, Ordog K, Szentes N, Pohoczky K, Kemeny A, Hegyi P, Pinter E and Garami A (2018) The Neurokinin-1 Receptor Contributes to the Early Phase of Lipopolysaccharide-Induced Fever via Stimulation of Peripheral Cyclooxygenase-2 Protein Expression in Mice. Front. Immunol. 9:166. doi: 10.3389/fimmu.2018.00166
Received: 17 November 2017; Accepted: 18 January 2018;
Published: 05 February 2018
Edited by:
Christoph Thiemermann, Queen Mary University of London, United KingdomReviewed by:
Hugo Caire Castro-Faria-Neto, Fundação Oswaldo Cruz (Fiocruz), BrazilCopyright: © 2018 Pakai, Tekus, Zsiboras, Rumbus, Olah, Keringer, Khidhir, Matics, Deres, Ordog, Szentes, Pohoczky, Kemeny, Hegyi, Pinter and Garami. This is an open-access article distributed under the terms of the Creative Commons Attribution License (CC BY). The use, distribution or reproduction in other forums is permitted, provided the original author(s) and the copyright owner are credited and that the original publication in this journal is cited, in accordance with accepted academic practice. No use, distribution or reproduction is permitted which does not comply with these terms.
*Correspondence: Andras Garami, andras.garami@aok.pte.hu
Disclaimer: All claims expressed in this article are solely those of the authors and do not necessarily represent those of their affiliated organizations, or those of the publisher, the editors and the reviewers. Any product that may be evaluated in this article or claim that may be made by its manufacturer is not guaranteed or endorsed by the publisher.
Research integrity at Frontiers
Learn more about the work of our research integrity team to safeguard the quality of each article we publish.