 Claudio Guedes Salgado1*†
 Pablo Pinto2,3†
 Raquel Carvalho Bouth1
 Angélica Rita Gobbo1Ana Caroline Cunha Messias1
 Tatiana Vinasco Sandoval2André Mauricio Ribeiro dos Santos2
 Fabiano Cordeiro Moreira3
 Amanda Ferreira Vidal2
 Luiz Ricardo Goulart4
 Josafá Gonçalves Barreto1,5Moisés Batista da Silva1
 Marco Andrey Cipriani Frade6
 John Stewart Spencer7Sidney Santos2,3
 Ândrea Ribeiro-dos-Santos2,3*
- 1Laboratório de Dermato-Imunologia, Instituto de Ciências Biológicas (ICB), Universidade Federal do Pará (UFPA), Marituba, Brazil
- 2Laboratório de Genética Humana e Médica, ICB, UFPA, Belém, Brazil
- 3Núcleo de Pesquisas em Oncologia (NPO), UFPA, Belém, Brazil
- 4Laboratório de Nanobiotecnologia, Instituto de Genética e Bioquímica, Universidade Federal de Uberlândia (UFU), Uberlândia, Brazil
- 5Laboratório de Epidemiologia Espacial (LabEE), Campus Castanhal, UFPA, Belém, Brazil
- 6Divisão de Dermatologia, Departamento de Clínica Médica da Faculdade de Medicina de Ribeirão Preto, USP, Ribeirão Preto, Brazil
- 7Mycobacteria Research Laboratories, Department of Microbiology, Immunology and Pathology, Colorado State University, Fort Collins, CO, United States
Leprosy remains as a public health problem and its physiopathology is still not fully understood. MicroRNAs (miRNA) are small RNA non-coding that can interfere with mRNA to regulate gene expression. A few studies using DNA chip microarrays have explored the expression of miRNA in leprosy patients using a predetermined set of genes as targets, providing interesting findings regarding the regulation of immune genes. However, using a predetermined set of genes restricted the possibility of finding new miRNAs that might be involved in different mechanisms of disease. Thus, we examined the miRNome of tuberculoid (TT) and lepromatous (LL) patients using both blood and lesional biopsies from classical leprosy patients (LP) who visited the Dr. Marcello Candia Reference Unit in Sanitary Dermatology in the State of Pará and compared them with healthy subjects. Using a set of tools to correlate significantly differentially expressed miRNAs with their gene targets, we identified possible interactions and networks of miRNAs that might be involved in leprosy immunophysiopathology. Using this approach, we showed that the leprosy miRNA profile in blood is distinct from that in lesional skin as well as that four main groups of genes are the targets of leprosy miRNA: (1) recognition and phagocytosis, with activation of immune effector cells, where the immunosuppressant profile of LL and immunoresponsive profile of TT are clearly affected by miRNA expression; (2) apoptosis, with supportive data for an antiapoptotic leprosy profile based on BCL2, MCL1, and CASP8 expression; (3) Schwann cells (SCs), demyelination and epithelial–mesenchymal transition (EMT), supporting a role for different developmental or differentiation gene families, such as Sox, Zeb, and Hox; and (4) loss of sensation and neuropathic pain, revealing that RHOA, ROCK1, SIGMAR1, and aquaporin-1 (AQP1) may be involved in the loss of sensation or leprosy pain, indicating possible new therapeutic targets. Additionally, AQP1 may also be involved in skin dryness and loss of elasticity, which are well known signs of leprosy but with unrecognized physiopathology. In sum, miRNA expression reveals new aspects of leprosy immunophysiopathology, especially on the regulation of the immune system, apoptosis, SC demyelination, EMT, and neuropathic pain.
Introduction
Leprosy is an ancient disease caused by Mycobacterium leprae, an obligate intracellular pathogen that infects macrophages and Schwann cells (SCs), resulting in nerve and skin lesions with loss of sensation, the hallmark of the disease (1).
After contact with the bacilli, most people control M. leprae multiplication and will never develop leprosy (2). If the bacilli survive, the host may develop two stable polar forms of disease, the paucibacillary (PB) tuberculoid (TT) form or the multibacillary (MB) lepromatous (LL) form, besides the three borderline intermediate unstable forms, borderline TT, borderline borderline, and borderline LL. PB patients have a good cellular immune response (CIR) that may restrict bacillus proliferation, resulting in a few lesions that are usually limited to a specific part of the tegument and to a few nerve trunks. MB patients, on the other hand, have a poor CIR with an exacerbated humoral immune response that is not effective for controlling bacillus proliferation. Patients have many lesions disseminated through the body, including the skin and peripheral nerves (3).
The natural history of the disease results in disabilities. Demyelination caused by SC degeneration is one of the main events in leprosy physiopathology, together with exacerbations of the immune response, known as leprosy reactions. While patients evolve a loss of sensation on the skin, they may also have peripheral nerve neuropathic pain that can be exacerbated by the reactions and may last for many years, even after multidrug therapy (MDT) (4).
Genetic studies of portions of the genome that do not encode protein revealed one class of small non-coding RNAs [named microRNAs (miRNAs)] that are involved in posttranscriptional control of gene expression (5). Knowledge about the interaction between miRNA and leprosy is limited (6–12). A recent study demonstrated that a miRNA can influence the mechanism whereby the cell host can prevent bacillus growth and generate natural barriers against infection by M. leprae (9). Evidence has shown that miRNAs are able to modulate host antibacterial pathways during the infection process and influence the outcome of disease (9). Analysis of miRNAs that are differentially expressed in distinct poles of the disease could provide a better understanding of targets for an efficient immune response to prevent infection, as well as elucidate novel possible biomarkers for leprosy, for example, subclinical infection and one possible predictor of who will develop leprosy (13, 14).
Upon contact with M. leprae, the human immune system must recognize and process the bacteria to activate immune effector cells. During the interaction, the host cells may be induced to undergo apoptosis, hindering bacillus adaptation or maintaining its survival with attenuated microbicide capacity, to shelter the bacilli (15). Demyelination is a key event in leprosy, and SC are critical for myelin production and maintenance on peripheral nerves. Epithelial–mesenchymal transition (EMT) is a biological process in which specialized cells may undergo a phenotypic change to mesenchymal cells, with higher motility, greater resistance to apoptosis, induction of fibrosis, loss of markers for specialized cells, and the acquisition of new proliferation markers (16). Mechanisms responsible for the loss of sensation and neuropathic pain are poorly understood.
Our work presents the first leprosy miRNome from lesions and blood of LP. In addition to describing the miRNAs, we chose those with significant differential expression, searched for their target genes, and constructed possible pathways based on current knowledge of leprosy immune pathophysiology.
Materials and Methods
Study Design and Participants
A total of 28 biological samples from leprosy patients (LP) before starting MDT treatment who attended the Dr. Marcello Candia Reference Unit in Sanitary Dermatology of the State of Pará (UREMC) on 2014, in Marituba, Pará, Brazil, and individuals without leprosy and with no other diseases [healthy subjects (HS)] were included in the present study, according to the following groups: (a) 17 tissue biopsies samples [11 from LP (6 LL and 5 TT) and 6 skin tissue from HS for controls] and (b) 11 peripheral blood samples [9 from LP (5 LL and 4 TT) and 2 from HS for controls]. Table 1 describes gender, age, bacterial index, anti-PGL-I optical density, and disability grading of the 11 LP selected for the study.
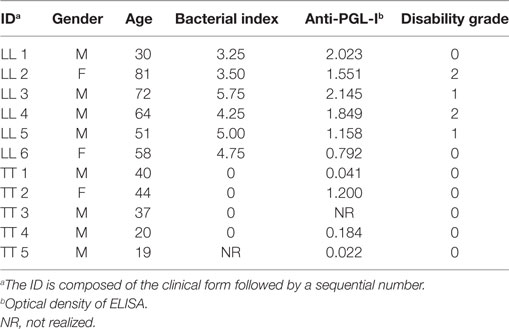
Table 1. Leprosy patients enrolled on the study: ID, gender, age, bacterial index, anti-PGL-I IgM, and disability grade.
This study adhered to the Declaration of Helsinki and was approved by the Institute of Health Sciences Research Ethics Committee at Universidade Federal do Pará, certified by CAAE 26765414.0.0000.0018. A written informed consent to publish was obtained from every individual who accepted to participate in this study. The small RNAseq number register is ERP105473 on European Nucleotide Archive database.
Total RNA Storage, Extraction, and Quantification
A flowchart (Figure 1) presents all the steps performed during miRNA Seq (extraction, library, sequencing data processing and analysis pipeline, target gene identification). The whole peripheral blood samples were collected into a Tempus Blood RNA Tube (Thermo Fisher Scientific, USA) and stored at −20°C until extraction. The skin tissue biopsy samples were collected in a propylene tube with 2 mL RNAlater (Thermo Fisher Scientific, USA) and stored in liquid nitrogen until use. Total RNA was extracted from the tissue sample using TRIzol reagent (Invitrogen, USA), and samples were eluted in DEPC water and stored in liquid nitrogen. Total RNA was extracted from blood samples using the MagMAX RNA Isolation Kit (Thermo Fisher Scientific, USA). Total RNA quantity and quality assessed were performed with a NanoDrop 1000 (Thermo Scientific, USA) and Agilent 2200 TapeStation (Agilent Technologies, USA).
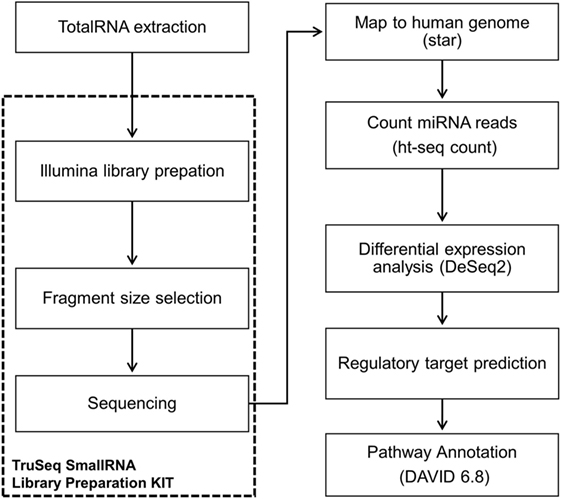
Figure 1. Flowchart showing workflow of miRNome sequencing and analysis.
Library Preparation and Next-Generation Sequencing (NGS)
The library was prepared using the TruSeq Small RNA Library Preparation Kit (Illumina, Inc., USA) according to the manufacturer’s instructions, and all samples used for the library had an initial concentration of 1 μg/5 μL of total RNA. The library was validated and quantified with an Agilent 2200 TapeStation (Agilent Technologies, USA) platform and by real time PCR with the KAPA Library Quantification Kit (KAPA BIOSYSTEM, USA). The libraries were then diluted to a concentration of 4 nM and sequenced using the MiSeq Reagent Kit v3 150 cycle (Illumina, Inc., USA) on a MiSeq System (Illumina, Inc., USA). The tissue and blood samples were sequenced separately.
Sequencing Data Processing and Analysis-Small RNA-Seq Pipeline
The sequencing data were processed on an Illumina MiSeq reporter and extracted in FASTQ format. A pipeline of pre-processing using the Fastx_toolkit was applied for a low filter quality, trimers of extreme 3′ reads and contaminant removal. The pipeline was performed according the chronogram: (a) average Phred quality score (Q) greater than 30, (b) reads more than 17 nucleotides long, and (c) base calling error probabilities (P) greater than 80. Next, read alignment with the human genome (GRCh37) in combination with the miRNA data base (MirBase v.19) was performed using Spliced Transcripts Alignment to a Reference. The miRNA was scored with htseq-count toll, and the results were normalized and analyzed using the Bioconductor-DESeq2 package with R statistical software. Thus, the following comparisons were conducted: (a) LP vs. HS; (b) TT leprosy vs. HS; (c) LL leprosy vs. HS; (d) TT vs. LL leprosy. Adjusted values of p ≤ 0.05 and a log2 fold change >2 were considered statistically significant.
Target Gene Identification
The genes regulated by the differentially expressed miRNAs detected during the analysis were identified using four tools:(i) TargetCompare (http://lghm.ufpa.br/ferramentas-de-estudos/targetcompare/) (17); (ii) miRTarBase (http://mirtarbase.mbc.nctu.edu.tw); (iii) DIANA miRPath v.3 (18); and (iv) TargetScan (19). We selected only genes regulated by two or more miRNAs with strong experimental evidences support, such as those confirmed by western blotting, reporter assay or qPCR.
Selected targets were further investigated using the pathway enrichment tool DAVID 6.8 (20) that provides a comprehensive set of functional annotation tools and searches in BioCarta and KEGG pathway maps to help investigators to understand biological meaning behind a large list of genes. The pathway enrichment analysis was performed separately for the following groups: (i) HS vs. LP downregulated miRNAs in tissue; (ii) HS vs. LL downregulated miRNAs in tissue; (iii) HS vs. LL upregulated miRNAs in tissue; and (iv) HS vs. LP downregulated miRNAs in blood.
Results
This study evaluated two types of leprosy samples, skin biopsies and blood by distinct NGS. For the two sample types, the differential expression profiles of the miRNAs were analyzed to identify possible leprosy biomarkers to assist our understanding of epigenetic control mechanisms of the immune response, apoptosis, SC demyelination, EMT, and neuropathic pain.
miRNA Sequencing and Differential Expression Profiles of Tissue Samples
This sequencing yielded 4 million reads. After the process pipeline, more than 96% of the reads were aligned with the human genome, and the miRNA count was performed using htseq-count (miRNA count ≥ 10), with an average of 36,745 reads per sample and 656 miRNAs expressed in at least one sample.
A heatmap was constructed using the RPKM (Reads per Kilobases per Million) expression for all differentially expression miRNA (Figure 2). The analysis identified the RPKM z-score of 67 differentially expressed miRNAs, 43 downregulated and 24 upregulated (Table 2; Data Sheet S1 in Supplementary Material) in skin biopsies among HS, LL, and TT. miRNAs (rows) were hierarchically clustered according their expression, and organized according to the three groups, HS, LL, and TT (columns). A hierarchical clustering of the data illustrates how those markers were able to distinguish HS from leprosy patients in general, and LL from TT poles.
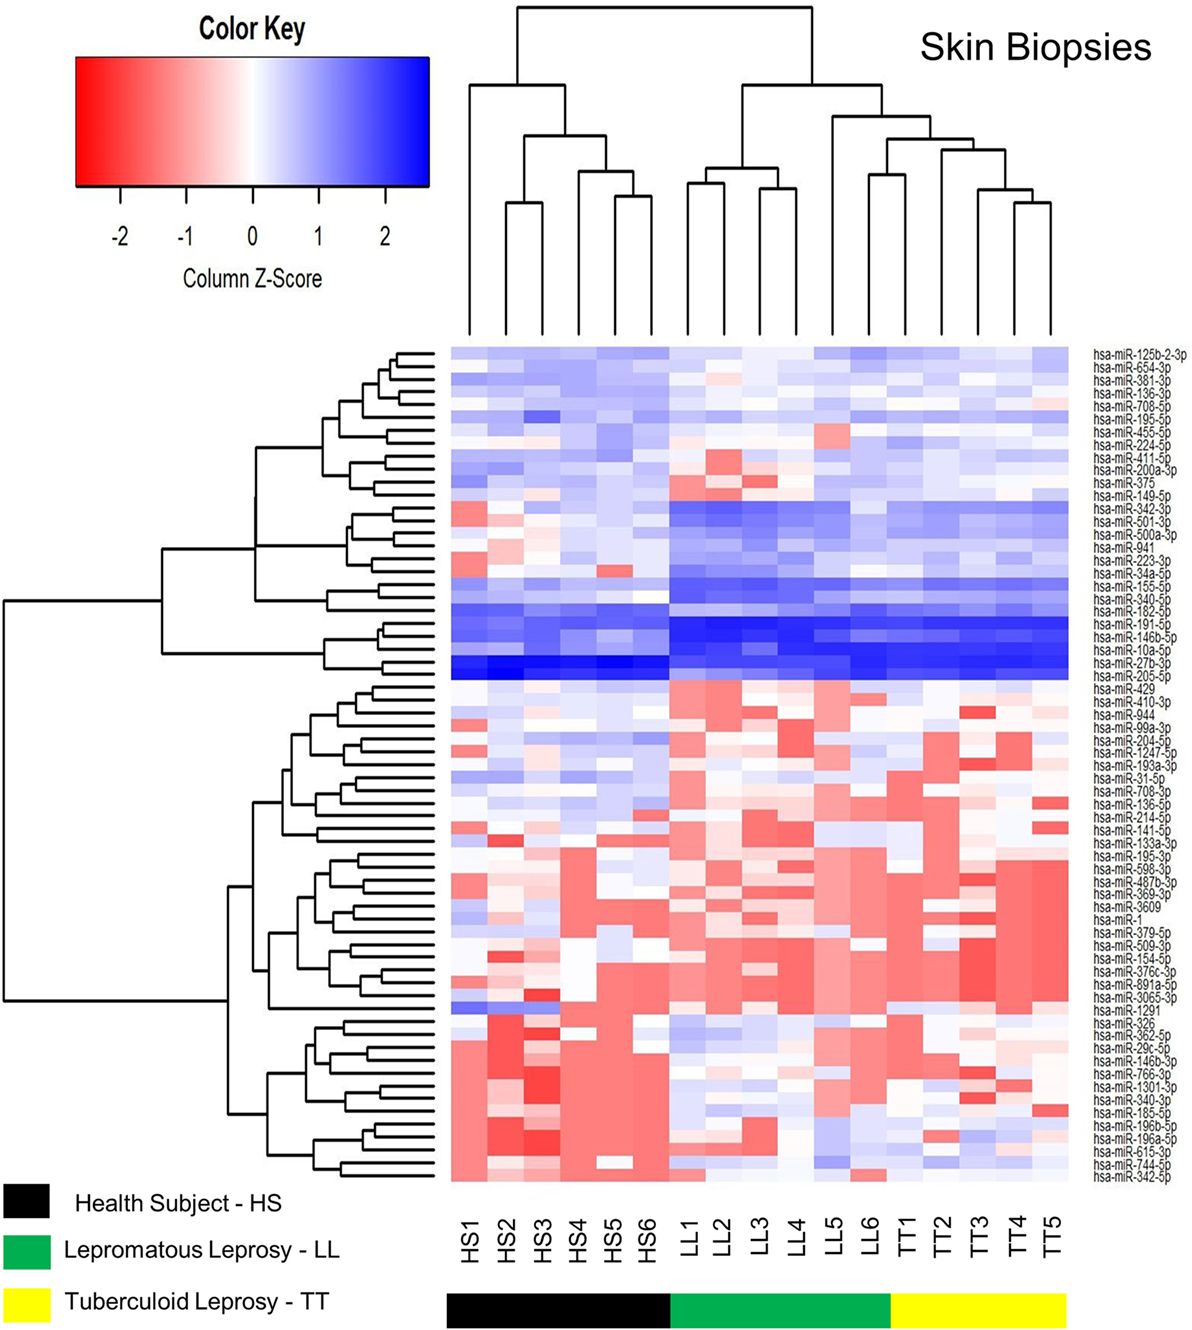
Figure 2. Heatmap of skin biopsies for the differentially expressed microRNAs (miRNAs) among health subjects (HS), lepromatous (LL) leprosy, and tuberculoid (TT) leprosy. It represents the RPKM z-score of 67 differentially expressed miRNAs. miRNAs (rows) were hierarchically clustered according their expression in the three different samples (HS, LL, and TT). The clustering was able to distinguish HS from leprosy patients, as well as LL from TT.
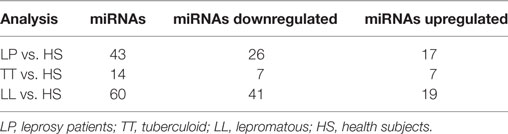
Table 2. Number of miRNAs that were differentially expressed in LP (TT and LL) compared with HS in skin biopsy samples.
Figure 3 shows the 39 simultaneous differentially expressed miRNAs, for at least two of the three comparisons conducted as described in Table 2 (HS vs. LP, HS vs. TT, and HS vs. LL), organized by their fold change showing 24 downregulated and 15 upregulated miRNAs.
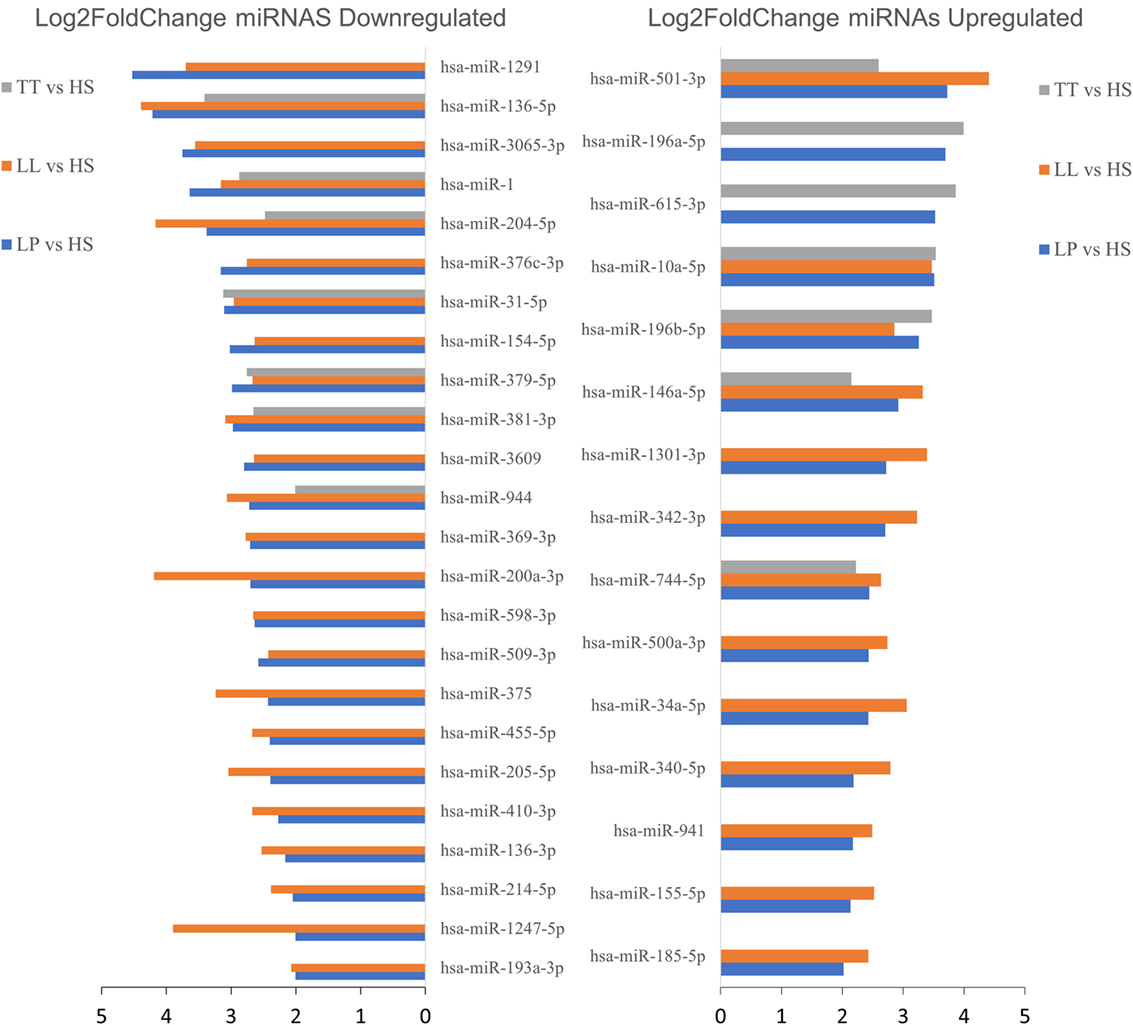
Figure 3. Upregulated or downregulated microRNAs (miRNAs) in at least two comparisons [tuberculoid (TT) vs. healthy subjects (HS), lepromatous (LL) vs. HS, or leprosy patients (LP) vs. HS] on skin biopsies samples. Among the 67 differentially expressed miRNAs (|log2 fold change| > 2 and adjusted p-value < 0.05), here we highlight 39 miRNAs differentially expressed between HS versus LP and HS versus LL or TT patients, each indicated by blue, orange, and gray bars, respectively. The barplot represents each miRNA (y-axis) absolute log2 fold change (x-axis) for each comparison and separated in up- and downregulated miRNA regarding HS.
The comparison of extreme poles of leprosy, TT and LL, revealed five differentially expressed miRNAs, of which three were downregulated (hsa-miR-340-5p, hsa-miR-34a-5p, hsa-miR-362-5p) and two were upregulated (hsa-miR-429, hsa-miR-200a-3p). The hsa-miR-362-5p appeared only when TT and LL were compared, but not when LP were compared to HS. The volcano plot shows the only five miRNAs differentially expressed (Figure 4).
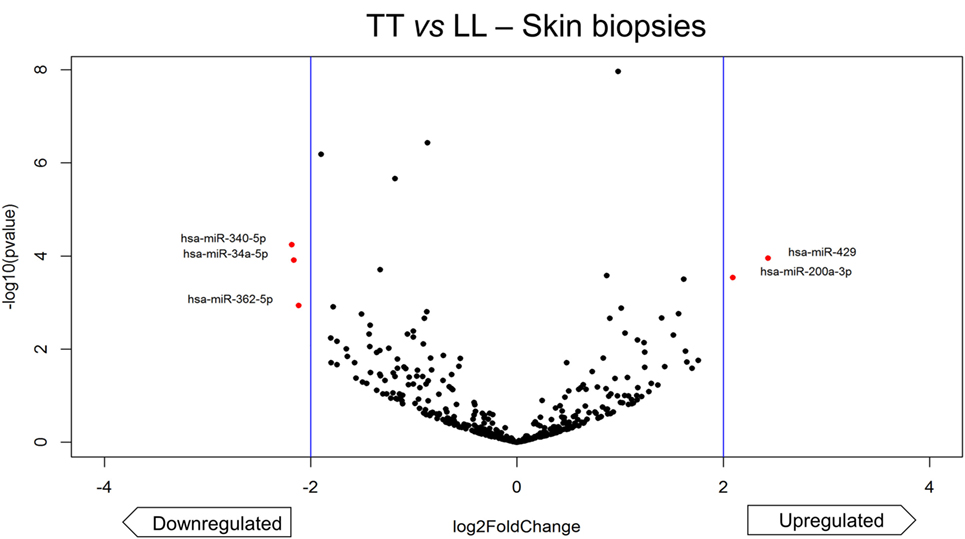
Figure 4. Volcano plot of differentially expressed microRNAs (miRNAs) of skin biopsies between tuberculoid (TT) leprosy and lepromatous (LL) leprosy. The plot represents each miRNA differential expression analysis result where the y-axis is −log10 p-value of the comparison and the x-axis is log2 fold-change (x-axis) regarding LL. Differentially expressed miRNAs were considered only if the analysis showed |log2 fold-change| > 2 (indicated by the blue vertical lines) and adjusted p-value < 0.05. We found five differentially expressed miRNA (highlighted in red), two upregulated (hsa-miR-429, hsa-miR-200a-3p) and three downregulated (hsa-miR-340-5p, hsa-miR-34a-5p, hsa-miR-362-5p).
miRNA Sequencing and Differential Expression Profiles of Whole Blood Samples
Sequencing yielded 6 million reads. After the process pipeline, more than 95% of the reads were aligned with the human genome, and the miRNAs were counted using htseq-count (miRNA count ≥ 10), with an average of 371,325 reads per sample and 527 miRNAs expressed in at least one sample.
The differential expression analysis of blood miRNAs was conducted similarly to that applied for the tissue and revealed a total of 10 differentially expressed miRNAs, with nine downregulated (hsa-let-7f-5p, hsa-miR-126-3p, hsa-miR-126-5p, hsa-miR-144-5p, hsa-miR-15a-5p, hsa-miR-20a-5p, hsa-miR-26b-5p, hsa-miR-106b-5p, hsa-miR-16-5p) and one upregulated (hsa-miR-1291) (Table 3; Data Sheet S2 in Supplementary Material). From the differentially expressed miRNAs identified, a heatmap was constructed using RPKM expression and two clusters were observed, with standards of expression able to differentiate LP of HS (Figure 5), although comparisons between TT vs. LL showed no differentially expressed miRNAs.
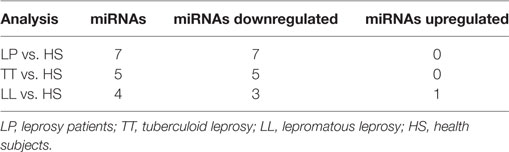
Table 3. Number of miRNAs that were differentially expressed in LP (TT and LL) compared with HS in blood.
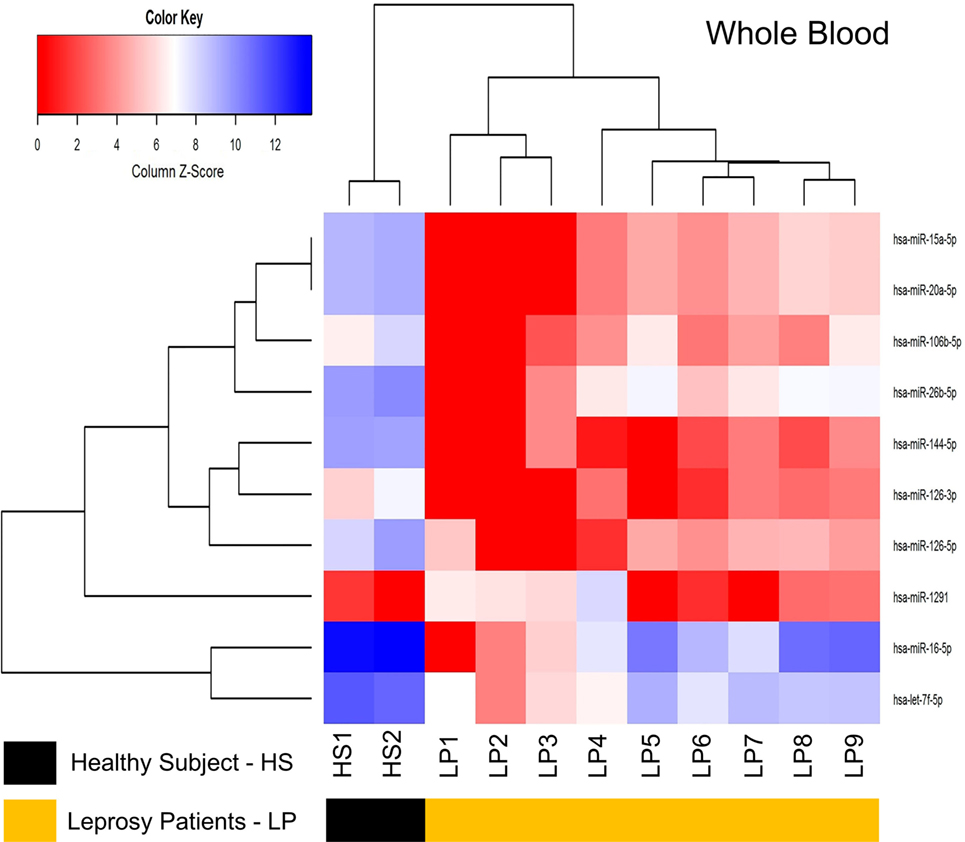
Figure 5. Heatmap of whole blood for the differentially expressed microRNAs (miRNAs) between healthy subjects (HS) and leprosy patients (LP). It represents the RPKM z-score of 10 differentially expressed miRNAs. miRNAs (rows) were hierarchically clustered according their expression on HS or LP (columns). The clustering was able to distinguish LP from HS.
Target Gene Identification
Using the differentially expressed miRNAs from either blood or skin lesions, we investigated the genes regulated by them separately for up and down regulated miRNAs. The miRNAs and their targets are described in Tables 4–8, as follow: (i) HS vs. LP downregulated (Table 4) and upregulated (Table 5) miRNAs in skin biopsies; (ii) HS vs. LL downregulated (Table 6) and upregulated (Table 7) miRNAs in skin biopsies; and (iii) HS vs. LP downregulated miRNAs in blood (Table 8).
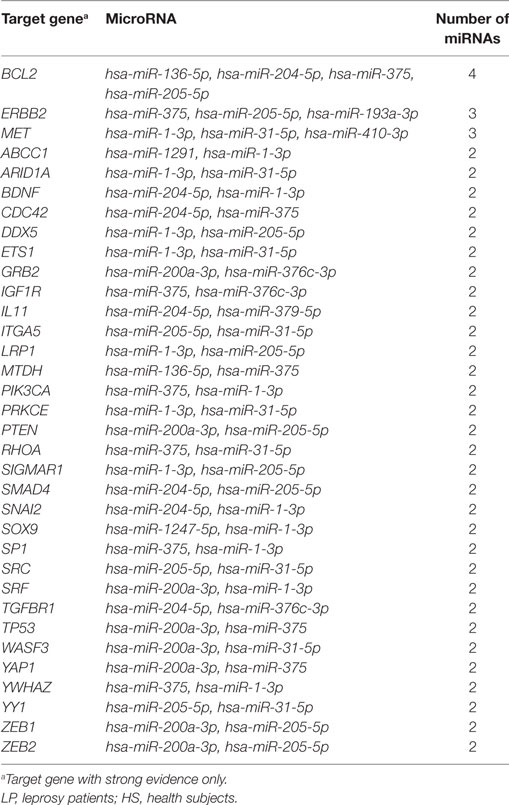
Table 4. List of the genes targeted by two or more differentially expressed miRNAs among the 26 downregulated miRNAs in LP vs. HS skin biopsies.
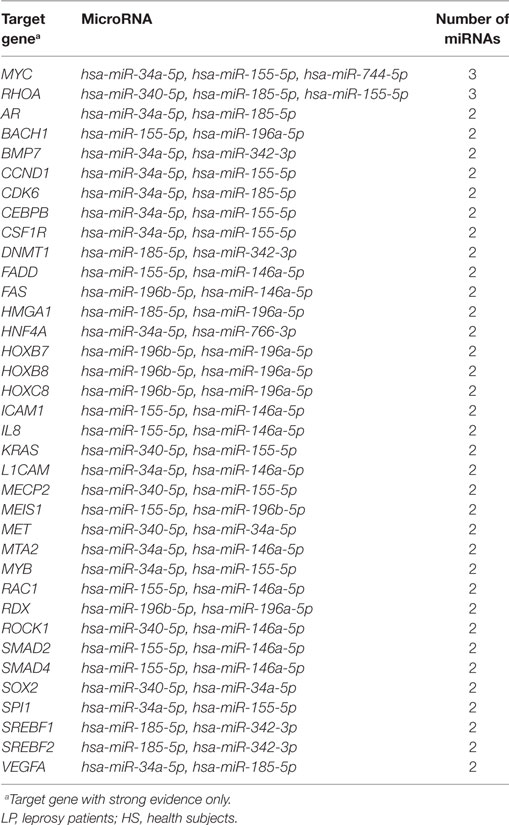
Table 5. List of the genes that were potentially targeted by two or more differentially expressed miRNAs among the 17 upregulated miRNAs in LP vs. HS skin biopsies.
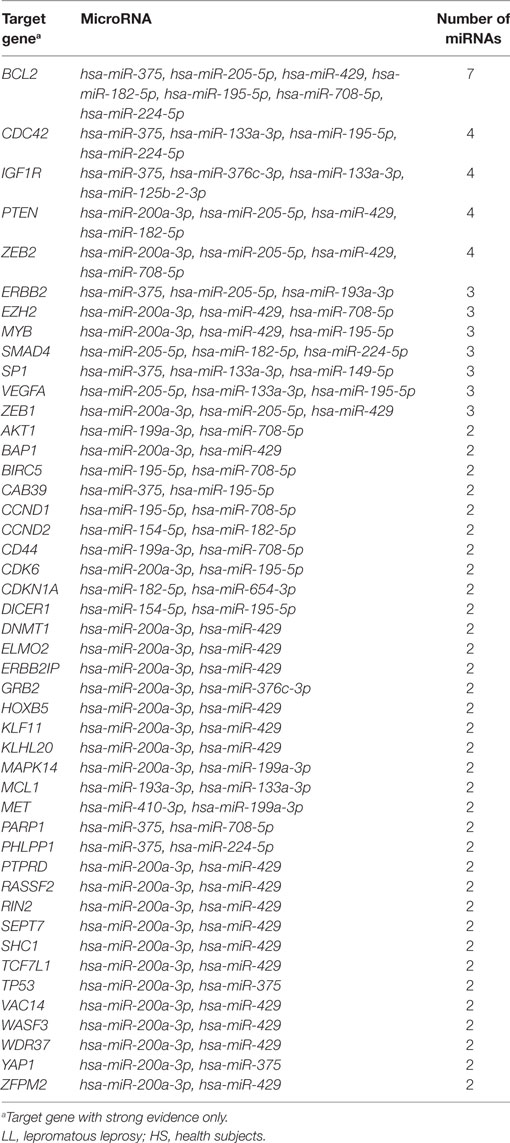
Table 6. List of the genes that were potentially targeted by two or more differentially expressed miRNAs among the 34 specific downregulated miRNAs in LL vs. HS skin biopsies.
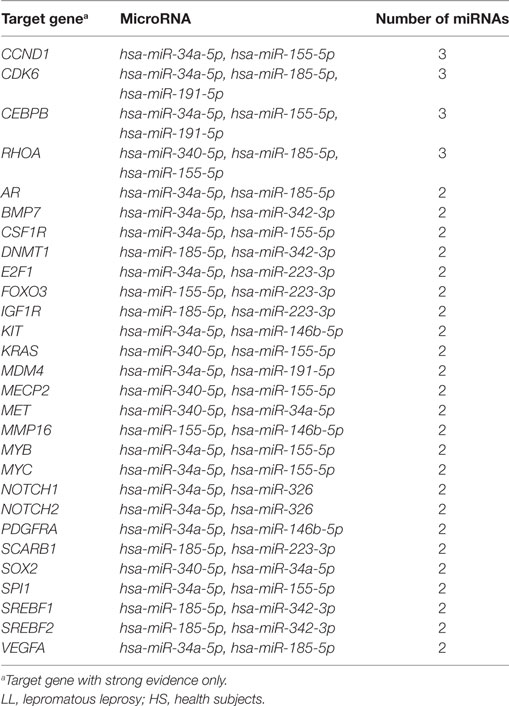
Table 7. List of genes potentially targeted by two or more differentially expressed miRNAs among the 14 specific upregulated miRNAs LL vs. HS skin biopsies.
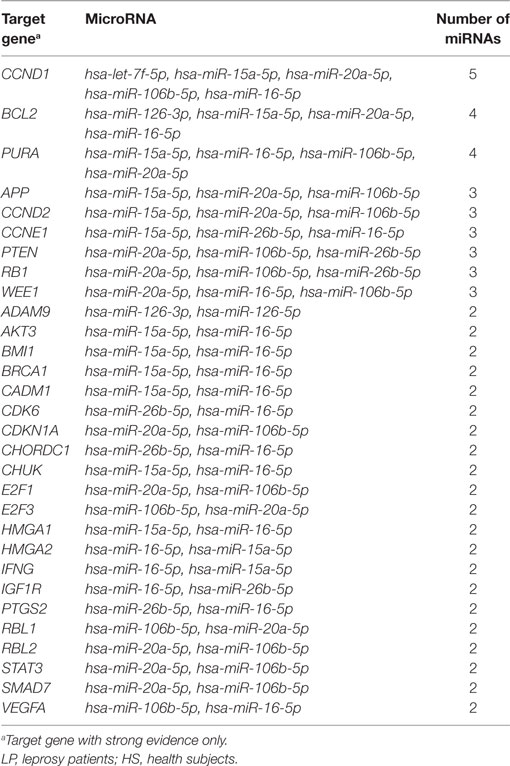
Table 8. List of genes that were potentially targeted by two or more differentially expressed miRNAs among the nine downregulated miRNAs in LP vs. HS blood.
Discussion
Recognition, Engulfment, and Activation of Immune Effector Cells
The metalloproteinase ADAM9 and the integrin ITGA5 are two transmembrane proteins involved in mycobacteria invasion of macrophages (21, 22) and endothelial cells (23). Phagocytosis of M. leprae may be stimulated by IGF1R (24), LRP1 (25), and PIK3CA (26). In blood, with the exception of hsa-miR1291, all miRNAs were downregulated when LPs were compared with HS, indicating that the phagocytosis of M. leprae in LP blood was not inhibited. Furthermore, miRNAs that control IGF1R gene were upregulated in lesional tissue of LL patients in comparison to HS (Figure 6), which together with the decrease in IGF1 gene in LL patients (27) may result in inhibition of the microbicidal function of macrophages against M. leprae (15) in tissue.
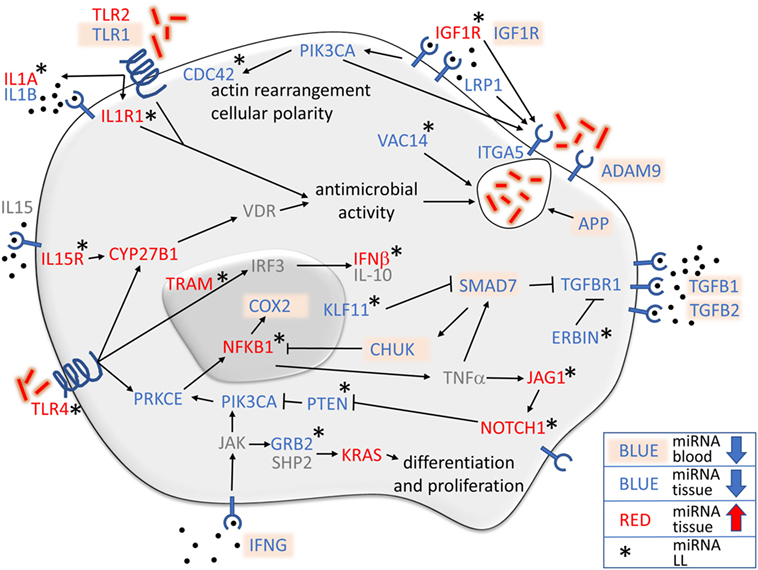
Figure 6. Overview of the relationship of monocyte immunology to microRNAs (miRNAs) regulating genes in leprosy lesions and blood. Most of the genes controlled by the miRNAs were found in lesional tissue, shown either in blue (downregulated miRNAs) or in red (upregulated miRNAs). Blood miRNAs are marked in light orange, and those that were not found are shown in gray. Asterisks indicate genes with miRNAs that were differentially expressed only when lepromatous (LL) was compared with healthy subject. Upregulated miRNAs controlling IL1A, IL1R1, IGF1R, NOTCH1, JAG1, IL15R, TLR4, CYP27B1, TRAM, NFKB1, and IFNB, and downregulated miRNAs regulating the expression of CDC42, VAC14, ERBIN, KLF11, PTEN, and GRB2, all in LL patients, demonstrated an immunosuppressive phenotype controlling actin rearrangement and cellular polarity, including phagosome formation, vitamin D antimicrobial activity, cellular differentiation and proliferation, and diverse pathways to stimulate TGF-β-related genes while suppressing NFκB inflammatory functions.
VAC14 is induced to control vacuolation in macrophages (28), while APP produces the oxidative burst (29) and PIK3CA stimulates M. leprae phagocytosis (26). Several miRNAs control the expression of VAC14 and PIK3CA genes in lesional tissue and APP gene in blood, all of which were downregulated in LP in comparison to HS (Figure 6). When LL patients were compared to HS, only miRNAs that control VAC14 gene were downregulated, indicating that VAC14 gene expression was necessary for vacuole formation in LL patients.
Protein kinase C epsilon encoded by the PRKCE gene was also found to have downregulated miRNAs in LP. PRKCE is coupled to TLR-4, which is responsible for M. leprae recognition (30). Upon phosphorylation, two pathways may be activated: IRF3 gene upregulation may result in the production of IFN-β and IL-10, especially in LL patients (31), or NFκB upregulation, with the production of proinflammatory cytokines, such as TNF-α and IL-6, by NFκB activation (30). IFN-γ and TNF-α may disrupt the TGF-β pathway by SMAD7 activation followed by TGFBR1 downregulation (32).
Leprosy patients miRNAs control TGFBR1, SMAD7 gene and the zinc finger transcription factor KLF11 gene, which regulates SMAD7 expression. LL patients showed a downregulation of miRNAs that control KLF11 gene expression, which may result in SMAD7 gene inhibition and an increase in TGFBR1 gene, with more TGF-β capture contributing to the immunosuppressive profile of LL. SMAD7 also stimulates CHUK, which inhibits the NFKB1 and COX2 inflammatory pathway. Interestingly, the central inflammatory player, NFKB1, was also found to be regulated by miRNAs in LL patient lesions (Figure 6). It has been previously demonstrated that TGF-β secretion is augmented in LL patients (33) and is secreted by CD4+ CD25+ FOXP3+ T regulatory cells (34), while TGF-β receptors are also increased in lesions of LL patients (35). Additionally, miRNAs that regulated cytoplasmic protein ERBIN were downregulated in LL patient lesions, indicating that ERBIN may also regulate TGFBR1 gene pathway expression (Figure 6).
NOTCH1/2 have different functions in immune regulation, but overall seem to stimulate the immune system participating in the differentiation of naïve T cells (36) and modulating inflammation (37). An important regulator of M1 macrophage differentiation and the Th1 T cell profile in leprosy, the transmembrane protein NOTCH1 (38) was also found to be regulated by LP miRNAs in lesional tissue of LL patients. Additionally, NOTCH1 gene, hsa-miR-34a-5p also control NOTCH2 and JAG1 gene in LL lesions (Figures 6 and 7). NOCTH1 is known to be activated by JAG1 on endothelial cells, regulating the differentiation of M1 macrophages (38) in PB leprosy. Both NOTCH1 and NOTCH2 are expressed on Th0 cells and are related to Th17 differentiation (39). Furthermore, NOTCH1/2 are expressed on activated Th1 cells and are critical to the protective response against Leishmania major infection by the production of IFN-γ (40), which is also important for leprosy protection by JAG1 stimulation (38).
Activation of TLR4, IL15R, IL1R1, and IL1A is important for antimicrobial activity, a key function for infection control. LL patients were found to have upregulated miRNAs for all those genes in lesional skin (Figures 6 and 7). TLR4 and IL15R converge to CYP27B1, which converts 25-hydroxyvitamin D (25D) to the active hormone 1,25 dihydroxyvitamin D (1,25D) and links to the vitamin D receptor, resulting in the expression of antimicrobial peptides (9, 41). IL1R1 and IL1A, and TLR2 gene were found to have upregulated miRNAs for all LP, which are also involved in pathways culminating in antimicrobial activity (9). Although has-mir-21 seems to be critical for the control of the TLR4, IL15R, IL1R1, and IL1A gene expression in a cell culture-based systems, using our human approach, other miRNAs seemed to be more relevant; however, additional studies are necessary for validation.
TNFAIP3 (A20), which is produced by macrophages infected by M. tuberculosis, has been recently described as a new NFκB blocker (42). We found that hsa-miR-125b is downregulated only in LL, and hsa-let-7f-5p is downregulated in LP (Figure 7). Both miRNAs inhibit A20 gene expression, leading to an increase in NFκB production. According to our LP miRNA profile, hsa-miR-125b and hsa-let-7f-5p expression are decreased and therefore do not block A20 gene, resulting in NFκB abrogation. This phenomenon may drive macrophages toward a M2 profile, with more TGFB1 (43), IL6 (44), and IL10 gene (45) production (all with downregulated miRNAs, Figure 7) that may stimulate Th2 cells to produce more IL-4 (44). Upon ligation, the IL-4 receptor activates STAT6, stimulating the transcription of miR-1301, miR-342, and miR155, which supports M2 by activating BCL2 gene and promotes Th2 activation (46). All three miRNAs were found to be upregulated in LL patients, confirming their importance in driving LP toward a Th2 profile.
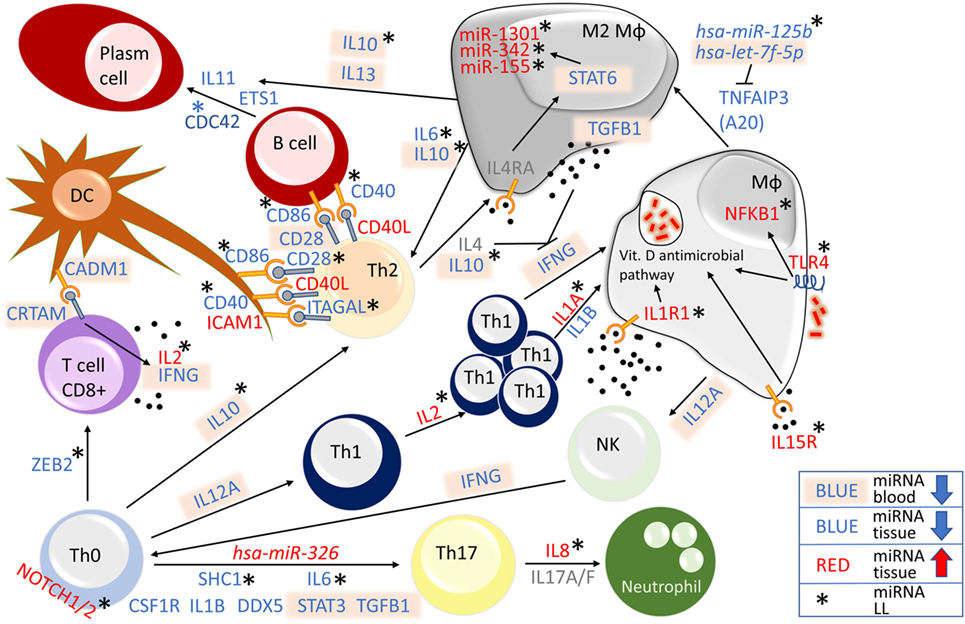
Figure 7. Overview of microRNA (miRNA)-regulated genes related to the immune system in leprosy lesions and blood. Genes regulated by differentially expressed miRNAs were found in blood (all downregulated miRNAs are shown in blue with text marked in light orange) or lesional tissue (red upregulated, blue downregulated). Differentially expressed genes regulating miRNAs (shown in gray) were not found. Lepromatous (LL)—asterisk—upregulated miRNAs for NOTCH1 and NOTCH2, IL2, IL8, IL1A, IL1R1, IL15R, TLR4, and NFKB1, and downregulated miRNAs for ZEB2, SHC1, IL6, IL10, CDC42, ITAGAL, CD40, and CD86, all in LL patients, indicate an immunosuppressive phenotype. Additionally, corroboration of the expression of hsa-miR-326, which was upregulated in leprosy patient (LP), hsa-let-7f-5p, which was downregulated in LP, hsa-miR-1301, hsa-miR-342, and hsa-miR-155, all of which were upregulated in LL, and hsa-miR-125b, which was downregulated in LL, drove the immune system of LL patients toward an immunosuppressive stage.
In addition, IL10 gene, with miRNA downregulated only in LL patients, IL13 gene miRNAs were downregulated in the blood of all LP. Together with lesional IL11, ETS1 and CDC42, IL10, and IL13 gene induce the differentiation of B cells from plasma cells (47–50). The interaction of CD40 with CD40L results in IL-12 production, which is impaired in LL patients (51). In addition to ICAM1, which has been demonstrated to be inhibited in LL (52), CD40L gene miRNAs were upregulated in all LP, and the control of IL2, IL1A, IL1R, TLR4, and NFKB1 gene miRNAs were upregulated in LL (Figure 7), These phenomena may lead to increased IL4, IL10, and TGFB1 production, blocking IFNG gene expression (53–56) and resulting in the impaired CIR observed in LL patients.
MicroRNAs targeting the CD8+ T cell differentiation gene ZEB2 gene and activation genes CADM1 and CRTAM gene were found to be downregulated in LP patients (Figure 7). The adhesion molecule CADM1, which is expressed on dendritic cells (DCs), induces a CD8+ cytotoxic profile upon ligation to CRTAM T-cells, with the release of IL2 and IFNG (57, 58). Although IFNG gene miRNAs were downregulated, IL2 gene miRNAs were upregulated in LL patients, suggesting a posttranscriptional blocking of IL2 released from CD8+ T cells in LP.
Considering Th1, Th2, and Th17, we detected miRNAs controlling all three axes in LP. On the Th1 axis, although IL12A and IFNG gene miRNAs were downregulated in blood, IL2 gene, a key cytokine for Th1 proliferation (59), together with IL1A, IL1R1, IL15R, TLR4, and NFKB gene, were all found to be regulated by miRNAs in the lesional skin of LL patients. For Th2, IL6, and IL10 gene, together with the miRNAs hsa-miR-125b, miR-1301, miR-342, and miR-155, were all regulated by miRNAs, maintaining a suppressive profile in LL patients. Th17 differentiation is influenced by different factors. We found that SHC1 gene, which activates STAT3 gene, and IL6 gene that can induce Th17 differentiation in association with TGFB1gene (60), both had downregulated miRNAs in LL patients, together with upregulation of the miRNA hsa-miR-326, which was described as a Th17 inductor. Although Th17 is known to produce IL8 (61), we found miRNAs controlling the expression of this chemokine in lesions of LL patients (Figure 7), corroborating the absence of this chemokine in polymorphonuclear cells of LL patient unstimulated blood (62).
Apoptosis
The role of apoptosis during M. leprae infection is not clear, and different research settings have demonstrated both anti- (24, 63) and proapoptotic (64, 65) features, in addition to possible differences depending on the clinical form of leprosy (66). BCL2 has been shown to be highly expressed in LL patients (66), and BCL2 and MCL1 gene are induced by M. leprae on monocytes (63), while CASP8 activity in LL is decreased (67). We found several miRNAs controlling apoptosis pathways in LP. In addition to the downregulation of all miRNAs acting directly on the antiapoptotic gene BCL2 and its family member MCL1, especially in LL lesions, the proapoptotic gene CASP8 inducers MYC, FAS, and FADD gene were found to have upregulated miRNAs in LP, while the FASLG inhibitor GRB2 (68) presented downregulated miRNAs in LL patients (Figure 8).
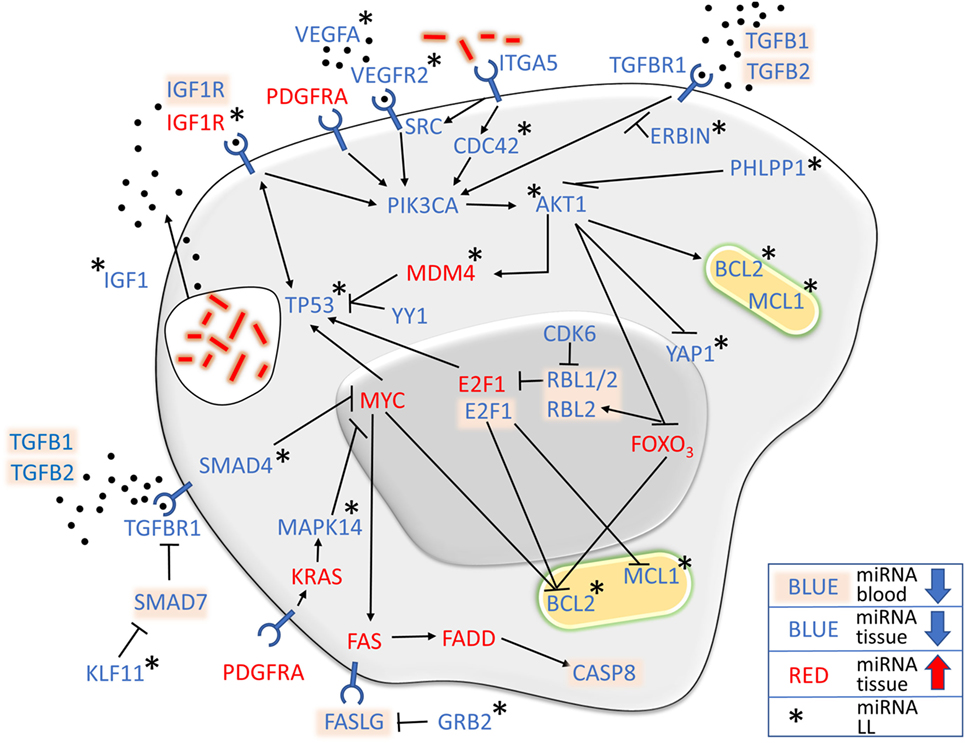
Figure 8. MicroRNA (miRNA) expression strictly controls apoptosis-related pathways. In addition to the antiapoptotic genes BCL2 and MCL1, which were found predominantly in lepromatous (LL) lesions, other genes had downregulated miRNAs in pathways that stimulate their expression, such as PIK3CA and AKT1, while their suppressors, such as MYC and FOXO3, had upregulated miRNAs, suggesting an antiapoptotic profile of leprosy patient, especially LL.
AKT1 and PIK3CA kinases appeared to be central molecules involved in the apoptosis pathway related to M. leprae. In contrast, PIK3CA miRNAs were downregulated in all forms of leprosy in comparison to HS, and AKT1 miRNAs was more prominent in LL patient lesions (Figure 8). Interestingly, PHLPP1, a serine-threonine family member that has never described in leprosy and that controls AKT1 (69), was found to have downregulated miRNAs in LL lesions, indicating that PHLPP1 gene may have a role in apoptosis control in LP. Furthermore, AKT1 blocks the expression of the proapoptotic genes YAP1 and FOX03, while stimulate the antiapoptotic gene MDM4. YAP1 has a proapoptotic function after DNA damage of tumor cells (70), and FOXO3 blocks BCL2 (71). In addition to being inhibited by AKT1, FOXO3 gene was found to have upregulated miRNAs in all LP cases (Figure 8). Upon FOXO3 blockade, RBL1/2 are transcribed and indirectly block TP53 expression by blocking E2F1 (72). MDM4, P53 regulator is also stimulated by AKT1. miRNAs found in our miRNome regulate FOXO3 and E2F1 in all forms of leprosy, while miRNAs for YAP1, MDM4, and TP53 were found exclusively in LL. Taken together, these findings show that the influence of LP miRNAs of those pathways in leprosy may result in an antiapoptotic profile.
Considering the miRNA profile controlling cell receptors, in addition to FAS gene, we found five other genes related to apoptosis control by miRNA in M. leprae infection: TGFBR1, involved in TGF-β signaling, a cytokine known to induce tolerance (73, 74) with a suppressive potential of Tregs in LL patients (75); ITGA5, an α-integrin linked to M. tuberculosis infection of macrophages (22); VEGFR2, known to participate in M. tuberculosis dissemination by triggering angiogenesis (76), while its ligand, VEGFA, has been demonstrated to be expressed in leprosy lesions (77); PDGFRA, which was shown to be upregulated in SC 27 days after M. leprae infection (78), and its ligand PDGF, a potential marker for erythema nodosum leprosum (79); and IGF1R, the receptor of IGF1, which inhibits macrophage and SC apoptosis upon M. leprae infection, in turn stimulating the production and secretion of IGF1 (15).
In contrast to downregulated miRNAs controlling PIK3CA, AKT1, BCL2, and MCL1, miRNAs controlling the expression of the proapoptotic genes MYC, E2F1, and FOXO3 were all found to be upregulated in lesional tissue. Additionally, miRNAs for FAS and FADD, members of the CASP8 proapoptotic pathway, were also found to be upregulated (Figure 8). Taken together, concerning miRNA regulation, our data suggest an antiapoptotic profile for leprosy in general, driven by BCL2, MCL1, and CASP8.
SCs, Demyelination, and EMT
Demyelination is a pathologic process that destroys the myelin sheath and involves multiple factors, including inflammatory responses or infections (80). LP demyelination is the ultimate consequence of leprosy neuritis, and LL patients exhibit myelinated and non-myelinated SC infected by M. leprae (81).
Upon invasion, M. leprae stimulates ERBB2 independently of ERBB3 (82), resulting in ERK1/2 activation, which leads to peripheral nerves demyelination (83). ERBB2 miRNAs were downregulated in LL patients (Figure 9), indicating a possible role for the SOX2 and JUN pathway in demyelination and EMT (78). However, SOX2 miRNAs were found to be upregulated in all LP, while ZEB1/2 miRNAs were downregulated in LL patients (Figure 9), indicating that ZEB1/2 may regulate SOX2 (84) expression to inhibit demyelination and EMT. Although ZEB1 expression increases after M. leprae infection or after TGF-β stimulation (85), while ZEB2 is essential after nerve injury by allowing remyelination and functional recovery (86), they may be regulated by ERBIN, which blocks the TGFBR1 pathway (87), and the downregulated miRNAs were observed only in LL patients (Figure 9).
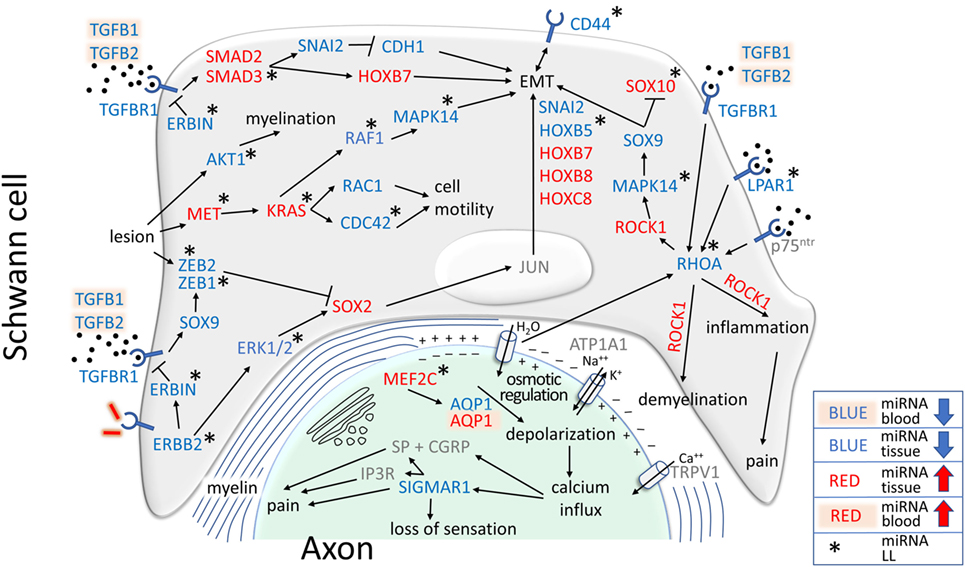
Figure 9. MicroRNAs (miRNAs) related to the epigenetic control of genes involved in demyelination, epithelial–mesenchymal transition (EMT), inflammation, pain, and loss of sensation were differentially expressed in leprosy patient (LP). Different pathways, including canonical and non-canonical pathways of TGF-β, may drive cell toward EMT, with a Schwann cell (SC) undifferentiated phenotype consisting of the absence of p75ntr, in gray, SOX10, with upregulated miRNAs in lepromatous (LL) and blockade by the SOX9 pathway, and the presence of CD44, which had downregulated miRNAs in LL. RHOA miRNAs were downregulated in LL, stimulating ROCK1 to drive EMT, inflammation and pain, which was controlled by upregulated miRNAs in all LP. AQP1, the only gene with upregulated miRNAs in blood in LP and downregulation in lesional skin, is one of the genes responsible for osmotic regulation. In lesions, downregulated miRNA for AQP1 indicated that AQP1 might not be expressed in the nerve, which was consistent with the upregulation of miRNAs for the MEF2C AQP1 transcription factor, possibly resulting in depolarization and calcium influx stimulating SIGMAR1, which also had downregulated miRNAs. The low expression level of SIGMAR1 may result in loss of sensation, but its overexpression may result in pain. Depolarization may stimulate RHOA to maintain a cycle of demyelination, inflammation, loss of sensation, and pain.
Schwann cell lesions induce the antiapoptotic molecule AKT1 and the mitogen MET, both of which are regulated by miRNAs in LL patients. AKT1 signaling, one of the most important pathways involved in myelination (88), may be activated in injured peripheral nerves (89). We found that miRNAs for AKT1 were downregulated in LL patients, indicating a possible role for AKT1 in LP myelination (Figure 9). In parallel, MET, an important inducer of neural injury (90) and the KRAS, RAF1, and MAPK14 genes involved in EMT pathways (91) were found to have miRNAs in LL patient lesions. In contrast, MAPK14 and RAF1 genes had downregulated miRNAs, and MET and KRAS genes had miRNAs upregulated, indicating a strict control of the first steps of the pathway. MET and KRAS also regulate cell motility through RAC1 and CDC42, which are important for actin rearrangement and cellular polarity (92).
Very few works have described the effects of HOX and SNAI genes on leprosy pathophysiology. It has been demonstrated that upon M. leprae infection, SC may switch off differentiation genes, such as SOX10 and p75ntr, while switching on EMT genes, especially the HOX family (78) and CD44, which are considered a marker for EMT in SC (78), with downregulated miRNAs in our LP skin lesion samples. Our study did not find miRNAs regulating p75ntr, which is compatible with the switching off demonstrated in the previous work; however, we detected upregulated miRNAs for SOX10 only in LL, downregulated miRNAs for SNAI2 and HOXB5, with the latter only in LL patient lesions, and upregulated miRNAs for HOXB7, HOXB8, and HOXC8 in all LP (Figure 9). Interestingly, the only genes that were detected in the earlier in vitro work and that for which we also detected miRNAs were SNAI2 and HOXB8. miRNAs for HOXB5, HOXB7, and HOXC8 were found in our work, but their expression was not detected previously.
HOXB5 gene is a marker for long-term hematopoietic stem cells (93) and it affects the differentiation of the vascular endothelium development from precursor cells (94). It is known that endothelial cells are important for the entry and maintenance of M. leprae in nerves (95) and that vasculitis may be observed in leprosy reactions, with endothelial proliferation in Lucio’s phenomena (1). HOXB7 is associated with EMT in breast cancer cells via the canonical TGF-β pathway (96), while HOXC8 mutant mice present motoneuron abnormalities with analog molecular defects compared with mutant mice for retinaldehyde dehydrogenase 2 synthesizing enzyme (97), which is responsible for retinoic acid synthesis, with atrophy of the distal projections of the ramus profundus of the radialis nerve that supply the extensor muscles of the forepaw, resulting in forepaw neuromuscular defects. Vitamin A levels in LP have been shown to be low in comparison to healthy controls, and much lower in LL patients (98).
SNAI2 and HOXB8 have been demonstrated to be upregulated in SC infected with M. leprae in vitro (78). SNAI2 is activated by the canonical TGF-β pathway (99), inhibiting CDH1 (E-cadherin) and resulting in cellular EMT (100). We found that upregulated miRNAs controlled SMAD2 and SMAD3 expression in LP. SMAD3 miRNAs were significantly upregulated only in LL patients, possibly participating in the control of SC-EMT (Figure 9). HOXB8 null mutants show altered sensory responses in mice, probably due to a smaller number of neurons and neural disorganization (101), indicating that HOXB8 expression levels may be related to sensory alterations in LP.
Loss of Sensation and Neuropathic Pain in Leprosy
ROCK1 is a Rho-associated protein kinase that is present in different signaling pathways in neurons (102), is known to regulate SC myelination (103), and may be activated by RHOA gene (104), for which we found downregulated miRNAs in LL lesions. ROCK1 gene stimulated by TGFBR1 induced EMT of SC via the MAPK14 pathway, which leads to SOX9 activation and SC EMT associated with the blockade of SOX10 (Figure 9), a recognized inducer of cell differentiation (105). We observed upregulated miRNAs for SOX10 gene in LL lesions, indicating that it may be expressed in LL patients. Myelin-associated inhibitors upon ligation with p75ntr activate RHOA, resulting in demyelination through ROCK1 genes (106), while ROCK1 stimulated by BDNF through p75ntr and RHOA may lead to inflammation and pain (107).
LPAR1 signaling is required to initiate neuropathic pain after nerve injury. Mice lacking LPAR1 gene do not present signs of neuropathic pain, and inhibition of RHOA and ROCK1 also prevent neuropathic pain (108). We found that miRNAs for LPAR1 were downregulated in LL patients in both blood and lesions, indicating that the receptor may be available for ligation in LP. RHOA miRNAs were also downregulated in LL patients, while ROCK1 was upregulated in all LP, indicating an attempt to control EMT, demyelination and pain.
The miRNA hsa-miR-1291 was the only differentially expressed miRNA in both skin tissue and blood samples. It was predicted to regulate the aquaporin-1 (AQP1) gene (109), which influences the hydration, elasticity and glycerol permeability of skin (110). In LL lesions, frequent overexpression of lipid metabolism genes (111) indicates that M. leprae uses host lipids for growth and virulence. Therefore, downregulation of hsa-miR-1291 in skin lesions could modulate AQP1 expression and increase glycerol permeability to promote fatty acid metabolism. Altered AQP1 expression may improve our comprehension of some well-known clinical issues related to leprosy, such as the dryness found in skin lesions. Moreover, MEF2C, a transcription factor for AQP1 (112), was found to have upregulated miRNAs in the skin lesions of LL patients, which could result in an absence of AQP1 transcription in LL patients, contributing to loss of sensation.
Aquaporins may be key molecules in leprosy pathophysiology. AQP1 knockout mice have impaired pain sensation (113), and human trigeminal neurons that mediate head nociception and innervate the oral mucosa express AQP1, indicating an involvement in sensory transduction (114). Peripheral nerve system expression of AQP1 has been seldom investigated, but it has been shown in the sciatic nerve (115) and in Ruffini mechanoreceptors (116). AQP4 is expressed in the olfactory epithelium (117) and in retinal glia (118), and it is the target of anti-AQP4 antibodies in autoimmune neuromyelitis optica (119). Loss of sensation is the hallmark of leprosy, but there is no definite mechanism explaining this phenomenon.
AQP1 participates in the mechanism of thermic and chemical pain, likely controlling neuronal ionic nociceptive homeostasis (113). Membrane depolarization activates ATP1A1, which regulates sodium potassium channels, and TRPV1, which is responsible for calcium influx into the cell. Calcium acts on calcitonin gene-related peptide (CGRP), which together with substance P (SP) results in pain (113). In addition to CGRP, calcium also stimulates SIGMAR1 (120), for which we detected downregulated miRNAs in LP lesional skin (Figure 9). SIGMAR1 acts as a chaperone for IP3R to maintain calcium signaling from the endoplasmic reticulum to mitochondria, and it has been implicated in pain (121). In contrast, SIGMAR1 agonists potentiate pain, antagonists potentiate analgesia (122), and neuropathic pain was strongly attenuated in SIGMAR1 knockout mice (123). Interestingly, AQP1 silencing in tumor cells abrogates the expression of RHOA and TGFB1/2 (124), indicating a possible mechanism to maintain EMT, demyelination, inflammation and pain through AQP1, SIGMAR1, RHOA, and ROCK1 in leprosy.
Taken together, our data suggest an important role for miRNA expression in leprosy immunophysiopathology, especially the regulation of different parameters of the immune system, apoptosis, SC demyelination, EMT, and neuropathic pain. The epigenetic control of the genes expressed in leprosy lesions and blood by miRNAs may provide new insights into the different facets of leprosy, from M. leprae–host cell interactions to new therapeutic targets.
Ethics Statement
This study was carried out in accordance with the recommendations of Brazilian National Ethics Committee (CONEP) guidelines, approved by Pará Federal University Ethics Committee number CAAE 26765414.0.0000.0018, with written informed consent from all subjects. All subjects gave written informed consent in accordance with the Declaration of Helsinki. The protocol was approved by the Pará Federal University Ethics Committee.
Author Contributions
CS, PP, JB, MS, SS, and AR designed research; CS, RB, AG, AM, and MF enrolled patients, performed, and registered clinical diagnosis; CS, PP, TS, AS, FM, AV, SS, and AS performed research; CS, PP, RB, AG, AM, TS, AS, FM, AV, LG, JS, SS, and AS analyzed the data; CS, PP, RB, AG, AM, JS, SS, and AS wrote the article; CS, PP, RB, AG, AM, TS, AS, FM, AV, LG, JB, MS, MF, JS, SS, and AS agree with manuscript results and conclusions.
Conflict of Interest Statement
The authors declare that the research was conducted in the absence of any commercial or financial relationships that could be construed as a potential conflict of interest.
Funding
We acknowledge the support of CNPq (308980/2015-8; 428964/2016-8, 304413/2015-1, and 305258/2013-3), CAPES PROAMAZONIA (3288/2013), CAPES Biocomputacional (3381/2013), PROPESP/UFPA, SESPA, FAPESPA (ICAAF 155/2014), UFPA, and MS/FAEPAFMRP-USP (749145/2010 and 767202/2011), MALTALEP-2012, J William Fulbright Scholar to Brazil award 2015–16, and The Heiser Fund of the New York Community Trust. The funders had no role on the manuscript data or concept.
Supplementary Material
The Supplementary Material for this article can be found online at http://www.frontiersin.org/articles/10.3389/fimmu.2018.00463/full#supplementary-material.
References
1. Scollard DM, Adams LB, Gillis TP, Krahenbuhl JL, Truman RW, Williams DL. The continuing challenges of leprosy. Clin Microbiol Rev (2006) 19:338–81. doi:10.1128/CMR.19.2.338-381.2006
2. Rotberg A. Fiftieth anniversary of the “N-factor/Hansen-anergic fringe” hypothesis for hanseniasis. Int J Lepr Other Mycobact Dis (1989) 57:864–6.
3. Bullock WE. Leprosy: a model of immunological perturbation in chronic infection. J Infect Dis (1978) 137:341–54. doi:10.1093/infdis/137.3.341
4. White C, Franco-Paredes C. Leprosy in the 21st century. Clin Microbiol Rev (2015) 28:80–94. doi:10.1128/CMR.00079-13
5. Bartel DP. MicroRNAs: genomics, biogenesis, mechanism, and function. Cell (2004) 116:281–97. doi:10.1016/S0092-8674(04)00045-5
6. Cezar-de-Mello PFT, Toledo-Pinto TG, Marques CS, Arnez LEA, Cardoso CC, Guerreiro LTA, et al. Pre-miR-146a (rs2910164 G>C) single nucleotide polymorphism is genetically and functionally associated with leprosy. PLoS Negl Trop Dis (2014) 8:e3099. doi:10.1371/journal.pntd.0003099
7. Jorge KTOS, Souza RP, Assis MTA, Araújo MG, Locati M, Jesus AMR, et al. Characterization of microRNA expression profiles and identification of potential biomarkers in leprosy. J Clin Microbiol (2017) 55:1516–25. doi:10.1128/JCM.02408-16
8. Soares CT, Trombone APF, Fachin LRV, Rosa PS, Ghidella CC, Ramalho RF, et al. Differential expression of microRNAs in leprosy skin lesions. Front Immunol (2017) 8:1035. doi:10.3389/fimmu.2017.01035
9. Liu PT, Wheelwright M, Teles R, Komisopoulou E, Edfeldt K, Ferguson B, et al. MicroRNA-21 targets the vitamin D-dependent antimicrobial pathway in leprosy. Nat Med (2012) 18:267–73. doi:10.1038/nm.2584
10. Kumar S, Naqvi RA, Khanna N, Rao DN. Disruption of HLA-DR raft, deregulations of Lck-ZAP-70-Cbl-b cross-talk and miR181a towards T cell hyporesponsiveness in leprosy. Mol Immunol (2011) 48:1178–90. doi:10.1016/j.molimm.2011.02.012
11. Sadhu S, Khaitan BK, Joshi B, Sengupta U, Nautiyal AK, Mitra DK. Reciprocity between regulatory T cells and Th17 cells: relevance to polarized immunity in leprosy. PLoS Negl Trop Dis (2016) 10:e0004338. doi:10.1371/journal.pntd.0004338
12. Kumar S, Naqvi RA, Ali R, Rani R, Khanna N, Rao DN. FoxP3 provides competitive fitness to CD4+CD25+ T cells in leprosy patients via transcriptional regulation. Eur J Immunol (2014) 44:431–9. doi:10.1002/eji.201343649
13. Mehta MD, Liu PT. MicroRNAs in mycobacterial disease: friend or foe? Front Genet (2014) 5:231. doi:10.3389/fgene.2014.00231
14. Singh PK, Singh AV, Chauhan DS. Current understanding on micro RNAs and its regulation in response to Mycobacterial infections. J Biomed Sci (2013) 20:14. doi:10.1186/1423-0127-20-14
15. Batista-Silva LR, Rodrigues LS, Vivarini Ade C, Costa Fda MR, Mattos KA, Costa MR, et al. Mycobacterium leprae-induced insulin-like growth factor I attenuates antimicrobial mechanisms, promoting bacterial survival in macrophages. Sci Rep (2016) 6:27632. doi:10.1038/srep27632
16. Kalluri R, Weinberg RA. The basics of epithelial-mesenchymal transition. J Clin Invest (2009) 119:1420–8. doi:10.1172/JCI39104.1420
17. Moreira FC, Dustan B, Hamoy IG, Ribeiro-Dos-Santos AM, Dos Santos AR. TargetCompare: a web interface to compare simultaneous miRNAs targets. Bioinformation (2014) 10:602–5. doi:10.6026/97320630010602
18. Vlachos IS, Kostoulas N, Vergoulis T, Georgakilas G, Reczko M, Maragkakis M, et al. DIANA miRPath v.2.0: investigating the combinatorial effect of microRNAs in pathways. Nucleic Acids Res (2012) 40:W498–504. doi:10.1093/nar/gks494
19. Agarwal V, Bell GW, Nam JW, Bartel DP. Predicting effective microRNA target sites in mammalian mRNAs. Elife (2015) 4:e05005. doi:10.7554/eLife.05005
20. Huang DW, Sherman BT, Lempicki RA. Systematic and integrative analysis of large gene lists using DAVID bioinformatics resources. Nat Protoc (2009) 4:44–57. doi:10.1038/nprot.2008.211
21. Liang H, Chen A. Interaction of Mycobacterium tuberculosis ESAT-6 protein with ADAM9 protein. Afr J Microbiol Res (2011) 5:919–23. doi:10.5897/AJMR10.856
22. Zhang J. Transcriptome analysis reveals novel entry mechanisms and a central role of SRC in host defense during high multiplicity mycobacterial infection. PLoS One (2013) 8:e65128. doi:10.1371/journal.pone.0065128
23. Puissegur M-P, Lay G, Gilleron M, Botella L, Nigou J, Marrakchi H, et al. Mycobacterial lipomannan induces granuloma macrophage fusion via a TLR2-dependent, ADAM9- and beta1 integrin-mediated pathway. J Immunol (2007) 178:3161–9. doi:10.4049/jimmunol.178.5.3161
24. Rodrigues LS, da Silva Maeda E, Moreira MEC, Tempone AJ, Lobato LS, Ribeiro-Resende VT, et al. Mycobacterium leprae induces insulin-like growth factor and promotes survival of Schwann cells upon serum withdrawal. Cell Microbiol (2010) 12:42–54. doi:10.1111/j.1462-5822.2009.01377.x
25. Mattos KA, Oliveira VCG, Berrêdo-Pinho M, Amaral JJ, Antunes LCM, Melo RCN, et al. Mycobacterium leprae intracellular survival relies on cholesterol accumulation in infected macrophages: a potential target for new drugs for leprosy treatment. Cell Microbiol (2014) 16:797–815. doi:10.1111/cmi.12279
26. Alves L, De Mendonça Lima L, Da Silva Maeda E, Carvalho L, Holy J, Sarno EN, et al. Mycobacterium leprae infection of human Schwann cells depends on selective host kinases and pathogen-modulated endocytic pathways. FEMS Microbiol Lett (2004) 238:429–37. doi:10.1016/j.femsle.2004.08.007
27. Rodrigues LS, Hacker MA, Illarramendi X, Pinheiro MF, Nery JA, Sarno EN, et al. Circulating levels of insulin-like growth factor-I (IGF-I) correlate with disease status in leprosy. BMC Infect Dis (2011) 11:339. doi:10.1186/1471-2334-11-339
28. Schulze U, Vollenbröker B, Braun DA, Van Le T, Granado D, Kremerskothen J, et al. The Vac14-interaction network is linked to regulators of the endolysosomal and autophagic pathway. Mol Cell Proteomics (2014) 13:1397–411. doi:10.1074/mcp.M113.034108
29. Li C-W, Lee Y-L, Chen B-S. Genetic-and-epigenetic interspecies networks for cross-talk mechanisms in human macrophages and dendritic cells during MTB infection. Front Cell Infect Microbiol (2016) 6:124. doi:10.3389/fcimb.2016.00124
30. Polycarpou A, Holland MJ, Karageorgiou I, Eddaoudi A, Walker SL, Willcocks S, et al. Mycobacterium leprae activates toll-like receptor-4 signaling and expression on macrophages depending on previous Bacillus Calmette-Guerin vaccination. Front Cell Infect Microbiol (2016) 6:72. doi:10.3389/fcimb.2016.00072
31. Teles RMB, Graeber TG, Krutzik SR, Montoya D, Schenk M, Lee DJ, et al. Type I interferon suppresses type II interferon-triggered human anti-mycobacterial responses. Science (2013) 339:1448–53. doi:10.1126/science.1233665
32. Akhurst RJ, Hata A. Targeting the TGFβ signalling pathway in disease. Nat Rev Drug Discov (2012) 11:886–886. doi:10.1038/nrd3878
33. Goulart IM, Mineo JR, Foss NT. Production of transforming growth factor-beta 1 (TGF-beta1) by blood monocytes from patients with different clinical forms of leprosy. Clin Exp Immunol (2000) 122:330–4. doi:10.1046/j.1365-2249.2000.01376.x
34. Saini C, Ramesh V, Nath I. Increase in TGF-b secreting CD4+CD25+ FOXP3+ T regulatory cells in anergic lepromatous leprosy patients. PLoS Negl Trop Dis (2014) 8:23. doi:10.1371/journal.pntd.0002639
35. Kiszewski CA, Becerril E, Baquera J, Aguilar LD, Hernández-Pando R. Expression of transforming growth factor-β isoforms and their receptors in lepromatous and tuberculoid leprosy. Scand J Immunol (2003) 57:279–85. doi:10.1046/j.1365-3083.2003.01210.x
36. Amsen D, Helbig C, Backer RA. Notch in T cell differentiation: all things considered. Trends Immunol (2015) 36:802–14. doi:10.1016/j.it.2015.10.007
37. Shang Y, Smith S, Hu X. Role of Notch signaling in regulating innate immunity and inflammation in health and disease. Protein Cell (2016) 7:159–74. doi:10.1007/s13238-016-0250-0
38. Kibbie J, Teles RMB, Wang Z, Hong P, Montoya D, Krutzik S, et al. Jagged1 instructs macrophage differentiation in leprosy. PLoS Pathog (2016) 12:e1005808. doi:10.1371/journal.ppat.1005808
39. Coutaz M, Hurrell BP, Auderset F, Wang H, Siegert S, Eberl G, et al. Notch regulates Th17 differentiation and controls trafficking of IL-17 and metabolic regulators within Th17 cells in a context-dependent manner. Sci Rep (2016) 6:39117. doi:10.1038/srep39117
40. Auderset F, Schuster S, Coutaz M, Koch U, Desgranges F, Merck E, et al. Redundant Notch1 and Notch2 signaling is necessary for IFNγ secretion by T helper 1 cells during infection with Leishmania major. PLoS Pathog (2012) 8:e1002560. doi:10.1371/journal.ppat.1002560
41. White JH. Vitamin D signaling, infectious diseases, and regulation of innate immunity. Infect Immun (2008) 76:3837–43. doi:10.1128/IAI.00353-08
42. Kumar M, Sahu SK, Kumar R, Subuddhi A, Maji RK, Jana K, et al. MicroRNA let-7 modulates the immune response to Mycobacterium tuberculosis infection via control of A20, an inhibitor of the NF-κB pathway. Cell Host Microbe (2015) 17:345–56. doi:10.1016/j.chom.2015.01.007
43. de Sousa JR, de Sousa RPM, de Souza Aarão TL, Dias LB, Carneiro FRO, Fuzii HT, et al. In situ expression of M2 macrophage subpopulation in leprosy skin lesions. Acta Trop (2016) 157:108–14. doi:10.1016/j.actatropica.2016.01.008
44. Dienz O, Rincon M. The effects of IL-6 on CD4 T cell responses. Clin Immunol (2009) 130:27–33. doi:10.1016/j.clim.2008.08.018
45. Yang D, Shui T, Miranda JW, Gilson DJ, Song Z, Chen J, et al. Mycobacterium leprae-infected macrophages preferentially primed regulatory T cell responses and was associated with lepromatous leprosy. PLoS Negl Trop Dis (2016) 10:e0004335. doi:10.1371/journal.pntd.0004335
46. Czimmerer Z, Varga T, Kiss M, Vázquez CO, Doan-Xuan QM, Rückerl D, et al. The IL-4/STAT6 signaling axis establishes a conserved microRNA signature in human and mouse macrophages regulating cell survival via miR-342-3p. Genome Med (2016) 8:63. doi:10.1186/s13073-016-0315-y
47. Anderson K, Morimoto C, Paul S, Chauhan D, Williams D, Cochran M, et al. Interleukin-11 promotes accessory cell-dependent B-cell differentiation in humans. Blood (1992) 80:2797–804.
48. Wang D, John SA, Clements JL, Percy DH, Barton KP, Garrett-Sinha LA. Ets-1 deficiency leads to altered B cell differentiation, hyperresponsiveness to TLR9 and autoimmune disease. Int Immunol (2005) 17:1179–91. doi:10.1093/intimm/dxh295
49. Burbage M, Keppler SJ, Gasparrini F, Martínez-Martín N, Gaya M, Feest C, et al. Cdc42 is a key regulator of B cell differentiation and is required for antiviral humoral immunity. J Exp Med (2015) 212:53–72. doi:10.1084/jem.20141143
50. Briere F, Bridon JM, Servet C, Rousset F, Zurawski G, Banchereau J. IL-10 and IL-13 as B cell growth and differentiation factors. Nouv Rev Fr Hematol (1993) 35:233–5.
51. Yamauchi PS, Bleharski JR, Uyemura K, Kim J, Sieling PA, Miller A, et al. A role for CD40-CD40 ligand interactions in the generation of type 1 cytokine responses in human leprosy. J Immunol (2000) 165:1506–12. doi:10.4049/jimmunol.165.3.1506
52. Moncada B, Torres-Alvarez MB, Gonzalez-Amaro R, Fuentes-Ahumada C, Baranda L, Delgado SP, et al. Lack of expression of intercellular adhesion molecule ICAM-1 in lepromatous leprosy patients. Int J Lepr Other Mycobact Dis (1993) 61:581–5.
53. Murphy TL, Cleveland MG, Kulesza P, Magram J, Murphy KM. Regulation of interleukin 12 p40 expression through an NF-kappa B half-site. Mol Cell Biol (1995) 15:5258–67. doi:10.1016/1357-4310(96)88750-8
54. Schindler H, Lutz MB, Rollinghoff M, Bogdan C. The production of IFN-by IL-12/IL-18-activated macrophages requires STAT4 signaling and is inhibited by IL-4. J Immunol (2001) 166:3075–82. doi:10.4049/jimmunol.166.5.3075
55. D’Andrea A, Aste-Amezaga M, Valiante NM, Ma X, Kubin M, Trinchieri G. Interleukin 10 (IL-10) inhibits human lymphocyte interferon gamma-production by suppressing natural killer cell stimulatory factor/IL-12 synthesis in accessory cells. J Exp Med (1993) 178:1041–8. doi:10.1084/jem.178.3.1041
56. Lin JT, Martin SL, Xia L, Gorham JD. TGF-beta1 uses distinct mechanisms to inhibit IFN-gamma expression in CD4+ T cells at priming and at recall: differential involvement of Stat4 and T-bet. J Immunol (2005) 174:5950–8. doi:10.4049/jimmunol.174.10.5950
57. Giangreco A, Hoste E, Takai Y, Rosewell I, Watt FM. Epidermal Cadm1 expression promotes autoimmune alopecia via enhanced T cell adhesion and cytotoxicity. J Immunol (2012) 188:1514–22. doi:10.4049/jimmunol.1003342
58. Takeuchi A, Badr Mel S, Miyauchi K, Ishihara C, Onishi R, Guo Z, et al. CRTAM determines the CD4+ cytotoxic T lymphocyte lineage. J Exp Med (2016) 213:123–38. doi:10.1084/jem.20150519
59. Liao W, Lin J-X, Wang L, Li P, Leonard WJ. Modulation of cytokine receptors by IL-2 broadly regulates differentiation into helper T cell lineages. Nat Immunol (2011) 12:551–9. doi:10.1038/ni.2030
60. Kimura A, Kishimoto T. IL-6: regulator of Treg/Th17 balance. Eur J Immunol (2010) 40:1830–5. doi:10.1002/eji.201040391
61. Pelletier M, Maggi L, Micheletti A, Lazzeri E, Tamassia N, Costantini C, et al. Evidence for a cross-talk between human neutrophils and Th17 cells. Blood (2010) 115:335–43. doi:10.1182/blood-2009-04-216085
62. Oliveira RB, Moraes MO, Oliveira EB, Sarno EN, Nery JA, Sampaio EP. Neutrophils isolated from leprosy patients release TNF-alpha and exhibit accelerated apoptosis in vitro. J Leukoc Biol (1999) 65:364–71.
63. Hasan Z, Ashraf M, Tayyebi A, Hussain R. M. leprae inhibits apoptosis in THP-1 cells by downregulation of Bad and Bak and upregulation of Mcl-1 gene expression. BMC Microbiol (2006) 6:78. doi:10.1186/1471-2180-6-78
64. Hernandez MO, Neves I, Sales JS, Carvalho DS, Sarno EN, Sampaio EP. Induction of apoptosis in monocytes by Mycobacterium leprae in vitro: a possible role for tumour necrosis factor-alpha. Immunology (2003) 109:156–64. doi:10.1046/J.1365-2567.2003.01630.X
65. Ajith C, Gupta S, Radotra BD, Arora SK, Kumar B, Dogra S, et al. Study of apoptosis in skin lesions of leprosy in relation to treatment and lepra reactions. Int J Lepr Other Mycobact Dis (2005) 73:269–76.
66. Brito de Souza VN, Nogueira MES, Belone Ade FF, Soares CT. Analysis of apoptosis and Bcl-2 expression in polar forms of leprosy. FEMS Immunol Med Microbiol (2010) 60:270–4. doi:10.1111/j.1574-695X.2010.00746.x
67. Chattree V, Khanna N, Bisht V, Rao DN. Inhibition of apoptosis, activation of NKT cell and upregulation of CD40 and CD40L mediated by M. leprae antigen(s) combined with murabutide and Trat peptide in leprosy patients. Mol Cell Biochem (2008) 309:87–97. doi:10.1007/s11010-007-9646-8
68. Thornhill PB, Cohn JB, Stanford WL, Desbarats J. The adaptor protein Grb2 regulates cell surface Fas ligand in Schwann cells. Biochem Biophys Res Commun (2008) 376:341–6. doi:10.1016/j.bbrc.2008.08.164
69. Gao T, Brognard J, Newton AC. The phosphatase PHLPP controls the cellular levels of protein kinase C. J Biol Chem (2008) 283:6300–11. doi:10.1074/jbc.M707319200
70. Strano S, Fausti F, Di Agostino S, Sudol M, Blandino G. PML surfs into HIPPO tumor suppressor pathway. Front Oncol (2013) 3:36. doi:10.3389/fonc.2013.00036
71. Fu Z, Tindall DJ. FOXOs, cancer and regulation of apoptosis. Oncogene (2008) 27:2312–9. doi:10.1038/onc.2008.24
72. Ginsberg D. E2F1 pathways to apoptosis. FEBS Lett (2002) 529:122–5. doi:10.1016/S0014-5793(02)03270-2
73. Li MO, Sanjabi S, Flavell RA. Transforming growth factor-β controls development, homeostasis, and tolerance of T cells by regulatory T cell-dependent and -independent mechanisms. Immunity (2006) 25:455–71. doi:10.1016/j.immuni.2006.07.011
74. Johnston CJC, Smyth DJ, Dresser DW, Maizels RM. TGF-b in tolerance, development and regulation of immunity. Cell Immunol (2015) 299:14–22. doi:10.1016/j.cellimm.2015.10.006
75. Kumar S, Naqvi RA, Ali R, Rani R, Khanna N, Rao DN. CD4+CD25+ T regs with acetylated FoxP3 are associated with immune suppression in human leprosy. Mol Immunol (2013) 56:513–20. doi:10.1016/j.molimm.2013.04.015
76. Polena H, Boudou F, Tilleul S, Dubois-Colas N, Lecointe C, Rakotosamimanana N, et al. Mycobacterium tuberculosis exploits the formation of new blood vessels for its dissemination. Sci Rep (2016) 6:33162. doi:10.1038/srep33162
77. Nogueira MRS, Latini ACP, Nogueira MES. The involvement of endothelial mediators in leprosy. Mem Inst Oswaldo Cruz (2016) 111:635–41. doi:10.1590/0074-02760160122
78. Masaki T, Qu J, Cholewa-Waclaw J, Burr K, Raaum R, Rambukkana A. Reprogramming adult Schwann cells to stem cell-like cells by leprosy bacilli promotes dissemination of infection. Cell (2013) 152:51–67. doi:10.1016/j.cell.2012.12.014
79. Stefani MM, Guerra JG, Sousa ALM, Costa MB, Oliveira MLW, Martelli CT, et al. Potential plasma markers of type 1 and type 2 leprosy reactions: a preliminary report. BMC Infect Dis (2009) 9:75. doi:10.1186/1471-2334-9-75
80. Rambukkana A, Zanazzi G, Tapinos N, Salzer JL. Contact-dependent demyelination by Mycobacterium leprae in the absence of immune cells. Science (2002) 296:927–31. doi:10.1126/science.1067631
82. Araujo SRF, Jamieson SE, Dupnik KM, Monteiro GR, Nobre ML, Dias MS, et al. Examining ERBB2 as a candidate gene for susceptibility to leprosy (Hansen’s disease) in Brazil. Mem Inst Oswaldo Cruz (2014) 109:182–8. doi:10.1590/0074-0276130344
83. Tapinos N, Ohnishi M, Rambukkana A. ErbB2 receptor tyrosine kinase signaling mediates early demyelination induced by leprosy bacilli. Nat Med (2006) 12:961–6. doi:10.1038/nm1433
84. Wu LM, Wang J, Conidi A, Zhao C, Wang H, Ford Z, et al. Zeb2 recruits HDAC-NuRD to inhibit Notch and controls Schwann cell differentiation and remyelination. Nat Neurosci (2016) 19:1060–72. doi:10.1038/nn.4322
85. Petito RB, Amadeu TP, Pascarelli BMO, Jardim MR, Vital RT, Antunes SL, et al. Transforming growth factor-β1 may be a key mediator of the fibrogenic properties of neural cells in leprosy. J Neuropathol Exp Neurol (2013) 72:351–66. doi:10.1097/NEN.0b013e31828bfc60
86. Brinkmann BG, Quintes S. Zeb2: inhibiting the inhibitors in Schwann cells. Neurogenesis (Austin) (2017) 4:e1271495. doi:10.1080/23262133.2016.1271495
87. Dai F, Chang C, Lin X, Dai P, Mei L, Feng X-H. Erbin inhibits transforming growth factor signaling through a novel Smad-interacting domain. Mol Cell Biol (2007) 27:6183–94. doi:10.1128/MCB.00132-07
88. Norrmén C, Suter U. Akt/mTOR signalling in myelination. Biochem Soc Trans (2013) 41:944–50. doi:10.1042/BST20130046
89. Yamazaki T, Sabit H, Oya T, Ishii Y, Hamashima T, Tokunaga A, et al. Activation of MAP kinases, Akt and PDGF receptors in injured peripheral nerves. J Peripher Nerv Syst (2009) 14:165–76. doi:10.1111/j.1529-8027.2009.00228.x
90. Hashimoto N, Yamanaka H, Fukuoka T, Dai Y, Obata K, Mashimo T, et al. Expression of HGF and cMet in the peripheral nervous system of adult rats following sciatic nerve injury. Neuroreport (2001) 12:1403–7. doi:10.1097/00001756-200105250-00022
91. Yang DP, Kim J, Syed N, Tung Y-J, Bhaskaran A, Mindos T, et al. p38 MAPK activation promotes denervated Schwann cell phenotype and functions as a negative regulator of Schwann cell differentiation and myelination. J Neurosci (2012) 32:7158–68. doi:10.1523/JNEUROSCI.5812-11.2012
92. Benninger Y, Thurnherr T, Pereira JA, Krause S, Wu X, Chrostek-Grashoff A, et al. Essential and distinct roles for cdc42 and rac1 in the regulation of Schwann cell biology during peripheral nervous system development. J Cell Biol (2007) 177:1051–61. doi:10.1083/jcb.200610108
93. Chen JY, Miyanishi M, Wang SK, Yamazaki S, Sinha R, Kao KS, et al. Hoxb5 marks long-term haematopoietic stem cells and reveals a homogenous perivascular niche. Nature (2016) 530:223–7. doi:10.1038/nature16943
94. Wu Y, Moser M, Bautch VL, Patterson C. HoxB5 is an upstream transcriptional switch for differentiation of the vascular endothelium from precursor cells. Mol Cell Biol (2003) 23:5680–91. doi:10.1128/MCB.23.16.5680-5691.2003
96. Liu S, Jin K, Hui Y, Fu J, Jie C, Feng S, et al. HOXB7 promotes malignant progression by activating the TGFβ signaling pathway. Cancer Res (2015) 75:709–19. doi:10.1158/0008-5472.CAN-14-3100
97. Vermot J, Schuhbaur B, Le Mouellic H, McCaffery P, Garnier J-M, Hentsch D, et al. Retinaldehyde dehydrogenase 2 and Hoxc8 are required in the murine brachial spinal cord for the specification of Lim1+ motoneurons and the correct distribution of Islet1+ motoneurons. Development (2005) 132:1611–21. doi:10.1242/dev.01718
98. Sher R, Shulman G, Baily P, Politzer WM. Serum trace elements and vitamin A in leprosy subtypes. Am J Clin Nutr (1981) 34:1918–24. doi:10.1093/ajcn/34.9.1918
99. Yi EY, Park SY, Jung SY, Jang WJ, Kim YJ. Mitochondrial dysfunction induces EMT through the TGF-β/Smad/Snail signaling pathway in Hep3B hepatocellular carcinoma cells. Int J Oncol (2015) 47:1845–53. doi:10.3892/ijo.2015.3154
100. Massagué J. TGFβ signalling in context. Nat Rev Mol Cell Biol (2012) 13:616–30. doi:10.1038/nrm3434
101. Holstege JC, de Graaff W, Hossaini M, Cano SC, Jaarsma D, van den Akker E, et al. Loss of Hoxb8 alters spinal dorsal laminae and sensory responses in mice. Proc Natl Acad Sci U S A (2008) 105:6338–43. doi:10.1073/pnas.0802176105
102. Chong C-M, Ai N, Lee S. ROCK in CNS: different roles of isoforms and therapeutic target for neurodegenerative disorders. Curr Drug Targets (2017) 18:455–62. doi:10.2174/1389450117666160401123825
103. Melendez-Vasquez CV, Einheber S, Salzer JL. Rho kinase regulates Schwann cell myelination and formation of associated axonal domains. J Neurosci (2004) 24:3953–63. doi:10.1523/JNEUROSCI.4920-03.2004
104. Liu Y. Epithelial to mesenchymal transition in renal fibrogenesis: pathologic significance, molecular mechanism, and therapeutic intervention. J Am Soc Nephrol (2004) 15:1–12. doi:10.1097/01.ASN.0000106015.29070.E7
105. Ghislain J, Charnay P. Control of myelination in Schwann cells: a Krox20 cis-regulatory element integrates Oct6, Brn2 and Sox10 activities. EMBO Rep (2006) 7:52–8. doi:10.1038/sj.embor.7400573
106. Amano M, Nakayama M, Kaibuchi K. Rho-kinase/ROCK: a key regulator of the cytoskeleton and cell polarity. Cytoskeleton (Hoboken) (2010) 67:545–54. doi:10.1002/cm.20472
107. Wu X, Xu XM. RhoA/Rho kinase in spinal cord injury. Neural Regen Res (2016) 11:23–7. doi:10.4103/1673-5374.169601
108. Inoue M, Rashid MH, Fujita R, Contos JJA, Chun J, Ueda H. Initiation of neuropathic pain requires lysophosphatidic acid receptor signaling. Nat Med (2004) 10:712–8. doi:10.1038/nm1060
109. Fábrega E, Berja A, García-Unzueta MT, Guerra-Ruiz A, Cobo M, López M, et al. Influence of aquaporin-1 gene polymorphism on water retention in liver cirrhosis. Scand J Gastroenterol (2011) 46:1267–74. doi:10.3109/00365521.2011.603161
110. Verkman AS. More than just water channels: unexpected cellular roles of aquaporins. J Cell Sci (2005) 118:3225–32. doi:10.1242/jcs.02519
111. Cruz D, Watson AD, Miller CS, Montoya D, Ochoa MT, Sieling PA, et al. Host-derived oxidized phospholipids and HDL regulate innate immunity in human leprosy. J Clin Invest (2008) 118:2917–28. doi:10.1172/JCI34189
112. Jiang Y, Liu H, Liu WJ, Tong HB, Chen CJ, Lin FG, et al. Endothelial aquaporin-1 (AQP1) expression is regulated by transcription factor Mef2c. Mol Cells (2016) 39:292–8. doi:10.14348/molcells.2016.2223
113. Oshio K, Watanabe H, Yan D, Verkman AS, Manley GT. Impaired pain sensation in mice lacking aquaporin-1 water channels. Biochem Biophys Res Commun (2006) 341:1022–8. doi:10.1016/j.bbrc.2006.01.062
114. Gao J, Tan M, Gu M, Marshall C, Ding J, Hu G, et al. Cellular localization of aquaporin-1 in the human and mouse trigeminal systems. PLoS One (2012) 7:e46379. doi:10.1371/journal.pone.0046379
115. Gao H, He C, Fang X, Hou X, Feng X, Yang H, et al. Localization of aquaporin-1 water channel in glial cells of the human peripheral nervous system. Glia (2006) 53:783–7. doi:10.1002/glia.20336
116. Nandasena BGTL, Suzuki A, Aita M, Kawano Y, Nozawa-Inoue K, Maeda T. Immunolocalization of aquaporin-1 in the mechanoreceptive Ruffini endings in the periodontal ligament. Brain Res (2007) 1157:32–40. doi:10.1016/j.brainres.2007.04.033
117. Lu DC, Zhang H, Zador Z, Verkman AS. Impaired olfaction in mice lacking aquaporin-4 water channels. FASEB J (2008) 22:3216–23. doi:10.1096/fj.07-104836
118. Nagelhus EA, Veruki ML, Torp R, Haug FM, Laake JH, Nielsen S, et al. Aquaporin-4 water channel protein in the rat retina and optic nerve: polarized expression in Müller cells and fibrous astrocytes. J Neurosci (1998) 18:2506–19.
119. Lennon VA, Kryzer TJ, Pittock SJ, Verkman AS, Hinson SR. IgG marker of optic-spinal multiple sclerosis binds to the aquaporin-4 water channel. J Exp Med (2005) 202:473–7. doi:10.1084/jem.20050304
120. Bangaru ML, Weihrauch D, Tang Q-B, Zoga V, Hogan Q, Wu H. Sigma-1 receptor expression in sensory neurons and the effect of painful peripheral nerve injury. Mol Pain (2013) 9:47. doi:10.1186/1744-8069-9-47
121. Tsai SY, Hayashi T, Mori T, Su TP. Sigma-1 receptor chaperones and diseases. Cent Nerv Syst Agents Med Chem (2009) 9:184–9. doi:10.1016/j.biotechadv.2011.08.021.Secreted
122. Chien CC, Pasternak GW. Selective antagonism of opioid analgesia by a sigma system. J Pharmacol Exp Ther (1994) 271:1583–90.
123. de la Puente B, Nadal X, Portillo-Salido E, Sánchez-Arroyos R, Ovalle S, Palacios G, et al. Sigma-1 receptors regulate activity-induced spinal sensitization and neuropathic pain after peripheral nerve injury. Pain (2009) 145:294–303. doi:10.1016/j.pain.2009.05.013
Keywords: leprosy, immunology, Schwann cells, apoptosis, neuropathic pain, microRNA, miRNome, epigenetics
Citation: Salgado CG, Pinto P, Bouth RC, Gobbo AR, Messias ACC, Sandoval TV, dos Santos AMR, Moreira FC, Vidal AF, Goulart LR, Barreto JG, da Silva MB, Frade MAC, Spencer JS, Santos S and Ribeiro-dos-Santos  (2018) miRNome Expression Analysis Reveals New Players on Leprosy Immune Physiopathology. Front. Immunol. 9:463. doi: 10.3389/fimmu.2018.00463
Received: 28 November 2017; Accepted: 21 February 2018;
Published: 09 March 2018
Edited by:
Vânia Nieto Brito De Souza, Instituto Lauro de Souza Lima, BrazilReviewed by:
Rosane M. B. Teles, University of California, Los Angeles, United StatesMaryam Dadar, Razi Vaccine and Serum Research Institute, Iran
Copyright: © 2018 Salgado, Pinto, Bouth, Gobbo, Messias, Sandoval, dos Santos, Moreira, Vidal, Goulart, Barreto, da Silva, Frade, Spencer, Santos and Ribeiro-dos-Santos. This is an open-access article distributed under the terms of the Creative Commons Attribution License (CC BY). The use, distribution or reproduction in other forums is permitted, provided the original author(s) and the copyright owner are credited and that the original publication in this journal is cited, in accordance with accepted academic practice. No use, distribution or reproduction is permitted which does not comply with these terms.
*Correspondence: Claudio Guedes Salgado, csalgado@ufpa.br;
Ândrea Ribeiro-dos-Santos, akelyufpa@gmail.com
†These authors have contributed equally to this work.