 Huan Xia1
 Wei Jiang2,3
 Xin Zhang1
 Ling Qin4
 Bin Su1
 Zhen Li1
 Jianping Sun4
 Yonghong Zhang4
 Tong Zhang1
 Xiaofan Lu1*
 Hao Wu1*
- 1Beijing Key Laboratory for HIV/AIDS Research, Center for Infectious Diseases, Beijing You’an Hospital, Capital Medical University, Beijing, China
- 2Department of Microbiology and Immunology, Medical University of South Carolina, Charleston, SC, United States
- 3Division of Infectious Diseases, Department of Medicine, Medical University of South Carolina, Charleston, SC, United States
- 4Biomarkers of Infection Related Diseases, Beijing Key Laboratory, Beijing You’an Hospital, Capital Medical University, Beijing, China
Persistent immune activation is a striking consequence of HIV-1 infection and a driving force of CD4+ T cell depletion and AIDS events during chronic infection. High level of T cell immune activation associates with antiretroviral therapy (ART)-treated clinical outcomes in chronically HIV-1-infected patients. However, the role of T cell activation during acute infection stage in subsequent CD4+ T cell decline in the absence of ART treatment is unknown. In this study, we enrolled 26 acutely HIV-1-infected patients in the absence of ART treatment from a prospective acute HIV-1 infection cohort in Beijing (PRIMO). A comprehensive analysis of CD4+ and CD8+ T cell immune activation during acute infection stage and the clinical outcomes was studied. We found that patients with higher level of CD4+ T cell activation (%CD38+HLA-DR+CD4+ T cells) exhibited more effective function (%IL-2 production and %ki67 expression) in CD4+ T cells compared to those from patients without increased T cell activation at the acute phase. Direct correlations were observed between CD4+ T cell activation and the percentages of IL-2-producing or ki67-expressing CD4+ T cells in patients at the acute phase of infection. Importantly, the increased levels of CD4+ T cell immune activation, IL-2 production, and cycling expression during acute infection were associated with less decline of CD4+ T cell after 2 years of infection. However, immune exhaustion molecules in acute infection, including CD160, T cell immunoglobulin and ITIM domain, programmed cell death protein 1, and T cell immunoglobulin and mucin 3, were not associated with the CD4+ T cell depletion. These significant associations of CD4+ T cell activation were not demonstrable for CD8+ T cell activation at the acute phase. Taken together, our observations provide new insight into the possible role of T cell activation in preventing CD4+ T cell depletion during acute HIV-1 infection.
Introduction
Chronic immune activation and inflammation have been known to be a hallmark of HIV-1 infection. They act as independent predictors of disease progression and are also considered as main driving force of non-AIDS morbidity and mortality (1–3). Inflammation refers to cytokines released by macrophages upon antigen stimulation, whereas immune activation describes cellular activation in response to stimuli, reflected by increased expression of activation markers on T cells and antigen presenting cells (e.g., monocytes) (4). Double expression of CD38 and HLA-DR on T cells often represents the level of T cell immune activation (5). Several factors contribute to immune activation in HIV-1-infected individuals, such as HIV-1 replication, microbial products leaking from damaged gut mucosa, imbalance of Th17/Treg, and opportunistic infections with other virus or bacteria (6).
To date, most studies on T cell immune activation in HIV-1 infection focus on the chronic infection stage. Growing evidence suggests that persistent T cell immune activation during chronic stage contributes to the progressive CD4+ T cell depletion and immune perturbations (7–9). Elevated residual T cell immune activation is still observed despite successful antiretroviral therapy (ART) (10, 11). High activated CD8+ T cells in HIV-1 chronic infection stage is a strong predictor for shorter survival, faster decline of CD4+ T cells, and poor CD4+ T cell recovery under ART (1, 12). Notably, T cell immune activation has occurred during HIV-1 acute infection phase, and its set point is also established in this phase (2). The level of CD4+ and CD8+ T cell immune activation stabilizes for at least 48 weeks after reaching an immune activation set point (2). The set point of T cell immune activation predicts subsequent disease progression if ART is not initiated (2). The VISCONTI study (Viro-Immunological Sustained CONtrol after Treatment Interruption) reported that CD4+ and CD8+ T cell activation were very weak in posttreatment HIV-1 controllers during the period of viral control without therapy (13). However, unlike the consensus on the deleterious effects of sustained immune activation in chronically infected period, beneficial of T cell immune activation in acute infection were also observed (14, 15). Paul Volberding et al. illustrated that higher percentages of activated CD4+ T cells in early HIV-1 infection were associated with greater likelihood of virologic suppression upon treatment interruption (14). The study by Ndhlovu et al. reported that HIV-1-specific CD8+ T cell activation in acute phase were beneficial in controlling viremia (15). These evidences indicate a protective role of activated T cells in controlling viral replication and disease progression during acute HIV-1 infection. However, the role T cell activation in the acute phase in CD4+ T cell depletion in the absence of ART treatment is unknown.
Due to the controversial opinions on the role of T cell immune activation in HIV-1 acute infection, here we analyzed the association between the level of T cell immune activation in different disease stages and clinical outcomes by using samples from our HIV-1 acute infection cohort (PRIMO). We aimed to further study the different role of T cell immune activation in HIV-1 acute and chronic infection stages and the possible mechanisms involved.
Materials and Methods
Study Participants
Study subjects in this study were enrolled from Beijing PRIMO Cohort, high-risk men who have sex with men (MSM) cohort for screening HIV-1 acutely infected individuals at Beijing You’an Hospital (16). MSM who have high-risk behaviors were enrolled in this cohort, and were followed up for every 2 months to detect HIV-1 antibody. Acute infection was defined as a positive result of HIV-1 RNA but a negative or indeterminate result of HIV-1 antibody. Once acute infection was identified, patients were followed up at 1, 2, 4, 8, and 12 weeks, and then every 3 months for CD4+ T cell count and viral load measurement and syphilis status monitoring. Chronic infection was defined as 6 months after diagnosis of acute infection. Blood samples were collected at each time point, peripheral blood mononuclear cells (PBMCs) and plasma were isolated and cryopreserved.
All HIV-1-infected participants provided written informed consents according to the declaration of Helsinki. All relevant experiments have been approved by the Beijing You’an Hospital Research Ethics Committee. The methods applied were carried out in accordance with the approved guidelines.
A total of 26 HIV-1 acutely infected individuals (AHIs) were participated in this study. Samples of subsequently chronic infection stage of these AHIs were also collected and analyzed. Basic information of study subjects was reported in Table 1. No individual accepted ART. The progression of acute HIV-1 infection can be depicted as six discrete stages as proposed by Fiebig et al. (17, 18). These 26 AHIs were at Fiebig stage III–VI. 21 age-matched male MSM healthy donors (HDs) were included as controls.
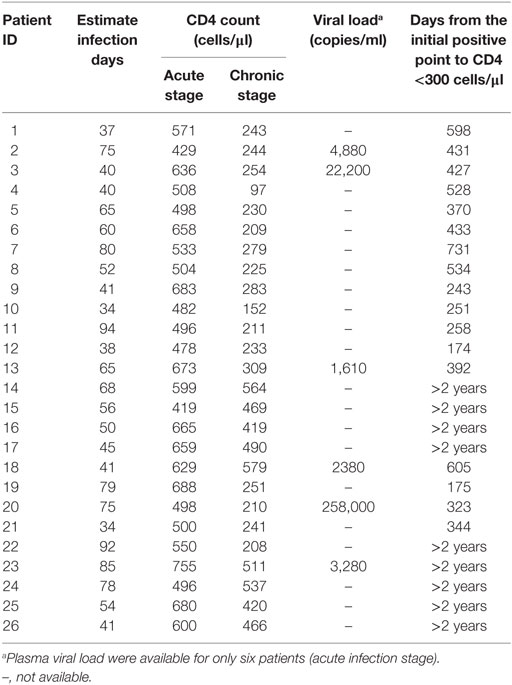
Table 1. Patient characteristics.
Flow Cytometry Analysis of T Cell Activation, Exhaustion, and Cycling Expression
Cryopreserved PBMCs were first stained with fixable viability stain 510 (BD Biosciences, San Diego, CA, USA) for 15 min to exclude dead cells, then washed, and surface stained with anti-CD3-BV650 (BD Biosciences), anti-CD4-AF700 (Biolegend, San Diego, CA, USA), anti-CD8-Percp-Cy5.5 (BD Biosciences), anti-CD38-BV786 (BD Biosciences), anti-HLA-DR-Pacific blue (Biolegend), anti-CD160-AF488 (eBioscience San Diego, CA, USA), anti-PD-1-BV605 (Biolegend), anti-TIGIT-APC (eBioscience), and anti-TIM-3-PE (R&D Systems, Inc., USA) at room temperature for 20 min. Cells were permeabilized and fixed with intracellular staining reagents according to the manufacturer’s instructions (eBioscience) before intracellular staining with anti-ki67-PE-Cy7 (Biolegend). Samples were then washed before acquisition and analysis on a BD LSRFortessa flow cytometer instrument with Diva software (BD Biosciences). Relative isotype controls or fluorescence minus one samples were prepared to facilitate gating. Data were analyzed using Flowjo Software version 10 (Tree Star Inc., Ashland, OR, USA).
Intracellular Cytokine Staining
Peripheral blood mononuclear cells were stimulated by leukocyte activation cocktail with BD GolgiPlug (BD Biosciences) in an incubator at 37°C with 5% CO2 for 6 h, the leukocyte activation cocktail contained phorbol 12-myristate-13-acetate (PMA), ionomycin, and brefeldin A. After stimulation, cells were washed and stained with surface phenotype panel against CD3, CD4, and CD8 for 20 min at room temperature in the dark. After permeabilization and fixation, cells were intracellularly stained with anti-IFN-γ-BV605, anti-IL-2-APC, and anti-TNF-α-PE-Cy7 (all from Biolegend). Data were acquired and analyzed as described above.
HIV-1 Viral Load and CD4+ T Cell Count Measurements
Plasma HIV-1 viral load (pVL) was quantified using automated RealTime PCR-based m2000 system (Abbott Molecular Inc., Des Plaines, IL, USA), with a detection limit of 40 copies/ml. CD4+ T cell absolute count were determined in fresh whole blood by using Trucount Tubes and CD45/CD3/CD4/CD8 four-color antibody (BD Biosciences) according to the manufacturer’s protocol.
Statistical Analysis
Statistical analysis and graphical presentation were performed using GraphPad Prism version 5 software (GraphPad Software, San Diego, CA, USA). Data are expressed as median values and analyzed by the use of Mann–Whitney U test. Correlations between variables were estimated with Spearman’s rank correlation test. Survival analysis were generated from the log-rank test. All tests were two-tailed and p value < 0.05 was considered statistically significant.
Results
High Level of CD4+ T Cell Immune Activation in Acute HIV-1 Infection Was Associated With Subsequently Slow CD4+ T Cell Decline
To investigate the role of T cell immune activation in the CD4+ T cell depletion during HIV-1 acute infection stage, we first compared the level of T cell immune activation between acute and chronic stage with paired HIV-1-infected patients’ samples. Here, we used the coexpression of CD38 and HLA-DR on the surface of CD4+ or CD8+ T cells to represent the level of T cell activation. As expected, the level of CD4+ and CD8+ T cell activation was significantly higher in AHIs and subsequently chronic HIV-1 infection stage (CHIs) compared with HDs (all p < 0.001, Figures 1A,B); however, no significant differences were found between AHIs and CHIs in CD4+ T cell immune activation (Figure 1A). Higher CD8+ T cell immune activation was observed in AHIs compared with CHIs (p < 0.01, Figure 1B).
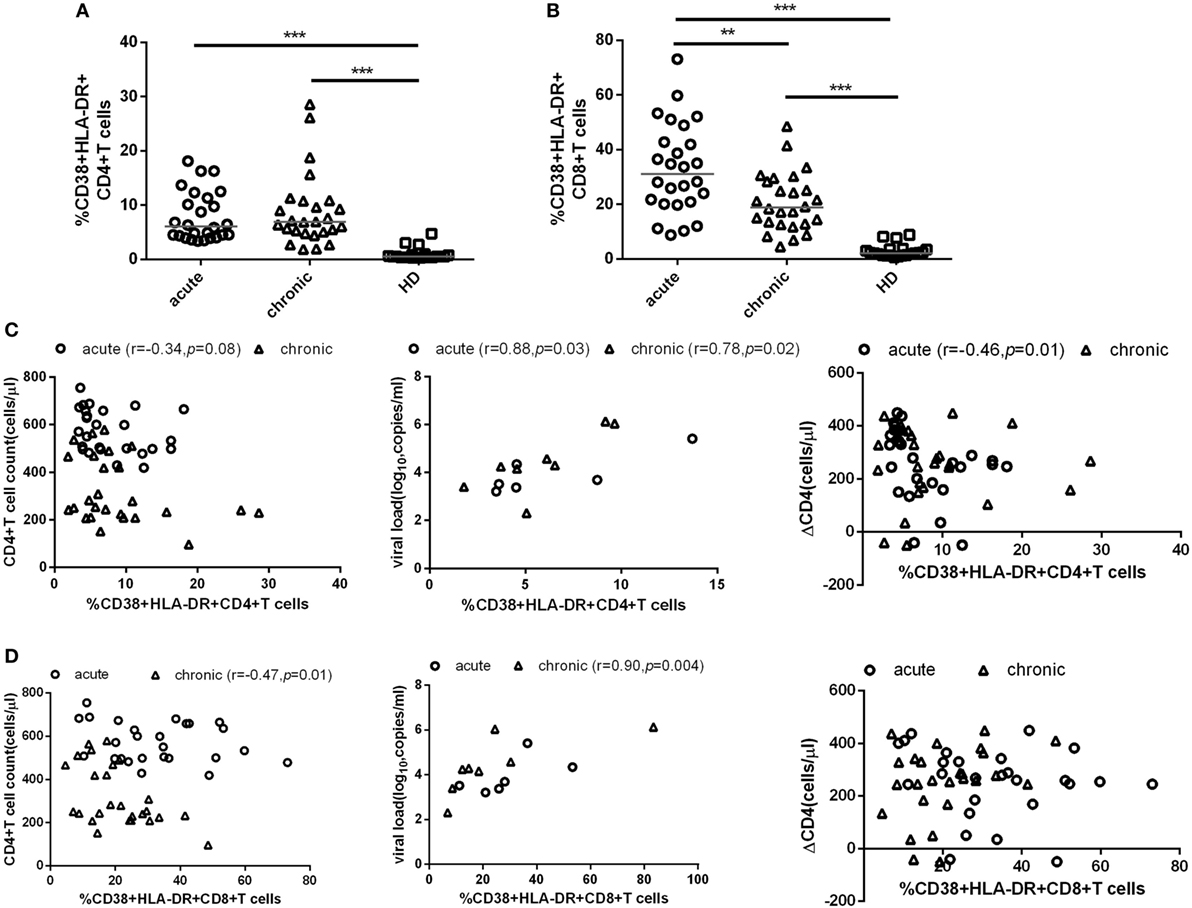
Figure 1. CD4+ and CD8+ T cell activation in HIV-1 acute and chronic infection stage. Comparisons of the level of CD4+ T (A) and CD8+ T (B) cell immune activation among healthy donors (HDs, □), HIV-1 acute (AHIs, ○) and chronic (chronic HIV-1 infection stage, Δ) infection stage. (C) Correlation between CD4+ T cell immune activation and CD4+ T cell count (left), viral load (middle), and CD4+ T cell depletion from acute stage to observation end-point in chronic stage (ΔCD4, right). (D) Correlation between CD8+ T cell immune activation and CD4+ T cell count (left), viral load (middle), and ΔCD4 (right). Significance of difference was calculated by Mann–Whitney U test. Correlation analysis was performed by Spearman’s rank test. Horizontal lines indicate median values (*p < 0.05, **p < 0.01, ***p < 0.001).
Next, the relationship between the level of T cell immune activation and the variables of disease progression, e.g., CD4+ T cell count, pVL, and CD4+ T cell decline (ΔCD4) were assessed. ΔCD4 was defined as the change of CD4+ T cell count in 2 years after seroconversion. Consistent with other studies, during acute infection stage, the percentages of CD38 and HLA-DR coexpression on CD4+ T cells was negatively correlated with CD4+ T cell count (r = −0.34, p = 0.08, Figure 1C left) and positively correlated with pVL (r = 0.88, p = 0.03, Figure 1C middle). Interestingly, the higher level of CD4+ T cell activation in AHIs was correlated with less decline of CD4+ T cell count after 2 years of infection without ART (r = −0.46, p = 0.01, Figure 1C right). However, the same correlations between CD8+ T cell immune activation level and the disease progression marker (CD4+ T cell decline, CD4+ T cell count or pVL) were not found in AHIs (Figure 1D). Therefore, the level of CD4+ T cell immune activation in HIV-1 acute infection stage may predict the disease progression.
To further testify this possibility, all patients were classified into high or low activation groups based on the median values of CD4+ T cell activation (median value: 6.08%). Individuals in these two groups were not found significant difference in age, gender, and case history. The CD4+ T cell immune activation in these two groups was significant difference (p < 0.001, Figure 2A). ΔCD4 in CD4+ T immune activation high group was significantly lower than that in the low group (p < 0.05, Figure 2B). In the survival analysis, the low level of CD4+ T cell immune activation were significantly associated with faster time to the decrease of CD4+ T cell count below 300 cells/μl in chronic infection stage (p = 0.02, Figure 2C). Because CD4+ T cell activation at the acute phase associated with CD4+ T cell depletion at the chronic phase, we hypothesize that the CD4+ T cell immune activation in acute infection stage may play a protective role in the loss of CD4+ T cells during disease progression. To further testify whether CD4+ T cell immune activation in acute infection stage influences on the CD4+ T cell decline, patients were divided into rapid progressors (RPs, n = 17) and slow progressors (SPs, n = 9). RPs: change of CD4+ T cell count from baseline to the time point when their CD4+ T cell count dropped below 300 cells/μl; SPs: changes of CD4+ T cell count from baseline to 2 years of postinfection were not dropped below 300 cells/μl. Both RPs and SPs had same CD4+ T cell level at the blood collection time point in acutely infected stage in this study. Our results showed that SPs indeed had higher level of CD4+ T cell immune activation than RPs, although no significant difference between SPs and RPs (Figure 2D).
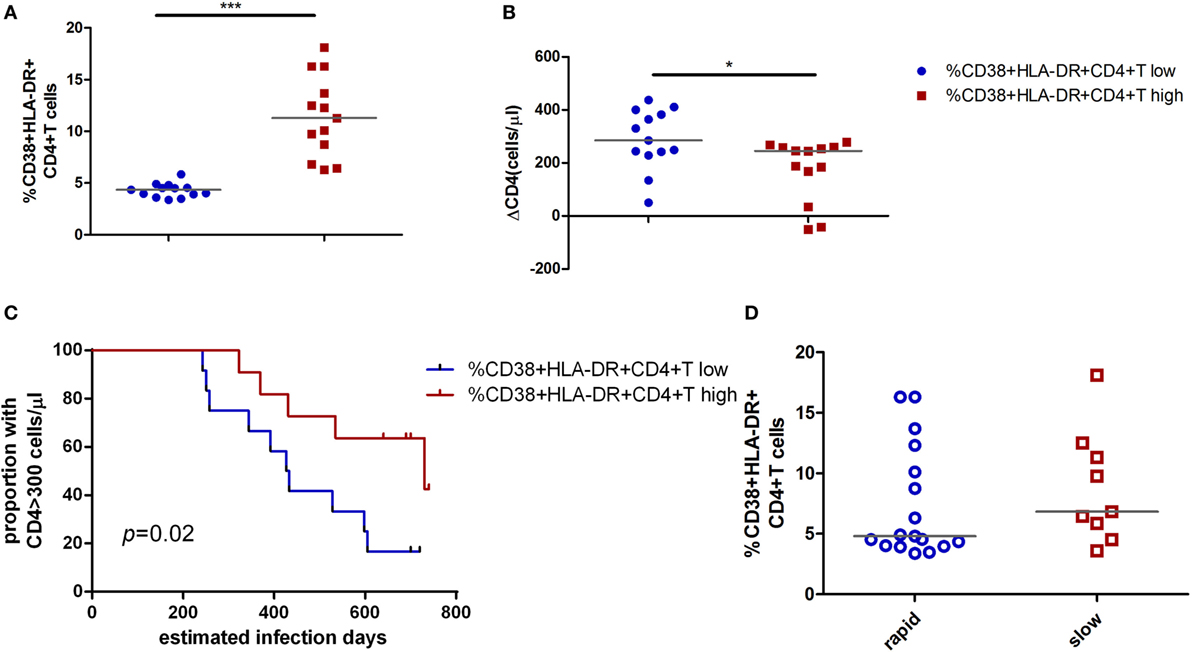
Figure 2. Impact of CD4+ T cell activation in acute HIV-1 infection on clinical outcomes. Comparison of the level of CD4+ T cell activation (A) and ΔCD4 (B) between CD4+ T cell activation high ( ) and low (
 ) groups in acute infection stage. (C) Kaplan–Meier curves with univariate analyzes (log-rank) were performed to evaluate the effects of CD4+ T cell immune activation during acute HIV-1 infection stage on CD4+ T cell depletion. Endpoints were defined as CD4+ T cell count <300 cells/μl. Blue line, low CD4+ T cell activation; red line, high CD4+ T cell activation. (D) Comparison of the level of CD4+ T cell activation between rapid (○) and slow (□) progressors. Rapid progressors: CD4+ T cells drop to less than 300 cells/μl in 2 years after acute infection. Slow progressors: CD4+ T cells maintain to more than 500 cells/μl in 2 years after acute infection. Significance of difference was calculated by Mann–Whitney U test. Horizontal lines indicate median values (*p < 0.05, **p < 0.01, ***p < 0.001).
CD4+ T Cell Cycling Expression During Acute HIV-1 Infection Is Correlated With CD4+ T Cell Immune Activation and CD4+ T Cell Decline Over Time
To investigate the biologic function of CD4+ T cell immune activation in the acute infection stage in CD4+ T cell decline, we first analyzed the relationship between the proliferation capacity of CD4+ T cells and CD4+ T cell immune activation or the CD4+ T cell decline in AHIs. The expression of ki67 in CD4+ T cells represents the proliferation capacity (9, 19). We found that high CD4+ T cell immune activation groups had higher proliferation capacity than that in the low activation group (p < 0.05, Figure 3A). A direct correlation was observed between the percentages of ki67 in CD4+ T cells and the levels of CD4+ T cell activation (r = 0.48, p = 0.01, Figure 3B), and an inverse correlation was observed between the percentages of ki67 in CD4+ T cells and CD4+ T cell depletion in AHIs (r = −0.40, p = 0.04, Figure 3C). These findings suggest that the turnover of T cells is maintained during acute HIV-1 infection, implying that an effective proliferation response at the acute phase may contribute to the complement for CD4+ T cell depletion in the natural disease progression without ART.
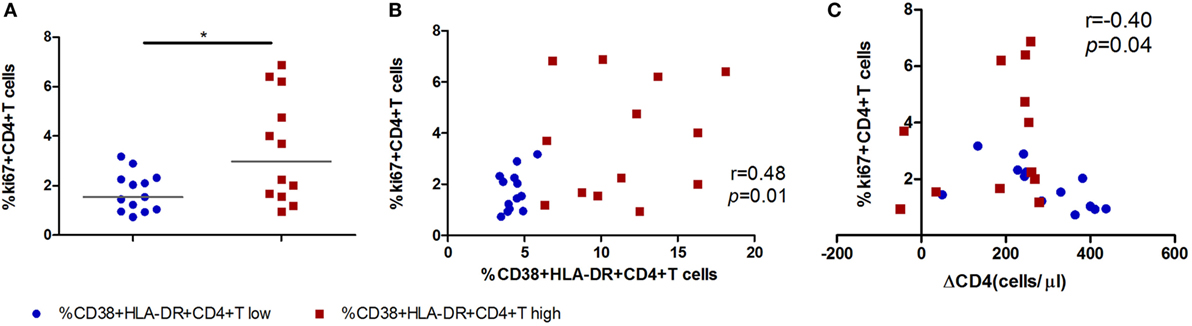
Figure 3. High CD4+ T cell immune activation is associated with greater cycling expression in CD4+ T cells in acutely infected patients. (A) Comparison of ki67 expression in CD4+ T cells in the high T cell activation () and low activation groups (). Correlation analyzes of ki67 expression and the level of CD4+ T cell activation (B) and ΔCD4 (C) in acute infection stage. Significance of difference was calculated by Mann–Whitney U test. Correlation analysis was performed by Spearman’s rank test. Horizontal lines indicate median values (*p < 0.05, **p < 0.01, ***p < 0.001).
Immune Exhaustion in HIV-1 Acute Infection Stage Was Not Associated With CD4+ T Cell Decline
Immune exhaustion was measured by expression of CD160, T cell immunoglobulin and ITIM domain (TIGIT), programmed cell death protein 1 (PD-1), T cell immunoglobulin and mucin 3 (TIM-3) on CD4+ T cells. The frequencies of CD4+ T cells expressing CD160, TIGIT, PD-1, TIM-3 were similar between the CD4+ T cell immune activation high and low groups (Figure 4A). No associations were observed between any one of the immune exhaustion markers and the level of CD4+ T cell activation or ΔCD4 (Figures 4B,C).
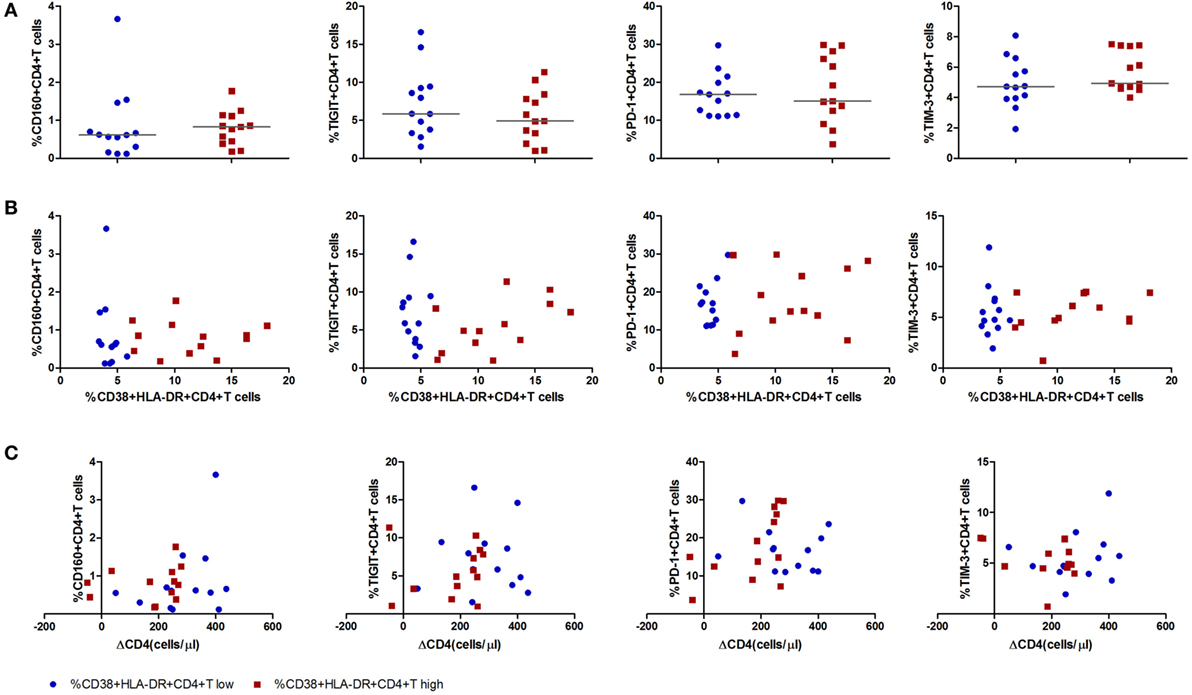
Figure 4. Expression of inhibitory molecules on CD4+ T cells in acute HIV-1 infection stage and their correlations with the level of CD4+ T cell activation and CD4+ T cell depletion. (A) Comparisons of the expression level of inhibitory molecules CD160, T cell immunoglobulin and ITIM domain, programmed cell death protein 1, and T cell immunoglobulin and mucin 3 on CD4+ T cell activation high () and low () groups in acutely infected patients. Correlation analysis between inhibitory molecules and the level of CD4+ T cell activation (B) and ΔCD4 (C). Significance of difference was calculated by Mann–Whitney U test. Correlation analysis was performed by Spearman’s rank test. Horizontal lines indicate median values.
Secreting of IL-2 by CD4+ T Cells Was Associated With CD4+ T Cell Maintenance
To further investigate the function of activated CD4+ T cells during acute infection stage and its role in CD4+ T cell decline over time, we analyzed the relationship between cytokine-producing (IFN-γ, TNF-α, and IL-2) CD4+ T cells and the level of CD4+ T cell immune activation. Intriguingly, decreased percentages of TNF-α-producing CD4+ T cells and increased percentages of IL-2-producing CD4+ T cells were found in the high immune activation group compared to the low activation group (all p < 0.05, Figures 5A,B). Correlation analysis revealed that increased IL-2 secreting capacity was positively correlated with the level of CD4+ T cell immune activation (r = 0.41, p = 0.04, Figure 5C) and negatively correlated with CD4+ T cell decline (ΔCD4, r = −0.36, p = 0.07, Figure 5D).
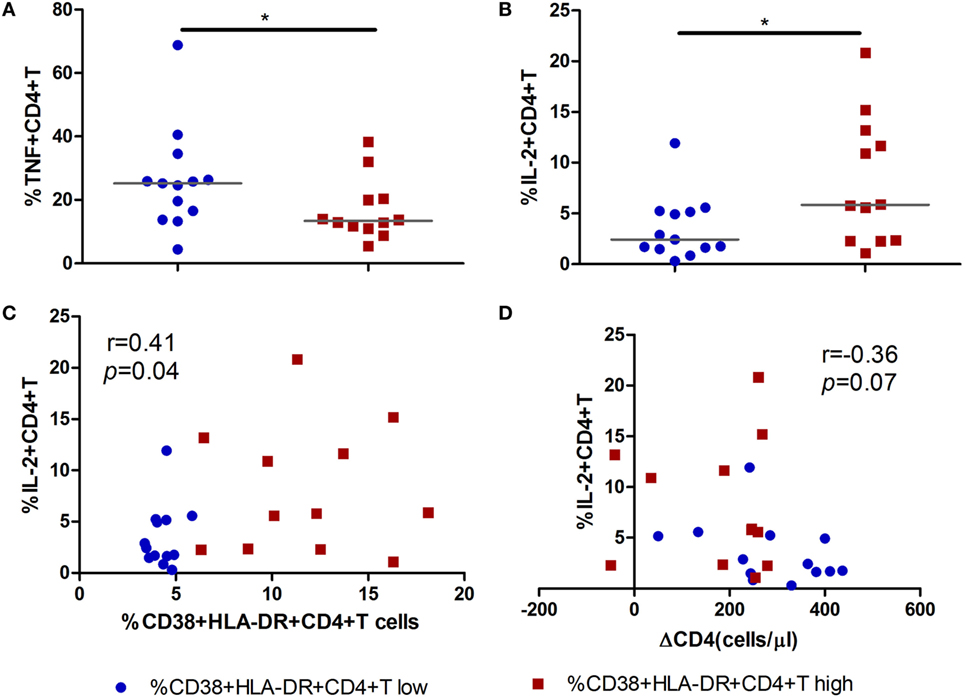
Figure 5. Secretion of IL-2 by CD4+ T cells in acute HIV-1 infection is associated with the maintenance of CD4+ T cells. Comparisons of TNF-α (A) and IL-2 (B) secreting capacity of CD4+ T cells between CD4+ T cell activation high () and low () groups in acute HIV-1-infected patients. Correlation analysis between IL-2 and the level of CD4+ T cell activation (C) and ΔCD4 (D). Significance of difference was calculated by Mann–Whitney U test. Correlation analysis was performed by Spearman’s rank test. Horizontal lines indicate median values (*p < 0.05, **p < 0.01, ***p < 0.001).
Discussion
Several mechanisms are thought to contribute to CD4+ T cell depletion in HIV-1 infection. Of these, the two most acknowledged mechanisms are direct virus attack resulting in cytolytic effect and chronic immune activation leading to cell apoptosis (7–9, 20). Numerous reports have demonstrated that immune activation is a better predictor of clinical outcomes than plasma viral load in HIV-1-infected subjects (1, 2, 13, 21). Despite a general consensus on the association between chronic T cell activation and CD4+ T cell count and disease progression, whether immune activation during the acute phase results in CD4+ T cell depletion and immune suppression is unclear. In the present study, we reported a direct relationship between higher CD4+ T cell activation during acute HIV-1 infection and the less loss of CD4+ T cells after 2 years of acute infection (chronic infection stage). Activation of CD4+ T cells in early HIV-1 infection stage, therefore, may have a beneficial effect on CD4+ T cell homeostasis. Consistently, The Adult AIDS Clinical Trials Group (ACTG) interruption treatment trail found that higher baseline CD4+ T cell immune activation predicted the delay of viral rebound following treatment interruption (14). Ndhlovu et al. observed that the magnitude of CD8+ T cell activation and the rapidity to peak activation were inversely correlated with set point of viremia during hyperacute HIV-1 infection, indicating that CD8+ T cell responses are beneficial for subsequent immune control of acute infection (15). However, we did not find the similar results between CD8+ T cell activation and CD4+ T cell decline in the current study. These observations revealed that high levels of CD4+ T cell activation in acute HIV-1 infection represent a more competent immediate host immune response.
The ability of these cells to proliferate also correlates with CD4+ T cell decline. Ki67 expression is usually used as a surrogate marker for proliferation or even activation in chronic HIV-1 infection (9, 19). Here, we showed that in acute HIV-1 infection, the frequency of ki67 in CD4+ T cells correlated with the expression of phenotypic activation markers, and more importantly, it inversely correlated with CD4+ T cell decline in patients with acute infection over time. In addition, correlation between ki67 and CD4+ T cell decline was not observed in chronic stage patients (data not shown), suggesting that cycling may have a causal role in slow CD4+ T cell loss in acute HIV-1 infection. Ki67 protein is upregulated in all cell cycle phases except G0 (22). Previous studies in chronic HIV-1 infection have shown that ki67 may not really represent the cell cycle and turnover. Cycling CD4+ T cells are under cell cycle arrest (G1 phase or G1/S transition checkpoint), or die after entering S phase in chronically infected patients (23–25), suggesting that cell proliferation is not competent in CD4+ T cells in chronic infection. Taken together, we hypothesize that CD4 lymphocyte proliferation outcomes with acute and chronic infection are likely to be distinct. CD4+ T cell proliferation appears to be effective and beneficial in the acute phase, whereas in the chronic phase it is invalid or less effective. Therefore, ki67 is probably a better marker for CD4+ T cell decline in the setting of acute HIV-1 infection. In the absence of cell cycle arrest, CD4+ T cells are more competent to differentiate into functional subsets and compensate cell loss in AHIs.
The polyfunctional profile of CD4+ T cells was not significant different between high or low CD4+ T cell activation groups. However, higher fraction of IL-2-secreting CD4+ T cells in the high CD4+ T cell activation group was found in our study. Impaired IL-2-producing T cells was one of the first functional defects observed in chronically HIV-1-infected patients, which predicts loss of CD4+ T cells and progression to AIDS (26). Chronic immune activation prevents the induction of IL-2-expressing memory CD4+ T cells, and this associates with impaired function of HIV-1-specifc CD4+ T cells (27, 28). Although less well characterized than CD8+ T cell, HIV-1-specific CD4+ T cell proliferation and function during early HIV-infection seem to predict virus control and slower disease progression in the absence of therapy (29, 30). Taken together, these observations indicate that CD4+ T cell activation at the acute phase may have a crucial role in preventing CD4+ T cell depletion through production of cytokines and increased proliferation in AHIs. The IL-2 cytokine may provide important helper signals for later adaptive immune response.
Persistent antigen exposure and inflammatory status often leads to immune exhaustion, resulting in effector T cells progressively dysfunctional (31). A recent study reported that in primary HIV-1 infection, TIM-3+CD8+ T cells was associated with delayed progression (32). In our study, we found neither significant difference of exhaustion molecules between high and low CD4+ T cell activation groups nor the association between exhaustion molecules and the loss of CD4+ T cells. Our results may provide us evidence that less extent of T cell exhaustion was developed in acute HIV-1 infection.
Although high level of CD4+ T cell activation in early HIV-1 infection stage is beneficial for CD4+ T cell preservation, we proposed that this CD4+ T cell activation belongs to a homeostatic response to HIV-1. Excessive activation of CD4+ T cells may induce upregulation of CCR5 expression on CD4+ T cells, which increases targets for HIV infection and, therefore, may accelerate CD4+ T cell depletion (33, 34).
This study has several limitations. MSM cohort in our study was followed up every 2 months for acute infection screening. Most acutely infected patients were seroconversion in these 2 months and at late Fiebig stage. Therefore, it is interesting to know that whether the results differ from that in earlier AHI stage. In addition, our experiments were performed with PMA/Ionomycin T-cell stimulation, cytokine production should be determined upon HIV-specific antigen stimulation to further study the possible mechanisms that the preventing role of T cell activation in CD4+ T cell depletion during acute HIV-1 infection stage.
In summary, we found that higher level of CD4+ T cell immune activation in acute HIV-1 infection stage associates with subsequent slower CD4+ T cell decline in our study. Mechanism study revealed that greater levels of CD4+ T cell proliferation and IL-2 secretion under the high CD4+ T cell activation status may contribute to the CD4+ T cell preservation. Our research provides us a new insight into the role of T cell immune activation in acute HIV-1 infection in CD4+ T cell depletion over time.
Ethics Statement
All HIV-1 infected participants provided written informed consents according to the declaration of Helsinki. All relevant experiments have been approved by the Beijing You’an Hospital Research Ethics Committee. The methods applied were carried out in accordance with the approved guidelines.
Author Contributions
HX, XL, BS, and HW conceived the study and designed the experiments; HX, XL, XZ, LQ, and JS performed the experiments; HX, XL, XZ, and ZL analyzed the data; YZ and TZ contributed to reagents and materials; and HX, XL, WJ, and HW wrote the article. All authors read and approved the final manuscript.
Conflict of Interest Statement
The authors declare that the research was conducted in the absence of any commercial or financial relationships that could be construed as a potential conflict of interest.
Acknowledgments
The authors thank Drs. Wei Xia and Yuefang Zhou for patients recruiting and blood and information collecting; Yunxia Ji and Rui Wang for CD4+ T cell and viral load detecting.
Funding
This work was supported by the 13th Five-Year Mega Project of China on the prevention and treatment of AIDS, viral hepatitis, and other infectious disease (2017ZX10202101-004-001 to TZ), Beijing Municipal of Science and Technology Major Project (D161100000416003 to HW), National Natural Science Foundation of China (NSFC, 81501731 to ZL, 81501732 to XL, 81772165 to BS), National Institutes of Health grants (NIH, R01 AI091526 and AI128864 to WJ), NSFC-NIH Biomedical Collaborative Research Program (81761128001 to HW), Beijing Key Laboratory for HIV/AIDS Research (BZ0089), and Biomarkers of infection related diseases, Beijing Key Laboratory (BZ0373).
References
1. Giorgi JV, Hultin LE, McKeating JA, Johnson TD, Owens B, Jacobson LP, et al. Shorter survival in advanced human immunodeficiency virus type 1 infection is more closely associated with T lymphocyte activation than with plasma virus burden or virus chemokine coreceptor usage. J Infect Dis (1999) 179:859–70. doi:10.1086/314660
2. Deeks SG, Kitchen CM, Liu L, Guo H, Gascon R, Narvaez AB, et al. Immune activation set point during early HIV infection predicts subsequent CD4+ T-cell changes independent of viral load. Blood (2004) 104:942–7. doi:10.1182/blood-2003-09-3333
3. Hunt PW, Sinclair E, Rodriguez B, Shive C, Clagett B, Funderburg N, et al. Gut epithelial barrier dysfunction and innate immune activation predict mortality in treated HIV infection. J Infect Dis (2014) 210:1228–38. doi:10.1093/infdis/jiu238
4. Sandler NG, Sereti I. Can early therapy reduce inflammation? Curr Opin HIV AIDS (2014) 9:72–9. doi:10.1097/COH.0000000000000020
5. Douek DC, Picker LJ, Koup RA. T cell dynamics in HIV-1 infection. Annu Rev Immunol (2003) 21:265–304. doi:10.1146/annurev.immunol.21.120601.141053
6. Younas M, Psomas C, Reynes J, Corbeau P. Immune activation in the course of HIV-1 infection: causes, phenotypes and persistence under therapy. HIV Med (2016) 17:89–105. doi:10.1111/hiv.12310
7. Derdeyn CA, Silvestri G. Viral and host factors in the pathogenesis of HIV infection. Curr Opin Immunol (2005) 17:366–73. doi:10.1016/j.coi.2005.06.001
8. Moanna A, Dunham R, Paiardini M, Silvestri G. CD4+ T-cell depletion in HIV infection: killed by friendly fire? Curr HIV/AIDS Rep (2005) 2:16–23. doi:10.1007/s11904-996-0004-3
9. Boasso A, Shearer GM. Chronic innate immune activation as a cause of HIV-1 immunopathogenesis. Clin Immunol (2008) 126:235–42. doi:10.1016/j.clim.2007.08.015
10. Vinikoor MJ, Cope A, Gay CL, Ferrari G, McGee KS, Kuruc JD, et al. Antiretroviral therapy initiated during acute HIV infection fails to prevent persistent T-cell activation. J Acquir Immune Defic Syndr (2013) 62:505–8. doi:10.1097/QAI.0b013e318285cd33
11. Jain V, Hartogensis W, Bacchetti P, Hunt PW, Hatano H, Sinclair E, et al. Antiretroviral therapy initiated within 6 months of HIV infection is associated with lower T-cell activation and smaller HIV reservoir size. J Infect Dis (2013) 208:1202–11. doi:10.1093/infdis/jit311
12. Hunt PW, Martin JN, Sinclair E, Bredt B, Hagos E, Lampiris H, et al. T cell activation is associated with lower CD4+ T cell gains in human immunodeficiency virus-infected patients with sustained viral suppression during antiretroviral therapy. J Infect Dis (2003) 187:1534–43. doi:10.1086/374786
13. Saez-Cirion A, Bacchus C, Hocqueloux L, Avettand-Fenoel V, Girault I, Lecuroux C, et al. Post-treatment HIV-1 controllers with a long-term virological remission after the interruption of early initiated antiretroviral therapy ANRS VISCONTI study. PLoS Pathog (2013) 9:e1003211. doi:10.1371/journal.ppat.1003211
14. Volberding P, Demeter L, Bosch RJ, Aga E, Pettinelli C, Hirsch M, et al. Antiretroviral therapy in acute and recent HIV infection: a prospective multicenter stratified trial of intentionally interrupted treatment. AIDS (2009) 23:1987–95. doi:10.1097/QAD.0b013e32832eb285
15. Ndhlovu ZM, Kamya P, Mewalal N, Kloverpris HN, Nkosi T, Pretorius K, et al. Magnitude and kinetics of CD8+ T cell activation during hyperacute HIV infection impact viral set point. Immunity (2015) 43:591–604. doi:10.1016/j.immuni.2015.08.012
16. Huang X, Lodi S, Fox Z, Li W, Phillips A, Porter K, et al. Rate of CD4 decline and HIV-RNA change following HIV seroconversion in men who have sex with men: a comparison between the Beijing PRIMO and CASCADE cohorts. J Acquir Immune Defic Syndr (2013) 62:441–6. doi:10.1097/QAI.0b013e31827f5c9a
17. Fiebig EW, Wright DJ, Rawal BD, Garrett PE, Schumacher RT, Peddada L, et al. Dynamics of HIV viremia and antibody seroconversion in plasma donors: implications for diagnosis and staging of primary HIV infection. AIDS (2003) 17:1871–9. doi:10.1097/01.aids.0000076308.76477.b8
18. Cohen MS, Gay CL, Busch MP, Hecht FM. The detection of acute HIV infection. J Infect Dis (2010) 202(Suppl 2):S270–7. doi:10.1086/655651
19. Scholzen T, Gerdes J. The Ki-67 protein: from the known and the unknown. J Cell Physiol (2000) 182:311–22. doi:10.1002/(SICI)1097-4652(200003)182:3<311:AID-JCP1>3.0.CO;2-9
20. Vidya Vijayan KK, Karthigeyan KP, Tripathi SP, Hanna LE. Pathophysiology of CD4+ T-cell depletion in HIV-1 and HIV-2 infections. Front Immunol (2017) 8:580. doi:10.3389/fimmu.2017.00580
21. Rodriguez B, Sethi AK, Cheruvu VK, Mackay W, Bosch RJ, Kitahata M, et al. Predictive value of plasma HIV RNA level on rate of CD4 T-cell decline in untreated HIV infection. JAMA (2006) 296:1498–506. doi:10.1001/jama.296.12.1498
22. Bruno S, Darzynkiewicz Z. Cell cycle dependent expression and stability of the nuclear protein detected by Ki-67 antibody in HL-60 cells. Cell Prolif (1992) 25:31–40. doi:10.1111/j.1365-2184.1992.tb01435.x
23. Combadere B, Blanc C, Li T, Carcelain G, Delaugerre C, Calvez V, et al. CD4+Ki67+ lymphocytes in HIV-infected patients are effector T cells accumulated in the G1 phase of the cell cycle. Eur J Immunol (2000) 30:3598–603. doi:10.1002/1521-4141(200012)30:12<3598::AID-IMMU3598>3.0.CO;2-E
24. Boasso A, Hardy AW, Anderson SA, Dolan MJ, Shearer GM. HIV-induced type I interferon and tryptophan catabolism drive T cell dysfunction despite phenotypic activation. PLoS One (2008) 3:e2961. doi:10.1371/journal.pone.0002961
25. Sieg SF, Bazdar DA, Lederman MM. S-phase entry leads to cell death in circulating T cells from HIV-infected persons. J Leukoc Biol (2008) 83:1382–7. doi:10.1189/jlb.0907643
26. Freeman ML, Shive CL, Nguyen TP, Younes SA, Panigrahi S, Lederman MM. Cytokines and T-cell homeostasis in HIV infection. J Infect Dis (2016) 214(Suppl 2):S51–7. doi:10.1093/infdis/jiw287
27. Younes SA, Yassine-Diab B, Dumont AR, Boulassel MR, Grossman Z, Routy JP, et al. HIV-1 viremia prevents the establishment of interleukin 2-producing HIV-specific memory CD4+ T cells endowed with proliferative capacity. J Exp Med (2003) 198:1909–22. doi:10.1084/jem.20031598
28. Harari A, Vallelian F, Pantaleo G. Phenotypic heterogeneity of antigen-specific CD4 T cells under different conditions of antigen persistence and antigen load. Eur J Immunol (2004) 34:3525–33. doi:10.1002/eji.200425324
29. Soghoian DZ, Jessen H, Flanders M, Sierra-Davidson K, Cutler S, Pertel T, et al. HIV-specific cytolytic CD4 T cell responses during acute HIV infection predict disease outcome. Sci Transl Med (2012) 4:123ra25. doi:10.1126/scitranslmed.3003165
30. Frater J, Ewings F, Hurst J, Brown H, Robinson N, Fidler S, et al. HIV-1-specific CD4(+) responses in primary HIV-1 infection predict disease progression. AIDS (2014) 28:699–708. doi:10.1097/QAD.0000000000000130
31. Wherry EJ, Kurachi M. Molecular and cellular insights into T cell exhaustion. Nat Rev Immunol (2015) 15:486–99. doi:10.1038/nri3862
32. Hoffmann M, Pantazis N, Martin GE, Hickling S, Hurst J, Meyerowitz J, et al. Exhaustion of activated CD8 T cells predicts disease progression in primary HIV-1 infection. PLoS Pathog (2016) 12:e1005661. doi:10.1371/journal.ppat.1005661
33. Paiardini M, Muller-Trutwin M. HIV-associated chronic immune activation. Immunol Rev (2013) 254:78–101. doi:10.1111/imr.12079
Keywords: acute HIV-1 infection, T cell immune activation, CD4+ T cell, immune exhaustion molecules, T cell preservation
Citation: Xia H, Jiang W, Zhang X, Qin L, Su B, Li Z, Sun J, Zhang Y, Zhang T, Lu X and Wu H (2018) Elevated Level of CD4+ T Cell Immune Activation in Acutely HIV-1-Infected Stage Associates With Increased IL-2 Production and Cycling Expression, and Subsequent CD4+ T Cell Preservation. Front. Immunol. 9:616. doi: 10.3389/fimmu.2018.00616
Received: 27 November 2017; Accepted: 12 March 2018;
Published: 27 March 2018
Edited by:
Aurelio Cafaro, Istituto Superiore di Sanità, ItalyReviewed by:
Lucia Lopalco, San Raffaele Hospital (IRCCS), ItalySarah Rowland-Jones, University of Oxford, United Kingdom
Copyright: © 2018 Xia, Jiang, Zhang, Qin, Su, Li, Sun, Zhang, Zhang, Lu and Wu. This is an open-access article distributed under the terms of the Creative Commons Attribution License (CC BY). The use, distribution or reproduction in other forums is permitted, provided the original author(s) and the copyright owner are credited and that the original publication in this journal is cited, in accordance with accepted academic practice. No use, distribution or reproduction is permitted which does not comply with these terms.
*Correspondence: Xiaofan Lu, luxiaofan2008hk@163.com;
Hao Wu, whdoc@sina.com