 Takashi Ogasawara1
 Yuko Kohashi2Jun Ikari1
 Toshibumi Taniguchi2Nobuhide Tsuruoka3
 Haruko Watanabe-Takano2Lisa Fujimura4Akemi Sakamoto2
 Masahiko Hatano2
 Hirokuni Hirata5Yasutsugu Fukushima5Takeshi Fukuda6Kazuhiro Kurasawa7Koichiro Tatsumi1Takeshi Tokuhisa8
 Masafumi Arima2,7*
- 1Department of Respirology (B2), Chiba University Graduate School of Medicine, Chiba, Japan
- 2Department of Biomedical Science (M14), Chiba University Graduate School of Medicine, Chiba, Japan
- 3Department of Reproductive Medicine (G4), Chiba University Graduate School of Medicine, Chiba, Japan
- 4Biomedical Research Center, Chiba University, Chiba, Japan
- 5Department of Respiratory Medicine and Clinical Immunology, Dokkyo Medical University Koshigaya Hospital, Koshigaya, Japan
- 6Department of Pulmonary Medicine and Clinical Immunology, Dokkyo Medical University School of Medicine, Mibu, Japan
- 7Department of Rheumatology, Dokkyo Medical University School of Medicine, Mibu, Japan
- 8Department of Developmental Genetics, Chiba University Graduate School of Medicine, Chiba, Japan
Transcriptional repressor B-cell lymphoma 6 (Bcl6) appears to regulate TH2 immune responses in allergies, but its precise role is unclear. We previously reported that Bcl6 suppressed IL-4 production in naïve CD4+ T cell-derived memory TH2 cells. To investigate Bcl6 function in allergic responses in naturally occurring memory phenotype CD4+ T (MPT) cells and their derived TH2 (MPTH2) cells, Bcl6-manipulated mice, highly conserved intron enhancer (hcIE)-deficient mice, and reporter mice for conserved noncoding sequence 2 (CNS2) 3′ distal enhancer region were used to elucidate Bcl6 function in MPT cells. The molecular mechanisms of Bcl6-mediated TH2 cytokine gene regulation were elucidated using cellular and molecular approaches. Bcl6 function in MPT cells was determined using adoptive transfer to naïve mice, which were assessed for allergic airway inflammation. Bcl6 suppressed IL-4 production in MPT and MPTH2 cells by suppressing CNS2 enhancer activity. Bcl6 downregulated Il4 expression in MPTH2 cells, but not MPT cells, by suppressing hcIE activity. The inhibitory functions of Bcl6 in MPT and MPTH2 cells attenuated allergic responses. Bcl6 is a critical regulator of IL-4 production by MPT and MPTH2 cells in TH2 immune responses related to the pathogenesis of allergies.
Introduction
Allergic asthma is an inflammatory airway disorder mediated by TH2 cells, which produce various effector cytokines (IL-4, IL-5, and IL-13) (1, 2). IL-4 induces signal transducer and activator of transcription (STAT) 6 phosphorylation, causing the protein to translocate to the nucleus, where it induces the expression of Gata3 (3, 4), a key regulator of TH2 cell differentiation. GATA3 facilitates Il4, Il5, and Il13 transcription in TH2 cells (3, 4). In mouse and human allergies, IL-4 initiates TH2 responses and IgE isotype class switching, whereas IL-5 and IL-13 are important for eosinophil infiltration/activation and increased airway hyperreactivity in allergic asthma (1, 2).
The proto-oncogene product B-cell lymphoma 6 (Bcl6) is a sequence-specific transcriptional repressor (5–9). Tissue hypereosinophilia occurs with increased IL-4, IL-5, and IL-13 production in B-cell lymphoma 6 (Bcl6)-knockout (KO) mice, suggesting that Bcl6 participates in allergy pathogenesis and that it may be important for reducing TH2 immune responses. However, the T cell-intrinsic function of Bcl6 in TH2 cell responses remains unclear. Bcl6-binding DNA sequences resemble STAT protein-bound motifs (10), indicating that Bcl6 may repress TH2 cytokine expression by competitively inhibiting the binding of STAT factors to GAS sites in target genes (5, 11–13), including TH2 cytokine gene loci (14). We previously identified Bcl6/STAT-binding sequences (BSs) (15) in CNS1 (BS1), IL-4 promoter region (BS2), and DNase hypersensitive site 2 (HS2) (BS3, BS4) and HS3 (BS5, BS6) in intron two and the 3′ region of CNS2 (BS7) in the Il4 locus; BSIL5 sequences in the Il5 locus (14); and BSIL13 sequences in the Il13 locus. We, furthermore, reported that Bcl6 repressed Il4 and Il5 expression by binding to genomic DNA in naïve CD4+ T cell-derived memory (NAM) TH2 cells (14, 15), identifying Bcl6 as a critical regulator of TH2 cytokine production in memory CD4+ T cells in addition to its role in the maintenance and survival of the cells (15–17). Conversely, T follicular helper (TFH) cell differentiation may result from Bcl6-mediated suppression of the differentiation of other TH cell lineages in vivo (18–20). Thus, the role of Bcl6 in the regulation of TH2 cytokine production in pathophysiological settings remains unclear. We focused on a CD4+ T cell subset, namely, naturally occurring memory phenotype CD4+ T (MPT) cells (21–27). These are derived from CD4+ T cells that naturally exhibit memory cell markers (CD44high CD25− CD49b−) without antigen stimulation, rather than from memory CD4+ T cells differentiated from naïve CD4+ T cells after antigen stimulation. A small subset of MPT cells and their derived MPTH2 cell populations, but not naïve CD4+ T cell-derived TH2 cells (NATH2 cells), have an active conserved noncoding sequence 2 (CNS2) 3′ distal enhancer region in the Il4 locus similar to that in natural killer T cells, producing IL-4 without T cell receptor (TCR)-mediated stimulation (28). CNS2-active MPT cells are candidate cells that initially produce IL-4 to promote TH2 cell differentiation, and thus, they may be involved in allergy pathogenesis, although the mechanisms remain unclear. Because Bcl6 expression is extremely high in CNS2-active MPT cells (29), we hypothesized that Bcl6 regulates allergen-mediated MPT cell activation in TH2 cell-dependent allergies.
Materials and Methods
Antibodies (Abs) and Reagents
Allophycocyanin-conjugated anti-CD4 monoclonal antibody (mAb, GK1.5), anti-IL-4 mAb (11B11), anti-IFN-γ mAb (R4-6A2), anti-CD62L mAb (MEL-14), anti-CD44 mAb (IM7), PE-conjugated anti-IL-4 mAb (BVD4-1D11), PE-conjugated KJ1-26 (anti-clonotypic mAb for DO11.10 TCR, KJ1-26), anti-CD11c mAb (HL3), unconjugated anti-IL-4 mAb (11B11), anti-IL-12 mAb (C17.8), anti-IFN-mAb (R4-6A2), anti-CD44 mAb (IM7), FITC-conjugated anti-CD49b mAb (DX5), and PerCP-conjugated anti-CD4 mAb (GK1.5) were purchased from BD Bioscience. Anti-STAT5 Abs (C-17), anti-STAT6 Abs (N-20), anti-Bcl6 Abs (N-3), anti-tubulin Abs (H-235), and normal rabbit IgG were purchased from Santa Cruz Biotechnology. FITC-conjugated anti-T1/ST2 (IL-33R) mAb (DJ8) was purchased from MD Bioproducts. Mouse rIL-2, rIL-4, rIL-7, rIL-12, and rIL-33 were purchased from PeproTech. Anti-CD3ε mAbs (145-2C11) were purchased from Cedar Lane. Anti-CD28 mAbs (PV-1) were purchased from Southern Biotechnology. The ovalbumin (OVA) peptide (Loh15: residues 323–339; ISQAVHAAHAEINEAGR) was synthesized by BEX Co. Ltd. (Tokyo, Japan). The Bcl6 inhibitory peptide was synthesized by Scrum Inc. (Tokyo, Japan).
Animals
Bcl6-transgenic (TG) mice with exogenous Bcl6 under Lck proximal promoter control (17, 30), Bcl6-KO mice (31), and highly conserved intron enhancer (hcIE)-KO mice on a BALB/c background (Japan SLC) were described previously (15). CNS2-green fluorescent protein (GFP)-TG mice were gifted by Dr. Masato Kubo (28). Some Bcl6-TG, Bcl6-KO, and hcIE-KO mice were crossed with OVA-specific TCRαβ (DO11.10) and/or CNS2-GFP-TG mice. All mice were used at 8–12 weeks of age.
CD4+ T Cell Purification and TH Cell Induction
Naïve CD44low CD62L+ CD4+ T cells, CD44high CD62L− CD4+ MPT cells, transferred T cells, dendritic cells (DCs), and T cell-deleted splenocytes were isolated from murine spleens using a cell sorter (FACSVantage, BD Biosciences). Sorted T cells (2 × 10⁵ cells/mL) from DO11.10 background mice were stimulated with OVA peptides (Loh15) (1 µg/mL) plus irradiated or CD11C+ DCs (4 × 10⁴ cells/mL) or splenocytes (1 × 10⁶ cells/mL), depleted of CD4+ and CD8+ T cells, and used as antigen-presenting cells (APCs) in the presence of rIL-2 (25 U/mL) (TH0 condition). In addition to primary TCR-mediated stimulation with OVA, stimulation with soluble anti-CD3 (2 µg/mL) and anti-CD28 mAbs (2 µg/mL) was employed for some experiments. For TH1 or TH2 polarization, cells were cultured in the presence of rIL-12 (100 U/mL)/anti-IL-4 mAb (5 µg/mL) or rIL-4 (1,000 U/mL)/anti-IL-12 mAb (10 µg/mL), as previously described (15). In some experiments, anti-IL-4 mAbs or anti-IFN-γ mAbs were added to the TH0 condition cultures. On days 3 and 5, activated naïve T cells and MPT cells were stimulated with rIL-2 (25 U/mL) and rIL-7 (10 U/mL) following primary stimulation. NATH2 cells were further cultured with IL-7 for 21 days to yield NATH2 cell-derived memory-like TH2 (NAM-LTH2) cells, which have a functional phenotype similar to NATH2 cell-derived memory (NAMTH2) cells in vivo (15). Some MPT cells were cultured in the presence of IL-33 (0–100 ng/mL) with or without IL-7 for the appropriate times as shown in each experiment prior to analysis of chromatin immunoprecipitation (ChIP) assays and the effect of TCR stimulation on cytokine production.
Fluorescence-Activated Cell Sorting (FACS) Analysis
As previously described (15, 17), T cells with or without 8 h of restimulation were treated with monensin (2 µM) for the last 3 h, followed by staining with an appropriate combination of FITC-conjugated anti-KJ1-26, APC-conjugated anti-CD44, and PerCP-conjugated anti-CD4 mAbs. For staining, cells were washed once with FACS buffer (PBS with 3% fetal calf serum and 0.1% sodium azide) and then permeabilized with Perm2 (BD Biosciences) for 10 min at room temperature, followed by two washes in FACS buffer. Finally, cells were stained with an appropriate combination of anti-IFN-γ-APC and anti-IL-4-PE for 30 min at room temperature, washed, and resuspended in FACS buffer for analysis.
Cytokine Concentrations
IL-4, IL-5, and IL-13 levels in the culture supernatants of cells that were stimulated for 48 h in bronchoalveolar lavage fluid (BALF) were determined using ELISA kits (R&D Systems, Minneapolis, MN, USA). IgE anti-OVA Abs were detected using a mouse anti-OVA IgE Antibody Assay Kit (Chondrex, Redmond, WA, USA).
mRNA Measurements
cDNA synthesized from total RNA using the SuperScript III First-Strand Synthesis System (Invitrogen) was used for qRT-polymerase chain reaction (PCR) analysis as described previously (15). Real-time PCR was performed in 25 µL reaction volumes containing iQ SYBR-Green Supermix, 200 nM of each primer, and 0.5 µL of cDNA. The PCR cycle parameters were 3 min at 95°C and 40 cycles of 30 s at 95°C, 30 s at 60°C, and 30 s at 72°C, followed by melting curve analysis. Relative quantification of cytokine mRNA expression was performed using the comparative Ct method. The relative quantification value of the target in stimulated T cells, normalized to the β-actin gene expression level (endogenous control) and relative to a calibrator, was expressed as 2−ΔΔCt (fold), where ΔCt = Ct of the target gene − Ct of the endogenous control gene (β-actin) and ΔΔCt = ΔCt of stimulated samples for target gene − ΔCt of the untreated control as a calibrator for the target gene. All data in stimulated T cells were expressed as arbitrary units relative to the expression level in the corresponding unstimulated T cells. The primers were as follows: β-actin: 5′-CCAGCCTTCCTTCTTGGGTAT-3′ (forward), 5′-TGGCATAGAGGTCTTTACGGATGT-3′ (reverse); Il4: 5′-TCTCGAATGTACCAGGAGCCATATC-3′ (forward), 5′-AGCACCTTGGAAGCCCTACAGA-3′ (reverse); Il5: 5′-CGATGAGGCTTCCTGTCCCTA-3′ (forward), 5′-TTGGAATAGCATTTCCACAGTACCC-3′ (reverse); Il13: 5′-CAATTGCAATGCCATCTACAGGAC-3′ (forward), 5′-CGAAACAGTTGCTTTGTGTAGCTGA-3′ (reverse); Gata3: 5′-AGAGATTTCAGATCTGGGCAATGG-3′ (forward), 5′-CAGGGACTGATTCACAGAGCATGTA-3′ (reverse); Bcl6: 5′-CCGGCTCAATAATCTCGTGAA-3′ (forward), 5′-GGTGCATGTAGAGTGGTGAGTGA-3′ (reverse).
Chromatin Immunoprecipitation
The ChIP assay was performed as previously described (14, 15). Protein and chromatin in TH cells were cross-linked by adding formaldehyde solution (Thermo Fisher Scientific, Waltham, MA, USA), after which the cells were lysed in SDS lysis buffer. Subsequently, precleared, sonicated chromatin and protein G agarose (Millipore) were incubated with specific Abs for the protein of interest or control IgG (rabbit). Some of the untreated chromatin was used as an input sample. qPCR was used to quantify the DNA region in the immune-precipitated chromatin and the input DNA. Relative ChIP DNA quantification was performed using the comparative Ct method. The Ct value of ChIP DNA was normalized to that of the input DNA using the following equation: ΔCt (normalized ChIP) = Ct (ChIP) − Ct (input). The normalized Ct values were adjusted to the normalized background Ct value (ΔΔCt [ChIP/IgG] = ΔCt [normalized ChIP] − ΔCt [normalized IgG]). ChIP enrichment above the sample specific background was calculated as 2−ΔΔCt (ChIP/IgG) and reported as a fold change. The following primers were used for qPCR: Il5BS: 5′-TGGGCCTTACTTCTCCGTGTAACT-3′ (forward), 5′-CTCCAGTGACCCTGATACCTGAAT-3′ (reverse); Il13BS: 5′-TTCTACTAGCTCGGGACTCTTCCA-3′ (forward), 5′-ATGGACATGACATGGGAAACCCAG-3′ (reverse); BS1: 5′-AGGTCCATGGAAGGGACAGATCA-3′ (forward), 5′-CGGATCCTTTCCTGGAATTGCTGA-3′ (reverse); BS2: 5′-TCCAATTGGTCTGATTTCACAGGA-3′ (forward), 5′-ACACCAGATTGTCAGTTATTCTGGGC-3′ (reverse); BS3: 5′-ACAGATGTGACAGGCTGATAGTGC-3′ (forward), 5′-GGCCTTTCATTCTCAGTGGTGTGT-3′ (reverse); BS4: 5′-CCTGGCTTCTGAGATGCAATGAGT-3′ (forward), 5′-GGGTAAGAGGAAAGCCAGCATGA-3′ (reverse); BS5: 5′-TTCAAGGATAAGCAAGTGGCAGGC-3′ (forward), 5′-ATTGGAACTAAGCCAGCCGATGGA-3′ (reverse); BS6: 5′-CGCCTCTCCTGTAAGGTACACAAT-3′ (forward), 5′-TTGCCTTGCAACCATGAAGACCTG-3′ (reverse); BS7: 5′-CACTCACCAATTTGTCTGGAGGCT-3′ (forward) 5′-ATGGTGATCACAGTCCAAGTCCAG-3′ (reverse).
Retroviral Vectors With a d2EGFP Reporter Gene
A genomic fragment of the Il4 promoter (p) region (positions −751 to +1 relative to the transcription start site, MGI: 96556), hcIE (222 bp), and CNS2 (337 bp) were amplified by PCR. The fragment of the Il4 promoter region was subcloned upstream of d2-enhanced GFP (d2EGFP) in the retrovirus vector pBABE delta Bll(−). Fragments of hcIE (222 bp) or CNS2 (337 bp) were subcloned downstream of d2EGFP to generate pBABE delta Bll(−)-Il4p-d2EGFP-hcIE or pBABE delta Bll(−)-Il4p-d2EGFP-CNS2, respectively. pBABE delta BII(−) is based on pBABEpuro (3) (gifted by Dr. H. von Melchner, University of Frankfurt Medical School). PCR-based mutagenesis of G3 and BS3 in hcIE and BS7 (1) and (2) in CNS2 was achieved using a QuickChange XL Site-Directed Mutagenesis Kit (Stratagene). Specifically, a fragment of d2EGFP cDNA was PCR amplified using an XhoI-anchored sense primer (underlined) (5′-CCGCTCGAGTCTAGAGGATCCACCGGTCGC-3′) immediately upstream of the XbaI site (+258) and an antisense primer with a SalI-anchored antisense primer (underlined) (5′-ACGCGTCGACTCTAGAGTCGCGGCCGCATC-3′) immediately downstream of the XbaI site (+1147) of pd2EGFP. The XhoI/SalI fragment of d2EGFP was subcloned into a T Easy vector (d2EGFP-T vector). The EcoRI-digested d2EGFP fragment was blunted and subcloned into a blunted NotI/NcoI-restricted pMX vector (pMX-d2EGFP). A genomic fragment of the Il4 promoter region was PCR amplified using the EcoRI-anchored sense primer (underlined) (5′-GAATTCCTCCACACTGATGCTGTAGTGC-3′) and XhoI-anchored antisense primer (underlined) (5′-CTCGAGGCTAACAATGCTGGC-3′). The subcloned Il4 promoter fragment was then digested with EcoRI and XhoI and subcloned into the restricted site of pMX-d2EGFP (pMX-Il4p-d2EGFP). An EcoRI and SalI fragment of pMX-Il4p-d2EGFP was then subcloned into the EcoRI/SalI-restricted pBABE delta Bll(−) to generate pBABE delta Bll(−)-Il4p-d2EGFP. The vector pBABE delta BII(−) is based on pBABEpuro, with further modifications to completely destroy the endogenous transcriptional regulatory sequences within the retroviral long terminal repeat (LTR). R and U5 are the intact R and U5 regions of MMLV, respectively, en. del. U3 is the SIN U3 found in proviral LTRs after integration of the virus into the host genome, and partial LTR denotes a transcription-competent part of the LTR that is used to drive transcription of the genomic viral RNA in the packaging cells. The hcIE genomic fragments were PCR amplified with the XhoI-anchored sense primer (underlined) (5′-CCGCTCGAGCCTTTCTGCCTGCTGCTCTG-3′) and SalI-anchored antisense primer (underlined) (5′-ACGCGTCGACGAAAAGCAGGCAGTCTGGAG-3′).
Conserved noncoding sequence 2 fragments were obtained by PCR using the XhoI-anchored sense primer (underlined) (5′-CCGCTCGAGCTGGAGATTAGAAGTGGAGGCT-3′) and SalI-anchored antisense primer (underlined) (5′-ACGCGTCGACTTTCCTGTCCTCGTCTTTTCCAGT-3′). The hcIE and CNS2 fragments were then inserted in SalI-digested pBABE delta Bll(−)-Il4p-d2EGFP to generate pBABE delta Bll(−)-Il4p-d2EGFP-hcIE and pBABE delta Bll(−)-Il4p-d2EGFP-CNS2, respectively, for reporter gene assays. PCR-based mutagenesis of G3 (5'-CTGATAGTG-3′: +1247 to +1255), BS3 (5′-TTCATGGAA-3′: +1328 to +1336) in hcIE, and BS7 (1) (5′-GTTTTTGAA-3′: +12941 to +12949) and BS7 (2) (5′-TTCCTGGA-3′: +13142 to +13149) in CNS2 in the reporter plasmid were generated using a QuickChange XL Site-Directed Mutagenesis Kit according to the manufacturer’s instructions. The underlined nucleotides were substitutes for CTAT for G3 and TT for BS3 and BS7 to generate pBABE delta Bll(−)-Il4p-d2EGFP-hcIE-MutBS3, pBABE delta Bll(−)-Il4p-d2EGFP-hcIE-MutG3, pBABE delta Bll(−)-Il4p-d2EGFP-CNS2-MutB7 (1), and pBABE delta Bll(−)-Il4p-d2EGFP-CNS2-MutB7 (2), respectively. Successful PCR and mutation were verified by DNA sequencing.
Retrovirus Infection
Platinum-E packaging cells (32) were transfected with 1–1.5 µg of DNA of a retrovirus construct mixed with 6 µL of Fugene (Boehringer Mannheim). Virus supernatant was concentrated by centrifugation (8,000 × g, 16 h) and added to TH2 cell-inducing cultures on day 2. Intracellular cytokine staining or mean fluorescence intensity (MFI) analysis was performed on day 7 as described previously. Infected cells were subjected to FACS analysis of the intracellular fluorescence of d2EGFP 8 h after restimulation with plate-bound anti-CD3 mAbs.
Western Blot Analysis
In vitro-differentiated TH2 cells were lysed with lysis buffer (1% Nonidet P-40, 5% glycerol, 50 mM Tris–HCl, pH 7.5, 100 mM NaCl, 10 µg/mL leupeptin, 0.1 mM phenylmethylsulfonyl fluoride, 1 mM dithiothreitol, 1 µg/mL pepstatin A, 10 mM Na3VO4, and 10 mM NaF). For immunoblotting, anti-Bcl6 or anti-β-tubulin Ab was used. Immunoreactive bands were visualized using a Phototope-HRP Western Blot Detection System (Cell Signaling Technology). For quantitative analysis of Western blots, the intensities of individual bands were quantified using ImageJ software (National Institutes of Health, Bethesda, MD, USA).
Antigen-Induced Airway Inflammation
OVA Challenge and Bronchoalveolar lavage (BAL)
TH2 cells (1.5 × 10⁷ or 3 × 10⁷) were injected intravenously into naïve wild-type (WT) BALB/c mice (day 0), followed by intratracheal challenge with 1% OVA solution (50 µL) twice (days 2 and 3), BAL three times (days 2, 7, and 12), and serum collection. On days 4 and 5, the transferred TH2 cells isolated from whole lungs and BALF were collected from the mice by instilling the lungs with 0.5 mL of PBS six times. Sera on day 14 were analyzed for OVA antigen-specific IgE Abs. In another experiment, a mixture of Bcl6-WT, Bcl6-TG, or Bcl6-KO KJ1-26+ MPT (2 × 10⁶ cells) and Bcl6-WT KJ1-26− naïve CD4+ T (5 × 10⁶ cells) cells were intravenously transferred into BALB/c nu/nu mice (day 0). Subsequently, mice were sensitized via i.p. injection of 10 µg of OVA plus 1 mg of alum twice (days 1 and 6), followed by intratracheal challenge with OVA twice (days 16 and 17). BAL and pathology examination were performed (day 18), and transferred KJ1-26− cells were isolated from spleens (day 16). The isolated cells were restimulated with plate-bound anti-CD3 mAbs to analyze cytokine production. The BALF supernatant was stored at −80°C. Each cell pellet was resuspended in PBS for counting and subjected to cytospin. Preparations on slides were stained with Diff-Quick (Sysmex International Reagents, Kobe, Japan) for the differential analysis of cell counts. After BAL, lungs were treated with collagenase II (1 mg/mL) for 30 min at 37°C, and leukocytes were isolated on a Percoll gradient.
Histologic Examination
After BAL, the left lobes of lungs were extracted, washed with PBS, and fixed in 4% formaldehyde in sodium phosphate buffer for more than 2 days at room temperature. After fixation, lungs were embedded in paraffin and stained with hematoxylin and eosin. Images of each tissue section were captured using a Zeiss Axioscope 2 microscope equipped with a video camera (AxioCam ERc5s, Carl Zeiss, Jena, Germany) and processed using Axiovision V.4 software (Carl Zeiss).
Statistical Analysis
Statistical significance was determined using t-tests (two-tailed) for two groups and Tukey–Kramer or Steel–Dwass multiple comparisons tests for three or more groups. P values < 0.05 were considered significant.
Results
Bcl6 Represses IL-4 Production by MPT Cells
Splenic CNS2-active MPT cells were detected as a GFP+ subpopulation in reporter gene TG mice (CNS2-GFP-TG) on each Bcl6 genotype background (28) (Figure 1A). Unfortunately, offspring from CNS2-GFP-TG mice on the Bcl6-KO background could not be obtained (Figure 1B). Although the percentages of GFP+ cells were similar between Bcl6-TG and Bcl6-WT mice (Figure 1C), the IL-4+ MPT cell frequency (Figure 1D) and MFI of CNS2-GFP in MPT cells (Figure 1E) were inversely correlated with Bcl6 levels. GFP+ MPT cells displayed significant Il4 expression, which was lower in Bcl6-TG cells than in WT cells (Figure 1F). Il4 expression was extremely low in the GFP− population regardless of Bcl6 levels. The absolute numbers and percentages of IL-4+ MPT cells were also negatively associated with Bcl6 levels (Figure 1G), whereas the absolute numbers of GFP+ MPT cells (Figure 1H) and MPT cells (Figure 1I) among all CD4+ T cells were positively correlated with Bcl6 levels. Therefore, Bcl6 may be involved in Il4 downregulation in MPT cells and MPT cell survival and maintenance. Because it has been reported that the TH2 and TH1 conditions are promotive and inhibitory, respectively, on the maintenance of Bcl6-WT CNS2-GFP+ MPT cells (28), we analyzed the effect of Bcl6 on the maintenance of CNS2-GFP+ MPT cells in each culture setting (Figure S1 in Supplementary Material). Regarding the maintenance of GFP+ cells, a promoting effect of the TH2 condition and inhibitory effect of TH1 condition were observed regardless of the Bcl6 genotype, whereas Bcl6 appears to function as a suppressor for CNS2 activity.
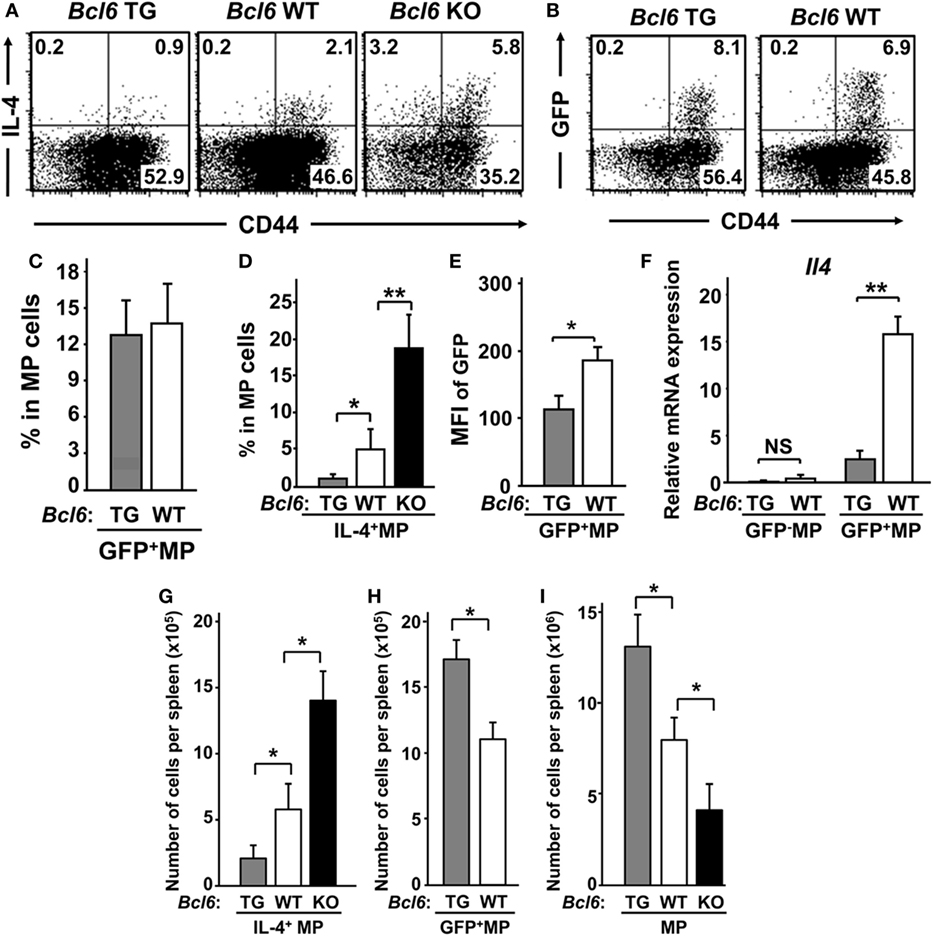
Figure 1. IL-4+ MPT cells in mice with varying genetic Bcl6 expression. (A,B) FACS analysis of intracellular IL-4+ [(A) Bcl6-TG, Bcl6-WT, and Bcl6-KO] and CNS2-activation-related GFP+ [(B) Bcl6-TG and Bcl6-WT] MPT cells in a CD44high population by gating CD4+ CD49b− T splenocytes at rest. The presented data are representative of four independent experiments. The numbers in the corners represent the percentages of gated T cells. (C,D) Frequency of GFP+ [(C) Bcl6-TG and Bcl6-WT] and IL-4+ [(D) Bcl6-TG, Bcl6-WT, and Bcl6-KO] MPT cells. (E) MFI of GFP in MPT cells from Bcl6-TG and Bcl6-WT mice. (F) qRT-PCR analysis of the relative expression of Il4 in GFP− and GFP+ MPT cells from Bcl6-TG and Bcl6-WT spleens. (G–I) Absolute cell numbers of populations of IL-4+ [(G) Bcl6-TG, Bcl6-WT, and Bcl6-KO], GFP+ [(H) Bcl6-TG and Bcl6-WT], and total (I) MPT cells in one spleen. Data are presented as the mean ± SEM (n = 7–9). *P < 0.05; **P < 0.01, comparison between two groups as indicated. Bcl6, B-cell lymphoma 6; CNS, conserved noncoding sequence; FACS, fluorescence-activated cell sorting; GFP, green fluorescent protein; KO, knockout; MFI, mean fluorescence intensity; MPT cell, memory phenotype CD4+ T cell; NS, not significant; TG, transgenic; WT, wild-type.
Bcl6 Represses Il4 Expression in TH2-Primed MPT Cells
To investigate the function of Bcl6 in the differentiation of MPT cells into TH cell lineages following TCR stimulation, MPT cells expressing a clonotypic TCR (KJ1-26+) from the spleens of Bcl6-TG, Bcl6-KO, and Bcl6-WT DO11.10 TG mice were cultured under conditions driving them toward the TH0, TH1, or TH2 phenotype, followed by intracellular IL-4 analysis after restimulation with anti-CD3 mAbs (Figures 2A,B). Under the TH0 condition, Bcl6 decreased IL-4 production in a concentration-dependent manner, and high Bcl6 expression facilitated IFN-γ induction during TH1 phenotype differentiation. Under the TH1 condition, Bcl6 deficiency in MPT cells preserved IL-4 production, although its level was lower than that under the TH0 condition. Under the TH2 condition, Bcl6 negatively regulated MPT cell-derived TH2 (MPTH2) cell differentiation but not NATH2 differentiation, as previously reported (15) (Figures 2A,B), although Bcl6 could suppress the initial IL-4 production by naïve CD4 T cells under the TH0 condition even when blocking the effects of IFN-γ (Figure S2 in Supplementary Material). Because Bcl6 appears to promote IFN-γ production, which may indirectly affect IL-4 induction, we analyzed a mixed culture of Bcl6-WT MPT cells with either Bcl6-TG or Bcl6-KO cells under the TH0 condition. Bcl6-KO MPT cells caused WT cells to skew clearly toward the TH2 phenotype with reduced TH1 skewing, whereas Bcl6-TG cells promoted slight TH skewing (Figure S3 in Supplementary Material), indicating that increased IL-4 production in Bck6-KO MPT cells autoaccelerates TH2 cell differentiation by preventing TH1 cell differentiation. Thus, Bcl6 appears to promote IFN-γ production by inhibiting IL-4 production rather than inhibiting IL-4 production via the promotion of IFN-γ production.
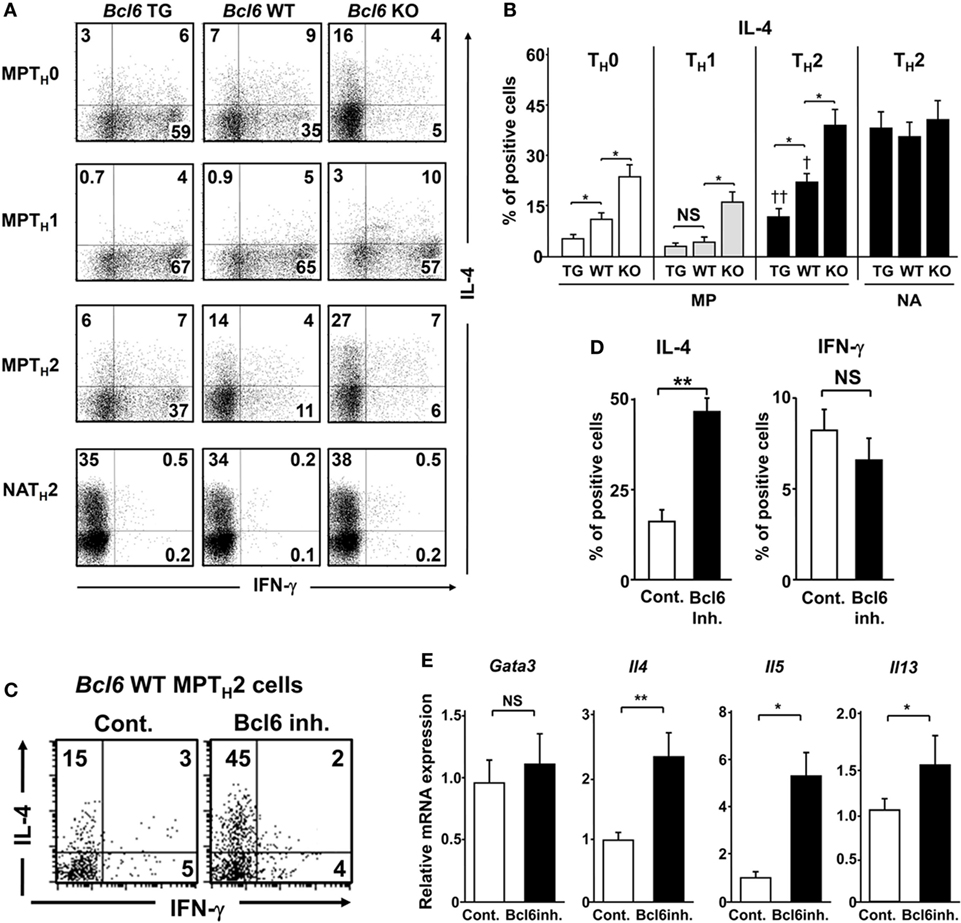
Figure 2. Regulatory role of Bcl6 in the differentiation of TH2 cells. (A–E) KJ1-26+ MPT and NA T cells (CD4+ CD44l°w CD62L+) among splenocytes from Bcl6-TG, Bcl6-WT, and Bcl6-KO DO11.10 mice cultured with ovalbumin peptides and antigen-presenting cells in vitro for 7 days to produce TH0, TH1, and TH2 cells. Cells were restimulated with anti-CD3 monoclonal antibodies. After 8 h, IL-4- and IFN-γ-producing cells among gated KJ1-26+ CD4+ T cells were analyzed by FACS. (C–E) Analysis of cytokine production by Bcl6-WT MPTH2 cells treated with a Bcl6 inhibitor (inh.) for 12 h prior to restimulation. (A,C) Numbers in the corners represent percentages among gated T cells. (B,D) Percentage of IL-4+ (Bcl6-TG, Bcl6-WT, and Bcl6-KO) cells for each TH cell type (B) and IL-4+ and IFN-γ+ Bcl6-WT MPTH2 cells cultured with or without Bcl6 inhibitor (D). (E) qRT-PCR analysis of the relative expression of Gata3, Il4, Il5, and Il13 in restimulated Bcl6-WT MPTH2 cells treated with or without a Bcl6 inhibitor. Data are presented as the mean ± SEM (n = 7–8). *P < 0.05, **P < 0.01, comparison between two groups is indicated; †P < 0.05, compared with Bcl6-WT. All results are representative of five independent experiments with similar outcomes, excluding (C), for which four experiments were conducted. Bcl6, B-cell lymphoma 6; Cont., control; FACS, fluorescence-activated cell sorting; KO, knockout; MPT cell, memory phenotype CD4+ T cell; MPTH2 cell, MPT cell-derived TH2 cell; NA, naïve; TG, transgenic; WT, wild-type.
To confirm the suppressive effects of Bcl6 on TH2 cytokine genes in MPTH2 cells, Bcl6-WT MPTH2 cells were treated with a Bcl6 inhibitor (15), followed by restimulation with anti-CD3 mAbs. Bcl6 inhibition augmented IL-4 production but not IFN-γ production (Figures 2C,D). TH2 cytokine gene expression was upregulated by the inhibitor without changes in Gata3 expression (Figure 2E), indicating that Bcl6 suppresses Il4 expression in developing and differentiated MPTH2 cells.
Bcl6 Negatively Regulates the Histone Modification of TH2 Cytokine Loci in MPTH2 Cells
Because unprimed MPT cells express higher Bcl6 levels than naïve CD4+ T cells (29), Bcl6 expression levels in the MPT and MPTH2 cells of CNS2-GFP-TG mice with Bcl6-WT background were analyzed at rest (Figure 3A). Bcl6 expression in GFP+ MPT and GFP− MPTH2 cells was increased by sevenfold and threefold, respectively, compared with that in GFP+ MPTH2 cells. NATH2 cells had markedly lower Bcl6 expression than GFP+ MPTH2 cells. Bcl6 expression in GFP+ MPT cells was slightly increased compared with that in GFP− MPT cells. Consistent with the mRNA levels, Bcl6 protein expression was lower in GFP+ MPTH2 cells than in GFP− MPTH2 cells (Figure 3B). Bcl6 protein levels in MPT cells from Bcl6-WT mice were higher than those in MPTH2 cells, whereas the protein levels in GFP+ MPT cells were slightly higher than those in GFP− MPT cells. To address Bcl6 function, TH2 cytokine production by MPTH2 cells from Bcl6-WT-CNS2-GFP-TG mice was analyzed. TH2 cytokine protein (Figure 3C) and transcript levels (Figure 3D) were significantly greater in the GFP+ population than in the GFP− population following stimulation, implying that Bcl6 function may be inhibited depending on its quantity and/or quality and that this inhibition may be involved in TH2 cytokine production in MPTH2 cells. Conversely, IFN-γ protein (Figure 3C) and transcript levels (Figure 3D) were undetectable and minimal, respectively, in both the GFP+ and GFP− populations. Because Bcl6 binds to BSs (except BSIL13) (Figure 3E, top) and thereby reduces TH2 cytokine production in NAMTH2 cells (15), Bcl6 binding to each site in MPTH2 cells was analyzed by ChIP (Figure 3E, bottom). In Bcl6-WT and Bcl6-TG MPTH2 cells, Bcl6 binding was observed at all BS sites excluding BSIL13, BS1, and BS2. GFP+ cells had significantly less Bcl6 binding than GFP− cells among Bcl6-WT and Bcl6-TG MPTH2 cells, whereas Bcl6 binding was augmented in Bcl6-TG MPTH2 cells. Thus, Bcl6 repressor functions may be regulated qualitatively (e.g., its binding ability) and quantitatively by its binding to TH2 cytokine gene foci. To investigate the effects of Bcl6 of STATs on histone modification in these foci, ChIP was performed for STAT5 and STAT6 binding to BSs and for histone H3 acetylation in MPTH2 cells (Figure 3F). STAT6 binding was marginal, whereas STAT5 binding was significantly decreased depending on Bcl6 levels, as indicated by attenuated histone acetylation.
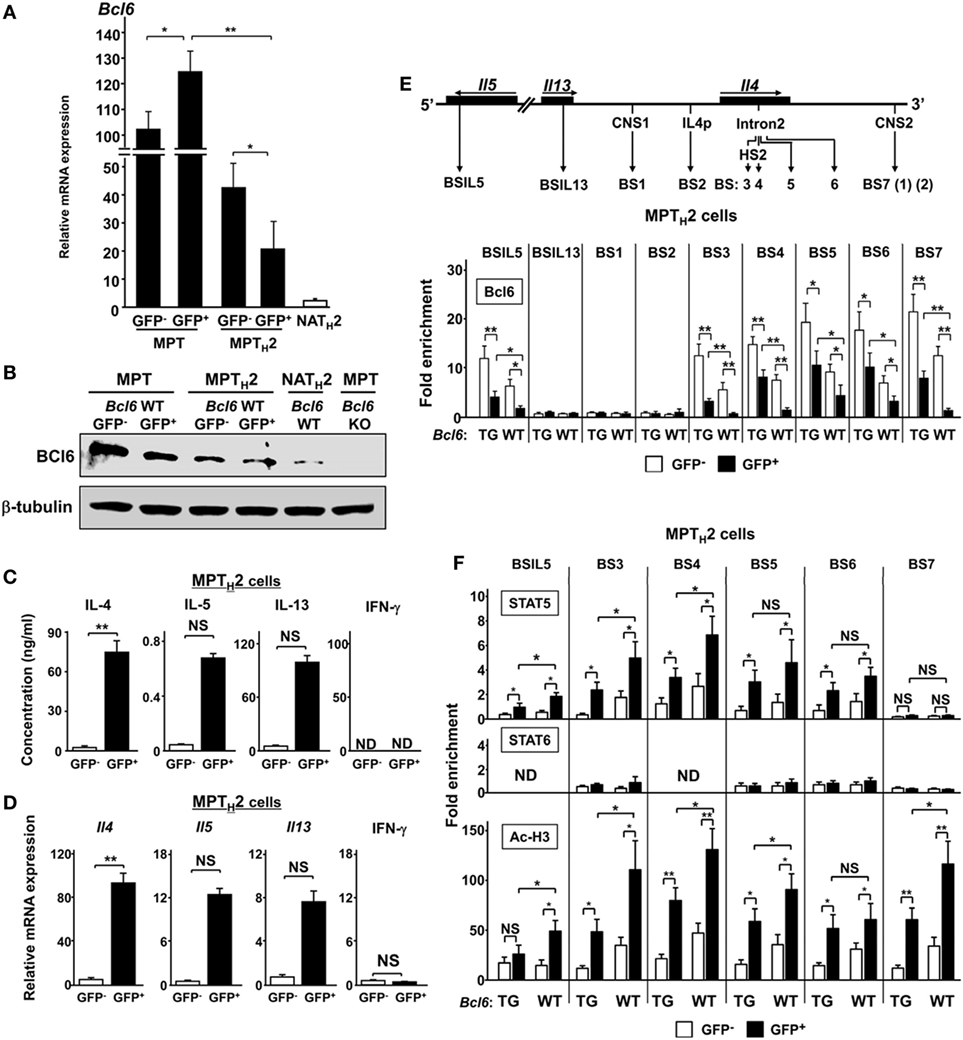
Figure 3. Role of Bcl6 and signal transducer and activator of transcription (STAT) binding to the Il4 locus MPT cells. (A) Bcl6 mRNA levels in GFP+ and GFP− MPT cells, GFP+ and GFP− MPTH2 cells, and NA TH2 cells, as measured by qRT-PCR. (B) Western blot analysis of Bcl6 protein in GFP+ and GFP− MPT cells MPT (Bcl6-WT) and MPT cells (Bcl6-KO) in the spleen and GFP+ and GFP− MPTH2 cells (Bcl6-WT). Data are representative of three independent experiments. (C,D) KJ1-26+ cells among MPT cells from the spleens of Bcl6-WT-CNS2-GFP-TG DO11.10 mice were cultured with ovalbumin peptides and antigen-presenting cells in vitro for 7 days under TH2 conditions. Cells were restimulated with anti-CD3 and anti-CD28 monoclonal antibodies. After 48 h, IL-4, IL-5, IL-13, and IFN-γ levels in culture supernatants were measured by ELISA (C). After 8 h, the mRNA levels of Il4, Il5, Il13, and Ifn-γ were measured by qRT-PCR (D). [(E), top] Diagram of TH2 cytokine gene loci, with regulatory regions indicated by arrows [CNS, gene promoter regions (p), and Bcl6/STAT (BSs): IL5BS in Il5; IL13BS in Il13 intron 1; BS1 and BS7 (1) (2) in CNS1 and CNS2, respectively; BS2 in Il4p; and BS3, BS4, and BS5 in Il4 intron 2]. (E,F) Bcl6 levels [(E) bottom], STAT5 and STAT6 binding, and Ac-H3 (F) at each BS were analyzed by chromatin immunoprecipitation assay for CNS2-active (GFP+) (closed bar) and CNS2-inactive (GFP−) (open bar) MPTH2 cells. All results are representative of three (A,C,D) or four (E,F) independent experiments with similar outcomes. Data are presented as the mean ± SEM (n = 7–9). *P < 0.05, **P < 0.01, comparison between two groups is indicated. Ac-H3, acetylated histone H3; CNS, conserved noncoding sequence; BS, binding sequence; Bcl6, B-cell lymphoma 6; GFP, green fluorescent protein; KO, knockout; ND, not detected; MPT cell, memory phenotype CD4+ T cell; MPTH2 cell, MPT cell-derived TH2 cell; NA, naïve; TG, transgenic; WT, wild-type.
Bcl6 Represses Il4 Expression by Binding to CNS2 in MPTH2 Cells
B-cell lymphoma 6, but not STAT proteins, binds to BS7 (Figures 3D,E) in the major Il4 regulatory region. Although no significant Bcl6-mediated interaction was observed between BS7 in CNS2 regarding Il4 regulation in NAMTH2 cells (15), CNS2 enhancer activity may be suppressed by Bcl6 through BS7 binding. FACS analysis indicated that GFP MFI levels related to CNS2 activation in MPT cells, including at two mutated sites, namely, BS7 (1) and (2) (Figure 4A), were inversely correlated with Bcl6 levels (Figure 1E). Therefore, the role of Bcl6 in enhancing activity in MPTH2 cells from Bcl6-WT or Bcl6-KO mice was investigated using a retrovirus reporter gene transfer vector (Figure 4B) designed to assess Il4 promoter (p) activity by measuring the MFI for d2EGFP, a reporter protein, following stimulation with anti-CD3 and anti-CD28 mAbs (Figures 4C,D). Additionally, a CNS2 sequence containing WT or mutated BS7, that is, Mu-BS7 (1)-CNS2 and Mu-BS7 (2)-CNS2, were inserted downstream of d2EGFP (Figure 4B). The MFI for d2EGFP with CNS2-WT elements in Bcl6-KO cells was higher than that in Bcl6-WT cells. The MFI was augmented by mutations in both BS7 (1) and (2) in Bcl6-WT cells, whereas that of Bcl6-KO cells was not significantly changed (Figures 4C,D). Thus, Bcl6 mediated CNS2 suppression in MPTH2 cells and presumably in unprimed MPT cells.
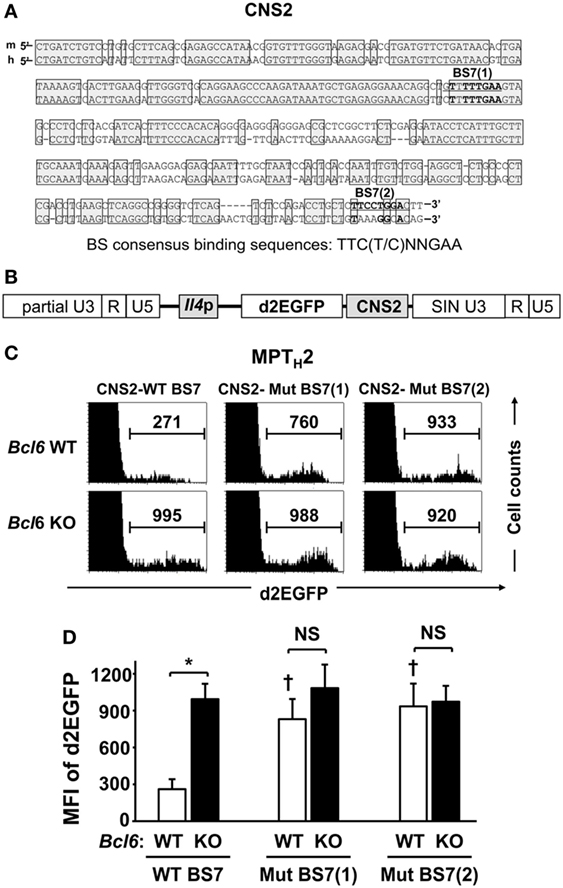
Figure 4. Role of Bcl6 in the CNS2 enhancer activity of MPTH2 cells. (A) A conserved sequence (positions +12805 to +13151 relative to the transcription start site; Mouse Genome Informatics accession no. 96556) in the CNS2 region of mice is shown with human CNS2, including BS7 (1) and (2). Conserved sequences between mice and humans are indicated by shaded boxes. (B,C) Splenic Bcl6-KO and Bcl6-WT MPT cells were cultured under TH2 conditions, and a retrovirus containing the d2EGFP reporter gene, with CNS2-WT BS7 (B), CNS2-Mut BS7 (1), or CNS2-Mut BS7 (2), was introduced into TH2 cells on day 2 of culture. After 7 days of culture, cells were restimulated with anti-CD3 monoclonal antibodies for 8 h and subjected to FACS analysis of the intracellular MFI of d2EGFP. (C) Histograms of FACS analysis are representative of eight to nine independent experiments. Numbers in each column represent the MFI of d2EGFP. (D) Mean values of the MFI of d2EGFP are indicated. Data are presented as the mean ± SEM (n = 8–9). *P < 0.05, comparison between two groups is indicated; †P < 0.05, compared with CNS2-WT. Bcl6, B-cell lymphoma 6; CNS, conserved noncoding sequence; d2EGFP, d2-enhanced green fluorescent protein; FACS, fluorescence-activated cell sorting; MFI, mean fluorescence intensity; MPT, memory phenotype CD4+ T; MPTH2 cell, MPT cell-derived TH2 cell; Mut, mutant; KO, knockout; WT, wild-type.
Bcl6 Represses Il4 Expression by Binding to hcIE in MPTH2 Cells
Another Il4 regulatory region, HS2 (1.2 kbp) located in intron 2, is a critical regulatory region for GATA3 binding-mediated Il4 expression in NATH2 cells in HS2-KO mice (33) (Figure 5A, top). A 222 bp DNA sequence of the hcIE region (Mouse Genome Informatics accession no. 5897323) (15) including BS3 and the GATA site (G3) in HS2 (Figure 5A, top) was studied. Gata3 expression was low in unprimed MPT cells from Bcl6-WT and Bcl6-TG mice regardless of CNS2 activation, whereas MPT cells under the TH2 condition exhibited similar Gata3 gene induction in Bcl6-WT and Bcl6-TG cells. Gene expression was augmented, particularly in GFP+ cells, and attenuated in a Bcl6-dependent manner in MPTH0 cells. However, further Gata3 expression in MPTH2 cells was not significantly affected by Bcl6 levels (Figure 5A, bottom). We investigated the enhancer activity using a reporter construct, uncovering that Bcl6 inhibited hcIE function in MPTH2 cells (Figures S4A–C in Supplementary Material). Similarly, ChIP demonstrated that GATA3 binding to G3 was increased in CNS2-active GFP+ MPTH2 cells compared with that in unprimed GFP+ MPT cells and was significantly attenuated in Bcl6-TG background cells (Figure 5B). Thus, Bcl6 repressed Il4 expression by downregulating GATA3-mediated hcIE activity in MPTH2 but not MPT cells.
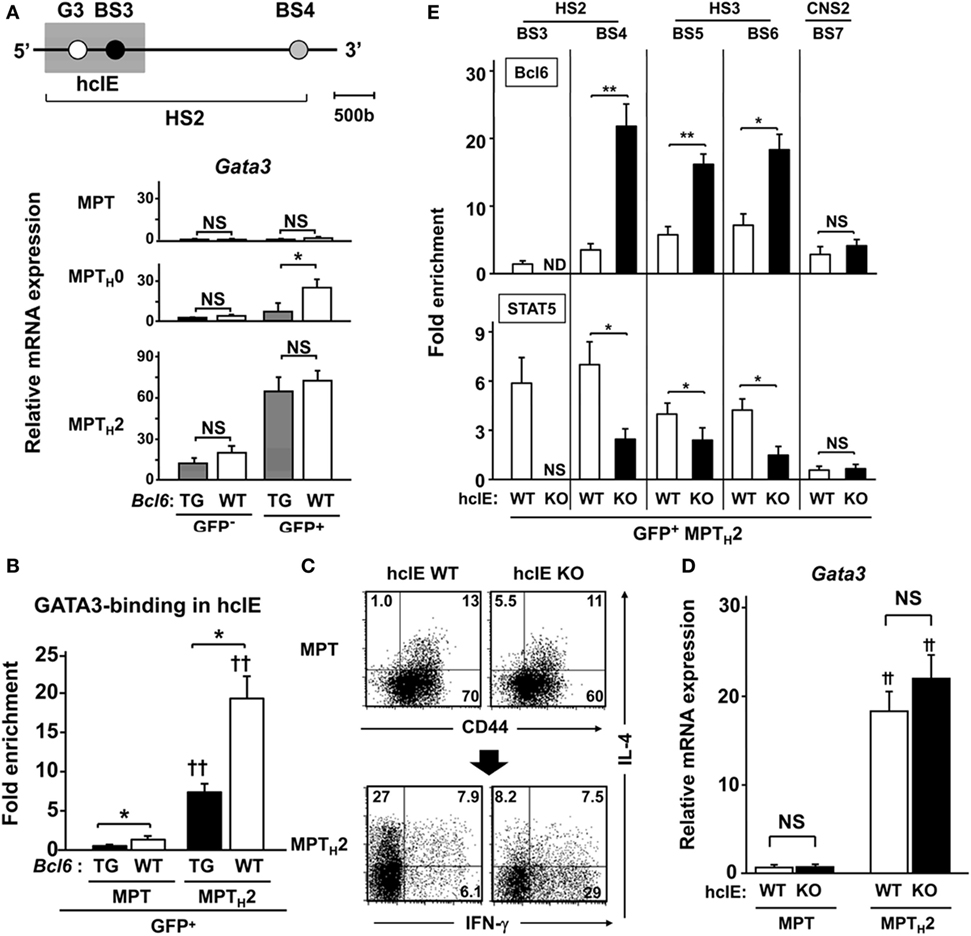
Figure 5. Role of Bcl6 in hcIE activity in MPTH2 cells. (A–D) KJ1-26+ cells among splenic MPT cells were cultured with ovalbumin peptides and antigen-presenting cells in vitro under TH0 or TH2 conditions. [(A) top] Diagram of the HS2 region in Il4 intron 2, indicating regulatory regions. The shaded square indicates the hcIE region including the GATA3-binding site (G3) and BS3 within HS2. (A) Gata3 mRNA levels in GFP+ and GFP− MPT, MPTH0, and MPTH2 cells derived from Bcl6-TG and Bcl6-WT mice on a CNS2-GFP-TG background. (B) GATA3 binding to G3 analyzed by ChIP assays for GFP+ MPT and MPTH2 cells on a CNS2-GFP-TG background. (C,D) Analysis of splenic MPT cells or MPTH2 cells derived from hcIE-KO or hcIE-WT mice. (A) FACS analysis of intracellular cytokine populations of MPT cells by gating CD4+ CD49b− T cells in the resting phase and MPTH2 cells restimulated with anti-CD3 monoclonal antibodies. The numbers in the corners represent the percentages among the gated T cells. (D) Gata3 mRNA levels were measured by qRT-PCR for MPT and MPTH2 cells derived from hcIE-KO and hcIE-WT mice. (E) Bcl6 levels and STAT5 binding to each BS were analyzed by ChIP assay for GFP+ MPTH2 cells from hcIE-KO or hcIE-WT mice on a CNS2-GFP-TG background. All results are representative of three (A,B) or five (C–E) independent experiments with similar outcomes. Data are means ± SEMs (n = 9–10). *P < 0.05, comparison between two groups as indicated; †P < 0.05, ††P < 0.01, compared with the MPT cells. Bcl6, B-cell lymphoma 6; BS, binding sequence; ChIP, chromatin immunoprecipitation; CNS, conserved noncoding sequence; FACS, fluorescence-activated cell sorting; hcIE, highly conserved intron enhancer; HS, DNase hypersensitive site; KO, knockout; MPT cell, memory phenotype CD4+ T cell; MPTH2 cell, MPT cell-derived TH2 cell; ND, not detected; NS, not significant; TG, transgenic; WT, wild-type.
To further examine the role of hcIE in TH2 cytokine production, we generated hcIE-KO mice and observed markedly diminished IL-4 production in hcIE-KO NATH2 and NAMTH2 cells (15). Intracellular cytokine analysis revealed a similar frequency of IL-4+ populations in unprimed MPT cells in WT and hcIE-KO background mice, whereas IL-4+ MPTH2 cell development was impaired without changes in Gata3 expression following hcIE deletion (Figures 5C,D). Bcl6 binding was augmented at BS4, BS5, and BS6 in intron 2 but not at CNS2 (BS7) in hcIE-KO MPTH2 cells compared with that in hcIE-WT background cells (Figure 5E), indicating that hcIE activity dampens Bcl6-mediated suppressor activity for intron 2 except at the CNS2 region.
Bcl6 Suppresses Initial IL-4 Production in MPT Cells and TH2 Cell Differentiation
Because IL-4 production by MPT cells plays an important role in NATH2 cell differentiation (28), to address the effects of Bcl6 on MPT cell function, Bcl6-WT-naïve KJ1-26+ CD4+ T cells were cocultured with KJ1-26− MPT cells from Bcl6-TG, Bcl6-KO, or Bcl6-WT mice in the presence of soluble anti-CD3 and CD28 mAbs and irradiated CD11c+ DCs as the TH0 condition. Differentiation of IL-4-producing KJ1-26+ NATH2 cells varied inversely with Bcl6 levels in KJ1-26− MPT cells, whereas IFN-γ-producing NATH1 cells differentiated in the opposite direction (Figures 6A,B). Because MP cell-derived IFN-γ may affect NATH2 cell differentiation, we analyzed the TH2 skewing of naïve CD4+ T cells cocultured with MPT cells by excluding the effect of endogenous IFN-γ. Although TH2 skewing became prominent in the coculture in the presence of anti-IFN-γ Abs regardless of the Bcl6 genotype, the skewing was still suppressed in the presence of Bcl6-TG MPT cells. Therefore, Bcl6 plays an important role in suppressing MPT cell function to skew naïve CD4+ T cells toward the TH2 phenotype (Figures 6A,B). Furthermore, regardless of the Bcl6 genotype, intrinsic IL-4 in MPT cells was involved in preserving the TH2 cell phenotype (Figures S5A,B in the Supplementary Material).
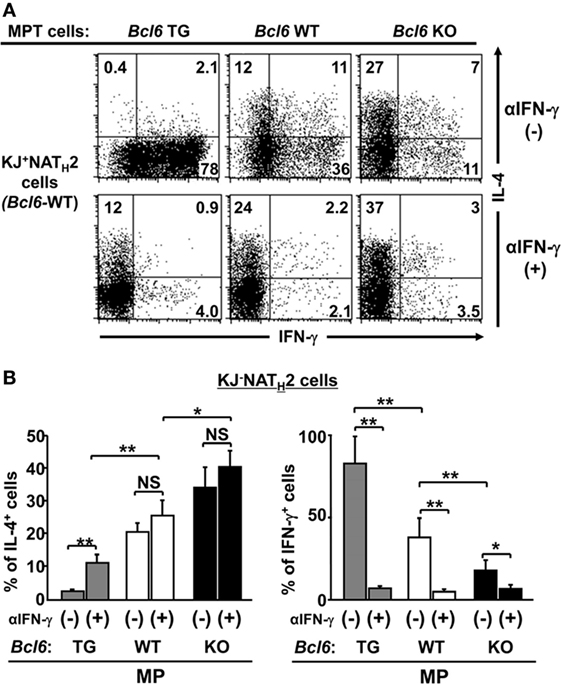
Figure 6. Role of Bcl6 in initial IL-4 production by MPT cells to induce NATH2 cells in vitro. (A,B) Bcl6-WT KJ1-26+ naïve CD4+ T cells were cocultured with KJ1-26− MPT cells (Bcl6-TG, Bcl6-WT, or Bcl6-KO) in the presence of soluble anti-CD3 and CD28 mAbs and irradiated CD11c+ DCs as the TH0 condition with or without anti-IFN-γ Abs. (A) FACS analysis of intracellular cytokines in each effector T cell type derived from KJ1-26+ naïve CD4+ T cells are presented as a representative figure among three independent experiments after restimulation with anti-CD3 mAbs. Numbers in the corners denote the percentages of gated KJ1-26+ CD4+ T cells. (B) Frequency of the populations of IL-4+ and IFN-γ+ KJ1-26+ T cells after reactivation. All results are representative of three independent experiments with similar outcomes. Data are presented as the mean ± SEM (n = 8–9). *P < 0.05; **P < 0.01. Ab, antibody; Bcl6, B-cell lymphoma 6; DC, dendritic cell; KO, knockout; mAb, monoclonal antibody; MPT cell, memory phenotype CD4+ T cell; NATH2 cell; naïve CD4+ T cell-derived TH2 cell; TG, transgenic; WT, wild-type.
As CNS2-active MPT cells are essential for inducing TH2 responses following immunization in an allergic murine model (28), we examined Bcl6 function in the MPT cell-induced response during the development of allergic immunity in BALB/c nu/nu mice undergoing adoptive transfer of Bcl6-WT-naïve CD4+ T cells (KJ1-26+) and MPT cells (KJ1-26−) from each respective Bcl6 genotype. Following OVA challenge in the mice, the numbers of all inflammatory cells, neutrophils, eosinophils (left), and KJ1-26+ T cells (right) in whole lung tissues were significantly increased, being inversely correlated with Bcl6 levels in the transferred MPT cells (Figures 7A,B). In BALF from the recipients, the TH2 cytokine concentrations of IL-4, IL-5, and IL-13, but not IFN-γ, were decreased after the last OVA challenge, with this effect being dependent on Bcl6 levels in the transferred MPT cells (Figure 7C). In KJ1-26+ T cells (naïve-derived TH cells) from the spleens of recipients after the last OVA challenge, TH2 cytokine mRNA expression (Il4, Il5, and Il13) was decreased depending on Bcl6 levels in the transferred MPT cells (Figure 7D). OVA-specific IgE levels in the sera were increased, in accordance with increased cytokine production after the last challenge (Figure 7E). This finding indicates that Bcl6 suppressed the development of allergic inflammation by reducing MPT cell function to facilitate NATH2 cell differentiation.
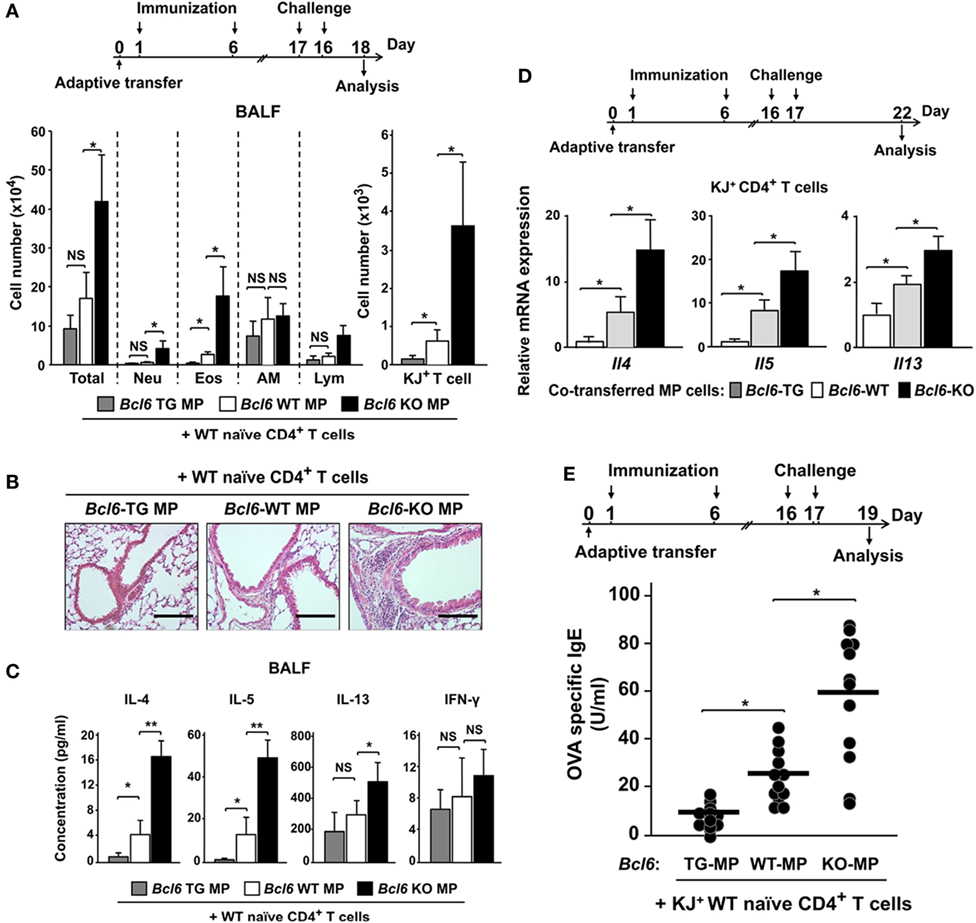
Figure 7. Role of Bcl6-mediated MPT cell functions in NATH2 differentiation in an allergic murine model. [(A) top] Mixture of purified KJ1-26− MPT cells (Bcl6-WT or Bcl6-KO) and KJ1-26+ WT naïve CD4+ T cells were transferred into BALB/c nu/nu mice intravenously (day 0). These mice were immunized with alum-conjugated OVA and then intratracheally challenged with OVA. [(A) bottom] Absolute cell numbers of Neu, Eos, AM, and Lym in BALF, (B) hematoxylin and eosin-stained, formalin-fixed lung sections (magnification: 200×), and (C) TH2 cytokine levels in the BALF of recipient mice 48 h after the last OVA challenge. (D) Relative Il4, Il5, and Il13 expression mRNA in splenic KJ1-26+ T cells restimulated with anti-CD3 monoclonal antibodies 5 days after the last challenge. (E) OVA-specific IgE antibody titers in sera from each recipient of Bcl6-WT NATH2 cells, plus MPTH2 cells transferred from Bcl6-TG, Bcl6-WT, or Bcl6-KO mice 2 days after the last challenge. All results are representative of four independent experiments with similar outcomes. Data are presented as the mean ± SEM (n = 5–7). *P < 0.05, **P < 0.01, comparison between two groups is indicated. AM, alveolar macrophages; BALF, bronchoalveolar lavage fluid; Bcl6, B-cell lymphoma 6; Eos, eosinophils; KJ+, KJ1-26-positive; KO, knockout; Lym, lymphocytes; MPT cell, memory phenotype CD4+ T cell; MPTH2 cell, MPT cell-derived TH2 cell; NATH2 cell; naïve CD4+ T cell-derived TH2 cell; Neu, neutrophils; NS, not significant; OVA, ovalbumin; TG, transgenic; WT, wild-type.
Bcl6 Attenuates the Synergistic Effect of MPTH2 Cells and NAM-LTH2 Cells on Allergic Responses
IL-4 levels were affected by Bcl6 in NAMTH2 cells, as previously reported (15). We focused on the functional difference in the spatiotemporal dynamics between MPTH2 and NAMTH2 cells. In the current study, NAM-LTH2 cells were analyzed as memory cells derived from naïve CD4+ T cells. In the resting phase, MPTH2 cells constitutively express Il4, the expression of which is reduced in a Bcl6-dependent manner. Following 1 h of restimulation, Il4 expression in MPTH2 cells was increased to similar levels in each Bcl6 genotype, and the expression occurred earlier than that in Bcl6-WT-NAM-LTH2 cells. Il4 expression levels were decreased in most MPTH2 cells, but not Bcl6-KO cells, in a Bcl6-dependent manner at 8 h after restimulation (Figure 8A). In NAM-LTH2 cells, Il4 expression levels were low in the resting phase and increased after restimulation. The expression levels in Bcl6-WT-NAM-LTH2 cells were high, similar to those in Bcl6-KO MPTH2 cells at 8 h after restimulation (Figure 8A). The protein levels of IL-4 and IL-5, but not of IL-13, were consistent with the Il4 expression pattern in each TH2 cell type (Figure S6 in Supplementary Material).
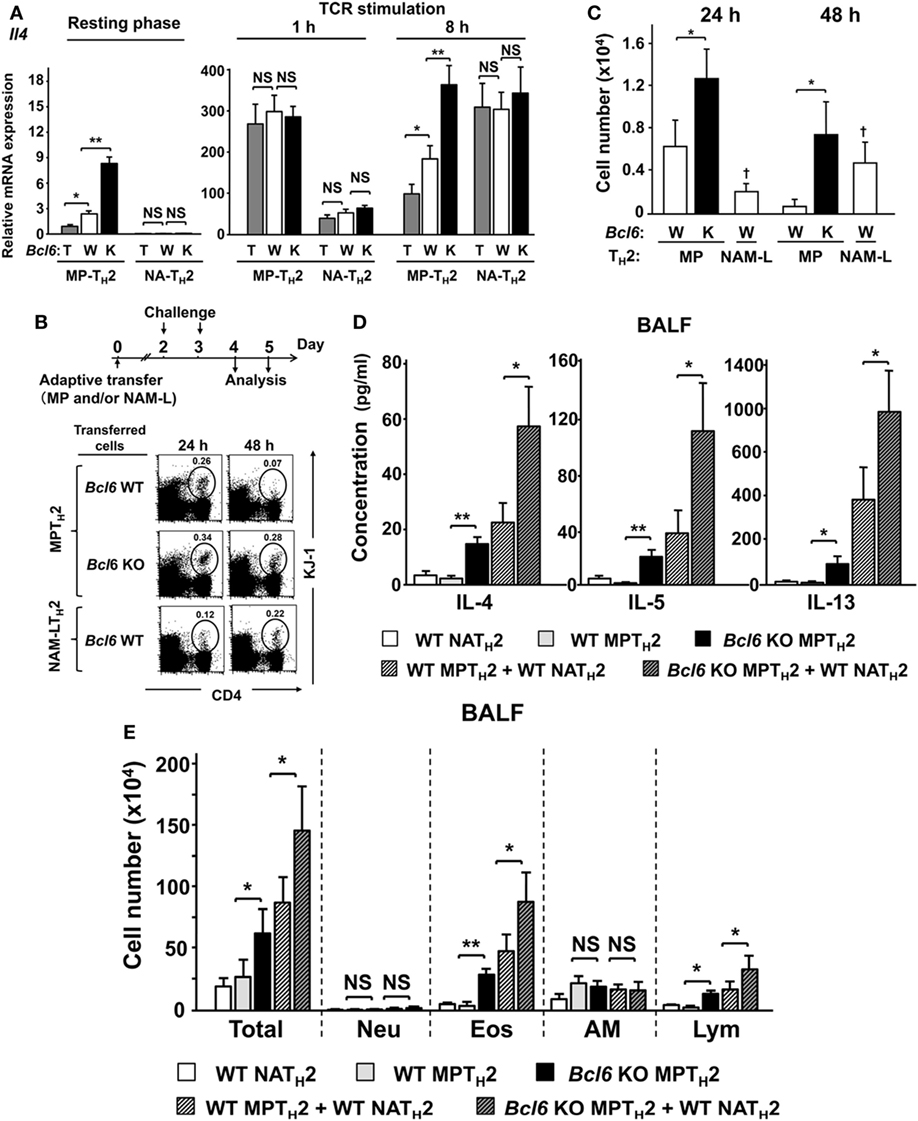
Figure 8. Role of Bcl6 in interactions between MPTH2 and naïve NATH2 cells in allergy pathogenesis. (A–E) KJ1-26+ MPTH2 cells and NATH2 cells were differentiated from the spleens of Bcl6-TG (T), Bcl6-WT (W), and Bcl6-KO (K) mice in the presence of OVA peptides and antigen-presenting cells in TH2 conditions. (A) Il4 mRNA levels in each TH2 cell type were measured by qRT-PCR at rest and at 1 and 8 h after restimulation with anti-CD3 monoclonal antibodies. (B–E) Bcl6-WT BALB/c nu/nu mice were administered KJ1-26+ MPTH2 cells (3 × 10⁷), KJ1-26+ NATH2 cells (3 × 10⁷), or combinations of MPTH2 (1.5 × 10⁷) and NATH2 cells (1.5 × 10⁷) via adoptive transfer (day 0). (B) Representative FACS data for donor cells in circles with their percentages among total CD4+ T cells in whole lungs from recipients at 24 and 48 h after the last intratracheal OVA challenge. (C) Absolute numbers of KJ1-26+ cells in the lungs, (D) TH2 cytokine levels, and (E) cell types in the bronchoalveolar lavage fluid 48 h after the last challenge. All results are representative of four independent experiments with similar outcomes. Data are presented as the mean ± SEM (n = 8–10). *P < 0.05, **P < 0.01, comparison between two groups is indicated (A,B,D,E); †P < 0.05, compared with MPTH2 cells. AM, alveolar macrophages; Bcl6, B-cell lymphoma 6; Eos, eosinophils; FACS, fluorescence-activated cell sorting; KO, knockout; Lym, lymphocytes; MPT cell, memory phenotype CD4+ T cell; MPTH2 cell, MPT cell-derived TH2 cell; NATH2 cell; naïve CD4+ T cell-derived TH2 cell; Neu, neutrophils; NS, not significant; OVA, ovalbumin; TCR, T cell receptor; TG, transgenic; WT, wild-type.
After adoptive transfer of each cell type (MPTH2 cells or NAM-LTH2 cells) with a DO11.10 genetic background into WT BALB/c nu/nu mice, cell migration into lung tissues following OVA antigen challenge was determined and presented as percentages (Figure 8B) and absolute cell numbers (Figure 8C). Among Bcl6-WT cells, MPTH2 cells had greater migratory capability compared with NAM-LTH2 cells at 24 h. The migration of MPTH2 cells decreased sequentially, whereas that of NAM-LTH2 cells increased at 48 h. The migration of Bcl6-KO MPTH2 cells was further augmented compared with that of Bcl6-WT cells. Next, we assessed the role of Bcl6 in interactions between MPTH2 and Bcl6-WT-NAM-LTH2 cells during allergic responses. WT BALB/c mice were adoptively transferred with combinations of each type of KJ1-26+ TH2 cells and sequentially challenged with OVA (Figures 8D,E). When Bcl6-WT-NAM-LTH2 or Bcl6-WT MPTH2 cells were transferred, TH2 cytokine levels (IL-4, IL-5, and IL-13) in the BALF were similar among recipients, whereas Bcl6-KO MPTH2 cells induced a fourfold to sevenfold increase in TH2 cytokine levels. Combined transfer of Bcl6-WT-NAM-LTH2 and Bcl6-WT MPTH2 cells resulted in synergistic cytokine production, which was further augmented when Bcl6-KO MPTH2 cells were transferred instead of Bcl6-WT MPTH2 cells (Figure 8D). The numbers of inflammatory cells, including eosinophils and lymphocytes, in the BALF (Figure 8E) were increased, in accordance with the increased production of cytokines, indicating that Bcl6 plays a critical role in regulating the functions of MPTH2 cells, which precede NAMTH2 cells in the development of local allergic pathology.
IL-33 Reinforces IL-4 Production by MPT Cells
Because we previously reported the effects of IL-33 on Bcl6-mediated histone modification in memory TH2 cells to augment IL-4 production (15), we focused in this study on the effect of IL-33 on MPT cells. FACS analysis demonstrated no significant difference in the cell-surface expression of ST2, an IL-33R subunit on MPT cells, between Bcl6-TG and Bcl6-WT mice (Figures 9A,B). ST2 was preferentially expressed on GFP+ MPT cells rather than GFP− cells. When MPT cells were cultured in the presence of IL-7 for 6 days followed by IL-33 administration (Figure 9C, top), the frequency (Figure 9C) and absolute number (Figure 9D) of IL-4+ MPT cells increased in a concentration-dependent manner at 8 h following the last IL-33 dose. The effect of IL-33 on IL-4+ MPT cells was significantly reduced in Bcl6-TG cells compared with that in WT cells (Figures 9C,D). Consistent with the priming effect of IL-33, we observed elevated levels of histone acetylation at BS sites in the Il4 locus with increased STAT5 histone association and decreased Bcl6 histone association. These effects of IL-33 on histone modification were attenuated in Bcl6-TG cells (Figure 9E).
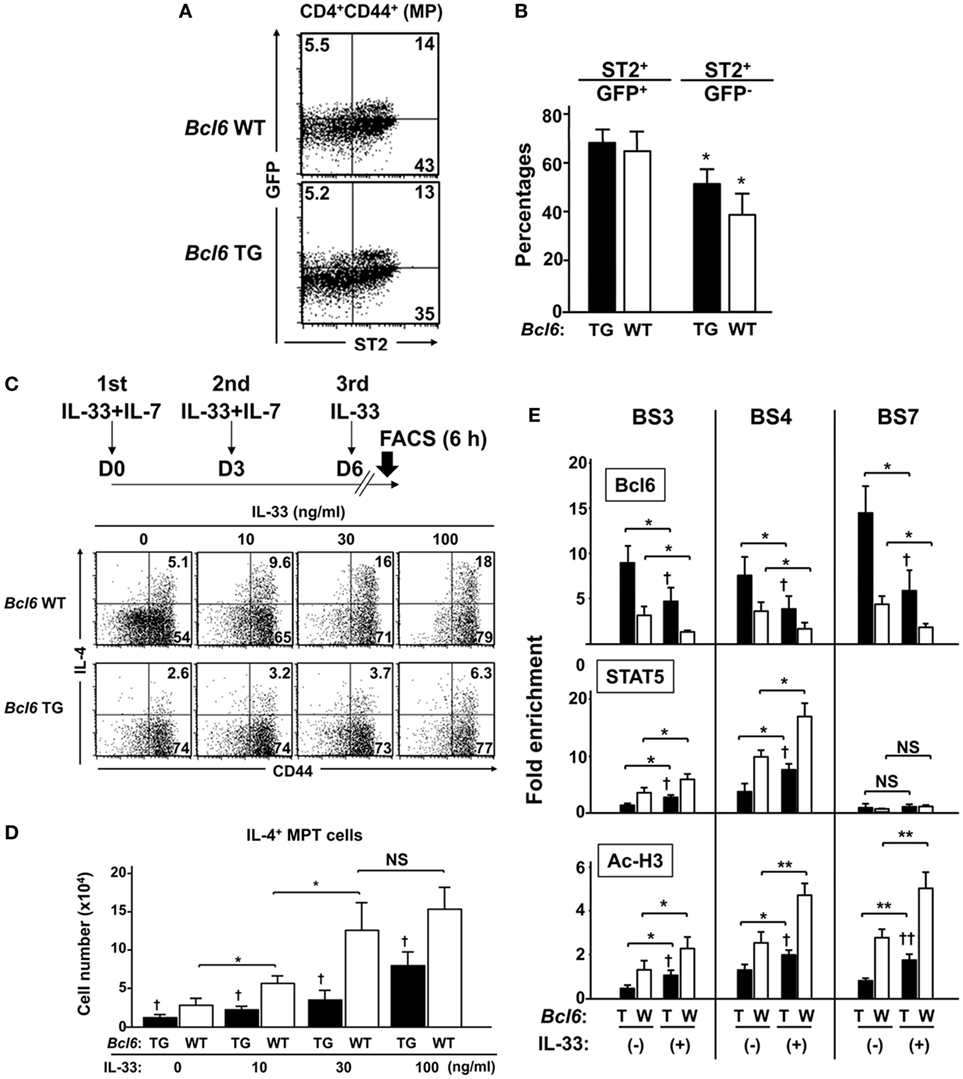
Figure 9. IL-33 reinforces IL-4 production by MPT cells through functional competition against the suppressor activity of Bcl6. (A,B) FACS analysis of splenic CNS2-GFP-TG MPT cells from Bcl6-TG and Bcl6-WT mice at rest. (A) Data show the expression of GFP and ST2 gated cells among all CD4+ CD44+ cells (representative of six independent experiments). (B) Percentages of ST2+ cells among GFP+ and GFP− MPT cells. (C,D) IL-33 was added to the culture of MPT cells from Bcl6-TG and Bcl6-WT mice three times in the presence of IL-7. [(C) top] Six hours after the last IL-33 dose, MPT cells were analyzed for intracellular IL-4 levels. Numbers indicate the percentage of IL-4+ cells among all MPT cells. [(C) bottom] FACS analysis data are representative of four independent experiments. (D) Absolute numbers of IL-4+ MPT cells 8 h after the last IL-33 dose. (E) ChIP analysis of Bcl6 and STAT5 binding and Ac-H3 at each BS in CNS2-GFP+ MPT cells from Bcl6-TG (T) and Bcl6-WT mice(W). Cells were primed with or without IL-33 three times in the presence of IL-7. Analysis was performed 8 h after the last IL-33 dose. All results are representative of three (A–D) or four (E) independent experiments with similar outcomes. Data are presented as the mean ± SEM (n = 6–7). *P < 0.05, **P < 0.01, comparison between two groups is indicated; †P < 0.05, ††P < 0.01, compared with WT. Ac-H3, acetylated histone H3; Bcl6, B-cell lymphoma 6; BS, binding sequence; ChIP, chromatin immunoprecipitation; CNS, conserved noncoding sequence; FACS, fluorescence-activated cell sorting; GFP, green fluorescent protein; MPT cell, memory phenotype CD4+ T cell; TG, transgenic; WT, wild-type.
Discussion
The function of Bcl6 to regulated TH2 cytokine production is unclear. We found that Bcl6 negatively regulated IL-4 gene expression in MPT cells and their derived MPTH2 cells. Bcl6 inhibition significantly augmented IL-4 production by WT MPTH2 cells. Furthermore, IL-4 expression was reduced in T cell-specific Bcl6-TG MPT and Bcl6-TG MPTH2 cells, indicating a suppressive function of T cell-intrinsic Bcl6. CNS2 contains multiple putative binding sites for RBP-J, a critical modulator of notch signaling (34). CNS2 is regulated by notch signals to control initial IL-4 expression in MPT cells (28). We demonstrated that Bcl6 binds to CNS2, leading to suppression of its enhancer activity in MPTH2 cells. Bcl6 antagonizes notch-dependent transcription (35, 36). However, Rbpj deletion does not alter epigenetic markers on the CNS2 site in TFH cells (29). Thus, to elucidate the positive regulatory mechanism of the activation of CNS2, a target of Bcl6 in MPT cells, further analysis is required.
GATA3 binding in the HS2 enhancer region is critical for NATH2 (15, 35) and NAMTH2 cells (15). However, extremely low GATA3 expression might not be associated with IL-4 production in MPT cells. We demonstrated that GATA3-mediated hcIE activation is not essential for IL-4 production by MPT cells (Figures 5B–D). However, MPTH2 cell differentiation requires hcIE enhancer activity, which induces permissive histone modification of the Il4 locus by cooperating with STAT5 and GATA3 (37). Bcl6 directly bound to and interfered with hcIE function in MPTH2 cells. Accordingly, we suggest that diverse Bcl6 functions regulate IL-4 production in MPTH2 and MPT cells. The locus control region (LCR) at the Rad50 gene is also extremely important for TH2 cytokine expression. This region is considered to be involved in coordinating TH2 cytokine genes including IL-4. We previously reported the GATA3-binding site and Bcl6/STAT-binding sites in conserved regions (TH2LCR) in the Rad50 gene in another study (15). We also reported that Bcl6 binding in the LCR is augmented by disruption of hcIE in Il4, indicating that Bcl6-mediated TH2LCR organizes TH2 cytokine gene including IL-4. Therefore, TH2LCR may be implicated in Il4 regulation in CNS2-active MPT cells. To elucidate the role of TH2LCR, further studies using region-deficient mice are required.
B-cell lymphoma 6 has various regulatory functions associated with cell viability and cytokine production, although the detailed molecular mechanisms have not been clarified. We observed that CNS2-active MPT cells contained high Bcl6 levels that declined following augmented IL-4 production under TH2 priming conditions. Intriguingly, in Bcl6-WT MPTH2 cells, the CNS2-active population exhibited markedly lower Bcl6 levels and higher Il4 levels than the CNS2-inactive population. Greater Bcl6 mRNA levels in CNS2-active MPT cells than in the CNS2-inactive population in WT mice have been reported (29), whereas we observed slight differences in expression between these two populations. However, Bcl6 protein levels in CNS2-active Bcl6-WT MPT cells were inversely decreased relative to those in the CNS2-inactive MPT cells. Therefore, when pleiotropic Bcl6 effects are required in the same cellular environment, its function may be quantitatively controlled at transcriptional, translational, or post-transcriptional levels.
We previously demonstrated that TH2 cytokine genes are negatively regulated by Bcl6 through chromatin remodeling and that interactions between Bcl6 and STAT5 are physiologically implicated in histone modulation and consequently cytokine production in NAMTH2 cells rather than NATH2 cell differentiation (15). In a previous report, we advocated that STAT5 and GATA3 cooperate in permissive histone modification of the Il4 locus by binding to hcIE and that STAT5- and GATA3-mediated epigenetic activity of hcIE may be controlled by directly and/or indirectly preventing the Bcl6-mediated silencing. In addition, Bcl6 binding to BS4, BS5, and BS6 in the Il4 locus was augmented upon hcIE disruption in differentiating TH2 cells. Therefore, even in the presence of high levels of Bcl6, Bcl6-TG naïve CD4+ T cells could differentiate into TH2 cells under the TH2 full commitment condition. Conversely, when naïve Bcl6-TG, Bcl6-WT, and Bcl6-KO CD4+ T cells are stimulated under the TH0 condition, IL-4 production by restimulated CD4+ T cells was reduced in a Bcl6 level-dependent manner. Therefore, we propose that the repressor activity of Bcl6 in the Il4 locus including hcIE and CNS2 can be determined in functional balance with transcriptional activators, such as GATA3, STATs, and RBP-J, in both MPTH2 and NATH2 cells. Accordingly, both quantitative and qualitative Bcl6 functional modifications, such as reduced binding activity (15), may be implicated in the gene regulation of Il4. Notably, we observed that Bcl6 binding to the Il4 locus is higher in CNS2-GFP− Bcl6-TG MPTH2 cells than in GFP+ Bcl6-TG cells. Because enhancers can generally regulate transcription by interacting with enhancers or promoters via chromatin looping mechanisms, we propose that CNS2 may also stimulate Il4 transcription via physical interactions with hcIE, which may influence and organize Bcl6/STAT binding in hcIE. Therefore, Bcl6 binding to the Il4 locus may exceed STAT5 binding via Bcl6-mediated inhibition of CNS2 activity.
In earlier reports, we and other groups uncovered that Bcl6 has no significant intrinsic function in the differentiation of naïve CD4+ T cells into TH1/TH2 cells in full commitment experiments in vitro. In later studies focusing on TFH cells, Bcl6 suppressed effector T cells, including TH1, TH2, and TH17 cells, resulting in the induction of TFH cell differentiation. The current study indicated that Bcl6 promotes IFN-γ production via by inhibiting IL-4 production in activated naïve CD4+ T cells and MPT cells in some experimental settings, rather than inhibiting IL-4 production by promoting IFN-γ production.
Contrarily, we previously reported that Bcl6 plays an important anti-apoptotic role in effector-derived memory precursor CD4+ T cells, suggesting that Bcl6 is involved in long-term memory T cell survival (17, 30, 38). We observed that the numbers of splenic MPT cells and, intriguingly, CNS2-active GFP+ MPT cells were positively associated with intrinsic Bcl6 levels, whereas the MFI of GFP was reduced in Bcl6-TG cells. Recently, CNS2-active GFP+ CD4+ T cells in secondary lymphoid tissues were found to have a high Bcl6 expression phenotype, similar to TFH cells (29). Bcl6 is a master regulatory factor for TFH cell differentiation. However, a substantial Bcl6-KO MPT cell population exists, and we suggested that CNS2-active MPT cells are not necessary as part of the TFH cell lineage. Although the molecular mechanism is unclear, Bcl6 may be implicated in, but not essential for, the development and/or maintenance of MPT and MPTH2 cells.
NAMTH2 cells have an important role in chronic allergic responses (15), although the relationship between NAMTH2 and MPTH2 cells is unclear. We observed that TH2 cytokine production peaked and declined earlier in Bcl6-WT-MPTH2 cells than in WT-NAM-LTH2 cells. Moreover, the migratory function of MPTH2 cells was superior to that of NAM-LTH2 cells, albeit due to an unknown mechanism. Because CNS2 and Il4 are constitutively activated in MPTH2 cells but not in NAMTH2 cells (15), MPTH2 cells might influence NAMTH2 cell function in chronic allergy. Accordingly, MPTH2 cells organize TH2 immune responses directly and/or indirectly by regulating NAMTH2 cell function, resulting in allergy enhancement.
IL-4 production by CNS2-active MPT cells induced TH2 responses by inducing the differentiation of NATH2 cells from naïve CD4+ T cells and their self-differentiation into MPTH2 cells following immunization (28). We confirmed initial IL-4 production from MPT cells in this study. Because CNS2-active MPT cells do not belong to the TFH cell lineage derived from naïve CD4+ T cells (29) but they rather develop from selected thymocytes among those expressing other MHC class II markers (39), IL-4+ MPT cells might develop independently of naïve CD4+ T cells during thymic differentiation. In that case, sequentially differentiated MPTH2 cells as well as MPT cells contribute to the early pathology of some allergies.
When considering the nature of Bcl6 in MPT and MPTH2 cells in pathologic conditions, we should determine whether Bcl6 expression can be modified without artificial gene manipulation at both protein and RNA levels. Recently, we reported that a TH2-promoting factor, namely, IL-33-mediated breakdown of Bcl6 in NAMTH2 cells, is likely involved in allergies (15) given the effect of IL-33 on both MPT and NAMTH2 cells. Therefore, the IL-33/Bcl6 axis might participate in allergy pathology via the regulation of Il4 in MPT cells to promote disease development in MPTH2 and NAMTH2 cells, contributing to the maintenance and exacerbation of disease pathology.
In summary, the current study provides evidence for a novel role of Bcl6 in the functional regulation of MPT and MPTH2 cells, implying interplay between Bcl6 and transcriptional activators to promote the production of relevant TH2 cytokines, particularly IL-4. Thus, TH2 cell-promoting factors that suppress Bcl6 function may represent crucial therapeutic targets for TH2 cell-mediated diseases.
Ethics Statement
This study was carried out in accordance with the recommendations of the Chiba University Resolution on Use of Animals in Research. The protocol was approved by the Institutional Animal Care and Use Committee at Chiba University School of Medicine. The mice were maintained under specific pathogen-free conditions in the animal center of Chiba University Graduate School of Medicine.
Author Contributions
MA and TO jointly designed the experiments and directed the study and wrote the manuscript. MA, TO, YK, JI, TT, NT, HW-T, LF, AS, HH, and MH performed the experiments. MA, TO, MH, YF, and KK analyzed the data and generated the figures. YF, KT, TT, and TF provided reagents and/or support for the analysis.
Conflict of Interest Statement
The authors declare that the research was conducted in the absence of any commercial or financial relationships that could be construed as a potential conflict of interest.
Acknowledgments
The authors thank S. Satake for technical support and S. Nakamura for secretarial services. This work was supported in part by Grants-in-Aid for Scientific Research (C) (JP17K10005: MA; JP24591460: MA) from the Japan Society for the Promotion of Science.
Supplementary Material
The Supplementary Material for this article can be found online at https://www.frontiersin.org/articles/10.3389/fimmu.2018.00750/full#supplementary-material.
Abbreviations
Abs, antibodies; APC, antigen-presenting cell; BAL, Bronchoalveolar lavage; BALF, Bronchoalveolar lavage fluid; Bcl6, B-cell lymphoma 6; BS, binding sequence; ChIP, chromatin immunoprecipitation; CNS, conserved noncoding sequence; DC, dendritic cell; EGFP, enhanced green fluorescent protein; FACS, fluorescence-activated cell sorting; GFP, green fluorescent protein; hcIE, highly conserved intron enhancer; HS, DNase hypersensitive site; KO, knockout; LCR, locus control region; LTR, long terminal repeat; mAbs, monoclonal antibodies; MFI, mean fluorescence intensity; MPT cell, memory phenotype CD4+ T cell; MPTH2 cell, MPT cell-derived TH2 cell; NAM-LTH2 cell, NATH2 cell-derived memory-like TH2 cell; NAMTH2 cell, NATH2 cell-derived memory cell; NATH2 cell, naïve CD4+ T cell-derived TH2 cell; OVA, ovalbumin; PCR, polymerase chain reaction; STAT, signal transducer and activator of transcription; TCR, T cell receptor; TFH cell, T follicular helper cell; TG, transgenic; WT, wild-type.
References
1. Kubo M. Innate and adaptive type 2 immunity in lung allergic inflammation. Immunol Rev (2017) 278:162–72. doi:10.1111/imr.12557
2. Hirose K, Iwata A, Tamachi T, Nakajima H. Allergic airway inflammation: key players beyond the Th2 cell pathway. Immunol Rev (2017) 278:145–61. doi:10.1111/imr.12540
3. Paul WE. What determines Th2 differentiation, in vitro and in vivo? Immunol Cell Biol (2010) 88:236–9. doi:10.1038/icb.2010.2
4. Zhou M, Ouyang W. The function role of GATA-3 in TH1 and TH2 differentiation. Immunol Res (2003) 28:25–37. doi:10.1385/IR:28:1:25
5. Dent AL, Shaffer AL, Yu X, Allman D, Staudt LM. Control of inflammation, cytokine expression, and germinal center formation by BCL-6. Science (1997) 276:589–92. doi:10.1126/science.276.5312.589
6. Ye BH, Cattoretti G, Shen Q, Zhang J, Hawe N, de Waard R, et al. The BCL-6 proto-oncogene controls germinal-centre formation and Th2-type inflammation. Nat Genet (1997) 16:161–70. doi:10.1038/ng0697-161
7. Yoshida T, Fukuda T, Hatano M, Koseki H, Okabe S, Ishibashi K, et al. A role of Bcl6 in mature cardiac myocytes. Cardiovasc Res (1999) 42:670–9. doi:10.1016/S0008-6363(99)00007-3
8. Harris MB, Chang CC, Berton MT, Danial NN, Zhang J, Kuehner D, et al. Transcriptional repression of stat6-dependent interleukin-4-induced genes by BCL-6: specific regulation of Iε transcription and immunoglobulin E switching. Mol Cell Biol (1999) 19:7264–75. doi:10.1128/MCB.19.10.7264
9. Hatzi K, Nance JP, Kroenke MA, Bothwell M, Haddad EK, Melnick A, et al. BCL6 orchestrates Tfh cell differentiation via multiple distinct mechanisms. J Exp Med (2015) 212:539–53. doi:10.1084/jem.20141380
10. Kawamata N, Miki T, Ohashi K, Suzuki K, Fukuda T, Hirosawa S, et al. Recognition DNA sequence of a novel putative transcription factor, BCL6. Biochem Biophys Res Commun (1994) 204:366–74. doi:10.1006/bbrc.1994.2468
11. Arguni E, Arima M, Tsuruoka N, Sakamoto A, Hatano M, Tokuhisa T. JunD/AP-1 and STAT3 are the major enhancer molecules for high Bcl6 expression in germinal center B cells. Int Immunol (2006) 18:1079–89. doi:10.1093/intimm/dxl041
12. Liao W, Spolski R, Li P, Du N, West EE, Ren M, et al. Opposing actions of IL-2 and IL-21 on Th9 differentiation correlate with their differential regulation of BCL6 expression. Proc Natl Acad Sci U S A (2014) 111:3508–13. doi:10.1073/pnas.1301138111
13. Liu X, Lu H, Chen T, Nallaparaju KC, Yan X, Tanaka S, et al. Genome-wide analysis identifies Bcl6-controlled regulatory networks during T follicular helper cell differentiation. Cell Rep (2016) 14:1735–47. doi:10.1016/j.celrep.2016.01.038
14. Arima M, Toyama H, Ichii H, Kojima S, Okada S, Hatano M, et al. A putative silencer element in the IL–5 gene recognized by Bcl6. J Immunol (2002) 169:829–36. doi:10.4049/jimmunol.169.2.829
15. Ogasawara T, Hatano M, Satake H, Ikari J, Taniguchi T, Tsuruoka N, et al. Development of chronic allergic responses by dampening Bcl6–mediated suppressor activity in memory T helper 2 cells. Proc Natl Acad Sci U S A (2017) 114:E741–50. doi:10.1073/pnas.1613528114
16. Toney LM, Cattoretti G, Graf JA, Merghoub T, Pandolfi PP, Dalla-Favera R, et al. BCL–6 regulates chemokine gene transcription in macrophages. Nat Immunol (2000) 1:214–20. doi:10.1038/79749
17. Ichii H, Sakamoto A, Arima M, Hatano M, Kuroda Y, Tokuhisa T, et al. Bcl6 is essential for the generation of long–term memory CD4+ T cells. Int Immunol (2007) 19:427–33. doi:10.1093/intimm/dxm007
18. Nurieva RI, Chung Y, Martinez GJ, Yang XO, Tanaka S, Matskevitch TD, et al. Bcl6 mediates the development of T follicular helper cells. Science (2009) 325:1001–5. doi:10.1126/science.1176676
19. Johnston RJ, Poholek AC, DiToro D, Yusuf I, Eto D, Barnett B, et al. Bcl6 and Blimp–1 are reciprocal and antagonistic regulators of T follicular helper cell differentiation. Science (2009) 325:1006–10. doi:10.1126/science.1175870
20. Yu D, Rao S, Tsai LM, Lee SK, He Y, Sutcliffe EL, et al. The transcriptional repressor Bcl–6 directs T follicular helper cell lineage commitment. Immunity (2009) 31:457–68. doi:10.1016/j.immuni.2009.07.002
21. Vos Q, Jones LA, Kruisbeek AM. Mice deprived of exogenous antigenic stimulation develop a normal repertoire of functional T cells. J Immunol (1992) 149:1204–10.
22. Dobber R, Hertogh-Huijbregts A, Rozing J, Bottomly K, Nagelkerken L. The involvement of the intestinal microflora in the expansion of CD4+ T cells with a naïve phenotype in the periphery. Dev Immunol (1992) 2:141–50. doi:10.1155/1992/57057
23. Byrne JA, Stankovic AK, Cooper MD. A novel subpopulation of primed T cells in the human fetus. J Immunol (1994) 152:3098–106.
24. Tough DF, Sun S, Zhang X, Sprent J. Stimulation of memory T cells by cytokines. Vaccine (2000) 18:1642–8. doi:10.1016/S0264-410X(99)00500-9
25. Szabolcs P, Park KD, Reese M, Marti L, Broadwater G, Kurtzberg J. Coexistent naïve phenotype and higher cycling rate of cord blood T cells as compared to adult peripheral blood. Exp Hematol (2003) 31:708–14. doi:10.1016/S0301-472X(03)00160-7
26. Huang T, Wei B, Velazquez P, Borneman J, Braun J. Commensal microbiota alter the abundance and TCR responsiveness of splenic naïve CD4+ T lymphocytes. Clin Immunol (2005) 117:221–30. doi:10.1016/j.clim.2005.09.012
27. Younes SA, Punkosdy G, Caucheteux S, Chen T, Grossman Z, Paul WE. Memory phenotype CD4 T cells undergoing rapid, nonburst-like, cytokine-driven proliferation can be distinguished from antigen-experienced memory cells. PLoS Biol (2011) 9:e1001171. doi:10.1371/journal.pbio.1001171
28. Tanaka S, Tsukada J, Suzuki W, Hayashi K, Tanigaki K, Tsuji M, et al. The interleukin-4 enhancer CNS-2 is regulated by notch signals and controls initial expression in NKT cells and memory-type CD4 T cells. Immunity (2006) 24:689–701. doi:10.1016/j.immuni.2006.04.009
29. Harada Y, Tanaka S, Motomura Y, Harada Y, Ohno S, Ohno S, et al. The 3′ enhancer CNS2 is a critical regulator of interleukin-4-mediated humoral immunity in follicular helper T cells. Immunity (2012) 36:188–200. doi:10.1016/j.immuni.2012.02.002
30. Ichii H, Sakamoto A, Hatano M, Okada S, Toyama H, Taki S, et al. Role for Bcl-6 in the generation and maintenance of memory CD8+ T cells. Nat Immunol (2000) 3:558–63. doi:10.1038/ni802
31. Fukuda T, Yoshida T, Okada S, Hatano M, Miki T, Ishibashi K, et al. Disruption of the Bcl6 gene results in an impaired germinal center formation. J Exp Med (1997) 186:439–48. doi:10.1084/jem.186.3.439
32. Morita S, Kojima T, Kitamura T. Plat-E: an efficient and stable system for transient packaging of retroviruses. Gene Ther (2000) 7:1063–6. doi:10.1038/sj.gt.3301206
33. Tanaka S, Motomura Y, Suzuki Y, Yagi R, Inoue H, Miyatake S, et al. The enhancer HS2 critically regulates GATA-3-mediated Il4 transcription in T(H)2 cells. Nat Immunol (2011) 12:77–85. doi:10.1038/ni.1966
34. Amsen D, Blander JM, Lee GR, Tanigaki K, Honjo T, Flavell RA, et al. Instruction of distinct CD4 T helper cell fates by different notch ligands on antigen-presenting cells. Cell (2004) 117:515–26. doi:10.1016/S0092-8674(04)00451-9
35. Sakano D, Kato A, Parikh N, McKnight K, Terry D, Stefanovic B, et al. BCL6 canalizes Notch-dependent transcription, excluding mastermind-like1 from selected target genes during left–right patterning. Dev Cell (2010) 18:450–62. doi:10.1016/j.devcel.2009.12.023
36. Valls E, Lobry C, Geng H, Wang L, Cardenas M, Rivas M, et al. BCL6 antagonizes NOTCH2 to maintain survival of human follicular lymphoma cells. Cancer Discov (2017) 7:506–21. doi:10.1158/2159-8290.CD-16-1189
37. Zhu J, Min B, Hu-Li J, Watson CJ, Grinberg A, Wang Q, et al. Conditional deletion of Gata3 shows its essential function in T(H)1-T(H)2 responses. Nat Immunol (2004) 5:1157–65. doi:10.1038/ni1128
38. Ichii H, Sakamoto A, Kuroda Y, Tokuhisa T. Bcl6 acts as an amplifier for the generation and proliferative capacity of central memory CD8+ T cells. J Immunol (2004) 173:883–91. doi:10.4049/jimmunol.173.2.883
Keywords: B-cell lymphoma 6, naturally occurring memory phenotype T cells, allergy, TH2 cells, asthma
Citation: Ogasawara T, Kohashi Y, Ikari J, Taniguchi T, Tsuruoka N, Watanabe-Takano H, Fujimura L, Sakamoto A, Hatano M, Hirata H, Fukushima Y, Fukuda T, Kurasawa K, Tatsumi K, Tokuhisa T and Arima M (2018) Allergic TH2 Response Governed by B-Cell Lymphoma 6 Function in Naturally Occurring Memory Phenotype CD4+ T Cells. Front. Immunol. 9:750. doi: 10.3389/fimmu.2018.00750
Received: 11 November 2017; Accepted: 26 March 2018;
Published: 10 April 2018
Edited by:
Keiko Ozato, National Institutes of Health (NIH), United StatesReviewed by:
Jinfang Zhu, National Institute of Allergy and Infectious Diseases (NIH), United StatesChristopher E. Rudd, Université de Montréal, Canada
Copyright: © 2018 Ogasawara, Kohashi, Ikari, Taniguchi, Tsuruoka, Watanabe-Takano, Fujimura, Sakamoto, Hatano, Hirata, Fukushima, Fukuda, Kurasawa, Tatsumi, Tokuhisa and Arima. This is an open-access article distributed under the terms of the Creative Commons Attribution License (CC BY). The use, distribution or reproduction in other forums is permitted, provided the original author(s) and the copyright owner are credited and that the original publication in this journal is cited, in accordance with accepted academic practice. No use, distribution or reproduction is permitted which does not comply with these terms.
*Correspondence: Masafumi Arima, masaa@dokkyomed.ac.jp