 Anna Ohradanova-Repic1*
 Christian Machacek1Celine Charvet2,3,4†Franck Lager2,3,4
 Delphine Le Roux2,3,4†René Platzer1Vladimir Leksa1,5
 Goran Mitulovic6Thomas R. Burkard7
 Gerhard J. Zlabinger8Michael B. Fischer9,10
 Vincent Feuillet2,3,4
 Gilles Renault2,3,4
 Stephan Blüml11Miroslav Benko12Miloslav Suchanek12
 Johannes B. Huppa1Takami Matsuyama13
 Artur Cavaco-Paulo14
 Georges Bismuth2,3,4
 Hannes Stockinger1*
- 1Molecular Immunology Unit, Institute for Hygiene and Applied Immunology, Center for Pathophysiology, Infectiology and Immunology, Medical University of Vienna, Vienna, Austria
- 2Institut National de la Santé et de la Recherche Médicale, INSERM U1016, Institut Cochin, Paris, France
- 3Université Paris Descartes, Paris, France
- 4Centre National de la Recherche Scientifique (CNRS), UMR 8104, Paris, France
- 5Laboratory of Molecular Immunology, Institute of Molecular Biology, Slovak Academy of Sciences, Bratislava, Slovakia
- 6Clinical Department of Medical and Chemical Laboratory Diagnostics, Medical University of Vienna, Vienna, Austria
- 7Bioinformatics Department of the Research Institute of Molecular Pathology and the Institute of Molecular Biotechnology of the Austrian Academy of Sciences, Vienna, Austria
- 8Institute of Immunology, Center for Pathophysiology, Infectiology and Immunology, Medical University of Vienna, Vienna, Austria
- 9Department of Transfusion Medicine, Medical University of Vienna, Vienna, Austria
- 10Center for Biomedical Technology, Danube University Krems, Krems, Austria
- 11Division of Rheumatology, Internal Medicine III, Medical University of Vienna, Vienna, Austria
- 12EXBIO Praha, Vestec, Czechia
- 13The Center for Advanced Biomedical Sciences and Swine Research, Kagoshima University, Kagoshima, Japan
- 14Centre of Biological Engineering, University of Minho, Campus of Gualtar, Braga, Portugal
If misregulated, macrophage (Mϕ)–T cell interactions can drive chronic inflammation thereby causing diseases, such as rheumatoid arthritis (RA). We report that in a proinflammatory environment, granulocyte-Mϕ (GM-CSF)- and Mϕ colony-stimulating factor (M-CSF)-dependent Mϕs have dichotomous effects on T cell activity. While GM-CSF-dependent Mϕs show a highly stimulatory activity typical for M1 Mϕs, M-CSF-dependent Mϕs, marked by folate receptor β (FRβ), adopt an immunosuppressive M2 phenotype. We find the latter to be caused by the purinergic pathway that directs release of extracellular ATP and its conversion to immunosuppressive adenosine by co-expressed CD39 and CD73. Since we observed a misbalance between immunosuppressive and immunostimulatory Mϕs in human and murine arthritic joints, we devised a new strategy for RA treatment based on targeted delivery of a novel methotrexate (MTX) formulation to the immunosuppressive FRβ+CD39+CD73+ Mϕs, which boosts adenosine production and curtails the dominance of proinflammatory Mϕs. In contrast to untargeted MTX, this approach leads to potent alleviation of inflammation in the murine arthritis model. In conclusion, we define the Mϕ extracellular purine metabolism as a novel checkpoint in Mϕ cell fate decision-making and an attractive target to control pathological Mϕs in immune-mediated diseases.
Introduction
Macrophages (Mϕs) are myeloid immune cells essential for tissue homeostasis and immunity. Their differentiation and maintenance is controlled in a tissue-specific manner mainly by two growth factors, Mϕ and granulocyte-Mϕ colony-stimulating factor (M-CSF/CSF-1 and GM-CSF/CSF-2), respectively (1). In addition, the Mϕ phenotype is further shaped by local stimuli, to which Mϕs respond with high plasticity (2). During infection or sterile inflammation, proinflammatory cytokines, such as IFNγ, or toll-like receptor (TLR) ligands activate Mϕs into the proinflammatory M1 type with microbicidal and tumoricidal activity. Alternatively, Th2 cytokines IL-4/IL-13 promote M2 Mϕs with a tissue remodeling or immunoregulatory phenotype, while stimulation with IL-10, transforming growth factor-β (TGF-β), or glucocorticoids generates highly immunosuppressive “M2-like” Mϕs (3–5). The shift in the Mϕ polarizing stimuli during the resolution phase of infection is thought to convert M1 Mϕs to the M2 type, restoring tissue homeostasis (4, 6).
Recently, it has become apparent that ligation of TLRs or cytokine receptors also triggers profound changes in key metabolic events in Mϕs, enabling coordinate induction and maintenance of Mϕ effector activities (7–9). In M1 Mϕs, aerobic glycolysis is induced to readily provide cells with energy in a form of adenosine 5′-triphosphate (ATP). Aerobic glycolysis additionally feeds to the pentose phosphate pathway for production of nucleotides and NADPH, the latter being required for generation of microbicidal reactive oxygen species (8, 9). Furthermore, the glycolytic switch is associated with an increase in several metabolic intermediates that are incorporated into signaling pathways to support the inflammatory phenotype. In contrast, M2 Mϕs rely on oxidative metabolism that enables long-term cell survival and promotes M2 functions (7). Another example is l-arginine metabolism, which is a hallmark of differently polarized mouse Mϕs (10). In M1 Mϕs, arginine is a substrate to nitric oxide synthase (NOS2) induced by proinflammatory stimuli to produce antibacterial NO. In M2 Mϕs, arginine is metabolized by the M2 marker arginase 1 (Arg1) to urea and l-ornithine, a precursor of polyamines important for wound healing. Additionally, Arg1 action limits arginine availability to bystander proliferating T cells, leading to their suppression (10). While these key metabolic differences between M1 and M2 Mϕs are widely accepted, the metabolic cues that control the switch between different Mϕ phenotypes are not well understood.
Rheumatoid arthritis (RA) is an autoimmune disease characterized by chronic synovial inflammation and hyperplasia causing joint destruction (6, 11). Activated M1 Mϕs crucially contribute to disease pathology and their numbers in the sublining synovial layer predict severity of the disease (12). Interestingly, Mϕs expressing M2 markers, such as CD163 or folate receptor β (FRβ) were also identified in inflamed synovia (13–16). However, it is unclear whether and how these Mϕs with proposed anti-inflammatory properties contribute to disease pathology or whether they emerge to counteract inflammation. Hence, identifying and enhancing intrinsic pathways that would contribute to the resolution of inflammation in RA is an unmet need in RA therapy.
To elucidate mechanisms how different Mϕ subtypes contribute to chronic inflammation in RA and to identify pathways controlling their identity, we aimed to generate variously activated human GM-CSF- or M-CSF-differentiated Mϕs and address their ability to produce inflammatory mediators and influence T cell responses. We show that FRβ+ M-CSF-dependent Mϕs respond to proinflammatory stimuli by modulating gene expression of the purinergic pathway as a means to produce and respond to extracellular adenosine. Adenosine skews these cells toward the M2 state and suppresses autologous T cells. GM-CSF-dependent Mϕs resist this adenosine-mediated switch, so that only specific enhancement of the purinergic metabolism in the FRβ+ Mϕs potently limits inflammation in the arthritis mouse model.
Materials and Methods
Reagents
LPS (Escherichia coli serotype O55:B5) and adenosine were purchased from Sigma-Aldrich (St. Louis, MO, USA). Deuterated adenosine was from CDN Isotopes (Quebec, Canada). Adenosine 5′-triphosphate disodium salt (ATP) was from Thermo Fisher Scientific (Waltham, MA, USA). Recombinant human M-CSF, IFNγ, and IL-10 were obtained from Peprotech (Rocky Hill, NJ, USA). Recombinant human GM-CSF and IL-4 were from Novartis AG (Basel, Switzerland). The RPMI 1640 medium, l-glutamine, streptomycin, penicillin, and heat-inactivated fetal calf serum (FCS) were obtained from Gibco, Thermo Fisher Scientific. CD39 inhibitor POM-1 was from Tocris Bioscience (Bristol, UK). The cell proliferation dye CFSE and calcium sensor Fluo-4, AM was from Molecular Probes, Thermo Fisher Scientific. Brilliant Violet 421-conjugated streptavidin used as a second step in flow cytometry analyses was purchased from BioLegend (San Diego, CA, USA). Phorbol 12-myristate 13-acetate (PMA), ionomycin calcium salt (ionomycin) from S. conglobatus and monensin A sodium salt (monensin) were purchased from Sigma-Aldrich.
Antibodies
The anti-FRβ monoclonal antibody (mAb) (clone EM-35) (17); was provided by EXBIO (Vestec, Czech Republic), either as purified or conjugated with Alexa Fluor 488, Alexa Fluor 647, or biotin. The second anti-FRβ mAb used in this study [clone 36b (18)] was purified using a Protein A Sepharose column and conjugated with phycoerythrin (PE) or biotin. EXBIO also provided Pacific Blue-conjugated CD14 mAb (clone MEM-18), FITC-conjugated CD64 mAb (clone 10.1), PerCP-conjugated CD86 mAb (clone BU63), Alexa Fluor 700-conjugated anti-MHC class II mAb (clone MEM-136 recognizing the β chain of HLA DR + DP), and allophycocyanin-conjugated CD4 mAb (clone MEM-241). Pacific Blue- and PE-conjugated CD69 mAb (clone FN50), FITC-conjugated mAbs to CD1a (clone HI149), CD8 (clone SK1), CD80 (clone 2D10), PE-conjugated mAb to CD73 (clone AD2) and to CD25 (clone BC96), PE-Cy7- and Brilliant Violet 421-conjugated CD39 mAb (clone A1), PerCP-conjugated mAb to CD16 (clone 3G8), PerCP-Cy5.5-conjugated mAbs to CD163 (clone GHI/61) and CD209 (clone 9E9A8) and allophycocyanin-Cy7-conjugated CD206 mAb (clone 15-2) were purchased from BioLegend. FITC-conjugated mAb to CD40 (clone LOB7/6) was from AbD Serotec (Oxford, UK). Allophycocyanin-conjugated mAb to CD25 (clone 4E3) was from Miltenyi Biotec (Bergisch Gladbach, Germany). For intracellular staining of T cells, the anti-FOXP3 mAb (clone 206D, conjugated to Alexa Fluor 647), FITC-conjugated anti-IFNγ mAb (clone 4S.B3), and PE-conjugated anti-IL-17A mAb (clone BL168) were purchased from BioLegend. The CD3 mAb OKT3 specific for the CD3ε chain was obtained from Centocor Ortho Biotech (Horsham, PA, USA). The mAbs L293 to CD28 and FITC-conjugated Leu4 to CD3 were purchased from BD Biosciences (Franklin Lakes, NJ, USA). mAbs to CD8 (clone MEM-87), CD14 (clone MEM-18), CD16 (clone MEM-154), CD19 (clone WIN19), CD20 (clone MEM-97), CD56 (clone MEM-188), used for CD4+ T cell isolation, and a CD147 mAb (clone MEM-M6/1) used in flow cytometry experiments were a kind gift of Vaclav Horejsi, Institute of Molecular Genetics, Academy of Sciences of the Czech Republic, Prague, Czech Republic. mAb to PD-L1 (clone 5-OM496) was a kind gift of Otto Majdic, Institute of Immunology, Medical University of Vienna, Vienna, Austria. Allophycocyanin-conjugated goat anti-mouse IgG + IgM Ab used as the second step in flow cytometry experiments was from Jackson ImmunoResearch Laboratories (West Grove, PA, USA). Additionally, Beriglobin P (CSL Behring, King of Prussia, PA, USA) was used for Fc receptor blockade in flow cytometry experiments.
For the experiments in the mouse, rat anti-murine-FRβ mAb was used (19), followed by a Dylight 488-conjugated anti-rat secondary Ab (eBioscience, Thermo Fisher Scientific, San Diego, CA, USA). Anti-murine PE-Cy7-conjugated CD11b mAb (clone M1/70) was from BD Biosciences. PerCP-Cy5.5-conjugated F4/80 mAb (clone BM8) and eFluor660-conjugated CD39 Ab (clone 24DMS1) were from eBioscience. Brilliant Violet 605-conjugated CD73 (clone T4/11.8) was from BioLegend.
Cell Isolation and Culture
Human blood monocytes of healthy donors were isolated and differentiated to Mϕs and activated as previously described (20). Briefly, 7-day Mϕ differentiation was induced by 25 ng/ml GM-CSF or 50 ng/ml M-CSF; subsequent activation by 100 ng/ml LPS plus 25 ng/ml IFNγ, 20 ng/ml IL-4 or 20 ng/ml IL-10 for 48 h. When indicated, 20 µM POM-1, 100 µM ATP, 10 µM adenosine (or vehicle control) was added. CD4+ T cells were isolated from monocyte-depleted fraction by negative selection (21) and frozen. Synovial fluid cells were from knees of patients with inflammatory arthritis and analyzed immediately.
The study using human material was performed in accordance with the Declaration of Helsinki, informed consent was obtained from all participants and research was approved by the Ethics Committee of the Medical University of Vienna (2177/2013, 559/2005).
T Cell Proliferation Assay
Activated human Mϕs, seeded in U-bottom 96-well plates (18,000 cells/well), were carefully washed and the autologous CD4+ T cells, labeled 12 h prior the assay with 1 µM CFSE, were added at the concentration of 90,000/well (control). In parallel, T cells were polyclonally stimulated with soluble CD3 mAb OKT3 (1 µg/ml). Controls included T cells cultured alone with or without soluble CD3 mAb, or cultured with plate-bound CD3 mAb OKT3 (1 µg/ml) plus soluble CD28 mAb L293 (0.5 µg/ml). In some experiments, IL-10-blocking mAb or isotype-matched control mAb (10 µg/ml) was included. Cocultures were performed in duplicates in RPMI 1640 medium supplemented with 2 mM l-glutamine, 100 µg/ml streptomycin, 100 U/ml penicillin, and 5% heat-inactivated FCS (all from Gibco, Thermo Fisher Scientific); fresh medium (including mAbs) was supplemented every 3 days. T cell proliferation was monitored on day 7 by assessing CFSE staining by flow cytometry. For quantification, T cells were analyzed using FlowJo (Tree Star, Ashland, OR, USA) and electronically sorted according to the CFSE peaks into gates that represented the respective generations (i) of proliferating T cells. Then, the cell count in the individual gates (Ni) was determined. The percentage of dividing T cells (from the parental population), %D, was calculated according to the formula:
where i is the generation number as discriminated by the CFSE gating (starting with 0 for the undivided population) and Ni is the number of events (cells) in generation i. The division index, DI, defined by the average number of cell divisions that parental population has undergone, was calculated according to the formula:
Both statistics parameters used here are explained in detail elsewhere (22).
Flow Cytometry
Flow cytometry analysis of human Mϕs was performed as previously described (20).
For the analysis of T cell surface antigens, cells were washed with precooled staining buffer (PBS containing 1% BSA and 0.02% NaN3) and incubated on ice for 30 min with 4.8 mg/ml human IgG (Beriglobin P) to prevent nonspecific binding of the mAbs to Fc receptors. Then, antibody–fluorochrome conjugates with appropriate isotype controls were added. Cells were incubated for 30 min on ice and then washed with staining buffer. Samples were analyzed on an LSRII flow cytometer (BD Biosciences) and the data were further processed with the FlowJo software. Living single cells were gated according to their forward- and side-scatter characteristics and dead cells were excluded using DAPI or 7-aminoactinomycin D (Sigma-Aldrich). Cells were scored positively if they had a higher fluorescence than the cutoff of 0.5% of the isotype control mAbs. In graphs, geometric mean of fluorescence intensity corrected for background staining using matched isotype control mAb is shown.
For FOXP3 analysis, T cells were first stained using mAbs against the surface markers CD4 and CD25 as described above, then fixed, permeabilized, and stained for FOXP3 using the FOXP3 Fix/Perm Buffer Set according to the manufacturer’s protocol (BioLegend).
For analysis of intracellular cytokine production, T cells were restimulated on day 5 with 16.2 nM PMA and 1 µM ionomycin for 6 h with addition of 1 µM monensin for the last 4 h. The cells were fixed with 4% paraformaldehyde and permeabilized in 0.1% saponin (both from Sigma-Aldrich) in PBS. Before adding anti-IFNγ and anti-IL-17A mAbs, cells were blocked with 2.4 mg/ml human IgG (Beriglobin P) diluted in the intracellular staining buffer (5% FCS, 0.1% saponin in PBS) that was also used for washing.
Gene Expression Analysis
Total RNA was extracted with the PureLink RNA Mini Kit (Ambion, Austin, TX, USA) or TRIzol reagent (Invitrogen, Carlsbad, CA, USA) supplemented with β-mercaptoethanol for RNAse inhibition. cDNA synthesis, quantitative PCR using GoTaq qPCR Master Mix (Promega, Madison, WI, USA) and analysis was performed as previously described (23). Primers are listed in Table S1 in Supplementary Material. ACTB was used as endogenous control unless stated otherwise and results are reported relative to values for one of the samples as specified in figure legends.
For microarray analysis, RNA was isolated from the different Mϕ subsets using PureLink RNA Mini Kit (Ambion). 500 ng of total RNA from each sample (in biological triplicates) was used for amplification, labeling, and hybridization using GeneChip Primeview Human Gene Expression Array and 3′IVT Express Kit Bundle (Affymetrix, Santa Clara, CA, USA). RMA was used for normalization of the dataset (24) and further analysis was done with limma (25).
The microarray data were submitted to the GEO repository (accession No. GSE61298).
Heat maps for specific genes were created using TM4 (26) using probe sets with expression above the threshold values (log2 > 5) in at least one sample. If a gene contained duplicate probe sets, their mean value was calculated and loaded into TM4. For Figure 1C, the threshold was increased to log2 = 7 and probe sets with differential expression upon activation or upon differentiation, respectively, were used (adj. p value < 0.05) and averaged before loading into TM4 to visualize differentially expressed genes with moderate to high expression only. Hierarchical clustering was done by TM4 based on Pearson correlation as the distance metrics.
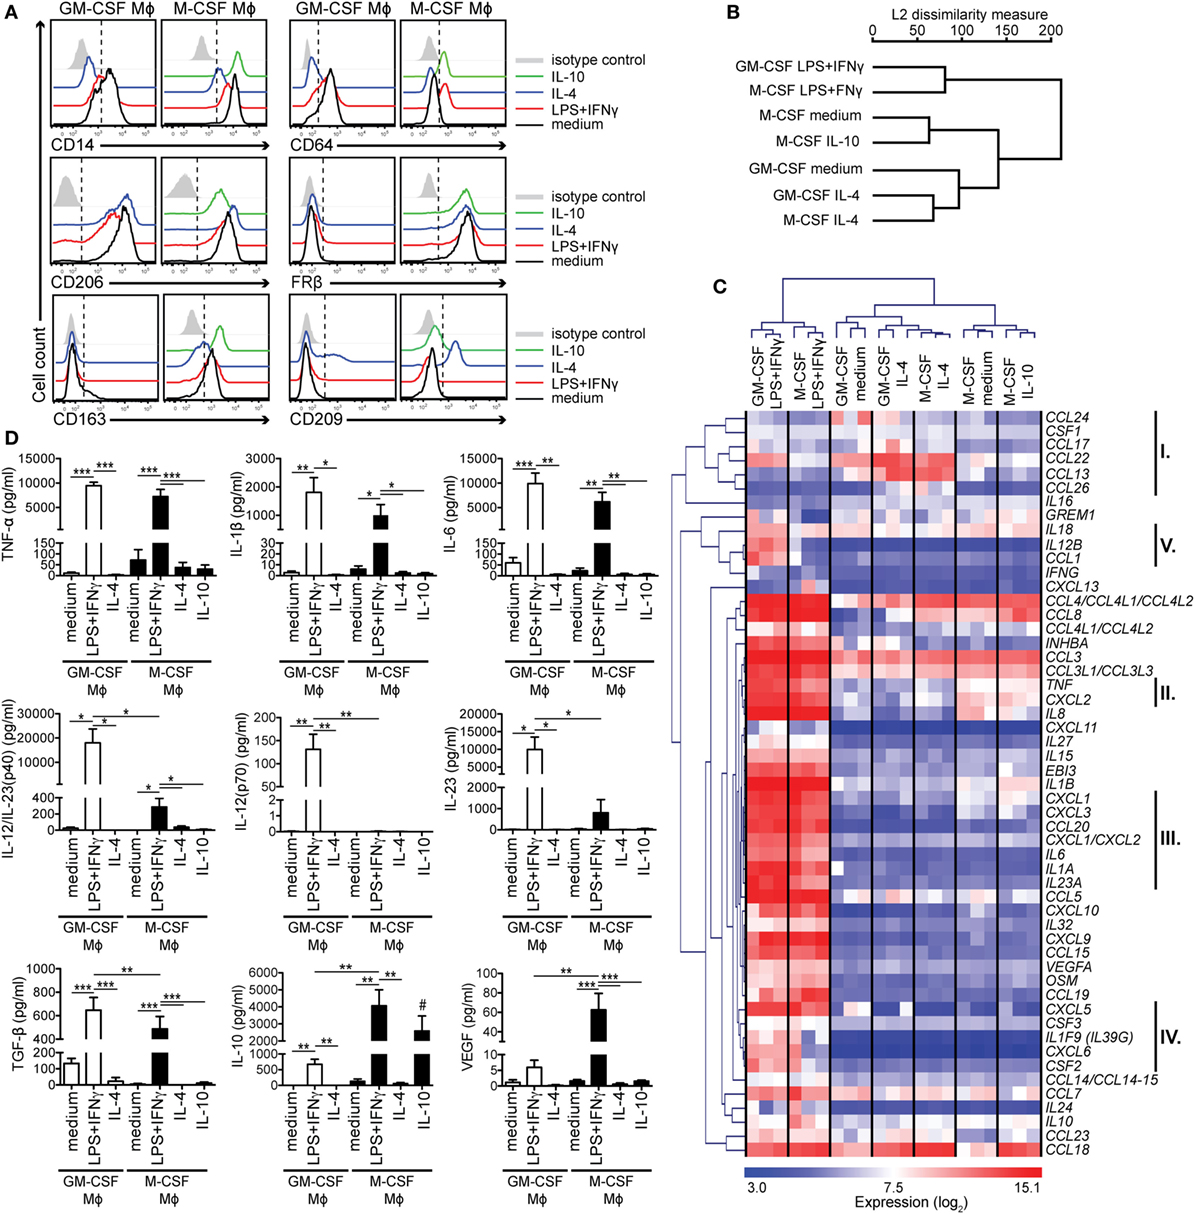
Figure 1. Activated human GM-CSF- and M-CSF-differentiated macrophage (Mϕ) subtypes are distinguishable by their surface marker, cytokine, and chemokine profiles. Human Mϕs were differentiated for 7 days with either GM-CSF or M-CSF and then activated for 2 days with the indicated stimuli. (A) Surface expression of Mϕ markers was measured by flow cytometry. Mock-activated cells are shown in black, cells activated with—LPS + IFNγ in red, with IL-4 in blue and with IL-10 in green. Control staining of mock-activated cells using the isotype control monoclonal antibodies is shown in gray (isotype control staining of activated cells was similar and is not depicted here). One representative of 10–12 experiments is shown. (B) Genome-wide analysis of Mϕ polarization was assessed by transcriptome profiling of Mϕ subtypes from (A). Hierarchical clustering of Mϕ subtypes based on 22,067 gene probe sets (≈44.7%) that showed a significantly different expression (adj. p value <0.05) in at least one comparison. Data are combined from three independent experiments. (C) Heat map of transcripts of cytokine and chemokine genes based on the differentially expressed gene probe sets (115 gene probe sets; adj. p value < 0.05) with log2 expression > 7 in at least one sample. Important gene clusters discussed (I–V) are highlighted on the right. Mϕs have been generated from three donors and are visualized separately. (D) Active TGF-β from cell-free culture supernatants was determined using the SERPINE1 (PAI-1) promoter-driven luciferase reporter assay, while the other cytokines were measured by the Luminex analysis. The mean cytokine concentration ± SEM from 5 to 6 donors is shown. *p < 0.05, **p < 0.01, ***p < 0.001. Statistical significance was determined by one-way ANOVA with Tukey’s posttest. The hash key (#) indicates that the IL-10 levels in the IL-10-stimulated Mϕ subtype represent a mixture of released and residual IL-10 from the activation step and, therefore, were not evaluated.
Cytokine Measurements
IL-1β, TNF-α, IL-6, IL-12 (p40, p70), IL-23, IL-10, vascular endothelial growth factor (VEGF), IL-2, IL-4, and IFNγ were measured from cell-free supernatants by Luminex analysis as detailed previously (23). Active TGF-β was determined using the SERPINE1 (PAI-1) promoter-driven luciferase reporter assay (27).
Extracellular ATP Degradation and Adenosine Measurements
Human Mϕ subtypes were differentiated and activated as described above. Mϕ-mediated degradation of 20 µM ATP in serum-free RPMI 1640 medium was monitored after 30 min at 37°C from cell-free supernatants using the Luminescent ATP detection Assay kit (Abcam, Cambridge, UK), omitting lysis step. For normalization, cells were lysed separately and the total protein amount was detected by Bradford protein assay (Bio-Rad, Hercules, CA, USA).
Adenosine was determined from the cell-free culture media of 7 days-differentiated and 2 days (48 h)-activated Mϕ cultures by liquid chromatography/mass spectrometry (LC/MS). For that, 100 µl of cell culture medium was spiked in with 1 µg deuterated adenosine as the internal standard and samples were deproteinated by chloroform–methanol extraction and lyophylized. The sample extract was dissolved in eluent (75% acetonitrile/100 mM aqueous ammonium acetate, pH 4.5) and 2 µl were injected onto the separation column (SeQuant® ZIC®-cHILIC 100 mm × 0.3 mm, which was kindly provided by Merck, Darmstadt, Germany). Adenosine was separated using isocratic separation conditions on the Dionex nano RSLC HPLC (Thermo Fisher Scientific) system. The column was operated at 45°C using a flow rate of 8 µl/min. UV detection was performed at 260 nm prior to ESI-MS operated in positive ionization mode using a Bruker maXis Impact mass spectrometer (Bruker, Bremen, Germany). The MRM scan of the transition m/z 268.097 (MH+) to m/z 136.054 (MH+) was performed using the CID-MS/MS. The peak area of extracted ion chromatograms for m/z 268.097 were integrated using Data Analysis Version 4.1 (Bruker Daltonik, Bremen, Germany). The resulting peak area was corrected using the area of the internal standard with m/z 269.103 (MH+); MRM transition 269.103 to 137.053. Finally, adenosine concentration in the samples was calculated from the adenosine calibration curve ranging from 0 to 10 µg/ml cold adenosine spiked in with the internal standard and processed as described above.
Live Cell Imaging
Human Mϕs differentiated with M-CSF for 7 days were activated with 100 ng/ml LPS plus 25 ng/ml IFNγ on low-adherent HydroCell plates (NUNC, Thermo Fisher Scientific) for 2 days, then detached using ice-cold 1.5 mM EDTA in HBSS (Gibco), washed with PBS supplemented with 10% FCS, and loaded with CD3 mAb OKT3 (50 µg/ml) for 30 min on ice. Then, Mϕs were stained with Brilliant Violet 421-labeled CD39 and PE-labeled CD73 mAbs (or labeled isotype-matched control mAbs) for 30 min on ice and washed twice with PBS supplemented with 10% FCS. One day prior to imaging, autologous CD4+ T cells were defrosted and left to recover overnight. In some experiments, on the day of imaging, living T cells were purified by gradient centrifugation using Lymphoprep (Axis-Shield, Oslo, Norway) and extensively washed with PBS. CD4+ T cells (106/ml) were loaded with 1 µM Fluo-4 in complete culture medium for 30 min at 25°C and then washed twice with the imaging buffer [HBSS supplemented with 2% FCS, 10 mM HEPES pH 7.4 (Gibco), 1 mM MgCl2, and 1 mM CaCl2]. For imaging, first the Mϕs, then T cells were put onto a 1.0 borosilicate glass surface of an 8-well Lab-Tek II chamber slide (NUNC) at 25°C. Image acquisition was performed with a Leica DMI4000B microscope (Leica Microsystems; Wetzlar, Germany) equipped with a 40× immersion objective (Leica HCX PL Apo 40×, NA 1.25) and an Andor iXon Ultra-8871 EM-CCD camera (Andor Technologies; Belfast, UK) controlled by the Leica Application Suite Advanced Fluorescence software (version AF6000LX). Imaging of Fluo-4, PE and Brilliant Violet 421 excitation and emission light filtering was achieved through the Leica Quad-Sedat filter system (dichroic: 430,505,757,670) including two external filter wheels DFTC-Ex (350/50, 490/20, 555/26, 645/30) and DFTC-Em (455/50, 525/36, 605/52, 705/72). DIC and fluorescence images were collected at intervals of 1 min over 45–50 min. Synapse formation and T cell intracellular calcium dynamics determined by monitoring of the Fluo-4 fluorescence were analyzed with the open source image analysis software package Fiji (28).
Human Serum Albumin (HSA) Coupling to methotrexate (MTX) and Folic Acid (FA)
N-(3-dimethylaminopropyl)-N-ethylcarbodiimide hydrochloride (EDAC) and N-hydroxysuccinimide (both from Sigma-Aldrich) were dissolved independently in dimethyl sulfoxide (DMSO) and mixed with MTX dissolved also in DMSO. The solution was kept under continuous stirring in a glass labware until complete dissolution. Activation was performed at 50°C in a water bath during 15 min. Activated MTX was then added drop by drop to HSA dissolved in 130 mM NaHCO3 buffer, pH 7.2 under continuous stirring at room temperature (RT) and the final solution incubated for a 20-min period at RT. Conjugation was followed by extensive dialysis against NaHCO3 buffer (membrane cut-off of 20 kDa) to eliminate free MTX. HSA and MTX concentrations were determined by measuring the optical density of the solution at 280 and 370 nm, respectively.
The same protocol was used to activate FA. Half of the HSA-MTX solution was then mixed with activated FA at RT under continuous stirring, followed by 20-min incubation at RT. The molecular ratio between HSA, MTX, and FA was calculated to be 1:1.6:1.2 by measuring absorbance of the different conjugates at 280 (for HSA) and 370 nm (for MTX and FA). All solutions were dialyzed against PBS and filter sterilized before use.
Collagen-Induced Arthritis (CIA) Mouse Model and Ex Vivo Analysis of Mϕs by Flow Cytometry
6-week-old DBA/1JRj male mice were purchased from Janvier Laboratory (Le Genest-St.-Isle, France). Arthritis was induced with type II bovine collagen (CII; MD Bioscience, Zurich, Switzerland) as previously described in Ref. (29). Briefly, mice were injected intradermally at the base of the tail with 100 µg of CII emulsified in Freund’s adjuvant (BD DIFCO, Thermo Fisher Scientific). On day 21, mice were boosted with an intradermal injection of CII in incomplete Freund’s adjuvant (BD DIFCO, Thermo Fisher Scientific). Mice were monitored for evidence of arthritis in paws using a blind procedure. For each mouse, clinical severity of arthritis was scored (0-normal; 1-erythema; 2-swelling; 3-deformity; 4-necrosis) in 10 joints or group of joints (toes, tarsus, ankle of the hindleg and fingers, and carpus of the foreleg) as detailed elsewhere (29). The MTX (35 mg/kg; the HSA conjugates were used at the amount equivalent to 7 mg/kg of free MTX) and the vehicle control (PBS) treatments injected were randomized in each cage to avoid cage dependence of the clinical score. Treatment started 14 days after immunization, with intraperitoneal injections twice a week, and mice were scored the same day.
For flow cytometry analysis, ankles were dissected, digested with collagenase (50 µg/ml) diluted in RPMI 1640 medium without serum for 2 h at 37°C. Then, ankles were dissociated and the cell suspension was filtered through a 40 µm cell strainer. For surface staining, Fc receptors were blocked with normal goat and rabbit IgG (10 µg/ml) in PBS with 1% BSA for 30 min on ice. Cells were then stained in the same medium with an anti-murine FRβ for 30 min on ice, washed with PBS with 1% BSA and incubated with a Dylight 488-conjugated anti-rat secondary Ab (eBioscience) for 30 min on ice. After two consecutive washes, cells were stained with rat anti-mouse-CD11b, F4/80, CD39, and CD73 for 30 min on ice, washed again, and measured using an LSR II flow cytometer (BD Biosciences) equipped with the FACSDiva software; and the data were further processed with the FlowJo software.
The experiments using mouse models were approved by the French Ministry of Research and the Paris Descartes University Ethical Committee (CEEA N°34); agreement N°CEEA34.GB.029.11. All methods and experiments were performed in accordance with the relevant guidelines and regulations.
Statistics
The number of independent experiments (human donors) and mice in animal studies is specified in the figure legends. The statistical significance between subsets of the particular Mϕ lineages was assessed as specified in the figure legends using Prism 5 (GraphPad Software, La Jolla, CA, USA). Additionally, for assessment of the difference between the samples activated with the same stimuli two-tailed unpaired t-test was used. In all analyses, statistical significance was accepted at p < 0.05.
Results
M-CSF-Dependent Mϕs Show a Skewed M1/M2 Profile in Response to M1 Activation Stimuli
To establish a model system for RA-associated Mϕs, we differentiated human CD14hi monocytes into Mϕs by culturing them for 7 days with either GM-CSF or M-CSF, which are both upregulated in RA tissues (12). Mϕs were then treated with LPS + IFNγ for 48 h to mimic chronic inflammatory conditions (M1 state). Alternatively, we used IL-4 or IL-10 (the latter for the M-CSF-primed Mϕs only) to activate Mϕs to the M2/M2-like states (20). We confirmed the activation states by assessing surface expression of several Mϕ markers by flow cytometry (Figure 1A; Figure S1 in Supplementary Material that can be found with all other Supplementary Figures in Supplementary Material). GM-CSF-differentiated Mϕs were characterized by lower expression of the LPS coreceptor CD14 than M-CSF-differentiated Mϕs, while CD64 was strongly expressed by mock-activated GM-CSF-differentiated Mϕs. Both markers were highly expressed by LPS + IFNγ- and IL-10-stimulated Mϕs and strongly downregulated in response to IL-4. The commonly used M2 marker CD206 (5), was not found specific for M2 Mϕs, since it was highly expressed by all subtypes, though further upregulated by IL-4. In contrast, the M2 marker FRβ (3) was expressed at high levels exclusively by the M-CSF lineage regardless of subsequent polarization. Other M2 markers CD163 and CD209 were also preferentially expressed on M-CSF-differentiated Mϕs, but in contrast to FRβ, expression of these markers varied, depending on the activation stimulus: CD163 expression was the highest in the presence of IL-10, while CD209 was upregulated in response to IL-4 in both lineages. Thus, by probing for these Mϕ markers, we are able to discriminate GM-CSF- versus M-CSF-differentiated Mϕs and assess their activation status. These data also reveal that M-CSF-dependent Mϕs express certain M2 markers even in the proinflammatory environment.
To gain a better insight into Mϕ polarization, we analyzed the transcriptome of these seven subtypes using a whole-human genome microarray. On the transcriptome-wide level, Mϕs clus-tered according to the activation regime, with LPS + IFNγ-activated Mϕs of both lineages in one branch and IL-4-activated Mϕs segregating at the furthest end of the other branch (Figure 1B). Similar results we obtained when we focused onto analysis of genes encoding cytokines and chemokines, which are both crucial effector molecules and markers of different Mϕ types (Figure 1C). IL-4-activated Mϕs of both lineages highly expressed a cluster of M2-associated chemokine genes (cluster I; CCL13, CCL17, CCL22, CCL24, CCL26). Again, the most pronounced changes were caused by LPS + IFNγ stimulation. Here, we detected a robust upregulation of genes encoding proinflammatory cytokines and chemokines. Nevertheless, a subgroup of them (clusters II–IV) was expressed at lower levels in the M-CSF-differentiated LPS + IFNγ subtype: while the genes in cluster II (TNF and CXCL2) and III (IL1A, IL6, IL23A, CXCL1-CXCL3, and CCL20) were found to be uniformly upregulated to some extent, several genes from cluster IV (CSF2, CXCL6, and IL1F9) were mildly upregulated only in one donor. Furthermore, this Mϕ subtype barely upregulated IL12B, encoding the p40 subunit of IL-12/IL-23, IL18, and CCL1 (cluster V), but expressed IL10.
To confirm the transcriptome data, we measured the cytokines in the culture supernatants of the activated Mϕs (Figure 1D). LPS + IFNγ-stimulated Mϕs of both lineages released high amounts of proinflammatory cytokines TNF-α, IL-1β, and IL-6 and immunoregulatory TGF-β. These cytokines were slightly better produced by the GM-CSF-dependent subtype. However, the two cell types showed clear differences in secretion of the Th1- and Th17-instructing cytokines IL-12 and IL-23: GM-CSF-differentiated Mϕs scored highly positive, while those differentiated by M-CSF did not; instead, they produced high levels of IL-10 and VEGF.
Taken together, these results reveal a distinct response of GM-CSF- and M-CSF-differentiated Mϕs to LPS + IFNγ stimulation that is not apparent on transcriptome-wide level, and indicate that M-CSF-differentiated/LPS + IFNγ-stimulated Mϕs with the M1/M2 profile might be less inflammatory.
M1-Stimulated M-CSF-Dependent Mϕs Inhibit T Cell Responses
Next, we probed for Mϕ ability to stimulate T cells. In coculture experiments with CFSE-labeled autologous CD4+ T cells, no Mϕ subtype activated T cells without ectopic T cell antigen receptor (TCR) triggering, as revealed by co-staining of the T cell activation markers CD69 and CD147 on day 2. But in the presence of soluble CD3 mAb, all subtypes were able to provide T cells with the necessary second stimulus (Figure 2A). Yet, the degree of T cell activation varied, with the lowest percentage of activated (CD69+CD147hi) T cells when cocultivated with the M-CSF-differentiated/LPS + IFNγ-stimulated Mϕs (Figures 2A,B). We found that this was due to the impaired upregulation of the late activation marker CD147 (30), while robustly upregulated CD69 (an early activation marker) and CD25 (an intermediate activation marker) (31) were not significantly affected (Figure S2A in Supplementary Material). T cells cocultured with M-CSF-differentiated/LPS + IFNγ-stimulated Mϕs also released lower amounts of IL-2, IFNγ, IL-4, and IL-10 compared to the other samples (Figure S2B in Supplementary Material). Hyporeactivity of these T cells was also detectable, when proximal TCR signaling was bypassed by restimulation with the mitogen PMA and the calcium ionophore ionomycin, as revealed by intracellular staining of IFNγ and IL-17A on day 5 (Figures 2C,D). In contrast, when cocultured with similarly activated GM-CSF-differentiated Mϕs, T cells released high levels of all cytokines measured (Figure S2B in Supplementary Material) and contained the highest frequency of IFNγ- and IL-17A-producing cells (Figures 2C,D).
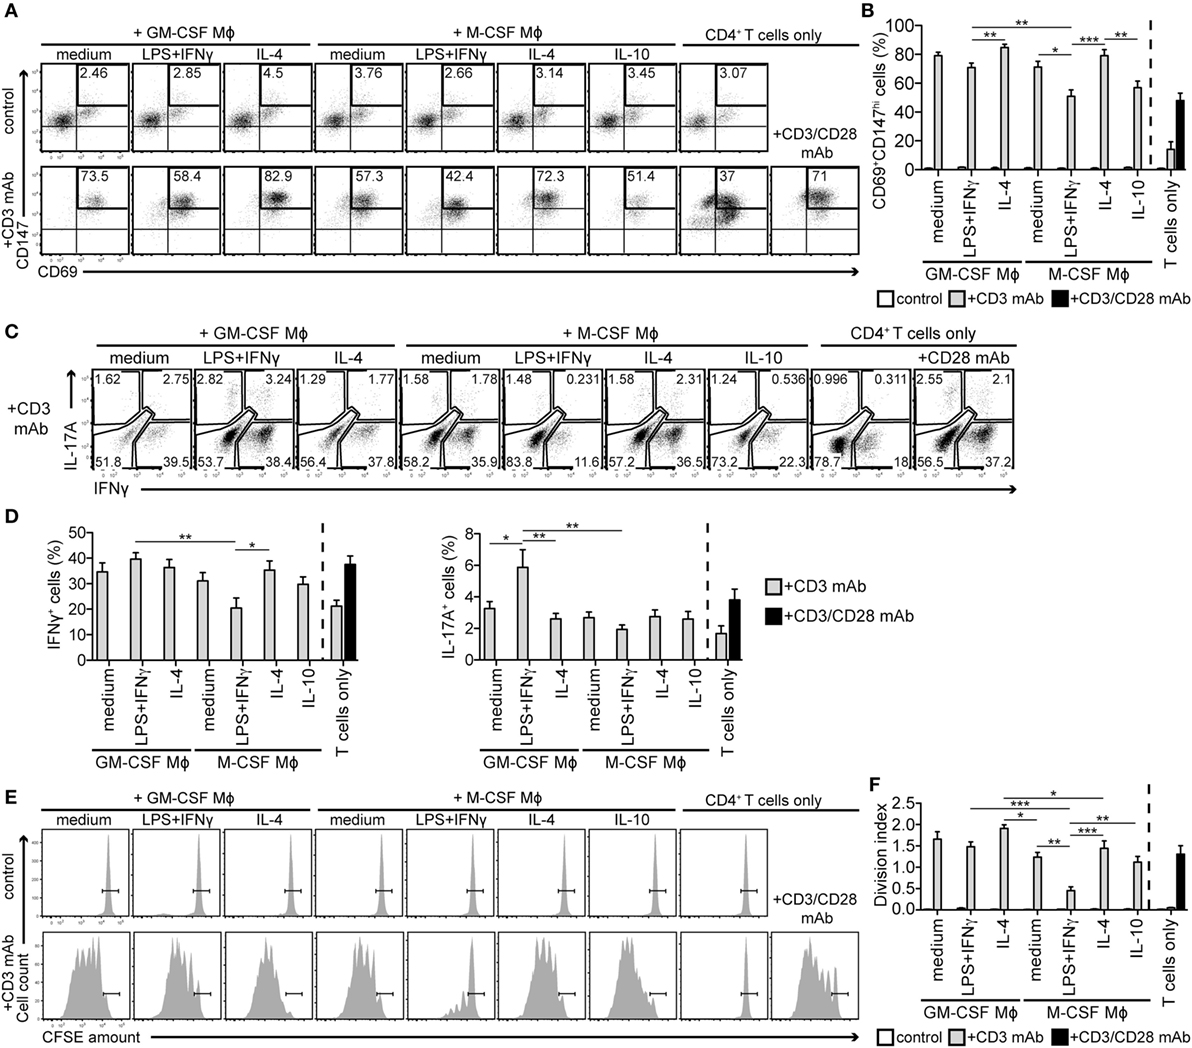
Figure 2. M-CSF-differentiated macrophages (Mϕs) activated with LPS + IFNγ suppress activation, cytokine production, and proliferation of autologous CD4+ T cells. Mϕs described in Figure 1 were cocultured with CFSE-labeled autologous CD4+ T cells in the presence or absence of the stimulating CD3 monoclonal antibody (mAb) OKT3. As a control, T cells were cultured alone as indicated. (A,B) CD4+ T cells were stained for activation markers CD69 and CD147 after 2 days coculture with different Mϕ subtypes. The percentage of activated cells is given in the CD69+CD147hi gate. One representative experiment (A) and statistics (B) of eight independent experiments is shown. (C,D) Mϕ subtypes were cocultured with unlabeled autologous CD4+ T cells in the presence of the CD3 mAb. After 5 days of coculture, T cells were restimulated with phorbol 12-myristate 13-acetate and ionomycin for 6 h and stained for IFNγ and IL-17A. One representative experiment (C) and the mean percentages (representing the sum of the respective single and double-positive gates) ± SEM (D) of the IFNγ- and IL-17A-expressing T cells of seven independent experiments are shown. (E) Proliferation of CFSE-labeled T cells cocultured with autologous Mϕs ± CD3 mAb was determined by CFSE dilution on day 7 using flow cytometry. One representative experiment, where CFSEhi non-dividing cells are gated, of nine independent experiments is shown. (F) T cell division index was calculated according to the CFSE peaks. Data represent means ± SEM of nine independent experiments. Expression of activation markers (B), cytokines (D), and proliferation (F) of the CD3-stimulated T cells in Mϕ cocultures were statistically evaluated by one-way ANOVA with Tukey’s posttest; *p < 0.05, **p < 0.01, ***p < 0.001.
Finally, we monitored T cell proliferation by quantitating CFSE dilution 7 days after coculture. As shown in Figure 2E, no Mϕ subtype was able to markedly induce T cell proliferation under control conditions. CD3 mAb-stimulated T cells cultured alone were found anergic, likely due to missing CD28-mediated co-stimulation, while high T cell proliferation was detected in cocultures with all types of GM-CSF-differentiated Mϕs and M-CSF-differentiated/IL-4-activated Mϕs (Figures 2E,F). In contrast, T cells cocultured with M-CSF-differentiated/LPS + IFNγ-activated Mϕs proliferated markedly less (Figures 2E,F). A time-course analysis showed that they practically stopped dividing between days 5 and 7 (Figure S2C in Supplementary Material). Based on these data, we speculated that a combination of M-CSF and proinflammatory stimuli drives Mϕs toward the immunosuppressive phenotype.
Mechanisms of T Cell Suppression Mediated by the Immunoregulatory Mϕ Subtype
To uncover the mechanism underlying this immunosuppressive phenotype, we tested induction of FOXP3+CD4+CD25+ regulatory T cells (Tregs). In control cocultures, the FOXP3+ cells were probably natural Tregs. As reported (32), FOXP3 expression moderately increased upon T cell activation. Lowest levels were detected in coculture with M-CSF-differentiated/LPS + IFNγ-stimulated Mϕs, revealing that they did not induce Treg differentiation (Figures S3A,B in Supplementary Material).
We, therefore, searched for cell-intrinsic mechanisms of immunoregulation. First, we checked antigen-presenting and costimulatory molecules. In agreement with the results of coculture assays, the potent stimulators (GM-CSF-differentiated Mϕs activated with LPS + IFNγ or IL-4) expressed highest levels of MHC class II and the costimulatory receptors CD80, CD86, CD40 and, in some donors, also the (glyco)lipid-presenting molecule CD1a. The immunosuppressive M-CSF-differentiated/LPS + IFNγ-stimulated Mϕs expressed high levels of MHCII, CD80, CD40, but not CD86 (Figures S3C,D in Supplementary Material). Nevertheless, since other M-CSF-differentiated T cell-stimulating subtypes expressed even lower levels of costimulatory molecules (Figures S3C,D in Supplementary Material) and M-CSF-differentiated/LPS + IFNγ-activated Mϕs suppressed T cell proliferation even in the presence of CD3 + CD28 mAbs (Figures S2D,E in Supplementary Material), we excluded missing co-stimulation as a possible mechanism.
Second, based on our microarray data we compared expression of genes, which were differentially regulated in response to LPS + IFNγ in GM-CSF- versus M-CSF-differentiated Mϕs. We focused on genes involved in T cell stimulation or inhibition (33). This analysis corroborated preferential upregulation of genes encoding proinflammatory cytokines (IL12B, TNF, IL6) and costimulatory molecules (red highlighted in Figure S3E in Supplementary Material) by GM-CSF-primed Mϕs, while both Mϕ lineages upregulated several genes associated with T cell inhibition or immunoregulation: IL10, CD274 (PD-L1), PDCD1LG2 (PD-L2), IDO1, IDO2, IL2RA (CD25), and SOCS1-SOCS3 (blue and green highlighted in Figure S3E in Supplementary Material). In subsequent staining experiments, we confirmed that PD-L1, which inhibits T cells by engaging PD-1 (33), and CD25, which scavenges IL-2 from T cells (34), were uniquely upregulated by LPS + IFNγ (Figure S3F in Supplementary Material). Since their surface expression varied minimally between the T cell-stimulating and T cell-inhibitory subset, they were unlikely to mediate T cell suppression. Similarly, we also excluded IL-10 as a sole mediator of the suppressor phenotype, as the blocking IL-10 mAb did not restore T cell proliferation in coculture experiments (data not shown).
Mϕs Alter Extracellular Purine Metabolism in Response to Proinflammatory Stimuli
Our search for LPS + IFNγ-regulated genes involved in T cell suppression revealed altered expression of several genes involved in adenosine metabolism and signaling (NT5E, coding for the ecto-5′-nucleotidase CD73, and adenosine receptors ADORA2A, ADORA2B; Figure S3E in Supplementary Material). Extracellular adenosine generated from ATP released by activated T cells was found to potently suppress T cell functions (34, 35). The canonical pathway responsible for conversion of extracellular ATP to adenosine (Figure S4A in Supplementary Material) is represented by ectonucleotidases CD39 (ENTPD1) and CD73 (36, 37). We, therefore, measured surface expression of these enzymes on Mϕs by flow cytometry. All types of M-CSF-differentiated Mϕs expressed high levels of surface CD39; GM-CSF-differentiated Mϕs scored also positively but to a lesser extent (Figures 3A,B) and exhibited a lower capacity to degrade exogenous ATP (Figure 3C). CD73 was specifically upregulated in LPS + IFNγ-activated Mϕs secreting high amounts of TGF-β, IL-1β, and TNF-α (Figure 1D), which were shown to induce CD73 in non-Mϕ cells (38, 39). Remarkably, on the surface of the immunostimulatory GM-CSF-differentiated Mϕs, CD39 and CD73 appeared in two different subpopulations in a mutually exclusive manner. In contrast, M-CSF-differentiated Mϕs contained a prominent CD39+CD73+ double-positive subpopulation (Figures 3A,B).
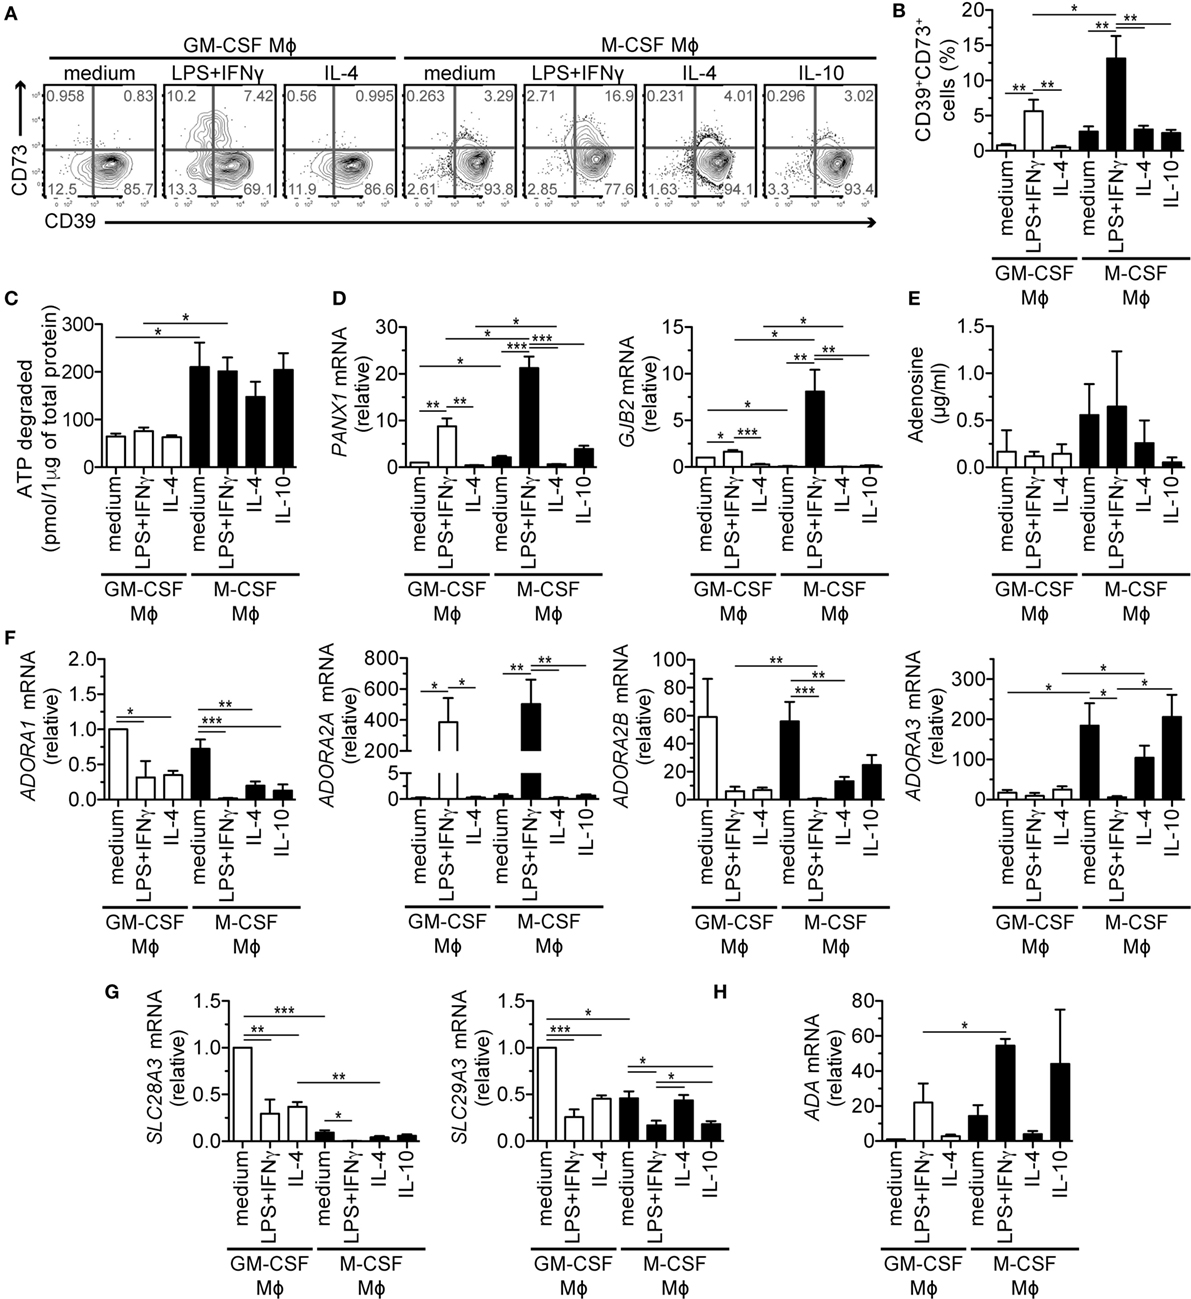
Figure 3. Expression and function of genes of the purinergic pathway upon LPS + IFNγ treatment of M-CSF- or GM-CSF-differentiated macrophages (Mϕs). Human Mϕ subtypes were prepared as described in Figure 1. (A,B) Surface expression of AMP- and adenosine-producing enzymes CD39 and CD73 on different Mϕ subsets was determined by flow cytometry. One representative experiment (A) and the mean percentages (±SEM) of CD39+CD73+ cells from five experiments are shown (B). (C) Degradation of 20 µM ATP by Mϕ subtypes. After 30 min, remaining ATP was measured and normalized to the Mϕ protein content. (D) mRNA expression of genes encoding ATP-releasing channels pannexin 1 (PANX1) and connexin 26 (GJB2) was analyzed by qRT-PCR. (E) Adenosine was measured in the cell-free culture supernatants by mass spectrometry. (F–H) mRNA expression of genes encoding (F) adenosine receptors (ADORA1-3), (G) adenosine uptake channels (SLC28A3, SLC29A3) and (H) the adenosine-catabolizing enzyme adenosine deaminase (ADA) was analyzed by qRT-PCR. To compare the expression of the various adenosine receptors, we normalized the data to ADORA1 mRNA levels in GM-CSF control Mϕs that were set to one. Other genes were normalized to the respective levels found in GM-CSF control Mϕs that were set to one (D,G,H). Data in (C–H) represent mean values ± SEM of three (C,D,G,H) to five (E,F) donors. Statistical significance was assessed by one-way ANOVA with Tukey’s posttest; *p < 0.05, **p < 0.01, ***p < 0.001.
Cohen et al. reported that mouse Mϕs release ATP in response to TLR stimulation through pannexin-1 (Panx1) channels (40). In line with these data, we detected profound upregulation of the PANX1 and GJB2 transcripts, which code for the ATP-releasing channels Panx1 and connexin-26 in the immunosuppressive Mϕs (Figure 3D). Other ATP-releasing channels, P2X and P2Y nucleotide receptors were expressed similarly by several subtypes (Figure S4B in Supplementary Material). To test whether M-CSF- and LPS + IFNγ-stimulated Mϕs indeed produce adenosine in a Panx1/connexin-26/CD39/CD73-dependent manner, we measured extracellular adenosine in Mϕ culture media. We detected the highest levels of adenosine in supernatants of M-CSF-differentiated Mϕs activated with the M1 stimuli, but these differences were not significant (Figure 3E). Therefore, we assessed the expression of adenosine-binding and -degrading proteins (Figures 3F–H; Figure S4B in Supplementary Material). Adenosine receptor transcripts, encoded by the ADORA genes, intensely fluctuated (Figure 3F): ADORA1 mRNA levels were minimal and together with ADORA2B transcripts, they decreased upon Mϕ activation, while ADORA3 was predominantly expressed in the M-CSF lineage with exception of the LPS + IFNγ-stimulated subset. The most prominent change was detected in ADORA2A transcripts upon LPS + IFNγ treatment that increased most in the immunosuppressive M-CSF-differentiated subtype. Notably, this subtype expressed the lowest amounts of other adenosine receptors and adenosine reuptake channels SLC28A3 and SLC29A3 (Figure 3G); however, it expressed high levels of adenosine-catabolizing adenosine deaminase (Figure 3H). Taken together, these data indicate that proinflammatory stimuli affect gene expression of the purinergic pathway in Mϕs. Further, they suggest that extracellular adenosine production and signaling is more efficient in the M-CSF than in the GM-CSF lineage.
The Mϕ Purinergic Pathway Dynamically Responds to Changes in Extracellular Nucleotides
In order to assess the functionality of the purinergic pathway in LPS + IFNγ-stimulated Mϕs, we blocked the prime enzyme CD39 with the small molecule inhibitor POM-1 during the 2-day activation step. We observed that the CD39 blockade suppressed the LPS + IFNγ-upregulated expression of PANX1 and GJB2 transcripts, encoding the ATP-releasing channels (Figure 4A). The POM-1 treatment further increased the LPS + IFNγ-induced expression of CD73 in the T cell activating (GM-CSF-differentiated) and especially in the immunosuppressive (M-CSF-differentiated) subtype, enhancing the CD39+CD73+ subpopulation, while no such effect was observed in the other Mϕ subtypes (Figures 4B,C). POM-1-mediated upregulation of CD73 in LPS + IFNγ-treated Mϕs was likely caused by accumulated extracellular ATP resulting from CD39 inhibition, because exogenously added ATP was also able to increase CD73 expression, although significance was reached only in the M-CSF-dependent subset (Figures 4D,E). Based on these results, we speculated that CD73 expression could be also modulated by extracellular adenosine in a negative feedback loop. Indeed, we observed a trend toward the reduction of CD73 expression on the surface of both LPS + IFNγ-stimulated Mϕs that were treated exogenously with adenosine (Figures 4F,G). Taken together, these data suggest that the expression of several genes of the purinergic pathway in Mϕs is modulated by extracellular ATP and its degradation products to ensure optimal functionality of the pathway.
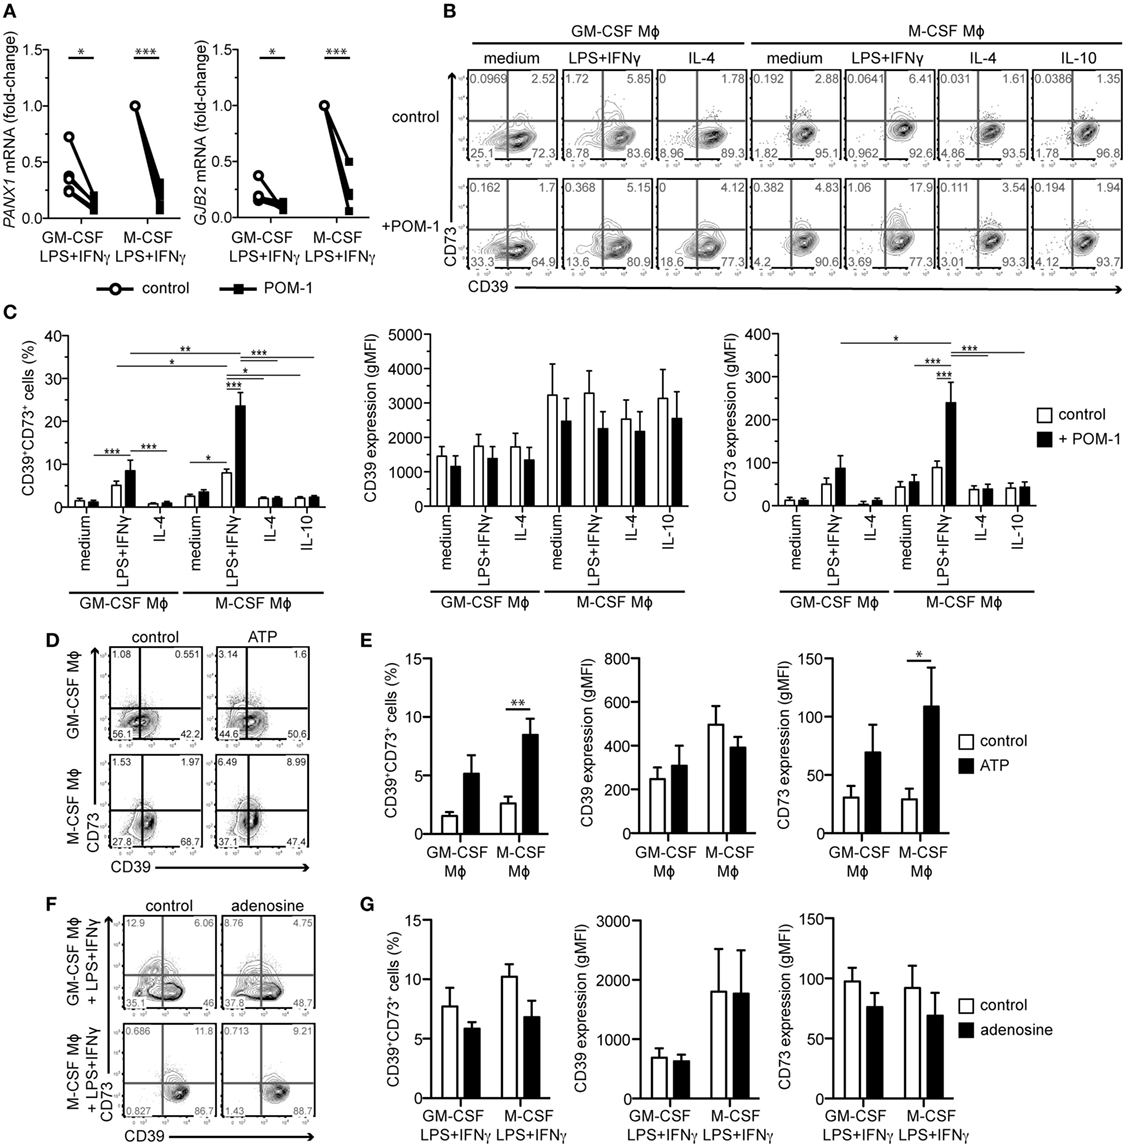
Figure 4. Effects of the CD39 inhibitor POM-1, extracellular ATP, and extracellular adenosine on expression of ATP release channels and adenosine-producing enzymes. (A) Macrophages (Mϕs) of both lineages were activated for 2 days with LPS + IFNγ in the absence (control) or presence of 20 µM POM-1. Expression of the genes encoding ATP release channels PANX1 and GJB2 was then analyzed by qRT-PCR. To compare gene expression, the data were normalized to the mRNA levels in the M-CSF LPS + IFNγ-stimulated Mϕs that were set to one. Data represent five different donors. (B–G) Mϕs were differentiated and activated as indicated. POM-1, ATP, adenosine, or respective controls were added during the activation step. (B) The expression of CD39 and CD73 on the indicated Mϕ subtypes in the absence or presence of 20 µM POM-1 was analyzed by flow cytometry. (C) Quantification of the data shown in (B) (n = 12). (D,E) Expression of CD39 and CD73 on GM-CSF or M-CSF-differentiated Mϕs in the absence or presence of 100 µM ATP was analyzed by flow cytometry. One representative experiment (D) and statistics from four independent experiments (E) is given. (F,G) Flow cytometry analysis of CD39 and CD73 expression on the surface of LPS + IFNγ-stimulated GM-CSF- or M-CSF-differentiated Mϕs in the absence or presence of 10 µM adenosine. One representative experiment (F) and statistics from four independent experiments (G) is given. Statistical significance was assessed by unpaired two-tailed t-test or one sample t-test for GM-CSF- or M-CSF-differentiated Mϕs, respectively (A) or by two-way ANOVA with Bonferroni posttest (C,E,G); *p < 0.05, **p < 0.01, ***p < 0.001.
Mϕs Enrich CD39 Within the Immunological Synapse to Attenuate T Cell Activation
In response to TCR stimulation, T cells release ATP into the immunological synapse that significantly contributes to localized calcium entry by the P2X1 and P2X4 ATP-gated calcium channels and T cell activation (41). To scrutinize whether T cell-derived ATP, converted to adenosine by Mϕ ectonucleotidases, contributes to immunosupression, we analyzed the first minutes of the CD3 mAb-mediated interaction between M-CSF-differentiated/LPS + IFNγ-activated Mϕs and CD4+ T cells by live cell video microscopy. CD39+CD73+, CD39+CD73− and the seldomly observed CD39−CD73+ Mϕs exhibited lower capacity to engage T cells into an active immunological synapse than their CD39−CD73−counterparts (Figure 5A). Nevertheless, early T cell signaling was not blocked by the CD39+CD73+ Mϕs, since T cells increased intracellular calcium when they eventually got engaged. This prompted us to analyze the expression of the adenosine receptors in T cells. In line with the published data (42, 43), we found that the ADORA2A and ADORA2B transcripts gradually increased during T cell activation until day 3 (Figure S5 in Supplementary Material).
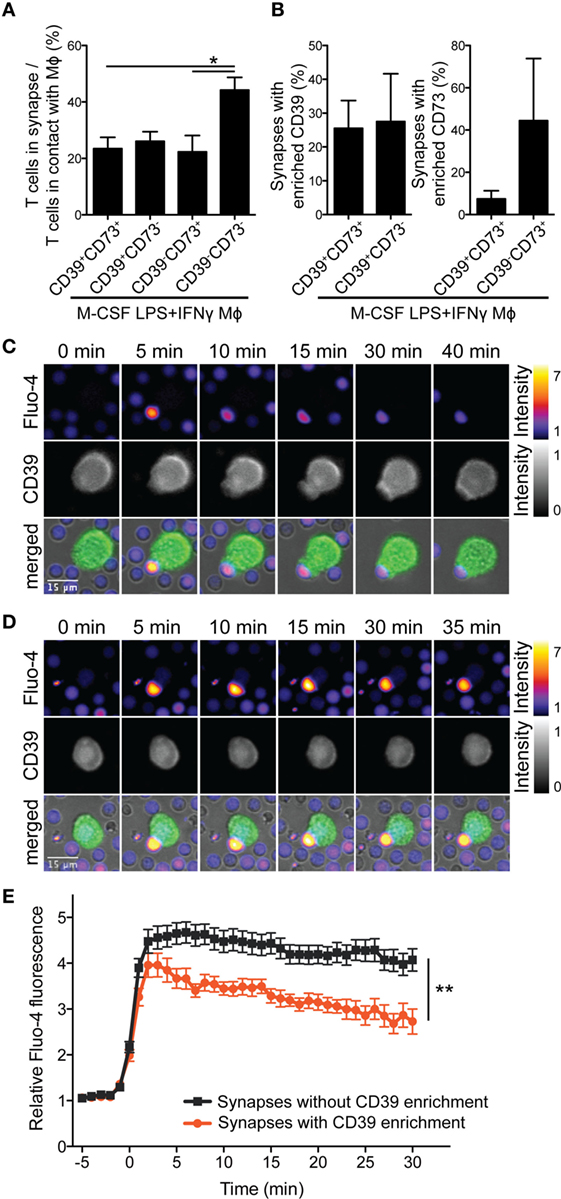
Figure 5. CD39 on M-CSF-differentiated and LPS + IFNγ-activated macrophages (Mϕs) influences the frequency of the synapse formation and the quality of the calcium response of engaged CD4+ T cells. Human Mϕs were differentiated for 7 days with M-CSF and then activated for 2 days with LPS + IFNγ. Afterward, they were loaded with CD3 monoclonal antibody (mAb), stained with PE-conjugated CD73- and Brilliant Violet 421-conjugated CD39 mAbs, and incubated with Fluo-4-loaded autologous CD4+ T cells. Time-lapse microscopy images were acquired every minute for 45–55 min. (A) The average numbers of T cells engaged in the synapse and T cells that touched CD39+CD73+, CD39+CD73−, CD39−CD73+, or CD39−CD73− Mϕs were counted. Data are mean ± SEM of three experiments. Statistical significance was assessed by one-way ANOVA with Tukey’s posttest; *p < 0.05. (B) Mean percentage of Mϕ-T cell conjugates, where Mϕ CD39 or CD73 were enriched in the immunological synapse. (C,D) Montage of synapse formation between a CD39+CD73− Mϕ and a Fluo-4-labeled autologous CD4+ T cell, where Mϕ CD39 was recruited to the immunological synapse (C) or not (D). Time was counted from the initial contact between the T cell and the Mϕ. In overlays, Fluo-4 (in pseudocolor; range is depicted on the right), CD39 (in green) and brightfield pictures are shown. (E) Quantification of mean calcium signals of engaged Fluo-4-loaded CD4+ T cells from (C,D) over time. Data represent mean values ± SEM of 20 or 45 cells, respectively, calcium flux of which was traceable for >22 min. To statistically compare the traces, the area under curve (for fluxes 0–22 min) was calculated for each cell and groups were compared by unpaired two-tailed t-test; **p < 0.01.
Of note, we observed that in ≈26% synapses of CD39+ Mϕs, CD39 staining was more intense than in areas outside of the synapse (Figures 5B,C), while CD73 was rarely enriched in these synapses. Furthermore, the recruitment of Mϕ CD39 into the immunological synapse was associated with a more rapid decrease of intracellular calcium flux in engaged T cells (Figures 5C–E; Movies S1 and S2 in Supplementary Material). These observations point to an essential role of Mϕ CD39 in modulating early phases of T cell activation. The CD39/CD73-generated adenosine did not seem to be crucial at this stage, possibly due to the low expression of adenosine receptors on resting and recently activated T cells (Figure S5 in Supplementary Material).
CD39 Blockade Abrogates Mϕ Immunosuppressive Functions
Extracellular adenosine is well-known to dampen proinflammatory responses of immune cells, including Mϕs (35, 37, 44). To scrutinize the autocrine effects of adenosine generated from ATP by the Panx1/connexin-26/CD39/CD73-dependent mechanism in the immunoregulatory Mϕs, we treated Mϕs of both lineages with LPS + IFNγ and the CD39 inhibitor POM-1. After 2 days, we examined the expression of cytokine genes. Upon POM-1 treatment, we observed a more proinflammatory phenotype in the immunosuppressive M-CSF-differentiated subtype with enhanced IL6, IL12B, and IL23A expression. Further, IL10 expression was reduced in three donors (Figure 6A). On the other hand, the highly expressed IL6 and IL23A genes in the GM-CSF-differentiated subtype were rather downregulated by POM-1. Surprisingly, the highly expressed TNF was mildly downregulated in both Mϕ subtypes.
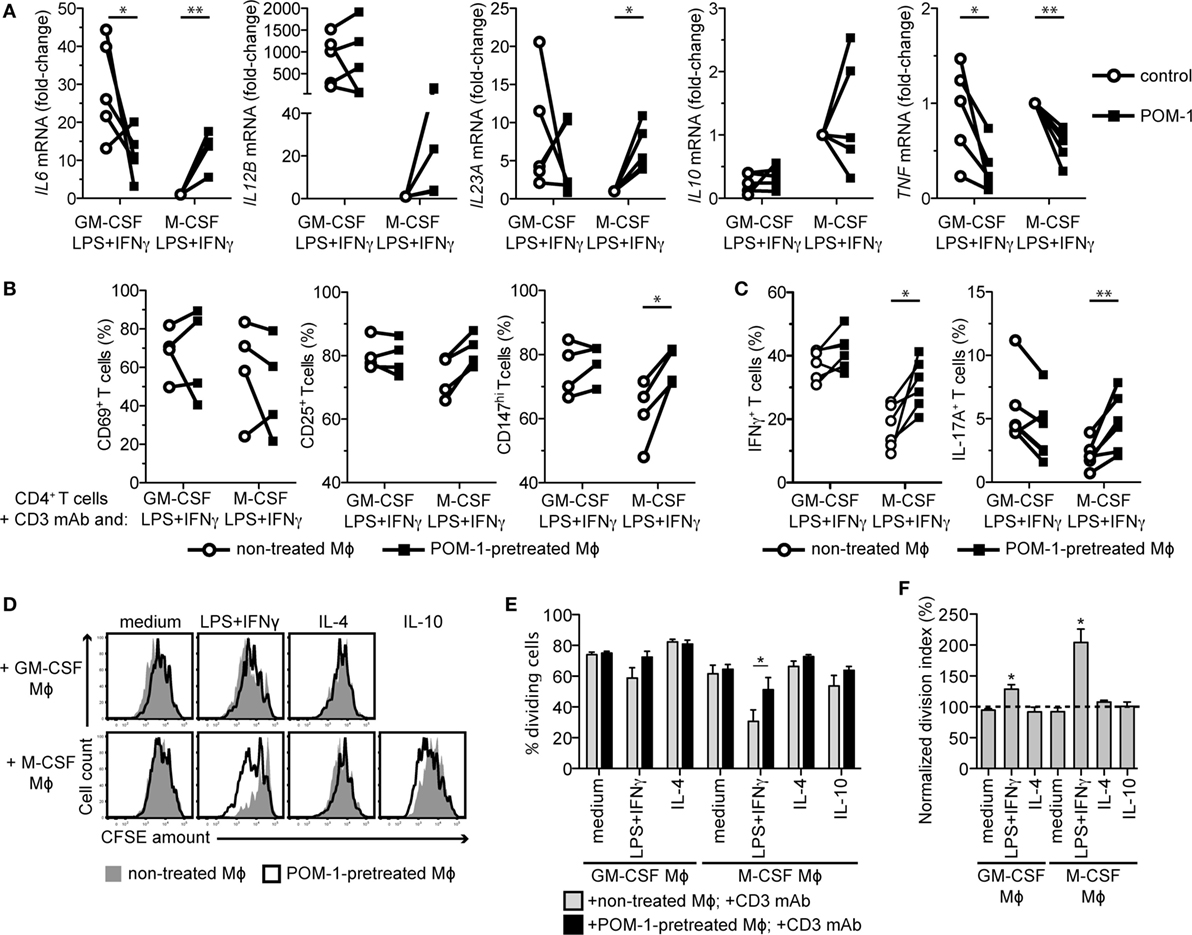
Figure 6. CD39 blockade by POM-1 mitigates the immunosuppressive phenotype of M-CSF-dependent LPS + IFNγ-activated macrophages (Mϕs). (A) Human Mϕs were differentiated for 7 days with GM-CSF or M-CSF and then activated for 2 days with LPS + IFNγ in the absence (control) or presence of 20 µM POM-1. Expression of the cytokine genes was then analyzed by qRT-PCR. To compare gene expression, the data were normalized to the mRNA levels in the M-CSF LPS + IFNγ-stimulated Mϕs that were set to one. Data represent five different donors. Statistical significance was assessed by unpaired two-tailed t-test or one sample t-test in case of M-CSF Mϕs. (B) Mϕs from (A) were cocultured with autologous CD4+ T cells in the presence of the CD3 monoclonal antibody (mAb). After 2 days, T cells were stained for the activation markers CD69, CD25, and CD147 and analyzed by flow cytometry. Percentages ± SEM from activation marker-positive T cells from four experiments is given. (C) On day 5 of coculture, T cells were restimulated with phorbol 12-myristate 13-acetate and ionomycin for 6 h and stained for IFNγ and IL-17A. Percentages ± SEM of the IFNγ- and IL-17A-expressing T cells of six independent experiments are shown. (D) Mϕs were differentiated for 7 days, activated for 2 days as indicated in the absence (control) or presence of 20 µM POM-1 and then cocultured with CFSE-labeled autologous CD4+ T cells stimulated (or not) with the CD3 mAb. Proliferation of T cells cocultured with non-treated Mϕs (filled gray histograms) or with the POM-1-pretreated Mϕs (open black histograms), respectively, was determined by quantifying the CFSE dilution after 7 days using flow cytometry. One representative of four experiments is shown. POM-1 pretreatment had no effect onto negligible proliferation of T cells in control cocultures without the CD3 mAb, thus these data are not shown. (E) The percentage of dividing T cells (from the parental population) cocultured with control or POM-1-pretreated Mϕs was calculated according to the CFSE peaks. (F) To determine the contribution of the CD39 blockade to the T cell proliferation, the division index of T cells cocultured with POM-1-pretreated Mϕs was normalized to the division index of respective T cells cocultured with control Mϕs. (E,F) Data represent means ± SEM of four independent experiments. Activation (B) and cytokine production (C) of the CD3 mAb-stimulated T cells was assessed by unpaired two-tailed t-test. Proliferation was statistically evaluated by two-way ANOVA with Bonferroni posttest (E) or one sample t-test (F), respectively; *p < 0.05, **p < 0.01, ***p < 0.001.
To further inspect the functional consequence of the CD39 blockade, we cocultured control and POM-1-pretreated Mϕs with autologous CD4+ T cells. POM-1 pretreatment of the M-CSF-differentiated/LPS + IFNγ-stimulated Mϕs abrogated their T cell-suppressive function, resulting in enhanced expression of the intermediate and late activation markers CD25 and CD147 on day 2 (Figure 6B), increased frequency of cytokine-producing T cells on day 5 (Figure 6C), and substantially enhanced T cell proliferation on day 7 (Figures 6D–F). In contrast, T cells cocultured with similarly treated GM-CSF-differentiated Mϕs produced lower amounts of IL-17A than T cells cocultured with Mϕs that were not treated with the CD39 inhibitor (Figure 6C). This correlated with POM-1-mediated changes of the IL6 mRNA expression in the GM-CSF- and LPS + IFNγ-stimulated Mϕs (Figure 6A). Yet, the POM-1 pretreatment of this subtype had only minor effect on subsequent T cell proliferation, while pretreatment of all other Mϕ subtypes did not significantly affect T cells (Figures 6D–F). Thus, these data demonstrate that in response to the proinflammatory stimuli, M-CSF-differentiated Mϕs produce adenosine that skews them toward the immunoregulatory subtype, leading to T cell inhibition. In contrast, adenosine production by the GM-CSF-dependent Mϕs rather seems to potentiate their proinflammatory properties.
FRβ+ Mϕs Co-Express CD39 and CD73 In Vivo
To investigate whether adenosine-producing Mϕs play a role in inflammatory processes in vivo, we analyzed synovial fluid derived from patients with inflammatory arthritis by flow cytometry (Figure 7A). CD16+MHCII−/lo granulocytes with weak CD39 expression represented the most abundant population in synovial fluid (Figures 7B,C). We used FRβ staining to discriminate between GM-CSF- and M-CSF-dependent monocytes/Mϕs (Figure 1A; Figure S1 in Supplementary Material) among the MHCII+CD11b+ cells. In line with our in vitro data, FRβ+ monocytes/Mϕs expressed significantly higher levels of CD39, CD73 as well as CD163 than FRβ− monocytes/Mϕs (Figures 7C,D).
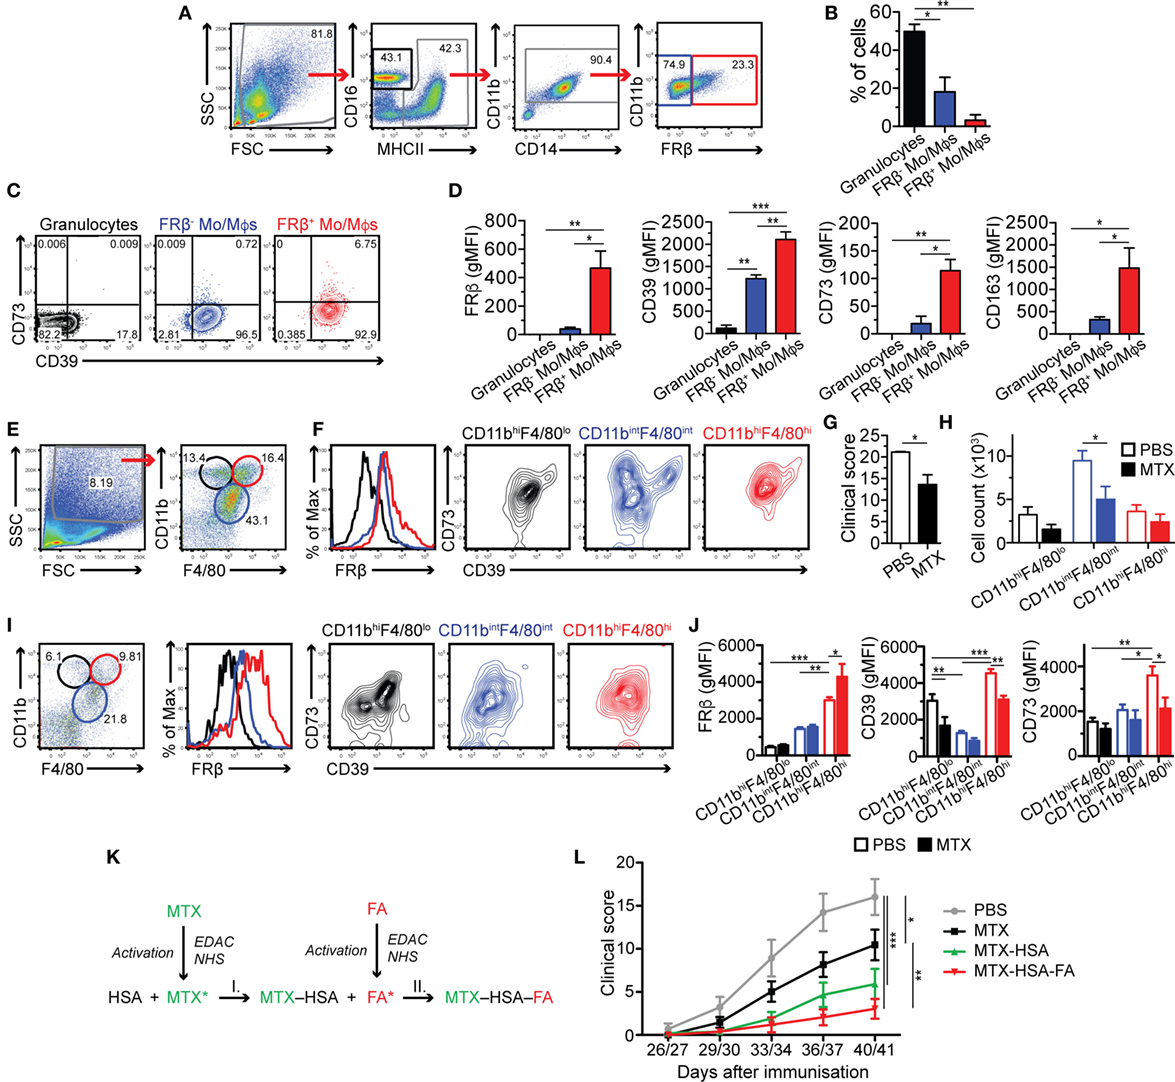
Figure 7. FRβhiCD39+CD73+ macrophages (Mϕs) are present in arthritic joints of man and mouse and their targeting with methotrexate (MTX) suppresses joint inflammation. (A) Gating strategy to identify innate immune cell populations in the knee synovial fluid from arthritis-affected patients analyzed by flow cytometry. Granulocytes were identified as CD16hiMHCII−/lo (black gate). MHCII+CD11b+CD14+ M-CSF-dependent monocytes/macrophages (Mo/Mϕs) were discriminated by prominent folate receptor β (FRβ) staining (red gate), while GM-CSF-dependent Mo/Mϕs were identified as FRβ− (blue gate). (B) Frequency of CD16hiMHCII−/lo granulocytes, FRβ− and FRβ+ Mo/Mϕs in the synovial fluid of arthritis-affected patients. Data represent mean ± SEM of three patients. (C) CD39 and CD73 co-expression on granulocytes, FRβ− and FRβ+ Mo/Mϕs present in the synovial fluid of arthritis-affected patients. One representative staining of three patients is shown. (D) FRβ, CD39, CD73, and CD163 surface expression [measured as the geometric mean of fluorescence intensity (gMFI)] in the three populations was statistically evaluated. Data represent mean ± SEM of three experiments. (E) Cells, isolated from ankles of arthritic DBA/1JRj mice, were analyzed by flow cytometry using the forward and side-scatter characteristics and CD11b and F4/80 expression. Three distinct populations were identified: CD11bhiF4/80lo cells (black gate), CD11bintF4/80int Mϕs (blue gate), and CD11bhiF4/80hi Mϕs (red gate). (F) The populations were analyzed for FRβ (histogram on the left), CD39, and CD73 expression (contour plots on the right). (G) Clinical score of mice treated with PBS or MTX, respectively, on day 41. (H) Quantification of CD11bhiF4/80lo, CD11bintF4/80int, and CD11bhiF4/80hi subsets isolated from ankles of PBS- or MTX-treated arthritic mice [representative dot plots shown in (E,I)] within the forward and side-scatter gate [shown in (E), left]. (I) CD11bhiF4/80lo, CD11bintF4/80int, and CD11bhiF4/80hi populations from MTX-treated arthritic mice (dot plot on the left), and their FRβ (histogram in the middle), CD39 and CD73 expression (contour plot on the right). One representative of two similar experiments of 3 + 3 mice; where each ankle was analyzed separately. (J) FRβ, CD39, and CD73 surface expression (measured as gMFI) shown in (F,I) was statistically evaluated. Data represent mean ± SEM of 3 + 3 mice with two ankles analyzed separately. (K) Conjugation strategy using N-(3-dimethylaminopropyl)-N-ethylcarbodiimide hydrochloride (EDAC) and N-hydroxysuccinimide (NHS), to create MTX-human serum albumin (HSA) conjugates (conjugation I) and MTX-HSA-folic acid (FA) conjugates (step I + II). (L) Mean clinical score (±SEM) of mice treated with various MTX formulations. Data are pooled from two independent experiments with 7–12 mice/group. The treatment and scoring in the second experiment was done one day earlier than in the first one. Statistical significance was assessed by one-way ANOVA (B,D), unpaired two-tailed t-test (G) and two-way ANOVA (H,J,L). *p < 0.05, **p < 0.01, ***p < 0.001.
To further confirm our findings we analyzed myeloid cells from ankles of DBA/1JRj mice, in which we had induced arthritis using type II collagen (29). By co-staining with F4/80 and CD11b markers, we identified three distinct populations (Figure 7E): CD11bintF4/80int, CD11bhiF4/80hi, and CD11bhiF4/80lo cells, the latter most likely corresponding to granulocytes. CD11bintF4/80int Mϕs were most abundant and showed relatively low expression of FRβ and CD39 (Figure 7F). In contrast, CD11bhiF4/80hi Mϕs, which are known to be M-CSF-dependent (45), were highly positive for FRβ, and, similarly to the human M-CSF-dependent Mϕs they co-expressed CD39 and CD73 (Figure 7F).
Targeting of FRβ+CD39+CD73+ Mϕs With MTX Alleviates Arthritis
To ascertain whether adenosine produced by the FRβ+CD39+CD73+ Mϕ subset is implicated in control of joint inflammation, we treated the collagen II-immunized DBA/1JRj mice before arthritis onset (starting day 14 and then every 3–4 days) with the folate antagonist MTX. MTX exhibits an anti-rheumatic effect through inhibition of several enzymes involved in nucleotide synthesis, leading to release of adenine nucleotides to the extracellular space and their CD39 and CD73-dependent conversion to adenosine (46–48). Indeed, upon MTX treatment, we observed a reduction in the clinical score (Figure 7G) that was accompanied by the reduction of all monitored populations, with the CD11bintF4/80int population affected the most by the MTX treatment (Figures 7H,I). In line with the in vitro data (Figures 4F,G), we detected that MTX treatment caused CD73 downregulation in all subsets, though only on the CD11bhiF4/80hi subset the difference was significant. Additionally, we observed that CD39 was also expressed at lower levels (Figures 7I,J). These data demonstrate that MTX treatment is able to control inflammation in the arthritic joints and normalizes expression of adenosine-producing enzymes CD39 and CD73.
MTX can be transported into cells by FRβ, but its affinity to the receptor is ≈50 times lower in comparison to the prime FRβ ligand, FA (49). To specifically target FRβ+CD39+CD73+ Mϕs with MTX, we coupled both MTX and FA to HSA as carrier (MTX-HSA-FA; Figure 7K). As controls, we used free MTX or MTX conjugated to HSA (MTX-HSA), and compared the clinical benefit of the three MTX formulations in the CIA model. PBS-treated control mice developed severe arthritis over time (Figure 7L). As seen previously, MTX significantly reduced the clinical score of the arthritic mice compared to PBS treatment. MTX efficacy was further improved, but not significantly, by its coupling to HSA, which is best explained by a better retention of the HSA conjugates within inflamed tissues (50). Strikingly, the MTX-HSA-FA conjugate improved significantly the clinical score of the treated mice compared to free MTX. On the last evaluation day, the mean arthritic score of the MTX-HSA-FA-treated mice was reduced to one-third or half, compared to the MTX-treated or MTX-HSA-treated mice, respectively. Altogether, specific targeting of the adenosine-producing FRβ+CD39+CD73+ Mϕs with MTX potently alleviates the clinical signs of arthritis in the CIA mouse model.
Discussion
Breaking self-tolerance leading to emergence of autoreactive T cells and autoantibodies is a hallmark of RA, suggesting that the disease is initiated by aberrant antigen presentation to T cells or aberrant antigen-specific T cell response (11, 51). Mϕs are the most abundant professional antigen-presenting cells in inflamed synovia (12), implying them as main drivers of pathogenic T cells. In the present study, we provide a comprehensive analysis of the interaction between Mϕs and T cells, which provides valuable insights in the molecular causes underlying perpetuating inflammation in RA-affected tissues. Based on our analysis, we also propose a therapeutic avenue to skew the balance toward resolution of inflammation (Figure 8).
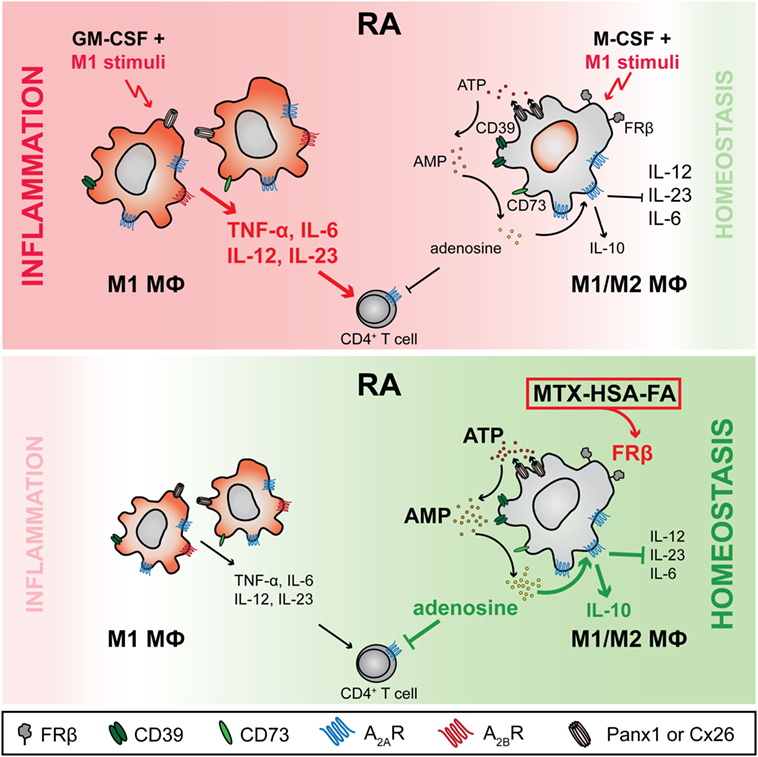
Figure 8. Working model—purinergic signaling differs in M-CSF- and GM-CSF-dependent macrophages (Mϕs): FRβ-targeted delivery of methotrexate (MTX) can restore homeostasis by boosting adenosine production in chronic inflammatory disorders. In rheumatoid arthritis (RA), Mϕs depending on Mϕ colony-stimulating factor (M-CSF) and expressing high levels of folate receptor β (FRβ) and CD39, in response to proinflammatory stimuli upregulate ATP-releasing channels pannexin-1 (Panx1) and connexin-26 (Cx26) as well as the ectonucleotidase CD73. As a direct consequence, this Mϕ subset produces high levels of extracellular adenosine, which acts in an autocrine fashion through adenosine 2A receptors (A2ARs) to inhibit proinflammatory Mϕ responses. In particular, the release of proinflammatory cytokines (IL-6, IL-12, IL-23) is decreased while secretion of anti-inflammatory IL-10 is induced. Further, they suppress autoreactive T cells in a paracrine fashion. In contrast, adenosine production by the FRβ−/lo Mϕs, the prevalent Mϕ species in RA joints, is inadequate due to a markedly lower expression of Panx1 and Cx26 and much reduced co-expression of CD39 and CD73. Furthermore, this GM-CSF-dependent Mϕ subset expresses the adenosine 2B receptor (A2BR), which triggers upon recognition of adenosine IL-6 and IL-23 production, leading to an enhanced Th17 response. As a result, only FRβ-targeted delivery of MTX to FRβ+CD39+CD73+ Mϕs via a MTX-HSA-FA conjugate boosts adenosine-mediated immune suppression and restores homeostasis.
To generate various Mϕ subtypes that resemble Mϕs present in RA tissues (12–16), and assess their effect onto T cell responses without contribution of bystander cells, we employed an in vitro coculture system of highly pure monocyte-derived Mϕs and autologous CD4+ T cells. We observed diametrically distinct Mϕ responses to proinflammatory stimuli (LPS + IFNγ), depending on the differentiation factor that was used for Mϕ generation. While GM-CSF-differentiated Mϕs were highly proinflammatory, M-CSF-dependent Mϕs, which were marked by pronounced and stable FRβ expression both in humans and mice, did not exhibit a classical M1 activation status, but rather a mixed M1/M2 phenotype seen also by others (52–54). Additionally, M-CSF-dependent LPS + IFNγ-stimulated Mϕs profoundly suppressed T cells, which is widely considered a prominent feature of M2 Mϕs (55–57). We demonstrated that this suppressive activity toward T cells as well as the M1-to-M2 shift was caused by the alteration of the Mϕ purinergic pathway leading to production and response to extracellular adenosine. The first product of the purinergic pathway, extracellular ATP released in response to TLR ligands, has been considered proinflammatory due to P2X7-dependent activation of the NLRP3 inflammasome and subsequent IL-1β and IL-18 release (58). However, Cohen et al. showed that extracellular ATP in mouse Mϕs acted in an anti-inflammatory manner due to the catabolic reaction provided by CD39 (40). We confirm and expand these data by showing that Mϕ CD39 is crucial for restraining early phases of T cell activation by local ATP degradation in the immunological synapse. However, CD39 degrades ATP to ADP and AMP only (37), and therefore, its catabolic activity must be paired with the AMP-degrading enzyme CD73, which we found to be upregulated by the proinflammatory stimuli and extracellular ATP, to efficiently produce adenosine. Mϕ-generated adenosine can then directly inhibit effector T cells by signaling through the high-affinity A2A receptor that mediates most of the immunosuppressive effects of adenosine in immune cells by increasing intracellular cAMP (35, 37). Expression of the A2A receptor in T cells is activation-induced (36, 42), which explains our observation that early T cell signaling was not entirely blocked, despite later inhibitory effects evidenced by lower expression of activation markers, cytokines and markedly reduced proliferation.
In addition to the effect on T cells, Mϕ-generated adenosine can also shape Mϕ phenotype via autocrine signaling and the effects of exogenously added adenosine or specific receptor agonists are well documented [reviewed in Ref. (35, 37, 44)]. Adenosine A2A receptor stimulation inhibits TLR-mediated synthesis of TNF-α, IL-6 and IL-12, increases IL-10, VEGF, but also IL-1β (44, 59–63). On the other hand, signaling through the A2B receptor alleviates TNF-α, IL-12 and potentiates IL-6 and IL-10 production (44, 64, 65). Alternatively, adenosine A1 and A3 receptor signaling leading to cAMP inhibition is thought to promote cell activation (35, 44). The cytokine profile of the immunosuppressive M-CSF-dependent Mϕ subtype is in line with adenosine signaling through the A2A receptor, which we found highly expressed in response to the proinflammatory stimuli. Our experiments with the CD39 inhibitor POM-1 to block adenosine generation, resulting in increased IL12B and IL6 (and decreased IL10) strengthened this hypothesis. The downregulation of the other adenosine receptors and nucleoside transporters by this Mϕ subset might account for the bias toward the immunoregulatory phenotype.
Although FRβ− GM-CSF-differentiated Mϕs modulated expression of several genes of the purinergic pathway in response to LPS + IFNγ, adenosine production by this subset was low, either due to poor co-expression of CD39 and CD73, as reported for non-suppressive memory T cells (66, 67), or fast consumption through adenosine receptors and reuptake channels. POM-1-mediated downregulation of IL6 expression further implied that GM-CSF-dependent Mϕs employed signaling via the A2B receptor to enhance IL-6 levels upon stimulation with LPS + IFNγ, and skewed T cells in coculture experiments toward the Th17 lineage. In addition to IL6, POM-1 also inhibited IL23A expression in GM-CSF- and LPS + IFNγ-stimulated Mϕs, which together with IL-6 and either IL-1β or TGF-β, is necessary for the development of pathogenic Th17 cells (68, 69).
Interestingly, we found predominance of Mϕs with a phenotype similar to GM-CSF- and LPS + IFNγ-stimulated Mϕs (i.e., FRβ−/lo and non-overlapping expression of CD39 and CD73) in arthritis-affected joints in both humans and mice. Based on our in vitro data, we presume that these Mϕs had developed in response to GM-CSF produced in high amounts by synovial CD4+ T cells (70). In humans, GM-CSF production is primarily linked to Th1 cells (70, 71). In mice, GM-CSF expression is directly confined to the Th17 subset (72, 73). Studies using autoimmune encephalomyelitis or myocarditis mouse models confirmed that GM-CSF produced by the Th17 subset is crucial for disease pathology by establishing a positive feedback loop via myeloid IL-23 and IL-6 that supports maintenance as well as de novo development of autoimmune Th17 cells (72–75). Therefore, it is not surprising that mice lacking Csf2, Il23a, Il6 and Il17 were shown to be protected from CIA (76–79), and blocking these genes or their receptors with mAbs is highly efficacious in RA patients enrolled in clinical trials (68, 80–82), in addition to the already approved IL6R mAb tocilizumab (82).
Based on our in vitro data, we propose that the balance between M-CSF- and GM-CSF-dependent Mϕ populations in tissues dictates whether the inflammation resolves through the action of adenosine or not. Indeed, in both humans and mice we observed that M-CSF-dependent FRβ+CD39+CD73+ Mϕs were present in arthritic joints at a low frequency and apparently were not sufficient to counteract the proinflammatory activity of the FRβ−/lo GM-CSF-dependent Mϕs. Similarly, also the MTX treatment of our CIA mice was not able to completely suppress inflammation. It is conceivable that MTX is taken up by GM-CSF-dependent Mϕs via the highly expressed reduced folate carrier/Slc19a1 (83, 84), and then promotes as a consequence inflammation through upregulation of IL6 and IL23A. Therefore, only folate-directed delivery of MTX through the HSA-MTX-FA conjugate into adenosine-producing FRβ+CD39+CD73+ Mϕs was able to control the inflammation in the CIA model. These data are further supported by our recent results showing that mice treated with folate-functionalized liposomes with MTX shielded in the liposome cavity were completely protected from CIA (29).
In conclusion, we have demonstrated that extracellular purine metabolism governs the switch from the proinflammatory to the suppressive Mϕ phenotype. This newly discovered mechanism provides a rationale for specific targeting of the purine metabolism by modulating drugs, such as MTX, in order to fully resolve Mϕ-driven diseases including inflammation of RA.
Ethics Statement
The study using human material was performed in accordance with the Declaration of Helsinki, informed consent was obtained from all participants and research was approved by the Ethics Committee of the Medical University of Vienna (2177/2013, 559/2005). The experiments using mouse models were approved by the French Ministry of Research and the Paris Descartes University Ethical Committee (CEEA No. 34); agreement No. CEEA34.GB.029.11. All methods and experiments were performed in accordance with the relevant guidelines and regulations.
Author Contributions
AO-R and HS designed, performed or supervised research, and wrote the manuscript, CM, RP, VL, GZ, and JH performed or supervised research and provided feedback, GM measured adenosine, CC, DR, FL, VF, GR, and GB designed and performed mouse experiments, including HSA-MTX-FA conjugation, and provided feedback, TB analyzed microarray data, SB, TM, MB, MS, MF, and AC-P provided materials and feedback. All authors approved the manuscript.
Conflict of Interest Statement
MB and MS are employed by EXBIO Praha. All other authors declare that the research was conducted in the absence of any commercial or financial relationships that could be construed as a potential conflict of interest.
Acknowledgments
The acknowledge Dr. M. Bilban, Department of Laboratory Medicine and Core Facility Genomics, Core Facilities, Medical University of Vienna for performing the microarray analysis and E. Steinhuber, V. Mühlgrabner, and P. Waidhofer-Söllner for technical assistance. The authors thank A. Antzberger for the help with coupling chemistry. The authors thank V. Horejsi (Institute of Molecular Genetics, Academy of Sciences of the Czech Republic, Prague, Czech Republic) for providing mAbs for CD4+ T cell isolation and W. Ellmeier (Institute of Immunology, Medical University of Vienna), M. Repic (MC Toxicology Consulting, Vienna, Austria), and G. Guebitz and A. Rollett (Institute of Environmental Biotechnology, University of Natural Resources and Life Sciences, Tulln an der Donau, Austria) for constructive discussions.
Funding
The research leading to these results has received funding from the European Union’s Horizon 2020 Research and Innovation Program under grant agreement No 683356 - FOLSMART and from the Seventh Framework Program (FP7/2007-2013) under grant agreement NMP4-LA-2009-228827 NANOFOL. RP was supported by the Boehringer Ingelheim Fonds and the Ph.D. program Cell Communication in Health and Disease supported by the Austrian Science Fund (FWF). VL was supported by the FWF (P22908), VEGA (2/0063/14), and APVV (16-0452). JH received support from the Vienna Science and Technology Fund (WWTF) LS14-031.
Supplementary Material
The Supplementary Material for this article can be found online at https://www.frontiersin.org/articles/10.3389/fimmu.2018.00852/full#supplementary-material.
Movie S1. Related to Figure 5C. Live cell imaging of the human CD4+ T cell interaction with an autologous CD39+CD73− M-CSF-differentiated and LPS + IFNγ-activated macrophage (Mϕ), which showed enriched expression of CD39 in the immunological synapse over time. Time-lapse microscopy of Mϕ-expressed CD39 (shown in green), its recruitment to the synapse and T cell calcium flux monitored by Fluo-4 fluorescence (in pseudocolor; range is depicted in Figure 5C) over time. Images were acquired every minute for 45 min.
Movie S2. Related to Figure 5D. Live cell imaging of the human CD4+ T cell interaction with an autologous CD39+CD73− M-CSF-differentiated and LPS + IFNγ-activated macrophage (Mϕ), which did not show enriched expression of CD39 in the immunological synapse over time. Images were acquired every minute for 43 min. CD39 staining on the M-CSF-differentiated and LPS + IFNγ-activated Mϕ is shown in green, while fluorescent calcium sensor Fluo-4 in T cells is shown in pseudocolor.
References
1. Hamilton JA, Achuthan A. Colony stimulating factors and myeloid cell biology in health and disease. Trends Immunol (2013) 34(2):81–9. doi:10.1016/j.it.2012.08.006
2. Amit I, Winter DR, Jung S. The role of the local environment and epigenetics in shaping macrophage identity and their effect on tissue homeostasis. Nat Immunol (2016) 17(1):18–25. doi:10.1038/ni.3325
3. Biswas SK, Mantovani A. Macrophage plasticity and interaction with lymphocyte subsets: cancer as a paradigm. Nat Immunol (2010) 11(10):889–96. doi:10.1038/ni.1937
4. Murray PJ, Wynn TA. Protective and pathogenic functions of macrophage subsets. Nat Rev Immunol (2011) 11(11):723–37. doi:10.1038/nri3073
5. Mantovani A, Sica A, Sozzani S, Allavena P, Vecchi A, Locati M. The chemokine system in diverse forms of macrophage activation and polarization. Trends Immunol (2004) 25(12):677–86. doi:10.1016/j.it.2004.09.015
6. Nathan C, Ding A. Nonresolving inflammation. Cell (2010) 140(6):871–82. doi:10.1016/j.cell.2010.02.029
7. Kelly B, O’Neill LA. Metabolic reprogramming in macrophages and dendritic cells in innate immunity. Cell Res (2015) 25(7):771–84. doi:10.1038/cr.2015.68
8. O’Neill LA, Pearce EJ. Immunometabolism governs dendritic cell and macrophage function. J Exp Med (2016) 213(1):15–23. doi:10.1084/jem.20151570
9. Langston PK, Shibata M, Horng T. Metabolism supports macrophage activation. Front Immunol (2017) 8:61. doi:10.3389/fimmu.2017.00061
10. Bronte V, Zanovello P. Regulation of immune responses by L-arginine metabolism. Nat Rev Immunol (2005) 5(8):641–54. doi:10.1038/nri1668
11. McInnes IB, Schett G. The pathogenesis of rheumatoid arthritis. N Engl J Med (2011) 365(23):2205–19. doi:10.1056/NEJMra1004965
12. Hamilton JA, Tak PP. The dynamics of macrophage lineage populations in inflammatory and autoimmune diseases. Arthritis Rheum (2009) 60(5):1210–21. doi:10.1002/art.24505
13. Baeten D, Moller HJ, Delanghe J, Veys EM, Moestrup SK, De Keyser F. Association of CD163+ macrophages and local production of soluble CD163 with decreased lymphocyte activation in spondylarthropathy synovitis. Arthritis Rheum (2004) 50(5):1611–23. doi:10.1002/art.20174
14. Ambarus CA, Noordenbos T, de Hair MJ, Tak PP, Baeten DL. Intimal lining layer macrophages but not synovial sublining macrophages display an IL-10 polarized-like phenotype in chronic synovitis. Arthritis Res Ther (2012) 14(2):R74. doi:10.1186/ar3796
15. Tsuneyoshi Y, Tanaka M, Nagai T, Sunahara N, Matsuda T, Sonoda T, et al. Functional folate receptor beta-expressing macrophages in osteoarthritis synovium and their M1/M2 expression profiles. Scand J Rheumatol (2012) 41(2):132–40. doi:10.3109/03009742.2011.605391
16. Soler Palacios B, Estrada-Capetillo L, Izquierdo E, Criado G, Nieto C, Municio C, et al. Macrophages from the synovium of active rheumatoid arthritis exhibit an activin A-dependent pro-inflammatory profile. J Pathol (2015) 235(3):515–26. doi:10.1002/path.4466
17. Machacek C, Supper V, Leksa V, Mitulovic G, Spittler A, Drbal K, et al. Folate receptor beta regulates integrin CD11b/CD18 adhesion of a macrophage subset to collagen. J Immunol (2016) 197(6):2229–38. doi:10.4049/jimmunol.1501878
18. Nagayoshi R, Nagai T, Matsushita K, Sato K, Sunahara N, Matsuda T, et al. Effectiveness of anti-folate receptor beta antibody conjugated with truncated Pseudomonas exotoxin in the targeting of rheumatoid arthritis synovial macrophages. Arthritis Rheum (2005) 52(9):2666–75. doi:10.1002/art.21228
19. Nagai T, Tanaka M, Tsuneyoshi Y, Xu B, Michie SA, Hasui K, et al. Targeting tumor-associated macrophages in an experimental glioma model with a recombinant immunotoxin to folate receptor beta. Cancer Immunol Immunother (2009) 58(10):1577–86. doi:10.1007/s00262-009-0667-x
20. Ohradanova-Repic A, Machacek C, Fischer MB, Stockinger H. Differentiation of human monocytes and derived subsets of macrophages and dendritic cells by the HLDA10 monoclonal antibody panel. Clin Transl Immunology (2016) 5(1):e55. doi:10.1038/cti.2015.39
21. Eckerstorfer P, Novy M, Burgstaller-Muehlbacher S, Paster W, Schiller HB, Mayer H, et al. Proximal human FOXP3 promoter transactivated by NF-kappaB and negatively controlled by feedback loop and SP3. Mol Immunol (2010) 47(11–12):2094–102. doi:10.1016/j.molimm.2010.04.002
22. Roederer M. Interpretation of cellular proliferation data: avoid the panglossian. Cytometry A (2011) 79(2):95–101. doi:10.1002/cyto.a.21010
23. Pfisterer K, Forster F, Paster W, Supper V, Ohradanova-Repic A, Eckerstorfer P, et al. The late endosomal transporter CD222 directs the spatial distribution and activity of Lck. J Immunol (2014) 193(6):2718–32. doi:10.4049/jimmunol.1303349
24. Gautier L, Cope L, Bolstad BM, Irizarry RA. Affy – analysis of Affymetrix GeneChip data at the probe level. Bioinformatics (2004) 20(3):307–15. doi:10.1093/bioinformatics/btg405
25. Smyth GK. Limma: linear models for microarray data. In: Gentleman R, Carey V, Dudoit S, Irizarry R, Huber W, editors. Bioinformatics and Computational Biology Solutions using R and Bioconductor. New York: Springer (2005). p. 397–420.
26. Saeed AI, Sharov V, White J, Li J, Liang W, Bhagabati N, et al. TM4: a free, open-source system for microarray data management and analysis. Biotechniques (2003) 34(2):374–8.
27. Leksa V, Godar S, Schiller HB, Fuertbauer E, Muhammad A, Slezakova K, et al. TGF-beta-induced apoptosis in endothelial cells mediated by M6P/IGFII-R and mini-plasminogen. J Cell Sci (2005) 118(Pt 19):4577–86. doi:10.1242/jcs.02587
28. Schindelin J, Arganda-Carreras I, Frise E, Kaynig V, Longair M, Pietzsch T, et al. Fiji: an open-source platform for biological-image analysis. Nat Methods (2012) 9(7):676–82. doi:10.1038/nmeth.2019
29. Nogueira E, Lager F, Le Roux D, Nogueira P, Freitas J, Charvet C, et al. Enhancing methotrexate tolerance with folate tagged liposomes in arthritic mice. J Biomed Nanotechnol (2015) 11(12):2243–52. doi:10.1166/jbn.2015.2170
30. Kasinrerk W, Fiebiger E, Stefanova I, Baumruker T, Knapp W, Stockinger H. Human leukocyte activation antigen M6, a member of the Ig superfamily, is the species homologue of rat OX-47, mouse basigin, and chicken HT7 molecule. J Immunol (1992) 149(3):847–54.
31. Dimitrov V, Bouttier M, Boukhaled G, Salehi-Tabar R, Avramescu R, Memari B, et al. Hormonal vitamin D upregulates tissue-specific PD-L1 and PD-L2 surface glycoprotein expression in human but not mouse. J Biol Chem (2017) 292(50):20657–68. doi:10.1074/jbc.M117.793885
32. Gavin MA, Torgerson TR, Houston E, DeRoos P, Ho WY, Stray-Pedersen A, et al. Single-cell analysis of normal and FOXP3-mutant human T cells: FOXP3 expression without regulatory T cell development. Proc Natl Acad Sci U S A (2006) 103(17):6659–64. doi:10.1073/pnas.0509484103
33. Chen L, Flies DB. Molecular mechanisms of T cell co-stimulation and co-inhibition. Nat Rev Immunol (2013) 13(4):227–42. doi:10.1038/nri3405
34. Sakaguchi S, Miyara M, Costantino CM, Hafler DA. FOXP3(+) regulatory T cells in the human immune system. Nat Rev Immunol (2010) 10(7):490–500. doi:10.1038/nri2785
35. Junger WG. Immune cell regulation by autocrine purinergic signalling. Nat Rev Immunol (2011) 11(3):201–12. doi:10.1038/nri2938
36. Deaglio S, Dwyer KM, Gao W, Friedman D, Usheva A, Erat A, et al. Adenosine generation catalyzed by CD39 and CD73 expressed on regulatory T cells mediates immune suppression. J Exp Med (2007) 204(6):1257–65. doi:10.1084/jem.20062512
37. Cekic C, Linden J. Purinergic regulation of the immune system. Nat Rev Immunol (2016) 16(3):177–92. doi:10.1038/nri.2016.4
38. Regateiro FS, Howie D, Nolan KF, Agorogiannis EI, Greaves DR, Cobbold SP, et al. Generation of anti-inflammatory adenosine by leukocytes is regulated by TGF-beta. Eur J Immunol (2011) 41(10):2955–65. doi:10.1002/eji.201141512
39. Savic V, Stefanovic V, Ardaillou N, Ardaillou R. Induction of ecto-5’-nucleotidase of rat cultured mesangial cells by interleukin-1-beta and tumor necrosis factor-alpha. Immunology (1990) 70(3):321–6.
40. Cohen HB, Briggs KT, Marino JP, Ravid K, Robson SC, Mosser DM. TLR stimulation initiates a CD39-based autoregulatory mechanism that limits macrophage inflammatory responses. Blood (2013) 122(11):1935–45. doi:10.1182/blood-2013-04-496216
41. Woehrle T, Yip L, Elkhal A, Sumi Y, Chen Y, Yao Y, et al. Pannexin-1 hemichannel-mediated ATP release together with P2X1 and P2X4 receptors regulate T-cell activation at the immune synapse. Blood (2010) 116(18):3475–84. doi:10.1182/blood-2010-04-277707
42. Alam MS, Kurtz CC, Wilson JM, Burnette BR, Wiznerowicz EB, Ross WG, et al. A2A adenosine receptor (AR) activation inhibits pro-inflammatory cytokine production by human CD4+ helper T cells and regulates Helicobacter-induced gastritis and bacterial persistence. Mucosal Immunol (2009) 2(3):232–42. doi:10.1038/mi.2009.4
43. Mirabet M, Herrera C, Cordero OJ, Mallol J, Lluis C, Franco R. Expression of A2B adenosine receptors in human lymphocytes: their role in T cell activation. J Cell Sci (1999) 112(Pt 4):491–502.
44. Hasko G, Cronstein B. Regulation of inflammation by adenosine. Front Immunol (2013) 4:85. doi:10.3389/fimmu.2013.00085
45. Hume DA, MacDonald KP. Therapeutic applications of macrophage colony-stimulating factor-1 (CSF-1) and antagonists of CSF-1 receptor (CSF-1R) signaling. Blood (2012) 119(8):1810–20. doi:10.1182/blood-2011-09-379214
46. Tian H, Cronstein BN. Understanding the mechanisms of action of methotrexate: implications for the treatment of rheumatoid arthritis. Bull NYU Hosp Jt Dis (2007) 65(3):168–73.
47. Montesinos MC, Takedachi M, Thompson LF, Wilder TF, Fernandez P, Cronstein BN. The antiinflammatory mechanism of methotrexate depends on extracellular conversion of adenine nucleotides to adenosine by ecto-5’-nucleotidase: findings in a study of ecto-5’-nucleotidase gene-deficient mice. Arthritis Rheum (2007) 56(5):1440–5. doi:10.1002/art.22643
48. Peres RS, Liew FY, Talbot J, Carregaro V, Oliveira RD, Almeida SL, et al. Low expression of CD39 on regulatory T cells as a biomarker for resistance to methotrexate therapy in rheumatoid arthritis. Proc Natl Acad Sci U S A (2015) 112(8):2509–14. doi:10.1073/pnas.1424792112
49. van der Heijden JW, Oerlemans R, Dijkmans BA, Qi H, van der Laken CJ, Lems WF, et al. Folate receptor beta as a potential delivery route for novel folate antagonists to macrophages in the synovial tissue of rheumatoid arthritis patients. Arthritis Rheum (2009) 60(1):12–21. doi:10.1002/art.24219
50. Wunder A, Muller-Ladner U, Stelzer EH, Funk J, Neumann E, Stehle G, et al. Albumin-based drug delivery as novel therapeutic approach for rheumatoid arthritis. J Immunol (2003) 170(9):4793–801. doi:10.4049/jimmunol.170.9.4793
51. Wehrens EJ, Prakken BJ, van Wijk F. T cells out of control – impaired immune regulation in the inflamed joint. Nat Rev Rheumatol (2013) 9(1):34–42. doi:10.1038/nrrheum.2012.149
52. Verreck FA, de Boer T, Langenberg DM, Hoeve MA, Kramer M, Vaisberg E, et al. Human IL-23-producing type 1 macrophages promote but IL-10-producing type 2 macrophages subvert immunity to (myco)bacteria. Proc Natl Acad Sci U S A (2004) 101(13):4560–5. doi:10.1073/pnas.0400983101
53. Sierra-Filardi E, Puig-Kroger A, Blanco FJ, Nieto C, Bragado R, Palomero MI, et al. Activin A skews macrophage polarization by promoting a proinflammatory phenotype and inhibiting the acquisition of anti-inflammatory macrophage markers. Blood (2010) 117(19):5092–101. doi:10.1182/blood-2010-09-306993
54. Jaguin M, Houlbert N, Fardel O, Lecureur V. Polarization profiles of human M-CSF-generated macrophages and comparison of M1-markers in classically activated macrophages from GM-CSF and M-CSF origin. Cell Immunol (2013) 281(1):51–61. doi:10.1016/j.cellimm.2013.01.010
55. Mia S, Warnecke A, Zhang XM, Malmstrom V, Harris RA. An optimized protocol for human M2 macrophages using M-CSF and IL-4/IL-10/TGF-beta yields a dominant immunosuppressive phenotype. Scand J Immunol (2014) 79(5):305–14. doi:10.1111/sji.12162
56. Schebesch C, Kodelja V, Muller C, Hakij N, Bisson S, Orfanos CE, et al. Alternatively activated macrophages actively inhibit proliferation of peripheral blood lymphocytes and CD4+ T cells in vitro. Immunology (1997) 92(4):478–86. doi:10.1046/j.1365-2567.1997.00371.x
57. Cao Q, Wang Y, Zheng D, Sun Y, Wang Y, Lee VW, et al. IL-10/TGF-beta-modified macrophages induce regulatory T cells and protect against adriamycin nephrosis. J Am Soc Nephrol (2010) 21(6):933–42. doi:10.1681/ASN.2009060592
58. Piccini A, Carta S, Tassi S, Lasiglie D, Fossati G, Rubartelli A. ATP is released by monocytes stimulated with pathogen-sensing receptor ligands and induces IL-1 beta and IL-18 secretion in an autocrine way. Proc Natl Acad Sci U S A (2008) 105(23):8067–72. doi:10.1073/pnas.0709684105
59. Hasko G, Kuhel DG, Chen JF, Schwarzschild MA, Deitch EA, Mabley JG, et al. Adenosine inhibits IL-12 and TNF-[alpha] production via adenosine A2a receptor-dependent and independent mechanisms. FASEB J (2000) 14(13):2065–74. doi:10.1096/fj.99-0508com
60. Csoka B, Nemeth ZH, Selmeczy Z, Koscso B, Pacher P, Vizi ES, et al. Role of A(2A) adenosine receptors in regulation of opsonized E. coli-induced macrophage function. Purinergic Signal (2007) 3(4):447–52. doi:10.1007/s11302-007-9075-x
61. Link AA, Kino T, Worth JA, McGuire JL, Crane ML, Chrousos GP, et al. Ligand-activation of the adenosine A2a receptors inhibits IL-12 production by human monocytes. J Immunol (2000) 164(1):436–42. doi:10.4049/jimmunol.164.1.436
62. Leibovich SJ, Chen JF, Pinhal-Enfield G, Belem PC, Elson G, Rosania A, et al. Synergistic up-regulation of vascular endothelial growth factor expression in murine macrophages by adenosine A(2A) receptor agonists and endotoxin. Am J Pathol (2002) 160(6):2231–44. doi:10.1016/S0002-9440(10)61170-4
63. Ouyang XS, Ghani A, Malik A, Wilder T, Colegio OR, Flavell RA, et al. Adenosine is required for sustained inflammasome activation via the A(2A) receptor and the HIF-1 alpha pathway. Nat Commun (2013) 4:2909. doi:10.1038/ncomms3909
64. Ryzhov S, Zaynagetdinov R, Goldstein AE, Novitskiy SV, Blackburn MR, Biaggioni I, et al. Effect of A2B adenosine receptor gene ablation on adenosine-dependent regulation of proinflammatory cytokines. J Pharmacol Exp Ther (2008) 324(2):694–700. doi:10.1124/jpet.107.131540
65. Nemeth ZH, Lutz CS, Csoka B, Deitch EA, Leibovich SJ, Gause WC, et al. Adenosine augments IL-10 production by macrophages through an A2B receptor-mediated posttranscriptional mechanism. J Immunol (2005) 175(12):8260–70. doi:10.4049/jimmunol.175.12.8260
66. Schuler PJ, Macatangay BJ, Saze Z, Jackson EK, Riddler SA, Buchanan WG, et al. CD4(+)CD73(+) T cells are associated with lower T-cell activation and C reactive protein levels and are depleted in HIV-1 infection regardless of viral suppression. AIDS (2013) 27(10):1545–55. doi:10.1097/QAD.0b013e328360c7f3
67. Moncrieffe H, Nistala K, Kamhieh Y, Evans J, Eddaoudi A, Eaton S, et al. High expression of the ectonucleotidase CD39 on T cells from the inflamed site identifies two distinct populations, one regulatory and one memory T cell population. J Immunol (2010) 185(1):134–43. doi:10.4049/jimmunol.0803474
68. Patel DD, Kuchroo VK. Th17 cell pathway in human immunity: lessons from genetics and therapeutic interventions. Immunity (2015) 43(6):1040–51. doi:10.1016/j.immuni.2015.12.003
69. Ghoreschi K, Laurence A, Yang XP, Tato CM, McGeachy MJ, Konkel JE, et al. Generation of pathogenic T(H)17 cells in the absence of TGF-beta signalling. Nature (2010) 467(7318):967–71. doi:10.1038/nature09447
70. Reynolds G, Gibbon JR, Pratt AG, Wood MJ, Coady D, Raftery G, et al. Synovial CD4+ T-cell-derived GM-CSF supports the differentiation of an inflammatory dendritic cell population in rheumatoid arthritis. Ann Rheum Dis (2016) 75(5):899–907. doi:10.1136/annrheumdis-2014-206578
71. Noster R, Riedel R, Mashreghi MF, Radbruch H, Harms L, Haftmann C, et al. IL-17 and GM-CSF expression are antagonistically regulated by human T helper cells. Sci Transl Med (2014) 6(241):241ra80. doi:10.1126/scitranslmed.3008706
72. Codarri L, Gyulveszi G, Tosevski V, Hesske L, Fontana A, Magnenat L, et al. RORgammat drives production of the cytokine GM-CSF in helper T cells, which is essential for the effector phase of autoimmune neuroinflammation. Nat Immunol (2011) 12(6):560–7. doi:10.1038/ni.2027
73. El-Behi M, Ciric B, Dai H, Yan Y, Cullimore M, Safavi F, et al. The encephalitogenicity of T(H)17 cells is dependent on IL-1- and IL-23-induced production of the cytokine GM-CSF. Nat Immunol (2011) 12(6):568–75. doi:10.1038/ni.2031
74. Sonderegger I, Iezzi G, Maier R, Schmitz N, Kurrer M, Kopf M. GM-CSF mediates autoimmunity by enhancing IL-6-dependent Th17 cell development and survival. J Exp Med (2008) 205(10):2281–94. doi:10.1084/jem.20071119
75. Ifergan I, Davidson TS, Kebir H, Xu D, Palacios-Macapagal D, Cann J, et al. Targeting the GM-CSF receptor for the treatment of CNS autoimmunity. J Autoimmun (2017) 84:1–11. doi:10.1016/j.jaut.2017.06.005
76. Campbell IK, Rich MJ, Bischof RJ, Dunn AR, Grail D, Hamilton JA. Protection from collagen-induced arthritis in granulocyte-macrophage colony-stimulating factor-deficient mice. J Immunol (1998) 161(7):3639–44.
77. Murphy CA, Langrish CL, Chen Y, Blumenschein W, McClanahan T, Kastelein RA, et al. Divergent pro- and antiinflammatory roles for IL-23 and IL-12 in joint autoimmune inflammation. J Exp Med (2003) 198(12):1951–7. doi:10.1084/jem.20030896
78. Alonzi T, Fattori E, Lazzaro D, Costa P, Probert L, Kollias G, et al. Interleukin 6 is required for the development of collagen-induced arthritis. J Exp Med (1998) 187(4):461–8. doi:10.1084/jem.187.4.461
79. Nakae S, Nambu A, Sudo K, Iwakura Y. Suppression of immune induction of collagen-induced arthritis in IL-17-deficient mice. J Immunol (2003) 171(11):6173–7. doi:10.4049/jimmunol.171.11.6173
80. Burmester GR, Weinblatt ME, McInnes IB, Porter D, Barbarash O, Vatutin M, et al. Efficacy and safety of mavrilimumab in subjects with rheumatoid arthritis. Ann Rheum Dis (2013) 72(9):1445–52. doi:10.1136/annrheumdis-2012-202450
81. Behrens F, Tak PP, Ostergaard M, Stoilov R, Wiland P, Huizinga TW, et al. MOR103, a human monoclonal antibody to granulocyte-macrophage colony-stimulating factor, in the treatment of patients with moderate rheumatoid arthritis: results of a phase Ib/IIa randomised, double-blind, placebo-controlled, dose-escalation trial. Ann Rheum Dis (2015) 74(6):1058–64. doi:10.1136/annrheumdis-2013-204816
82. Jones SA, Scheller J, Rose-John S. Therapeutic strategies for the clinical blockade of IL-6/gp130 signaling. J Clin Invest (2011) 121(9):3375–83. doi:10.1172/JCI57158
83. Samaniego R, Palacios BS, Domiguez-Soto A, Vidal C, Salas A, Matsuyama T, et al. Macrophage uptake and accumulation of folates are polarization-dependent in vitro and in vivo and are regulated by activin A. J Leukoc Biol (2014) 95(5):797–808. doi:10.1189/jlb.0613345
Keywords: macrophage polarization, chronic inflammation, macrophage-T cell interaction, purine metabolism, adenosine, methotrexate, rheumatoid arthritis
Citation: Ohradanova-Repic A, Machacek C, Charvet C, Lager F, Le Roux D, Platzer R, Leksa V, Mitulovic G, Burkard TR, Zlabinger GJ, Fischer MB, Feuillet V, Renault G, Blüml S, Benko M, Suchanek M, Huppa JB, Matsuyama T, Cavaco-Paulo A, Bismuth G and Stockinger H (2018) Extracellular Purine Metabolism Is the Switchboard of Immunosuppressive Macrophages and a Novel Target to Treat Diseases With Macrophage Imbalances. Front. Immunol. 9:852. doi: 10.3389/fimmu.2018.00852
Received: 03 February 2018; Accepted: 06 April 2018;
Published: 27 April 2018
Edited by:
Martin Herrmann, Universitätsklinikum Erlangen, GermanyReviewed by:
Robert Adam Harris, Karolinska Institute (KI), SwedenAmiram Ariel, University of Haifa, Israel
Birgit Strobl, Veterinärmedizinische Universität Wien, Austria
Copyright: © 2018 Ohradanova-Repic, Machacek, Charvet, Lager, Le Roux, Platzer, Leksa, Mitulovic, Burkard, Zlabinger, Fischer, Feuillet, Renault, Blüml, Benko, Suchanek, Huppa, Matsuyama, Cavaco-Paulo, Bismuth and Stockinger. This is an open-access article distributed under the terms of the Creative Commons Attribution License (CC BY). The use, distribution or reproduction in other forums is permitted, provided the original author(s) and the copyright owner are credited and that the original publication in this journal is cited, in accordance with accepted academic practice. No use, distribution or reproduction is permitted which does not comply with these terms.
*Correspondence: Anna Ohradanova-Repic, anna.repic@meduniwien.ac.at;
Hannes Stockinger, hannes.stockinger@meduniwien.ac.at
†Present address: Celine Charvet, IGBMC – CNRS UMR 7104 – INSERM U964, Illkirch, France;
Delphine Le Roux, Ecole Nationale Vétérinaire d’Alfort, UMR BIPAR, Université Paris-Est, Maisons-Alfort, France