Interactive effect of temperature and CO2 increase in Arctic phytoplankton
 Alexandra Coello-Camba
 Susana Agustí
 Johnna Holding1
  Jesús M. Arrieta
 Carlos M. Duarte
- 1Department of Global Change Research, Instituto Mediterráneo de Estudios Avanzados IMEDEA (CSIC-UIB), Esporles, Spain
- 2The UWA Oceans Institute and School of Plant Biology, The University of Western Australia, Crawley, WA, Australia
An experiment was performed in order to analyze the effects of the increase in water temperature and CO2 partial pressure expected for the end of this century in a present phytoplankton community inhabiting the Arctic Ocean. We analyzed both factors acting independently and together, to test possible interactions between them. The arctic planktonic community was incubated under six different treatments combining three experimental temperatures (1, 6, and 10°C) with two different CO2 levels of 380 or 1000 ppm, at the UNIS installations in Longyearbyen (Svalbard), in summer 2010. Under warmer temperatures, a decrease in chlorophyll a concentration, biovolume and primary production was found, together with a shift in community structure toward a dominance of smaller cells (nano-sized). Effects of increased pCO2 were more modest, and although interactions were weak, our results suggest antagonistic interactive effects amongst increased temperature and CO2 levels, as elevated CO2 compensated partially the decrease in phytoplankton biomass induced by temperature in some groups. Interactions between the two stressors were generally weak, but elevated CO2 was observed to lead to a steeper decline in primary production with warming. Our results also suggest that future increases in water temperature and pCO2 would lead to a decrease in the community chl a concentration and biomass in the Arctic phytoplankton communities examined, leading to communities dominated by smaller nano-phytoplankton groups, with important consequences for the flow of carbon and food web dynamics.
Introduction
The Arctic region is experiencing the steepest warming rate on Earth, warming three times faster than the global mean (ACIA, 2004; Trenberth et al., 2007), and resulting in an abrupt reduction in ice cover, that exceeds the range of natural variability over the past millennia (Walsh, 2008). This rapid warming is expected to continue in the future, with more than 6°C warming expected throughout the twenty-first century under some scenarios (ACIA, 2004).
Climate warming is largely derived from anthropogenic CO2 emissions, which have raised atmospheric CO2 from pre-industrial levels of 280 ppm (Caldeira and Wickett, 2003) to close to 400 ppm at present (Forster et al., 2007), and with expected atmospheric CO2 values between 700 and 1000 ppm by the end of this century (Meehl et al., 2007). The anthropogenic perturbation of CO2 propagates to the ocean through air-sea exchange leading to increased CO2 in the oceans and to an associated decline in pH (e.g., Caldeira and Wickett, 2003), with an overall decrease of 0.1 pH units since the pre-industrial period (Doney et al., 2009). Further emissions of fossil-fuel CO2 into the atmosphere could lead to a reduction of 0.4 pH units in the ocean by the end of this century (Caldeira and Wickett, 2003). The largest pH decrease projected worldwide is expected in the Arctic Ocean (−0.45 pH units), where sea ice retreat would amplify air to sea carbon flux. In fact, the dilution of DIC by freshwater lowers the CO2 partial pressure, that, in combination with an increase in ice-free area, enhances uptake of anthropogenic carbon through gas exchange (Steinacher et al., 2009).
Phytoplankton communities, which represent the basis of the Arctic food web, can be affected by both temperature increase and increased CO2. Hence, predicting the responses to these concurrent changes is required to understand the vulnerability of the Arctic ecosystem to global change. Phytoplankton species growing in polar oceans are adapted to the low temperatures characteristic of these regions, and have been shown to respond to even small increases in temperature (Neori and Holm-Hansen, 1982; Li et al., 1984; Holding et al., 2013; Coello-Camba et al., 2014). Temperature plays a fundamental role in the regulation of metabolic processes (Iriberri et al., 1985; White et al., 1991), causing an increase in algal net growth rates with increasing temperatures (Eppley, 1972; Goldman and Carpenter, 1974; Goldman, 1977; Redalje and Laws, 1983; Montagnes and Franklin, 2001). Phytoplankton responses to warming depend on species characteristics, such as cell size, which also constrain key phytoplankton functions (Malone, 1980).
Increased CO2 stimulates phytoplankton growth rates (Kim et al., 2006) and primary production (Hein and Sand-Jensen, 1997), and affects the pigment content in the cells (Xia and Gao, 2005) and the species composition of the community (Tortell et al., 2002). Whereas the effects of increased CO2 levels on phytoplankton have been examined in several oceanic regimes (i.e., Hein and Sand-Jensen, 1997; Tortell et al., 2008; Beardall et al., 2009), results for polar communities, where low temperatures significantly increase CO2 solubility and lead to equilibrium CO2 concentrations more than two times higher than those of tropical waters (Tortell et al., 2008), are still few and inconclusive (Silyakova et al., 2012; Engel et al., 2013; Tanaka et al., 2013). Moreover, warming and increased CO2 co-occur and, thus, their effects should be studied in concert. No study examining the response of Arctic phytoplankton communities to warming and increased CO2 has been conducted to-date.
Here we examine the response of Arctic phytoplankton to an experimental increase in seawater temperature together with CO2. We did so through a factorial experiment, allowing the elucidation of interactions, synergies or compensatory effects, between these drivers. The response of the phytoplankton community was characterized by their community structure, abundance, growth, primary production, and cell viability.
Materials and Methods
A large volume (about 840 L) of Arctic open water was sampled just outside Isfjorden (78°N 13°E) using a water pump on board the vessel “Viking Explorer” on 23 June 2010 with an in situ temperature of 1.4°C and a salinity of 33.5. The water was distributed in 60 L polypropylene containers previously treated with HCl 0.1 N for at least 48 h and thoroughly rinsed with seawater from the sampling station. Seawater containers were immediately transported to the controlled temperature chambers of UNIS (The University Centre in Svalbard) in Longyearbyen (Svalbard, Norway), where the experiment took place, from 24 June to 8 July 2010.
Experimental Set Up
Six different treatments were tested, combining three experimental temperatures (1°C, 6°C, and 10°C) with two different target pCO2 levels of 380 ppm (“present pCO2”) and 1000 ppm (“increased pCO2”), corresponding to values expected by the end of the century under some scenarios (Meehl et al., 2007). These treatment levels are extrapolated from those forecasted for the global ocean, since the general circulation models required to forecast pCO2 levels in the Arctic do not reach the Arctic Ocean and, therefore, end of century pCO2 levels in the Arctic are uncertain. Whereas pCO2 levels are typically lower at the end of the spring bloom (e.g., Nakaoka et al., 2006; Bates and Mathis, 2009), the target “present pCO2” values chosen are representative of the pCO2 levels found at the end of the Arctic winter dark period, corresponding to those near atmospheric equilibrium, when the spring bloom is initiated (Pfeil et al., 2012).
All plastic and glassware used for the incubations was previously cleaned with HCl and thoroughly rinsed with seawater. Seawater was mixed in 280 L containers, screened through a 100 μm mesh to remove large grazers, and transferred to 20 L Nalgene™ polycarbonate bottles. These bottles were submersed in 280 L tanks connected to temperature control units (PolyScience 9600 series, precision 0.1°C), with impelling and expelling pumps. The temperature stability was monitored along the experiment with data loggers submersed in each tank. The target pCO2 level was achieved by fitting each experimental 20 L bottle with a bubbling system connected to CO2 bottles and air mixture bottles. The gas mixture was provided by mass flow controllers (model GFC17, Aalborg Instruments and Controls, Inc.), setting a flow rate of 0–10 L min−1 for air mixture and 0–10 mL min−1 for CO2 (in the case of the air mixture, an aquarium pump forced the gas to pass through soda lime to remove all CO2 before reaching the mass flow controller). Once the proper flow was set, both gasses were mixed, introduced with plastic tubes in each 20 L bottle and bubbled from the bottom of the bottles.
Three replicate bottles were set per each combination of temperature and pCO2 tested. The experimental bottles were illuminated with two fluorescent light tubes per tank to provide an appropriate, continuous light environment (200 μmol photons PAR m−2 s−1, 24 h) throughout the experiment.
Chlorophyll a (Chl a) Concentration
Daily, 50 mL samples were retrieved from each experimental bottle and filtered into Whatman GF/F filters to measure chlorophyll a concentration. After filtration, the pigment was extracted in 90% acetone for 24 h, and kept refrigerated in the dark. After extraction, the fluorescence was measured on a spectrofluorometer following Parsons et al. (1984).
Cell Counts
The cell concentration was counted every 3 days using an epifluorescence microscope. 100 mL samples from each experimental bottle were filtered through a black 1 μm pore size polycarbonate filter, and fixed with glutaraldehyde (1% final concentration). After filtration, the filters were carefully dried with laboratory paper and placed in a microscope slide with a drop of microscope oil, covered and kept frozen until examination. Cells were counted using a Zeiss Axiovert 25 and a Zeiss Axioplan 2 Imaging epifluorescence microscope. A minimum of 20 fields was counted, classifying observed cells into different genera. Nano- and picophytoplankton cell counts were also conducted using Flow Cytometry. Approximately 2 ml fresh samples from each treatment were fixed with glutaraldehyde (25%) to a final concentration of 1%, and counted using a FACSCalibur Flow Cytometer (Beckton Dickinson). An aliquot of a calibrated solution of 1 μm diameter fluorescent beads (Polysciences Inc.) was added to the samples as an internal standard for the quantification of cell concentration. The fluorescence and scattering signals of the cells and beads were used to detect and quantify this population.
Net Growth Rate Calculation
The net growth rates (μ) of the different populations along the experiment were calculated from the slope of changes of the natural logarithm (Ln) of the cell abundance N (or of the chlorophyll a concentration), over time (t, in days), considering all of the data obtained during the experimental time, by fitting the linear regression equation:
Cell Viability
To evaluate the percentage of living cells in the communities, a LIVE/DEAD® Baclight™ Viability Kit (L7012) was used (Lee and Rhee, 1997; Llabrés and Agustí, 2008). This kit uses a double staining method involving two different fluorochromes (Syto 9 and Propidium Iodide). Syto 9 confers green fluorescence under blue light microscopy to all the cells present in the sample, whether living or dead, while Propidium Iodide only penetrates through cells with damaged cell membranes, yielding an intense red fluorescence on dead or damaged cells, and masking the effects of Syto 9 (Lee and Rhee, 1997; Llabrés and Agustí, 2008). Hence, green-fluorescent cells represent living cells while red-fluorescent cells represent dead or compromised cells.
The LIVE/DEAD® Baclight™ Viability Kit was applied to the cells present in 100 mL samples collected onto a black polycarbonate filter 1 μm pore, by adding 20 μL of a mixture of both stains to the last 5 mL of sample remaining on the filtrating system. The kit was allowed to operate for 15 min in the dark before the filtration was completed. The filters were then carefully dried with laboratory paper and placed on a microscope slide with a drop of special oil on it (Baclight™ mounting oil, component C), and frozen after covering the preparation with a cover slip. Cells were counted using a Zeiss Axiovert 25 epifluoresence microscope fitted with a blue light filter. A minimum of 20 fields were counted, classifying observed living and dead cells into genera.
The percentage of living cells was calculated as the number of living cells (green-fluorescent cells) divided by the total number of cells (green + red-fluorescent cells) counted. The decay rate was estimated as the slope of changes of the natural logarithm of the living cell percentage over time.
Biovolume
We estimated mean cell volumes by measuring cell sizes and approximating to the closest geometric figure. We obtained the total biovolume for each group as the product of cell density and its mean cell volume.
Primary Production
Primary production was measured on days 0, 3, 9, 12, and 14 of the experiment using 14C incorporation. Water was transferred from each treatment bottle into six previously acid-washed 60 mL polycarbonate bottles. Each bottle was immediately inoculated with 110 kBq of 14C-bicarbonate under low light in the temperature controlled cold rooms. The activity added to each bottle was determined by preserving 250 μL of each sample in 1 mL of ethanolamine in a scintillation vial. Three of the six bottles that would serve as blanks, were killed with concentrated buffered formalin to a final concentration of 2%. All six samples were incubated in the same temperature incubator from which the sample was initially taken, and thus exposed to the same temperature and light conditions during 12 h of incubation. After incubation, all samples were filtered under low vacuum pressure (100 mmHg) and filter cups as well as sample bottles were rinsed twice with filtered seawater. The filters of each sample were placed at the bottom of a scintillation vial and sealed with a rubber septum stopper. The stopper was fitted with a small hanging bucket containing a Whatman GF/A filter wetted with phenethylamine (85%; Balch et al., 2000). Using a needle syringe, 1 mL of 2% phosphoric acid was injected past the bucket and onto the filter below. Vials were left on a shaker for 24 h to allow the acid to dissolve any 14C-CaCO3, which would then be absorbed into the phenethylamine soaked filter as 14C-CO2. After 24 h, rubber stoppers were removed and the vials were capped and frozen until later analysis. Radioactivity was measured from each filter in a scintillation counter 8 h after the addition of 5 mL of scintillation cocktail. Radioactivity was calculated from samples to which formalin was not added by subtracting the activity counted in the blank samples averaged across the sampling period. Primary production rates (mg C L−1 d−1) were calculated using the standard formula from Parsons et al. (1984).
Carbonate Parameters
Total hydrogen ion concentrations (i.e., pH) and total alkalinity (TA) were measured daily along the experiment and used to calculate the other carbon dioxide system parameters. Total hydrogen ion concentration of the seawater was measured following the standard operating procedure (SOP6b) from the Dickson and Goyet (1994) spectrophotometric method using the indicator dye m-cresol purple. TA was determined using open-cell titration also following the SOP3b from Dickson and Goyet (1994). Certified reference material from batch 101 provided by Dr. Andrew Dickinson (Scripps Institution of Oceanography, University of California) was used to make appropriate calibrations and corrections during the analysis.
Triplicate pH samples were collected with a silicon tube and directly siphoned into cylindrical glass cuvettes twice rinsed previously with sample water. Care was taken to avoid any air bubbles within the samples and to minimize gas exchange. Cuvettes were submerged in a 25°C temperature bath for at least 30 min prior to measurement in a Shimadzu UV 1700 brand spectrophotometer. During measurements the temperature was kept stable by connecting the temperature bath to a continuous flow water jacket cuvette support inside the spectrophotometer. Duplicate TA samples were collected from each microcosm using a silicon tube and siphoned directly into a plastic 50 mL falcon tubes, which were twice rinsed previously with sample water. TA samples were poisoned with 20 μL of mercury chloride and saved for analysis within 2–3 days of sampling. Mean SD of treatment average pH (±SE) ranged from 0.01 ± 0.01 to 0.05 ± 0.02.
The program CO2SYS (Lewis and Wallace, 1998) was used to calculate daily carbon parameter values. Input parameters were pH and TA measured at standard temperature and pressure. Output parameters were standardized to standard pressure and to the average tank temperatures measured each day.
Data Analysis
The response of the phytoplankton community to experimentally increased temperature and pCO2 was assessed using a general linear model, allowing the removal of the variability over time. In fact, a carry-over effect of the dynamics of the community appeared at the time of sampling before responding to the experimental treatments, as observed in previous experiments with Arctic plankton communities (Silyakova et al., 2012; Holding et al., 2013; Coello-Camba et al., 2014).
The general linear model, fitted using the statistical software JMP, allowed the quantification of the effects, and their significance, of experimentally increased temperature and pCO2 free of the confounding effects of variability over time. This model also allowed the comparison of responses across functional groups when abundance was expressed as the common metric biovolume (Agustí et al., 2009).
The following general linear model was applied:
where R corresponds to the ln-transformed response variable (e.g., biovolume, chl a), a1 is the intercept, a2 and a3 test for the effect of temperature (T) and pCO2, respectively, on the intercept, b1 described the growth rate, μ, of R, b2, and b3 test for the effects of temperature (T) and pCO2, respectively, on μ, and b4 test for interactive effects of temperature (T) and pCO2 on μ.
A Student's t-test was run to determine statistically significant coefficients of the model.
Results
The incubation temperatures set for each treatment remained very stable along the experiment (Table 1). However, pCO2 values experienced important variations during the first week of incubation, particularly in the experiments subject to warming, with a simultaneous time lag observed until the first clear responses, i.e., in chlorophyll a concentration or cell abundances. As a result, the pCO2 values for “present pCO2” and “increased pCO2” treatments conformed closely to the target values at the 1°C treatment, but warming of the water mass to 6°C and 10°C, together with increased microbial activity in these warmer treatments, led to median pCO2 values in those treatments well beyond the target values. These difficulties, largely derived from biological feedbacks of the plankton community, are consistent with those experienced in past experiments regulating CO2 levels in Arctic plankton communities (e.g., Torstensson et al., 2012; Engel et al., 2013), as the metabolism of these communities interfere with the treatment variable (Duarte et al., 1997).
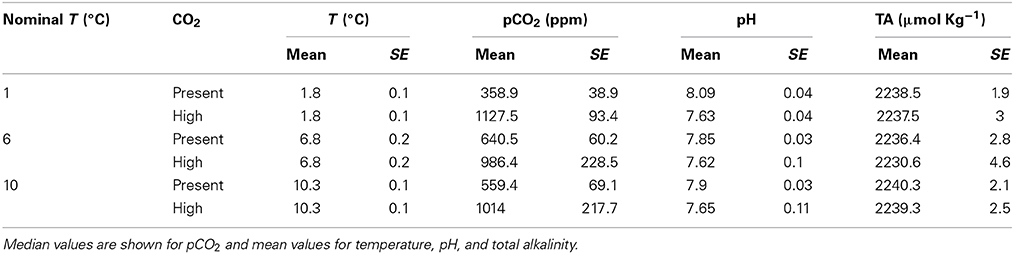
Table 1. Mean or median ± SE of the recorded experimental conditions (temperature, pCO2, pH, and total alkalinity) for the nominal experimental treatments.
The initial average chlorophyll a concentration was 0.64 μg chl a L−1. The Arctic fjord phytoplankton community present was classified at genus level or defined according to cell sizes for those phytoplankton groups that could not be identified. At the beginning of the experiment the Arctic fjord phytoplankton community included centric diatoms (4 and 7 μm average diameter), and photosynthetic flagellates of three size classes (average diameter 5.9, 12.5, and 20 μm). The most abundant groups were flagellates 5.9 μm and centric diatoms 7 μm in diameter, comprising up to 95% of the cells present. Along the incubation two more groups appeared in the cell counts, a group of centric diatoms (11.1 μm in diameter) and the flagellate Pyramimonas sp. (6 μm).
After an initial decrease in all treatments, the chl a concentration increased along the second week of the experiment (Figure 1, Table 2), reaching higher values at the lower (1.82°C) treatments than those at higher temperature (6.31°C and 10.32°C, p < 0.01). These differences were particularly clear at the end of the experiment (Figure 2), when chlorophyll a concentrations were significantly higher (p < 0.05) at the 1.82°C treatment, specially at the low pCO2 treatment, than at the other two temperatures. In fact, this change in chl a concentration at the end of the experiment showed a three-fold increase in the community growing at the lowest temperature, with smaller values under high pCO2 (Figure 2). Growth rates estimated from chlorophyll a concentrations (Figure 3), showed a negative and significant response (p < 0.05) to increased temperature (Table 2). When referred to pCO2 increase, no significant differences were found between treatments, despite the slightly lower values found under high pCO2 conditions (Table 2), and there was no significant interaction between growth rate and temperature and pCO2 (t-test, P > 0.05, Table 2). As observed for chl a concentration, community biovolume declined with increasing temperature (Table 2, Figure 4) and also decreased, although not significantly, with increasing pCO2 (Table 2, Figure 4). A compensatory effect was found, as reflected in a significant positive interaction between warming and increased CO2 on community biovolume (Table 2). The community also showed important changes, with large centric diatoms (11.1 μm in diameter) becoming dominant at low temperature at the end of the experiment, along with large photosynthetic flagellates (20 μm) (Figure 4). The community under the warmest temperature was dominated by the smallest photosynthetic taxa (Figure 4). At the end of incubation the biovolumes of flagellates 20 μm, centric diatoms 11.1 μm, and total community biovolume were lower at higher temperature treatments (p < 0.01) (Figure 4). For centric diatoms 4 μm, biovolume at the end of the experiment was higher at the 6.71°C treatment (p < 0.05) than at 1.82 and 10.32°C (Figure 4).
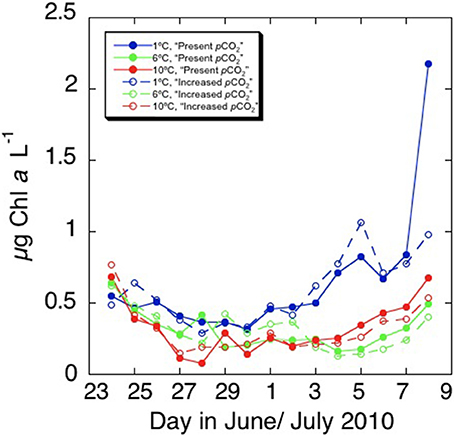
Figure 1. Changes in the chlorophyll a concentration (μg L−1) with time observed in the different treatments of increased temperature and pCO2 in the arctic phytoplankton community.
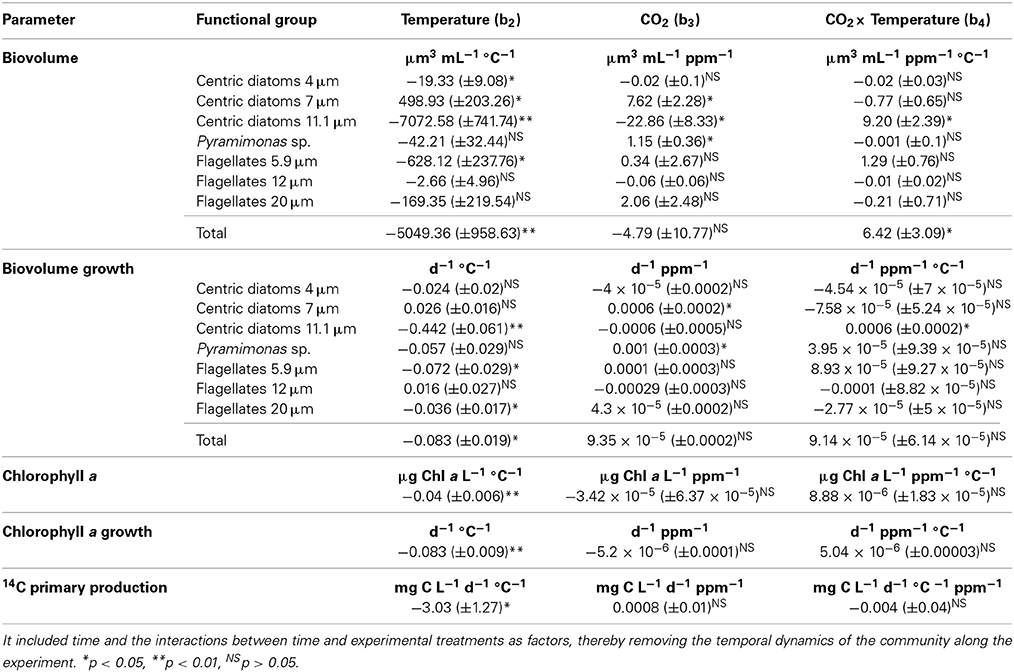
Table 2. The mean ± SE effects of experimentally increased temperature, pCO2 and their interaction on the biovolume of different functional groups in the community, chlorophyll a concentration and primary production, were estimated using the general linear model described in the Materials and Methods Section.
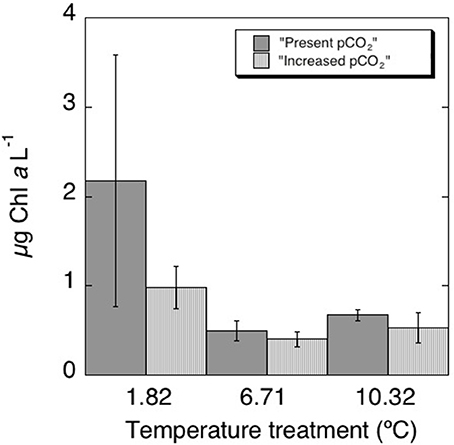
Figure 2. Final values of chlorophyll a concentration in each treatment with their correspondent standard errors.
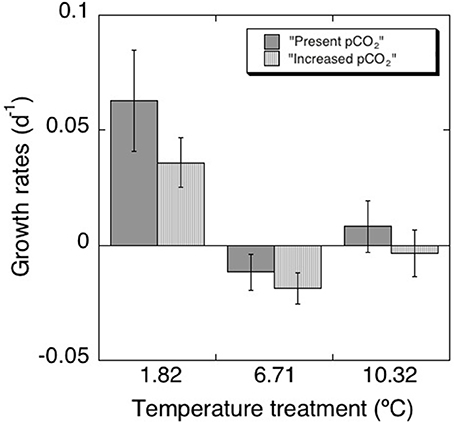
Figure 3. Net growth rates (d−1) calculated for each treatment with their correspondent standard errors.
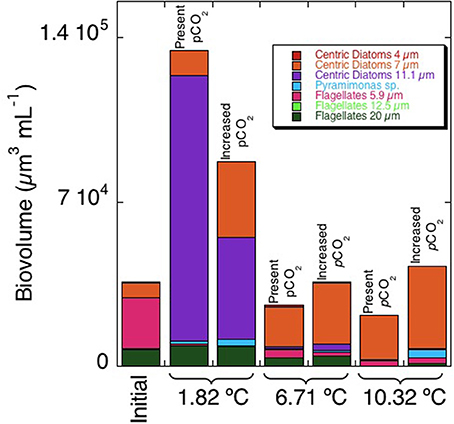
Figure 4. Initial and final values of biovolume (μm3) for each group and treatment.
Primary production increased in all treatments over the course of the experiment from 23.68 ± 9.25 mg C L−1 d−1 on day 3 to 91.80 ± 11.53 mg C L−1 d−1 on day 14 (values averaged across all treatments ±SE). Primary production decreased significantly with increasing temperature (p < 0.05, Table 2) with this decline being steeper under high pCO2 (Figure 5). At 10.31°C primary production rates were higher at low pCO2 than at higher pCO2 (p < 0.05), without significant differences between pCO2 treatments at lower temperatures. At the end of the experiment, when responses to experimental treatments were strongest, primary production declined significantly with increasing temperature (p < 0.01), with this decline being steeper at high pCO2 (p < 0.05).
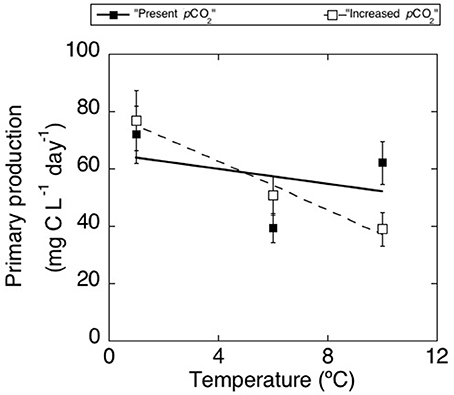
Figure 5. Mean (±SE) rates of primary production (mg C L−1 d−1) averaged across 4 sampling days for treatments of “present pCO2” (black squares) and “increased pCO2” (white squares).
The growth rates estimated from cell biovolume of centric diatoms 11.1 μm in diameter declined strongly with increasing temperature (p < 0.01), while the growth rate of centric diatoms 7 μm in diameter increased with warming. Increased pCO2 caused different responses in phytoplankton, with a significant growth increase of centric diatoms 7 μm and Pyramimonas sp. with increasing pCO2 (p < 0.05), and a decline in growth rate of centric diatoms 11.1 μm with increasing pCO2. A positive and significant interaction between increased pCO2 and temperature was found for the changes experienced in total biovolume (p < 0.05), and more specifically in the biovolume of centric diatoms 11.1 μm (p < 0.05) (Table 2).
The average initial percentage of living cells in the community was estimated at 75.3% for centric diatoms 7 μm and 43.1% for flagellates 5.9 μm, the dominant groups at the beginning of the experiment. The living cell abundance increased with temperature and under higher pCO2 levels for centric diatoms 7 μm (p < 0.05), but the presence of both factors resulted in a slight antagonistic interaction (p < 0.05) (Table 3). We also observed that the abundance of living flagellates 5.9 μm showed a negative but not significant response with increased temperature (Table 3). The effect of increased pCO2 was opposite but also not significant (p > 0.05) (Table 3).
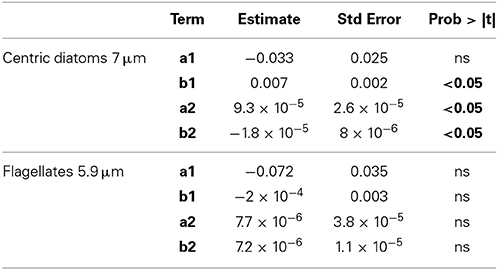
Table 3. Statistical analysis of the effects of increased temperature and pCO2 individually (b1 and a2, respectively) and with interaction (b2), on the decay rates (d−1) of living cells.
Discussion
The results obtained here show that warming should have an overriding effect on Arctic phytoplankton communities relative to that of the increase in pCO2 expected by the year 2100. The decline in chlorophyll a concentration, biovolume and primary production of the Arctic phytoplankton community with the experimental warming tested is consistent with results from previous experiments with Arctic communities (Coello-Camba et al., 2014). Moreover, where increased CO2 had significant effects these involved a steeper decline in primary production with warming than observed at lower pCO2, although phytoplankton biovolume increased with CO2 at warmer temperatures.
The response of phytoplankton to the experimental conditions was slow as observed before in arctic communities (Silyakova et al., 2012; Holding et al., 2013; Coello-Camba et al., 2014). The kind of experiment performed here, using microcosms, cannot be run for a long time, but the results indicated that the stationary phase was not reached. This suggests that phytoplankton biomass may still increase, especially in response to the pCO2 conditions. In any case, what was clearly shown in the results was the shift in phytoplankton communities.
Community structure shifted from a dominance of large species to communities dominated by phytoplankton species with smaller cell sizes at warmer temperatures. This is consistent with the observation that warming is associated with a decline in phytoplankton cell size (Agawin et al., 2000; Hare et al., 2007; Li et al., 2009; Morán et al., 2010). This decrease in cell size with warming is also consistent with the responses reported for previous temperature manipulations of Arctic plankton communities, where an increased growth of small-sized species, as Micromonas sp., was observed with experimental warming (Coello-Camba et al., 2014).
The physiological adaptation of phytoplankton species to cold polar waters may have narrowed their thermal windows (Smetacek and Nicol, 2005), leading to the negative effects of warming observed here. Previous experiments with Arctic communities showed an optimum temperature for cell growth around 5–6°C (Coello-Camba et al., 2014) suggesting that the warmer temperatures tested here may be beyond their thermal optimum. This temperature optimum may differ between species (Jacques, 1983), which are therefore expected to show a wide range of responses to warming, as shown by the diversity of responses of the different functional groups present in the community tested here.
In contrast to the general decline in chl a concentration and growth with warming, responses to increased pCO2 were modest, with relatively small effects on chlorophyll a concentration, total community biovolume and net growth rates, and varied among functional groups. Previous experiments have also documented small effects of increased CO2 on marine phytoplankton growth rate and/or community structure (Hare et al., 2007; Riebesell et al., 2007; Engel et al., 2008). Also, previous studies testing the effect of increased CO2 on primary production have shown contrasting results, ranging from increased primary production (Hein and Sand-Jensen, 1997; Tortell et al., 2002; Engel et al., 2013) to little or no effect of CO2 increase, particularly for studies examining the response of Arctic phytoplankton to increased CO2 (Thingstad et al., 2008; Engel et al., 2013). The studies showing a positive response of phytoplankton to elevated pCO2 explain this response as a consequence of the lower energetic cost of C assimilation (Tortell et al., 2002, 2008). In contrast, however, the responses to increased CO2 observed here were non-intuitive, involving a decline in growth and biomass, in contrast to the positive effects expected. Such non-intuitive responses to increased CO2 have been shown for Arctic phytoplankton in the past, interpreted as the results of enhanced competition for inorganic nutrients between phyto- and bacterioplankton with a consequent decrease in net community production at high pCO2 (Thingstad et al., 2008; Engel et al., 2013). Indeed, the effects of increased pCO2 in the community vary depending on other factors, such as nutrient availability (Tortell, 2000; Raven et al., 2005), and other factors that could affect the operation of carbon concentration mechanisms (Wolf-Gladrow et al., 1999). However, the EPOCA experiment involved nutrient additions and yet, phytoplankton did not show a positive response to increased CO2 there (Engel et al., 2013). Those effects may also be species-specific, so would vary depending on the community composition (Tortell et al., 2002; Riebesell, 2004; Kim et al., 2006; Blackford and Gilbert, 2007; Fu et al., 2007). However, most phytoplankton species have active uptake systems for inorganic carbon that renders photosynthetic carbon assimilation essentially saturated under current CO2 levels, so it is possible that elevated CO2 conditions could not result in an increase on their assimilation rates (Giordano et al., 2005).
As for temperature increase, increased pCO2 has also been observed to cause an increase in the abundance of small sized cells (Brussaard et al., 2013). In our experiment, although no pico-sized cells were observed, Pyramimonas sp. and centric diatoms 7 μm experienced a significant increase in their biovolume under increased pCO2 while large centric diatoms showed a negative response to elevated CO2, supporting a size-dependent response of phytoplankton species to elevated CO2.
Whereas, past experiments have addressed the responses to warming (Holding et al., 2013; Coello-Camba et al., 2014) and to elevated CO2 (Thingstad et al., 2008; Engel et al., 2013), our results provide the first assessment of interactive effects of warming and elevated CO2. However, interactions were generally weak. Elevated CO2 was observed to lead to steeper decline in primary production with warming. In contrast, the interaction between warming and elevated CO2 had a small, but significant compensatory effect on the decline in community biomass (as biovolume) observed with warming and elevated CO2. This compensatory effect offset, and slightly reverted, the effects of elevated CO2 under warm conditions.
Our analysis also provided insight onto the effects of warming and increased CO2 on cell status, assessed as cell viability. Previous papers have shown that the cell viability measured using this kit reflects the actual preferences of the cells on a specific environment, and that these preferences are not affected by other external factors that could be acting upon them (Alonso-Laita and Agustí, 2006; Lasternas and Agustí, 2010; Lasternas et al., 2010). Our results showed contrasting effects of temperature and pCO2 on the presence of living cells in the species studied. This supported the results obtained for the changes in net growth rates, reflecting the specificity of the responses that can be found on a natural community composed of different cell types with diverse ecologic and metabolic characteristics. Both for centric diatoms 7 μm and flagellates 5.9 μm the changes in the percentage of living cells paralleled the changes in cell growth under increased temperature and CO2, indicating that these responses reflect cellular-level responses to these factors, rather than indirect responses (i.e., due to changes in cell competition or predation).
The combined effects of different environmental factors on phytoplankton communities has been studied in the past (i.e., Hare et al., 2007; Echeveste et al., 2011), but despite the future increasing trends in temperature and pCO2 predicted, there have been few explicit tests of the combined effect of both factors on phytoplankton communities. Previous studies from other oceanographic provinces considering both factors reported contrasting responses. Hare et al. (2007) reported that changes in photosynthetic rates in the Bering Sea were mainly driven by elevated temperature with little effect of increased pCO2, while both factors were shown to have additive effects on the responses of the phytoplankton community in the North Atlantic (Feng et al., 2009). Moreover, the responses to warming and CO2 are often species-specific, as observed by Fu et al. (2007), consistent with the contrasting responses between large and small components of the community examined here.
In summary, our results suggest that future increases in water temperature and pCO2 would lead to a decrease in the community chl a concentration and biomass in the present Arctic phytoplankton communities examined, also leading to communities dominated by smaller nano-phytoplankton groups, with important consequences for the flow of carbon and food web dynamics. Whereas the effect of warming is stronger than those of pCO2, increased pCO2 does not offset the effects of warming. Our results point to a less productive Arctic Ocean in the future.
Conflict of Interest Statement
The authors declare that the research was conducted in the absence of any commercial or financial relationships that could be construed as a potential conflict of interest.
Acknowledgments
This study was supported by the project Arctic Tipping Points (ATP, contract # 226248) from the European Union. Alexandra Coello-Camba was supported by a grant BES-2007-15193 from the Spanish Ministry of Science and Innovation. We thank R. Gutiérrez for sampling assistance, J. C. Alonso for nutrient analyses, the crew of Viking Explorer for assistance with sampling, and P. Wassmann, E. Halvorsen, and M. Daase for logistic assistance and the The University Centre in Svalbard, UNIS, for hospitality.
References
Agawin, N. S. R., Duarte, C. M., and Agustí, S. (2000). Nutrient and temperature control of the contribution of picoplankton to phytoplankton biomass and production. Limnol. Oceanogr. 45, 591–600. doi: 10.4319/lo.2000.45.3.0591
Agustí, S., Duarte, C. M., Llabrés, M., Agawin, N., and Kennedy, H. (2009). Response of coastal Antarctic phytoplankton to solar radiation and ammonium manipulation: an in situ mesocosm experiment. J. Geophys. Res. Biogeosci. 114, G01009. doi: 10.1029/2008JG000753
Alonso-Laita, P., and Agustí, S. (2006). Contrasting patterns of phyoplankton viability in the subtropical NE Atlantic Ocean. Aquat. Microb. Ecol. 43, 67–78. doi: 10.3354/ame043067
Balch, W., Drapeau, D., and Fritz, J. (2000). Monsoonal forcing of calcification in the Arabian Sea. Deep Sea Res. II 47, 1301–1337. doi: 10.1016/S0967-0645(99)00145-9
Bates, N. R., and Mathis, J. T. (2009). The Arctic Ocean marine carbon cycle: evaluation of air-sea CO2 exchanges, ocean acidification impacts and potential feedbacks. Biogeoscience 6, 11. doi: 10.5194/bg-6-2433-2009
Beardall, J., Stojkovic, S., and Larsen, S. (2009). Living in a high CO2 world: impacts of global climate change on marine phytoplankton. Plant Ecol. Divers. 2, 191–205. doi: 10.1080/17550870903271363
Blackford, J. C., and Gilbert, F. J. (2007). pH variability and CO2 induced acidification in the North Sea. J. Mar. Syst. 64, 229–241. doi: 10.1016/j.jmarsys.2006.03.016
Brussaard, C. P. D., Noordeloos, A. A. M., Witte, H., Collenteur, M. C. J., Schulz, K., Ludwig, A., et al. (2013). Arctic microbial community dynamics influenced by elevated CO2 levels. Biogeoscience 10, 719–731. doi: 10.5194/bg-10-719-2013
Caldeira, K., and Wickett, M. E. (2003). Anthropogenic carbon and ocean pH. Nature 425:365. doi: 10.1038/425365a
Pubmed Abstract | Pubmed Full Text | CrossRef Full Text | Google Scholar
Coello-Camba, A., Agustí, S., Vaqué, D., Holding, J., Arrieta, J. M., Wassmann, P., et al. (2014). Experimental assessment of temperature thresholds for arctic phytoplankton communities. Estuar. Coast. doi: 10.1007/s12237-014-9849-7. [Epub ahead of print].
Dickson, A. G., and Goyet, C. (1994). Handbook of Methods for the Analysis of the Various Parameters of the Carbon Dioxide System in Sea Water. Version 2. (Tennessee), DOE, ORNL/CDIAC-74.
Doney, S. C., Fabry, V. J., Feely, R. A., and Kleypas, J. A. (2009). Ocean acidification: the other CO2 problem. Annu. Rev. Mar. Sci. 1, 169–192. doi: 10.1146/annurev.marine.010908.163834
Pubmed Abstract | Pubmed Full Text | CrossRef Full Text | Google Scholar
Duarte, C. M., Gasol, J. M., and Vaqué, D. (1997). Role of experimental approaches in marine microbial ecology. Aquat. Microb. Ecol. 13, 101–111. doi: 10.3354/ame013101
Echeveste, P., Agustí, S., and Dachs, J. (2011). Cell size dependence of additive versus synergetic effects of UV radiation and PAHs on oceanic phytoplankton. Environ. Pollut. 159, 1307–1316. doi: 10.1016/j.envpol.2011.01.023
Pubmed Abstract | Pubmed Full Text | CrossRef Full Text | Google Scholar
Engel, A., Borchard, C., Piontek, J., Schulz, K. G., Riebesell, U., and Bellerby, R. (2013). CO2 increases 14C primary production in an Arctic plankton community. Biogeoscience 10, 1291–1308. doi: 10.5194/bg-10-1291-2013
Engel, A., Schulz, K. G., Riebesell, U., Bellerby, R., Delille, B., and Schartau, M. (2008). Effects of CO2 on particle size distribution and phytoplankton abundance during a mesososm bloom experiment (PeECE II). Biogeoscience 5, 509–521. doi: 10.5194/bg-5-509-2008
Feng, Y., Hare, C. E., Leblanc, K., Rose, J. M., Zhang, Y., DiTullio, G. R., et al. (2009). Effects of increased pCO2 and temperature on the North Atlantic spring bloom. I. The phytoplankton community and biogeochemical response. Mar. Ecol. Progr. Ser. 388, 13–25. doi: 10.3354/meps08133
Forster, P., Ramaswamy, V., Artaxo, P., Berntsen, T., Betts, R., Fahey, D. W., et al. (2007). “Changes in atmospheric constituents and in radiative forcing,” in Climate Change 2007: The Physical Science Basis. Contribution of Working Group I to the Fourth Assessment Report of the Intergovernmental Panel on Climate Change, eds S. Solomon, D. Qin, M. Manning, Z. Chen, M. Marquis, K. B. Averyt, et al. (Cambridge; New York: Cambridge University Press), 129–234.
Fu, F.-X., Warner, M. E., Zhang, Y., Feng, Y., and Hutchins, D. A. (2007). Effects of increased temperature and CO2 on photosynthesis, growth, and elemental ratios in marine Synechococcus and Prochlorococcus (Cyanobacteria). J. Phycol. 43, 485–496. doi: 10.1111/j.1529-8817.2007.00355.x
Giordano, M., Beardall, J., and Raven, J. A. (2005). CO2 concentrating mechanisms in algae: mechanisms, environmental modulation, and evolution. Annu. Rev. Plant Biol. 56, 99–131. doi: 10.1146/annurev.arplant.56.032604.144052
Pubmed Abstract | Pubmed Full Text | CrossRef Full Text | Google Scholar
Goldman, J. C. (1977). Temperature effects on phytoplankton growth in continuous culture. Limnol. Oceanogr. 22, 932–936. doi: 10.4319/lo.1977.22.5.0932
Goldman, J. C., and Carpenter, E. J. (1974). A kinetic approach to the effect of temperature on algal growth. Limnol. Oceanogr. 19, 756–766. doi: 10.4319/lo.1974.19.5.0756
Hare, C. E., Leblanc, K., DiTullio, G. R., Kudela, R. M., Zhang, Y., Lee, P. A., et al. (2007). Consequences of increased temperature and CO2 for phytoplankton community structure in the Bering Sea. Mar. Ecol. Progr. Ser. 352, 9–16. doi: 10.3354/meps07182
Hein, M., and Sand-Jensen, K. (1997). CO2 increases oceanic primary production. Nature 388, 526–527. doi: 10.1038/41457
Holding, J. M., Duarte, C. M., Arrieta, J. M., Vaquer-Sunyer, R., Coello-Camba, A., Wassmann, P., et al. (2013). Experimentally determined temperature thresholds for Arctic phytoplankton community metabolism. Biogeoscience 10, 357–370. doi: 10.5194/bg-10-357-2013
Iriberri, J., Undurraga, A., Muela, A., and Egea, L. (1985). Heterotrophic bacterial activity in coastal waters: functional relationship of temperature and phytoplankton population. Ecol. Model. 28, 113–120. doi: 10.1016/0304-3800(85)90016-X
Jacques, G. (1983). Some ecophysiological aspects of the Antarctic phytoplankton. Polar Biol. 2, 27–33. doi: 10.1007/BF00258282
Kim, J.-M., Lee, K., Shin, K., Kang, J.-H., Lee, H.-W., Kim, M., et al. (2006). The effect of seawater CO2 concentration on growth of a natural phytoplankton assemblage in a controlled mesocosm experiment. Limnol. Oceanogr. 51, 1629–1636. doi: 10.4319/lo.2006.51.4.1629
Lasternas, S., and Agustí, S. (2010). Phytoplankton community structure during the record Arctic ice-melting of summer 2007. Polar Biol. 33, 1709–1717. doi: 10.1007/s00300-010-0877-x
Lasternas, S., Agustí, S., and Duarte, C. M. (2010). Phyto- and bacterioplankton abundance and viability and their relationship with phosphorus across the Mediterranean Sea. Aquat. Microb. Ecol. 60, 175–191. doi: 10.3354/ame01421
Lee, D. Y., and Rhee, G. Y. (1997). Kinetics of cell death in the cyanobacterium Anabaena flos-aquae and the production of dissolved organic carbon. J. Phycol. 33, 991–998. doi: 10.1111/j.0022-3646.1997.00991.x
Lewis, E., and Wallace, D. W. R. (1998). Program Developed for CO2 System Calculations. Tennessee: Carbon Dioxide Information Analysis Center, managed by Lockheed Martin Energy Research Corporation for the U.S. Department of Energy.
Li, W. K. W., McLaughlin, F. A., Lovejoy, C., and Carmack, E. C. (2009). Smallest algae thrive as the Arctic Ocean freshens. Science 326, 539. doi: 10.1126/science.1179798
Pubmed Abstract | Pubmed Full Text | CrossRef Full Text | Google Scholar
Li, W. K. W., Smith, J. C., and Platt, T. (1984). Temperature response of photosynthetic capacity and carboxylase activity in Arctic marine phytoplankton. Mar. Ecol. Progr. Ser. 17, 237–243. doi: 10.3354/meps017237
Llabrés, M., and Agustí, S. (2008). Extending the cell digestion assay to quantify dead phytoplankton cells in cold and polar waters. Limnol. Oceanogr. Methods 6, 659–666. doi: 10.4319/lom.2008.6.659
Malone, T. C. (1980). “Algal size,” in The Physiological Ecology of Phytoplankton, ed E. Morris (Berkeley; New York: University California Press), 433–453.
Meehl, G. A., Stocker, T. F., Collins, W. D., Friedlingstein, P., Gaye, A. T., Gregory, J. M., et al. (2007). “Global climate projections,” in Climate Change 2007: The Physical Science Basis. Contribution of Working Group I to the Fourth Assessment Report of the Intergovernmental Panel on Climate Change, eds S. Solomon, D. Qin, M. Manning, Z. Chen, M. Marquis, K. B. Averyt, et al. (Cambridge; New York: Cambridge University Press), 749–845.
Montagnes, D. J. S., and Franklin, D. J. (2001). Effect of temperature on diatom volume, growth rate, and carbon and nitrogen content: reconsidering some paradigms. Limnol. Oceanogr. 46, 2008–2018. doi: 10.4319/lo.2001.46.8.2008
Morán, X. A. G., López-Urrutia, A., Calvo-Díaz, A., and Li, W. K. W. (2010). Increasing importance of small phytoplankton in a warmer ocean. Glob. Change Biol. 16, 1137–1144. doi: 10.1111/j.1365-2486.2009.01960.x
Nakaoka, S.-I., Aoki, S., Nakazawa, T., Hashida, G., Morimoto, S., Yamanouchi, T., et al. (2006). Temporal and spatial variations of oceanic pCO2 and air – sea CO2 flux in the Greenland Sea and the Barents Sea. Tellus B 58, 148–161. doi: 10.1111/j.1600-0889.2006.00178.x
Neori, A., and Holm-Hansen, O. (1982). Effect of temperature on rate of photosynthesis in Antarctic phytoplankton. Polar Biol. 1, 33–38. doi: 10.1007/BF00568752
Parsons, T. R., Maita, Y., and Lalli, C. M. (1984). Manual of Chemical and Biological Methods for Seawater Analysis. Oxford: Pergamon press.
Pfeil, B., Olsen, A., Bakker, D. C., Hankin, S., Koyuk, H., Kozyr, A., et al. (2012). A uniform, quality controlled Surface Ocean CO2 Atlas (SOCAT). Earth Syst. Sci. Data 5, 735–780.
Raven, J., Caldeira, K., Elderfield, H., Hoegh-Guldberg, O., Liss, P., Riebesell, U., et al. (2005). Ocean Acidification Due to Increasing Atmospheric Carbon Dioxide. London: The Royal Society.
Redalje, D. G., and Laws, E. A. (1983). The effects of environmental factors on growth and the chemical and biochemical composition of marine diatoms. 1.Light and temperature effects. J. Exp. Mar. Biol. Ecol. 68, 59–79. doi: 10.1016/0022-0981(83)90013-8
Riebesell, U. (2004). Effects of CO2 enrichment on marine phytoplankton, J. Oceanogr. 60, 719–729. doi: 10.1007/s10872-004-5764-z
Riebesell, U., Schulz, K. G., Bellerby, R. G. J., Botros, M., Fritsche, P., Meyerhöfer, M., et al. (2007). Enhanced biological carbon consumption in a high CO2 ocean. Nature 450, 545–548. doi: 10.1038/nature06267
Pubmed Abstract | Pubmed Full Text | CrossRef Full Text | Google Scholar
Silyakova, A., Bellerby, R. G. J., Czerny, J., Schulz, K. G., Nondal, G., Tanaka, T., et al. (2012). Net community production and stoichiometry of nutrient consumption in a pelagic ecosystem of a northern high latitude fjord: mesocosm CO2 perturbation study. Biogeosci. Discuss. 9, 11705–11737. doi: 10.5194/bgd-9-11705-2012
Smetacek, V., and Nicol, S. (2005). Polar ocean ecosystems in a changing world. Nature 437, 362–368. doi: 10.1038/nature04161
Pubmed Abstract | Pubmed Full Text | CrossRef Full Text | Google Scholar
Steinacher, M., Joos, F., Frölicher, T. L., Plattner, G.-K., and Doney, S. C. (2009). Imminent ocean acidification in the Arctic projected with the NCAR global coupled carbon cycle-climate model. Biogeoscience 6, 515–533. doi: 10.5194/bg-6-515-2009
Tanaka, T., Alliouane, S., Bellerby, R. G. B., Czerny, J., De Kluijver, A., Riebesell, U., et al. (2013). Effect of increased pCO2 on the planktonic metabolic balance during a mesocosm experiment in an Arctic fjord. Biogeoscience 10, 315–325. doi: 10.5194/bg-10-315-2013
Thingstad, T. F., Bellerby, R. G. J., Bratbak, G., Børsheim, K. Y., Egge, J. K., Heldal, M., et al. (2008). Counterintuitive carbon-to- nutrient coupling in an Arctic pelagic ecosystem. Nature 455, 387–390.
Torstensson, A., Chierici, M., and Wulff, A. (2012). The influence of increased temperature and carbon dioxide levels on the benthic/sea ice diatom Navicula directa. Polar Biol. 35, 205–214. doi: 10.1007/s00300-011-1056-4
Tortell, P. D. (2000). Evolutionary and ecological perspectives on carbon acquisition in phytoplankton. Limnol. Oceanogr. 45, 744–750. doi: 10.4319/lo.2000.45.3.0744
Tortell, P. D., DiTullio, G. R., Sigman, D. M., and Morel, F. M. M. (2002). CO2 effects on taxonomic composition and nutrient utilization in an Equatorial Pacific phytoplankton assemblage. Mar. Ecol. Progr. Ser. 236, 37–43. doi: 10.3354/meps236037
Tortell, P. D., Payne, C. D., Li, Y., Trimborn, S., Rost, B., Smith, W. O., et al. (2008). CO2 sensitivity of Southern Ocean phytoplankton. Geophys. Res. Lett. 35, L04605. doi: 10.1029/2007GL032583
Trenberth, K. E., Jones, P. D., Ambenje, P., Bojariu, R., Easterling, D., Klein Tank, A., et al. (2007). “Observations: surface and atmospheric climate change,” in Climate Change 2007: The Physical Science Basis. Contribution of Working Group I to the Fourth Assessment Report of the Intergovernmental Panel on Climate Change, eds S. Solomon, D. Qin, M. Manning, Z. Chen, M. Marquis, K. B. Averyt, et al. (Cambridge; New York: Cambridge University Press), 235–336.
Walsh, J. E. (2008). Climate of the Arctic marine environment. Ecol. Appl. 18, S3–S22. doi: 10.1890/06-0503.1
Pubmed Abstract | Pubmed Full Text | CrossRef Full Text | Google Scholar
White, P. A., Kalff, J., Rasmussen, J. B., and Gasol, J. M. (1991). The effect of temperature and algal biomass on bacterial production and specific growth rate in freshwater and marine habitats. Microb. Ecol. 21, 99–118. doi: 10.1007/BF02539147
Pubmed Abstract | Pubmed Full Text | CrossRef Full Text | Google Scholar
Wolf-Gladrow, D., Riebesell, U., Burkhardt, S., and Bijma, J. (1999). Direct effects of CO2 concentration on growth and isotopic composition of marine plankton. Tellus 51B, 461–476. doi: 10.1034/j.1600-0889.1999.00023.x
Keywords: Arctic Ocean, phytoplankton, warming, CO2, interactive effects, diatoms
Citation: Coello-Camba A, Agustí S, Holding J, Arrieta JM and Duarte CM (2014) Interactive effect of temperature and CO2 increase in Arctic phytoplankton. Front. Mar. Sci. 1:49. doi: 10.3389/fmars.2014.00049
Received: 24 June 2014; Paper pending published: 26 July 2014;
Accepted: 16 September 2014; Published online: 02 October 2014.
Edited by:
Elvira S. Poloczanska, Commonwealth Scientific and Industrial Research Organisation, AustraliaReviewed by:
Aleksandra M. Lewandowska, Carl von Ossietzky University Oldenburg, GermanyNathan Samuel Hall, University of North Carolina at Chapel Hill, USA
Copyright © 2014 Coello-Camba, Agustí, Holding, Arrieta and Duarte. This is an open-access article distributed under the terms of the Creative Commons Attribution License (CC BY). The use, distribution or reproduction in other forums is permitted, provided the original author(s) or licensor are credited and that the original publication in this journal is cited, in accordance with accepted academic practice. No use, distribution or reproduction is permitted which does not comply with these terms.
*Correspondence: Carlos M. Duarte, The UWA Oceans Institute and School of Plant Biology, The University of Western Australia, 35 Stirling Highway, Crawley, WA 6009, Australia e-mail: carlos.duarte@uwa.edu.au