High salinity tolerance of the Red Sea coral Fungia granulosa under desalination concentrate discharge conditions: an in situ photophysiology experiment
 Riaan van der Merwe1*†
  Till Röthig2†
  Christian R. Voolstra2
  Michael A. Ochsenkühn3
  Sabine Lattemann1 Gary L. Amy1
- 1Water Desalination and Reuse Center, Biological and Environmental Sciences and Engineering Division, King Abdullah University of Science and Technology, Thuwal, Saudi Arabia
- 2Red Sea Research Center, Biological and Environmental Sciences and Engineering Division, King Abdullah University of Science and Technology, Thuwal, Saudi Arabia
- 3Biological and Organometallic Catalysis Laboratories, Physical Sciences and Engineering Division, King Abdullah University of Science and Technology, Thuwal, Saudi Arabia
Seawater reverse osmosis desalination concentrate may have chronic and/or acute impacts on the marine ecosystems in the near-field area of the discharge. Environmental impact of the desalination plant discharge is supposedly site- and volumetric- specific, and also depends on the salinity tolerance of the organisms inhabiting the water column in and around a discharge environment. Scientific studies that aim to understand possible impacts of elevated salinity levels are important to assess detrimental effects to organisms, especially for species with no mechanism of osmoregulation, e.g., presumably corals. Previous studies on corals indicate sensitivity toward hypo- and hyper-saline environments with small changes in salinity already affecting coral physiology. In order to evaluate sensitivity of Red Sea corals to increased salinity levels, we conducted a long-term (29 days) in situ salinity tolerance transect study at an offshore seawater reverse osmosis (SWRO) discharge on the coral Fungia granulosa. While we measured a pronounced increase in salinity and temperature at the direct outlet of the discharge structure, effects were indistinguishable from the surrounding environment at a distance of 5 m. Interestingly, corals were not affected by varying salinity levels as indicated by measurements of the photosynthetic efficiency. Similarly, cultured coral symbionts of the genus Symbiodinium displayed remarkable tolerance levels in regard to hypo- and hypersaline treatments. Our data suggest that increased salinity and temperature levels from discharge outlets wear off quickly in the surrounding environment. Furthermore, F. granulosa seem to tolerate levels of salinity that are distinctively higher than reported for other corals previously. It remains to be determined whether Red Sea corals in general display increased salinity tolerance, and whether this is related to prevailing levels of high(er) salinity in the Red Sea in comparison to other oceans.
Introduction
A growing demand of freshwater in semi-arid and arid regions (e.g., Arabian Peninsula) leads to the construction of an increasing number of seawater desalination plants, especially the low energy consuming seawater reverse osmosis (SWRO) desalination plants (Fritzmann et al., 2007). As a result, more hypersaline concentrate discharge (brine) reaches the marine environments (Lattemann and Höpner, 2008). Environmentally safe disposal of this brine is one of the key factors determining the environmental impacts of a desalination plant. The highest salinity that marine organisms can cope with in a desalination discharge area is defined as a salinity tolerance threshold. It depends on the species and the exposure time to elevated salinity levels (Voutchkov, 2009).
Euryhaline marine organisms can commonly tolerate changes in salinity (in contrast to stenohaline species) and series of small increments are generally better tolerated than direct exposure to high salinities (Voutchkov, 2009). Effects of concentrate discharges depend on exposure intensities, frequencies, the environment the brine is released into, and the brine temperature (Roberts et al., 2010). Accordingly, the effects of discharged brine can range from no significant impacts on microbial abundance or plankton communities, to widespread alterations in community structures of seagrass, invertebrates, soft-sediment infauna, and corals (Roberts et al., 2010 and references therein; van der Merwe et al., 2014).
Hermatypic corals are the key stone species of coral reefs, which are among the most diverse and productive ecosystems on this planet (Moberg and Folke, 1999). Coral health and survival fundamentally depend on the interaction between coral host and photosynthetic algae (zooxanthellae, genus Symbiodinium) that can be found in the endodermal tissues of reef-building corals. Unfortunately, research on the effects of brine discharge on corals is scarce. Mabrook (1994) reported corals disappearing from coastal areas in the Red Sea (Egypt) as a result of desalination plants discharge, but no reproducible data are presented. Corals are generally considered stenohaline osmoconformers and very sensitive to the effects of desalination plant discharge (Ferrier-Pages et al., 1999; Manzello and Lirman, 2003; Elimelech and Phillip, 2011).
Besides a desalination discharge context, more data on coral salinity tolerance are available; especially for decreased salinities. Generally, changes in salinity may affect metabolism and/or photophysiology of the coral animal and/or the corals' algal symbionts due to salinity stress (Muscatine, 1967; Chartrand et al., 2009). Moberg et al. (1997) suggested that photosynthetic rates are lowered in proportion to the reductions in salinity (10–20 PSU), whereas respiration rates were either slightly decreased or unaltered for two hermatypic corals upon hyposaline treatments. Hoegh-Guldberg and Smith (1989) concluded moderately reduced salinity (30 PSU) exposure for 4–10 days at several temperatures does not induce bleaching in Stylophora pistillata and Seriatopora hystrix. At lower salinities (i.e., at 23 PSU) the authors reported death within 48 h. Only a limited number of studies have included the impacts of hypersalinity on corals (and the possible effect it might have on dinoflagellate symbiont functionality within the host). Generally, the effects of hyper- and hyposaline treatments are similar (Muthiga and Szmant, 1987; Lirman and Manzello, 2009). Severity of effects observed commonly coincides with salinity concentration, exposure time, coral species, and the speed of salinity change.
In this study, our objective was to determine long-term effects (4 weeks) of a strong salinity increase on the coral Fungia granulosa. To do this, we transplanted corals along a 25 m transect from a SWRO facility discharge structure, and determined salinity, temperature, oxygen, and light levels regularly. At the same time, we measured the (photo)physiological state of the algal symbiont via PAM fluorometry and checked for signs of visual bleaching. PAM fluorometry quantifies the photosynthetic efficiency with which light energy is converted into chemical energy at photosystem II (PSII) level. Evaluating the chlorophyll fluorescence can indicate an organism's photosynthetic efficiency under changing or stressful conditions, e.g., varying salinity regimes (Chartrand et al., 2009), and therefore, serves as a stress indicator. Additionally, we assessed the salinity tolerance of cultured Symbiodinium to understand the contribution of the algal symbiont to salinity tolerance of the coral holobiont.
Materials and Methods
Experiment Overview
The existing SWRO facility (i.e., the submerged discharge location) at the King Abdullah University of Science and Technology (KAUST) was selected for this case study. The plant is located on the KAUST campus and is designed to provide all potable water needs. Under current operational conditions, the raw water intake is about 2825 m3 h−1 with a recovery rate of 39%, resulting in an average brine flow of 1723.25 m3 h−1 (41,358 m3 d−1) that is discharged to the Red Sea. The submerged outfall (discharge structure) is located at a water depth of 18 m, approximately 2.8 km from the pump station (22° 17.780N, 39° 04.444E). The concentrate is pumped through a 1.2 m diameter pipeline to the offshore structure where the concentrate is pushed up in a concrete riser and discharged horizontally through four discharge screens (1800 × 1000 mm) approximately 6 m above the seafloor.
Experimental Setup
We conducted an in situ salinity stress experiment on the coral F. granulosa collected from Fsar reef (22° 13.945N, 39° 01.783E, approximately 9 km from the study site) over 29 days (15.01.14–13.2.14). At Fsar reef salinity, light conditions, and effective quantum yields for F. granulosa were measured for reference purposes. Corals were handled with latex gloves and 18 specimens were collected from 16 to 19 m (similar depth to experimental study area) into separate zip lock bags. Corals were transported to the study site in shaded opac plastic boxes filled with ambient sea water. All specimens were placed on the roof of the discharge structure (Figure 1), labeled with nylon fishing line and under-water paper tags, and left for acclimation for 20 h. Three specimens were then randomly selected and placed at each of the 6 stations at the discharge screen (station 1) and along a 25 m transect (stations 2–6) (Figures 2A,B).
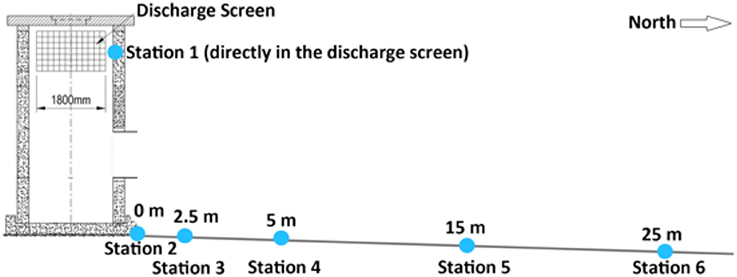
Figure 1. Discharge structure and stations assayed in this experiment.
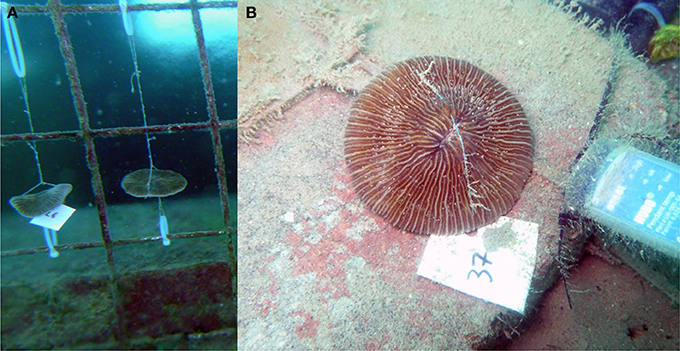
Figure 2. (A) Fungia granulosa attached to the discharge screen. (B) Tagged Fungia granulosa specimen; blue temp logger visible on right hand side (station 6).
Data Collection
We collected data on temperature, dissolved oxygen (DO), and salinity. For each sampling time point (T0–T6) we sampled between 11:00 and 12:00 h. We measured the effective quantum yield (ΔF/Fm′) and visually assessed all specimens for signs of bleaching. Temperature was logged continuously in 10 min intervals with HOBO Pendant® temperature data loggers at each station over the entire experiment. For DO and salinity measurements, water samples were collected during each dive from each station. Water samples for salinity measurements were collected using 50 mL Falcon Conical Centrifuge Tubes and 1 L low-density polyethylene (LDPE) cubitainer were used for DO samples. Salinity and DO were measured for all stations immediately after each dive. DO measurements were conducted using a WTW (Multi) 3500i Multi-Parameter Water Quality Meter with a CellOx® 325 DO electrode and salinity with a WTW Cond 3310 m with TetraCon® 325. Salinity and DO were analyzed for significant differences via One-Way ANOVA using Statistica 10 (StatSoft Inc. 2011, version 10). A diving PAM fluorometer (DIVING-PAM, Walz, Germany) was used to measure photosynthetically active radiation (PAR) at each station and to evaluate the effective quantum yields (ΔF/Fm′) of the symbiotic algae of each coral specimen. The effective quantum yield (ΔF/Fm′) of photochemical energy conversion in PSII for each measurement was calculated based on F and Fm′ according to Genty et al. (1989):
F and Fm′ measurements for each specimen were conducted between 11:00 and 12:00 h to ensure comparable daytime conditions (in regard to physiology and prevailing light regime). All ΔF/Fm′ measurements were taken in triplicate for each coral and specimens were only collected after the last sampling event (29 days).
Symbiodinium Culturing and Salt Gradient Stress Experiment
Symbiodinium microadriaticum CCMP2467 (clade A1 https://ncma.bigelow.org) was cultured in Guillard and Ryther F/2 media suspension without silicium in an incubator at a temperature of 26°C and with a light intensity set at 4 PAR (as measured by diving-PAM) (Guillard and Ryther, 1962). The F/2 media was newly prepared from sea water (obtained from 100 m depth in the Red Sea) and completed with 0.5 ml NaNO3, NaH2PO4, vitamins and trace metals following Guillard and Ryther (1962). The cells were kept in the exponential growth phase with a cell density between 105 and 106 cells mL−1 for 2 weeks prior to experiments. For the comparability of experiments, the cells were then directly transferred into a freshly prepared salt adjusted F/2 media with a cell density of ~1 × 10⁵ cells mL−1. A salt gradient experiment was conducted in concentrations ranging from 25 to 55 PSU (in increments of 5 PSU). The F/2 media were prepared by adding appropriate amounts of double-distilled water (ddH2O) for a diluted salinity range of 25–35 PSU. In order to obtain elevated salinity levels on the order of 45–55 PSU, the media was spiked with NaCl (Sigma). Cells were then transferred into sterilized plastic culture flasks in equal volumes (400 mL) of adjusted F/2 media to reach a cell density of ~1 × 10⁵ cells mL−1. Cells were sampled over a 7 day period at 7 different time points (0, 1, 2, 3, 5, and 7 d) at a temperature of 28°C and under a 9 PAR light intensity. The 0 d sample was used as a control and only withdrawn from cells at the 40 PSU (ambient) condition. Sample volumes for fluorescence activated cell- sorting (FACS) analysis were 1 mL, which were directly harvested by centrifugation (5430 R centrifuge, Eppendorf) at 10,000× g for 10 min at 4°C. For cell fixation, 700 μL media were withdrawn, adding 100 μL of 40% formaldehyde in ddH20 to each of the samples in order to reach a final concentration of 10%. Cells were thoroughly resuspended by vortexing and kept at 4°C until further analysis. Following cell fixation, Symbiodinium cells were again harvested by centrifugation, supernatant discarded, and washed once with 500 μL buffer solution phosphate buffered saline (PBS). PBS was removed completely and 500 μL SYBR Green DNA (2× conc., Life Technologies) staining in PBS was added. Cells were resuspended by vortexing and stained for 1 h at room temperature at 400 rpm in a ThermoMixer® (Eppendorf). After staining, cells were again pelleted by centrifugation, washed once with PBS and finally resuspended in 1 mL PBS. For FACS measurements 200 μL of each sample were transferred into a 96 well flat bottom well plate and measured. FACS measurements were conducted on a BD LSRFortessa™ cell analyzer (BD Bioscience, US) using the 405 nm violet laser and QDot655 filters for chlorophyll fluorescence. SYBR Green fluorescence was excited via the 488 nm blue laser and emission detected via Alexa Fluor® 488 filters for total nucleotide detection. FACS data was analyzed by FlowJo 7.5 flow cytometry analysis software.
Results
Ecological Conditions
Water temperature along the transect showed a range between 24.26 and 28.46°C (Table 1). Water temperatures recorded at the discharge screen (26.3 ± 0.78°C) were on average higher than at the other stations (25.93–26.08°C). The average temperatures were also slightly decreasing with increasing distance from the discharge structure. DO varied between 5.75 and 6.37 mg L−1. Average DO levels were 6.07 ± 0.17 mg L−1. We found no significant differences in DO between the stations (PANOVA ≥ 0.05). In contrast to DO, salinity data showed significant differences (Figure 3). At the discharge screen (station 1) salinity differed significantly from the other stations (PANOVA ≤ 0.05). We found no significant difference between all other stations (PANOVA ≥ 0.05) with an average of 41.3 ± 0.7 PSU. However, salinity decreased slightly with increasing distance from the discharge (Figure 3). Control measurements at Fsar reef (site of coral collection) showed a salinity of 39 PSU.
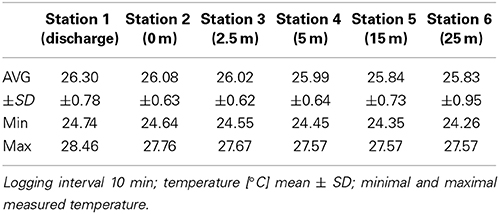
Table 1. Temperature data (HOBO Pendant® Temperature Data Loggers) from all transect stations.
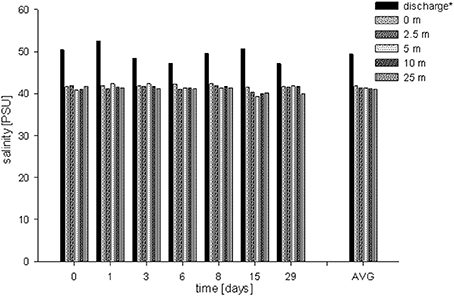
Figure 3. Salinity concentrations measured for each sampling event at each station (6 time points, 6 stations). Average salinities: 49.4 ± 2.0 PSU (discharge screen), 41.8 ± 0.3 PSU (0 m), 41.3 ± 0.6 PSU (2.5 m), 41.3 ± 1.0 PSU (5 m), 41.2 ± 0.6 PSU (15 m) and 41.0 ± 0.7 PSU (25 m), respectively. AVG shows the average salinity at each station.
Coral Salinity Tolerance
The effective quantum yield (ΔF/Fm′) was measured for all 18 coral colonies in triplicates for all time points (i.e., T0–T6) (Figure 4). Control measurements from corals in their natural reef environment showed average ΔF/Fm′ of 0.700 ± 0.010 (at 30–50 PAR; triplicate measurements on three specimens). ΔF/Fm′ at all stations were constant and in the same range as the controls. Average reads were 0.705 ± 0.009 (station 1), 0.694 ± 0.008 (station 2), 0.687 ± 0.007 (station 3), 0.687 ± 0.019 (station 4), 0.693 ± 0.017 (station 5), and 0.690 ± 0.02 (station 6). We found a drop in ΔF/Fm′ at T1 for stations 4–6 which corresponds with elevated light conditions on this day compared to the other stations and sampling events (65–82 PAR; Figures 4D–F). PAR levels ranged between 4 and 82, with average reads of 14 ± 4 (station 1), 17 ± 5 (station 2), 33 ± 13 (station 3), 45 ± 27 (station 4), 34 ± 27 (station 5), and 28 ± 21 (station 6). By trend, PAR levels at station 1 and 2 and to a smaller extent at station 3 were lower and more stable compared to the other stations (Figure 4). This pattern is caused by a shading effect of the discharge structure which kept light levels in its direct surrounding lower and more stable. No PAR was measured at time point T5. During the study we did not observe bleaching characteristics on the measured coral specimens.
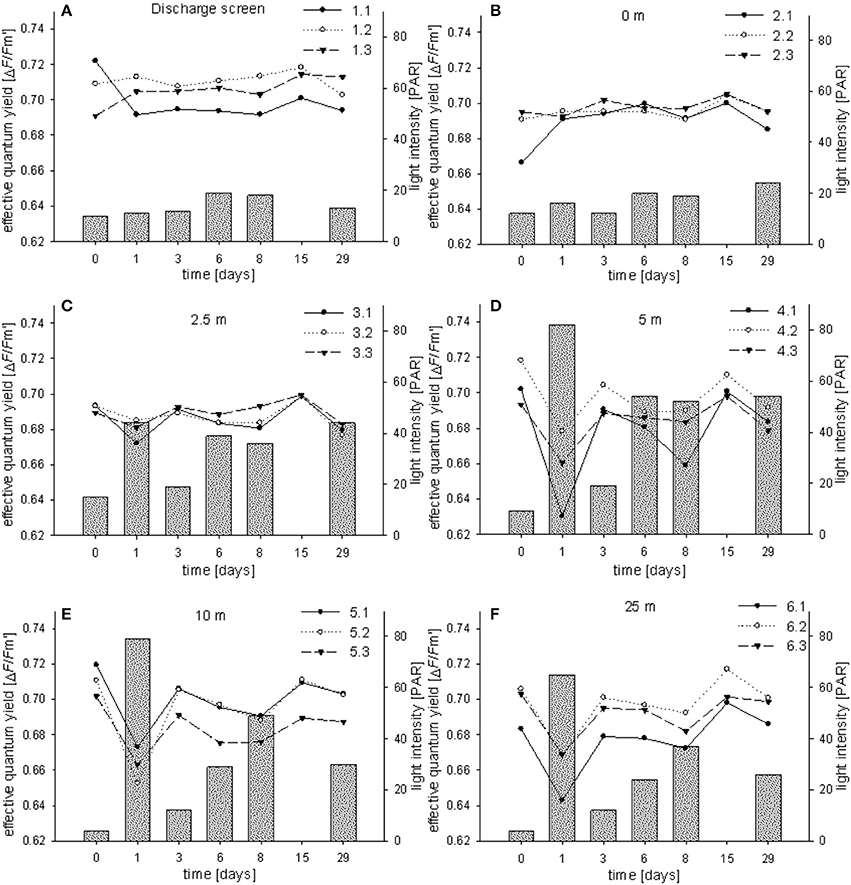
Figure 4. Effective PSII quantum yields (ΔF/Fm′) of individual Fungia granulosa specimens during the 29-day transplantation experiment at each station (A–F). Bars show photosynthetic active radiation (PAR).
Coral Symbiont Salinity Tolerance
To confirm our in vivo observations, i.e., the absence of measurable detrimental effects of high salinity on the (photo)physiology of F. granulosa, we investigated the response of cultured coral symbionts, i.e., Symbiodinium microadriaticum, to a range of salinity levels. Chlorophyll a levels and growth rate of S. microadriaticum were investigated at salinities between 25 and 55 PSU and samples were taken at 7 time points (0, 1, 2, 3, 5, and 7 d). FACS cell counts and chlorophyll a level measurements showed that Symbiodinium cells reached the exponential growth phase after 4 days of incubation at salinities between 30 and 50 PSU (Figure 5). The quickest cell proliferation was observed at 35 PSU. For concentration levels of 25 and 55 PSU, respectively, the cell growth rates were inhibited. Measuring chlorophyll levels by FACS showed no differences (data not shown).
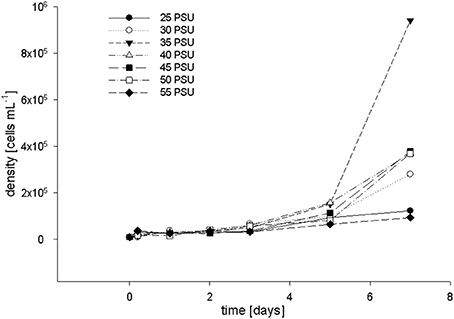
Figure 5. Coral symbiont cell growth determined by FACS after incubation in salt adjusted F/2 media at salinity levels ranging from 25–55 PSU (incubated at 28°C, under a light intensity of 9 PAR).
Discussion
In this study we (1) characterized physicochemical conditions along a 25 m transect at a SWRO facility discharge structure in the Red Sea. We measured (2) photosynthetic characteristics of F. granulosa as a response to a sudden and strong increase and continued elevated levels in salinity. We also checked for (3) indications of bleaching for the coral specimens exposed to the highest salinity levels directly at the discharge screen. Last, we (4) exposed Symbiodinium cultures to low and high levels of salinity to test salinity tolerance of the coral symbiont.
With regard to the physicochemical conditions, we measured a decrease in salinity and temperature with increasing distance from the discharge structure. Of note, we already measured distinct lower values at stations 2 and 3 (seafloor, 0 and 2.5 m) compared to station 1 (discharge screen). This indicates a quick natural mixing of the brine in the study area to the point of showing little to no discernible salinity abnormalities (within short distances). These findings are in line with the literature (Roberts et al., 2010). Light levels were dependent on water clarity and measured light levels were in a similar range to what we measured at the collection site (Fsar reef, 30–50 PAR). Stations 1–3 were shaded by the discharge structure and showed lower and more stable PAR levels. These light patterns were also reflected in our ΔF/Fm′ measurements, i.e., the photosynthetic characteristics of F. granulosa in response to changes in salinity (Figure 6). Measurements especially at station 1 and 2 (but also station 3) were more stable; in contrast stations 4–6 displayed stronger variations with a drop after 1 day (T1). This drop corresponds to noticeable clearer water and accordingly higher PAR values for the unshaded stations 4–6. All results are on the order of the “baseline” yields measured under natural conditions considering variations in light intensity and suggest no discernable effect on PSII level of the dinoflagellate symbionts of the corals. Average ΔF/Fm′ measures recorded at station 1 were higher than at the other stations (0.705 compared to 0.687–0.694). This again corresponds with lower average PAR values (14 compared to 17–45), but also underlines that the significantly higher salinity at station 1 does not negatively impact the photosynthetic efficiency of the coral's symbionts. However, effective quantum yield measurements, reflecting (chronic) photoinhibition, may have limitations. Measurements from bleached corals may result in apparent healthy PAM yields, rather depending on the physiological state of associated Symbiodinium and less on the symbiont density or total number of cells (Fitt et al., 2001). Bleaching may exhibit a loss of zooxanthellae and/or pigments and can indicate a breakdown in the essential symbiotic relationship between coral host and algal symbiont (Brown, 1997). Taking this into account, we visually inspected the corals during each sampling dive. We could not detect any apparent colony changes or loss in coloration (i.e., pigment loss) and thus exclude bleaching as a consequence of increased salinity during the duration of the experiment.
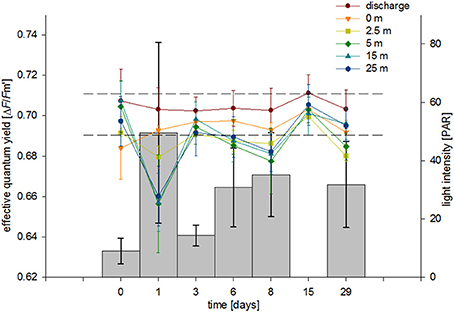
Figure 6. Average effective PSII quantum yields (ΔF/Fm′) from corals at each station over a 29-day exposure period. Bars show average PAR values for each sampling event. Error bars represent standard deviation, dashed lines indicate ΔF/Fm′ range from control coral colonies measured in their natural habitat.
Our results demonstrate a high salinity tolerance of the Red Sea coral F. granulosa. In contrast, other studies observed substantial loss of pigmentation and/or symbionts at considerably smaller salinity changes. For example, Ferrier-Pages et al. (1999) used a Red Sea clone of Stylophora pistillata that has been maintained in aquaria for several months. At moderately increased salinity levels (+2 PSU), coral colonies showed significant effects on photosynthesis, respiration, and protein content. Interestingly, the increased salinity of 40 PSU corresponds with the salinity in S. pistillata's natural habitat. In contrast, Lirman and Manzello (2009) found notable tolerance to salinity in Siderastrea radians, collected from Biscayne Bay, Florida where the authors measured highly variable levels of salinity. The authors also reported on Porites furcata (collected from the same bay) to be highly salinity tolerant (Manzello and Lirman, 2003). In a study from Chartrand et al. (2009), S. radians was collected from several different sites with different levels of natural salinity variations. The authors found a correlative trend of local salinity regimes and hyposaline stress tolerance levels. Colonies originating from less stable environments showed higher photosynthetic efficiency in hyposaline treatments than corals from more stable surroundings. These observations are in line with a recently conducted study, where Barshis et al. (2013) found “front-loading” of genes to confer higher temperature tolerance levels in corals exposed to temperature-variable environments in comparison to cooler, stable environments.
So far, literature mostly assumed corals to be stenohaline osmoconformers (Hoegh-Guldberg and Smith, 1989; Ferrier-Pages et al., 1999; Kerswell and Jones, 2003). In contrast, Chartrand et al. (2009) stated that a threshold response is indicative of the coral maintaining and successfully regulating its internal osmotic balance, which would contradict corals to be stenohaline osmoconformers. This is supported by a broad range of salinity tolerance levels found in different coral species depending on their original environment, which also indicates differently effective osmotic regulation. Furthermore, Mayfield and Gates (2007) discuss potential mechanisms involved in corals maintaining their osmotic balance. Accordingly, osmoregulatory processes presumably play a role in the performance of F. granulosa in this experiment. Osmoregulatory processes might be reflected by an initial reaction to the sudden salinity increase. This period presumably happened in our experiment between T0 and T1 and could be addressed by short-term studies. Since ambient salinity levels in the Red Sea are higher than in most other oceans (Douabul and Haddad, 1970) salinity tolerance in Red Sea corals might generally be higher than for corals in other oceans.
Photophysiological resilience of F. granulosa toward high salinity is supported by our Symbiodinium culture study. Inhibited cell growth at extreme changes in salinity (i.e., 25 and 55 PSU) might be caused by limits in the cellular salinity regulation capabilities of Symbiodinium cells, namely Na+ pumps (Na+-ATPase) (Goiran et al., 1997). Similar to plants, high NaCl exposure levels could lead to degradation of chlorophyll a as observed in sunflower leaves (Santos, 2004). Continuously lowered levels of active chlorophyll might result in a reduced energy uptake via photosynthesis and therefore, also directly influence cell growth. However, salinity levels up to 50 PSU (at par to highest measured in situ salinity levels) did not seem to inhibit cell growth in coral symbiont cultures. This demonstrates a wide plasticity (30–50 PSU) of Symbiodinium in regard to salinity changes, which has been found for hyposaline treatments before (Chartrand et al., 2009). This resilience furthermore indicates that the algal symbionts may generally not be determining the acclimation potential of the coral holobiont toward salinity changes.
In conclusion, we found a quick mixing of discharged brine with surrounding waters based on salinity and temperature measurements. The photophysiology of the coral F. granulosa exposed to the discharge environment along a 25 m transect was not influenced by rapid and prolonged changes in salinity (but varied according to changes in light conditions). Our data characterize F. granulosa coral holobionts to be remarkably resilient toward increased salinity levels, which are potentially brought about by acclimation to increased salinity levels in the Red Sea environment. Additionally, we showed that cell cultures of Symbiodinium only displayed inhibited cell growth at very high and low salinity levels. Based on our data we suggest F. granulosa from the Red Sea to possess a great acclimation potential to salinity changes, also in regard to future ocean scenarios.
Author Contributions
Till Röthig, Christian Robert Voolstra, Riaan van der Merwe, Michael A. Ochsenkühn designed and conceived the experiments. Riaan van der Merwe, Till Röthig, Michael A. Ochsenkühn generated data. Riaan van der Merwe, Till Röthig, Christian Robert Voolstra, Michael A. Ochsenkühn analyzed and interpreted data. Sabine Lattemann, Gary L. Amy contributed reagents/materials/analysis tools. Riaan van der Merwe, Till Röthig, Christian Robert Voolstra, Michael A. Ochsenkühn wrote the manuscript.
Conflict of Interest Statement
The authors declare that the research was conducted in the absence of any commercial or financial relationships that could be construed as a potential conflict of interest.
Acknowledgments
We would like to thank CMOR for assistance and support in field operations. Research in this study was supported by King Abdullah University of Science and Technology (KAUST).
Abbreviations
ΔF/Fm′, effective quantum yield; Brine, hypersaline concentrate discharge; DO, dissolved oxygen; FACS, fluorescence activated cell-sorting; PAM, pulse-amplitude modulation (fluorometry); PAR, photosynthetically active radiation; PBS, phosphate buffered saline; PSII, photosystem II; PSU, practical salinity units; SWRO, seawater reverse osmosis (desalination plant).
References
Barshis, D. J., Ladner, J. T., Oliver, T. A., Seneca, F. O., Traylor-Knowles, N., and Palumbi, S. R. (2013). Genomic basis for coral resilience to climate change. Proc. Natl. Acad. Sci. U.S.A. 110, 1387–1392. doi: 10.1073/pnas.1210224110
Pubmed Abstract | Pubmed Full Text | CrossRef Full Text | Google Scholar
Brown, B. E. (1997). Coral bleaching: causes and consequences. Coral Reefs 16, S129–S138. doi: 10.1007/s003380050249
Chartrand, K., Durako, M., and Blum, J. (2009). Effect of hyposalinity on the photophysiology of Siderastrea radians. Mar. Biol. 156, 1691–1702. doi: 10.1007/s00227-009-1204-3
Douabul, A., and Haddad, A. M. (1970). The Red Sea and Yemen's Red Sea Environments. Hassell and Assoc., AMSAT and UNOPS.
Elimelech, M., and Phillip, W. A. (2011). The future of seawater desalination: energy, technology, and the environment. Science 333, 712–717. doi: 10.1126/science.1200488
Pubmed Abstract | Pubmed Full Text | CrossRef Full Text | Google Scholar
Ferrier-Pages, C., Gattuso, J.-P., and Jaubert, J. (1999). Effect of small variations in salinity on the rates of photosynthesis and respiration of the zooxanthellate coral Stylophora pistillata. Mar. Ecol. Prog. Ser. 181, 309–314. doi: 10.3354/meps181309
Fitt, W., Brown, B., Warner, M., and Dunne, R. (2001). Coral bleaching: interpretation of thermal tolerance limits and thermal thresholds in tropical corals. Coral Reefs 20, 51–65. doi: 10.1007/s003380100146
Fritzmann, C., Löwenberg, J., Wintgens, T., and Melin, T. (2007). State-of-the-art of reverse osmosis desalination. Desalination 216, 1–76. doi: 10.1016/j.desal.2006.12.009
Genty, B., Briantais, J.-M., and Baker, N. R. (1989). The relationship between the quantum yield of photosynthetic electron transport and quenching of chlorophyll fluorescence. Biochim. et Biophys. Acta Gen. Subj. 990, 87–92. doi: 10.1016/S0304-4165(89)80016-9
Goiran, C., Allemand, D., and Galgani, I. (1997). Transient Na+ stress in symbiotic dinoflagellates after isolation from coral-host cells and subsequent immersion in seawater. Mar. Biol. 129, 581–589. doi: 10.1007/s002270050199
Guillard, R. R. L., and Ryther, J. H. (1962). Studies of marine planktonic diatoms: I. Cyclotella nana Hustedt, and Detonula confervacea (cleve) Gran. Can. J. Microbiol. 8, 229–239. doi: 10.1139/m62-029
Pubmed Abstract | Pubmed Full Text | CrossRef Full Text | Google Scholar
Hoegh-Guldberg, O., and Smith, G. J. (1989). The effect of sudden changes in temperature, light and salinity on the population density and export of zooxanthellae from the reef corals Stylophora pistillata Esper and Seriatopora hystrix Dana. J. Exp. Mar. Biol. Ecol. 129, 279–303. doi: 10.1016/0022-0981(89)90109-3
Kerswell, A. P., and Jones, R. J. (2003). Effects of hypo-osmosis on the coral Stylophora pistillata: nature and cause of ‘low-salinity bleaching’. Mar. Ecol. Prog. Ser. 253, 145–154. doi: 10.3354/meps253145
Lattemann, S., and Höpner, T. (2008). Environmental impact and impact assessment of seawater desalination. Desalination 220, 1–15. doi: 10.1016/j.desal.2007.03.009
Lirman, D., and Manzello, D. (2009). Patterns of resistance and resilience of the stress-tolerant coral Siderastrea radians (Pallas) to sub-optimal salinity and sediment burial. J. Exp. Mar. Biol. Ecol. 369, 72–77. doi: 10.1016/j.jembe.2008.10.024
Mabrook, B. (1994). Environmental impact of waste brine disposal of desalination plants, Red Sea, Egypt. Desalination 97, 453–465. doi: 10.1016/0011-9164(94)00108-1
Manzello, D., and Lirman, D. (2003). The photosynthetic resilience of Porites furcata to salinity disturbance. Coral Reefs 22, 537–540. doi: 10.1007/s00338-003-0327-0
Mayfield, A. B., and Gates, R. D. (2007). Osmoregulation in anthozoan–dinoflagellate symbiosis. Comp. Biochem. Physiol. A: Mol. Integr. Physiol. 147, 1–10. doi: 10.1016/j.cbpa.2006.12.042
Pubmed Abstract | Pubmed Full Text | CrossRef Full Text | Google Scholar
Moberg, F., and Folke, C. (1999). Ecological goods and services of coral reef ecosystems. Ecol. Econ. 29, 215–233. doi: 10.1016/S0921-8009(99)00009-9
Moberg, F., Nyström, M., Kautsky, N., Tedengren, M., and Jarayabhand, P. (1997). Effects of reduced salinity on the rates of photosynthesis and respiration in the hermatypic corals Porites lutea and Pocillopora damicornis. Mar. Ecol. Prog. Ser. 157, 53–59. doi: 10.3354/meps157053
Muscatine, L. (1967). Glycerol excretion by symbiotic algae from corals and tridacna and its control by the host. Science 156, 516–519. doi: 10.1126/science.156.3774.516
Pubmed Abstract | Pubmed Full Text | CrossRef Full Text | Google Scholar
Muthiga, N. A., and Szmant, A. M. (1987). The effects of salinity stress on the rates of aerobic respiration and photosynthesis in the hermatypic coral Siderastrea siderea. Biol. Bull. 173, 539–551. doi: 10.2307/1541699
Roberts, D. A., Johnston, E. L., and Knott, N. A. (2010). Impacts of desalination plant discharges on the marine environment: a critical review of published studies. Water Res. 44, 5117–5128. doi: 10.1016/j.watres.2010.04.036
Pubmed Abstract | Pubmed Full Text | CrossRef Full Text | Google Scholar
Santos, C. V. (2004). Regulation of chlorophyll biosynthesis and degradation by salt stress in sunflower leaves. Sci. Hortic. 103, 93–99. doi: 10.1016/j.scienta.2004.04.009
van der Merwe, R., Hammes, F., Lattemann, S., and Amy, G. (2014). Flow cytometric assessment of microbial abundance in the near-field area of seawater reverse osmosis concentrate discharge. Desalination 343, 208–216. doi: 10.1016/j.desal.2014.01.017
Keywords: desalination, salinity tolerance, Fungia granulosa, Symbiodinium, coral reef, Red Sea, marine monitoring, environmental impact assessment
Citation: van der Merwe R, Röthig T, Voolstra CR, Ochsenkühn MA, Lattemann S and Amy GL (2014) High salinity tolerance of the Red Sea coral Fungia granulosa under desalination concentrate discharge conditions: an in situ photophysiology experiment. Front. Mar. Sci. 1:58. doi: 10.3389/fmars.2014.00058
Received: 10 July 2014; Accepted: 24 October 2014;
Published online: 10 November 2014.
Edited by:
Hans Uwe Dahms, Kaohsiung Medical University, TaiwanReviewed by:
Xiaoshou Liu, Ocean University of China, ChinaRajesh Kumar Ranjan, Central University of Bihar, India
Copyright © 2014 van der Merwe, Röthig, Voolstra, Ochsenkühn, Lattemann and Amy. This is an open-access article distributed under the terms of the Creative Commons Attribution License (CC BY). The use, distribution or reproduction in other forums is permitted, provided the original author(s) or licensor are credited and that the original publication in this journal is cited, in accordance with accepted academic practice. No use, distribution or reproduction is permitted which does not comply with these terms.
*Correspondence: Riaan van der Merwe, Red Sea Research Center, Marine Monitoring and Environmental Management, King Abdullah University of Science and Technology, Building 2, Level 2, Thuwal 23955-6900, Saudi Arabia e-mail: riaan.vandermerwe@kaust.edu.sa
†These authors have contributed equally to this work.