Depth-dependent photodegradation of marine dissolved organic matter
 Stephen A. Timko1*
  Anastasia Maydanov2 Sandra L. Pittelli3
  Maureen H. Conte4,5
  William J. Cooper1 Boris P. Koch6,7
  Philippe Schmitt-Kopplin8,9
  Michael Gonsior10
- 1Department of Civil and Environmental Engineering, University of California, Irvine, Irvine, CA, USA
- 2Department of Chemistry and Chemical Biology, Northeastern University, Boston, MA, USA
- 3Department of Chemistry and Biochemistry, Georgia Institute of Technology, Atlanta, GA, USA
- 4Bermuda Institute of Ocean Sciences, St. George's, Bermuda
- 5Ecosystems Center, Marine Biological Laboratory, Woods Hole, MA, USA
- 6Ecological Chemistry, Alfred-Wegener-Institut Helmholtz Zentrum für Polar- und Meeresforschung, Bremerhaven, Germany
- 7Maritime Technology, University of Applied Sciences, Bremerhaven, Germany
- 8Helmholtz Zentrum München, Analytical BioGeoChemistry, Neuherberg, Germany
- 9Technische Universität München, Analytical Food Chemistry, Freising-Weihenstephan, Germany
- 10Chesapeake Biological Laboratory, University of Maryland Center for Environmental Science, Solomons, MD, USA
Marine dissolved organic matter (DOM) in surface and deep waters of the eastern Atlantic Ocean and Sargasso Sea was analyzed by excitation emission matrix (EEM) fluorescence spectroscopy and parallel factor analysis (PARAFAC). Photo-degradation with semi-continuous monitoring of EEMs and absorbance spectra was used to measure the photo-degradation kinetics and changes of the PARAFAC components in a depth profile of DOM at the Bermuda Atlantic Time Series (BATS) station in the Sargasso Sea. A five component model was fit to the EEMs, which included traditional terrestrial-like, marine-like, and protein-like components. Terrestrial-like components showed the expected high photo-reactivity, but surprisingly, the traditional marine-like peak showed slight photo-production in surface waters, which may account for its prevalence in marine systems. Surface waters were depleted in photo-labile components while protein-like fluorescent components were enriched, consistent with previous studies. Ultra-high resolution mass spectrometry detected unique aliphatic compounds in the surface waters at the BATS site, which may be photo-produced or photo-stable. Principle component and canonical analysis showed strong correlations between relative contributions of unsaturated/aromatic molecular formulas and depth, with aliphatic compounds more prevalent in surface waters and aromatic compounds in deep waters. Strong correlations were seen between these aromatic compounds and humic-like fluorescent components. The rapid photo-degradation of the deep-sea fluorescent DOM in addition to the surface water relative depletion of aromatic compounds suggests that deep-sea fluorescent DOM may be too photochemically labile to survive during overturning circulation.
Introduction
Marine dissolved organic matter (DOM) is one of the largest carbon reservoirs on Earth. At 662 Pg of carbon, it contains over 200 times the amount of carbon stored as marine biomass (Hansell et al., 2009). Consequently, the composition and reactivity of marine DOM is of utmost importance in understanding the role that this material plays in the marine carbon cycle.
DOM dynamics are often studied via changes in the portion which is colored or chromophoric (CDOM). CDOM absorbs light in the UV and visible regions, and participates in a wide range of photochemical reactions, including the production of CO and dissolved inorganic carbon (Miller and Zepp, 1995; Gao and Zepp, 1998), low molecular weight organic acids (Kieber et al., 1989), and reactive intermediates (Cooper et al., 1989; Vione et al., 2014). Photochemical transformations of CDOM can also lead to either an enhancement or reduction in its bio-availability (Kieber et al., 1989; Tranvik and Bertilsson, 2001). The smaller fraction of CDOM that is fluorescent (FDOM) is the most photo-reactive, and is found throughout the ocean.
Traditionally, CDOM in the ocean has been attributed to terrestrial sources, namely lignin, and other higher plant material, while autochthonous production was only recognized on local- and short temporal scales (Coble, 2007; Andrew et al., 2013). More recently, the microbial carbon pump model for microbial production has been found to be an important oceanic source of biologically recalcitrant CDOM in the oceans (Jiao et al., 2010), and it has been suggested that autochthonous biological production may surpass terrestrial input of FDOM to the oceans (Yamashita and Tanoue, 2008; Jørgensen et al., 2011; Nelson and Siegel, 2013).
Photo-bleaching has been recognized as the most important sink for CDOM in the ocean, both through the direct mineralization as well as potential transformation of CDOM to smaller and more bio-available forms (Gonsior et al., 2014a). In the open ocean, surface waters are usually CDOM- and FDOM depleted and concentrations increase with depth (Jørgensen et al., 2011; Catalá et al., 2015). The light history and the biogeochemical origin of the CDOM affect its lability; for example, areas of upwelling, high biological productivity, and decreased irradiance have higher CDOM and FDOM content (Nelson and Siegel, 2013). Additionally, deep water DOM that has not been exposed to light for extended periods of time may be more photosensitive, degrading faster than DOM that has already undergone some photobleaching (Gonsior et al., 2013).
Excitation emission matrix (EEM) fluorescence is the most common method of investigating FDOM in the ocean. Fluorescence detection is much more sensitive than absorbance, making it more practical for analyzing low levels of FDOM (Coble, 2007). EEM spectroscopy in particular is sensitive enough to analyze low concentrations of DOM in bulk seawater and fast enough to investigate small-scale variation in composition (Coble, 1996). While direct comparisons of EEMs is an important qualitative (and semi-quantitative) tool, parallel factor (PARAFAC) analysis, which compares large datasets of EEMs and deconvolutes them into statistically independent components, has emerged as the leading method for quantification of fluorescence signatures (Murphy et al., 2013).
Ultrahigh resolution electrospray ionization (ESI) Fourier transform ion cyclotron resonance mass spectrometry (FT-ICR-MS) has been used to characterize marine DOM (Koch et al., 2005; Hertkorn et al., 2006; D'andrilli et al., 2010; Gonsior et al., 2011, 2014a; Flerus et al., 2012; Chen et al., 2014; Lechtenfeld et al., 2014); however, the relationship between molecular composition and optical properties remains unclear. Herzsprung et al. (2012) compared humic-like fluorescence intensities of water from a German drinking water reservoir catchment area with mass peaks identified using FT-ICR-MS, and found strong correlations between unsaturated, highly oxidized compounds and this fluorescence. Studies of DOM-rich boreal rivers and lakes likewise compared EEM-PARAFAC components with molecular formulas derived from FT-ICR-MS, identifying similar relationships between longer wavelength, “humic-like” fluorescent components and oxidized aromatic compounds (Stubbins et al., 2014; Kellerman et al., 2015).
In order to better understand the processing of FDOM in the ocean, we investigated depth-related changes in abundance and photochemical reactivity of FDOM in the North Atlantic Ocean. The molecular composition of DOM from a detailed depth profile was analyzed by FT-ICR-MS and then correlated to EEM-PARAFAC components.
Materials and Methods
Sample Sites
Samples were collected on three separate cruises in the Atlantic Ocean. Seawater samples were collected during a cruise of the R/V Polarstern, Nov. 2008, along a transect from 50.2° N to 31.4° S in the eastern Atlantic Ocean. Samples were collected using a 24 Niskin bottle rosette CTD profiler at the surface and 200 m depth. Depth profiles (0–4525 m) of seawater were also collected at the Bermuda Atlantic Time Series (BATS) site in the northern Sargasso Sea southeast of Bermuda during cruises of the R/V Atlantic Explorer in June 2012 (0, 110, 750, 1500, 3000, and 4527 m) and July 2013 (every 200 m from 0 to 4400 m, and 4525 m).
All samples were solid phase extracted using a previously described method (Dittmar et al., 2007). Briefly, 5–20 L of filtered samples (0.7 μm Whatman GF/F) were acidified with hydrochloric acid (p.a. grade) to pH 2. Solid-phase extraction cartridges (Agilent Bond Elut PPL) packed with 1 g resin were conditioned with methanol, rinsed with acidified (pH 2) ultra-pure water, and the samples were gravity-fed through each cartridge. Cartridges were then rinsed with additional acidified water, dried, and the samples eluted with 5 or 10 mL methanol. Methanolic extracts were stored at −18°C prior to further analyses. Previous work has shown that for open ocean samples, DOC extraction efficiency is ~42% (Dittmar et al., 2008; Lechtenfeld et al., 2014), and that while CDOM and FDOM extraction with this method is incomplete, extracts are representative, showing similar relative changes in absorbance and fluorescence as whole water samples (Roettgers and Koch, 2012).
Photo-irradiation Experiments
Photo-irradiation experiments were conducted on extracts collected at BATS in June 2012. The volume of extract used for each sample was proportional to the volume of seawater extracted in order to keep the concentration factor constant. Methanol extracts were dried under N2, dissolved in 25 mL NanoPure water, sonicated for 5 min, and filtered through pre-washed 0.2 μm Whatman GD/X syringe filters immediately before use. Each sample was then irradiated for 24 h with a photo-irradiation system described in detail previously (Timko et al., in press). Briefly, samples were irradiated with an Oriel® Sol2A Class ABA solar simulator (Newport Corporation, Irvine, CA) equipped with 1000 W Xe arc lamp and AM 1.5 filter. Light intensity was measured daily with a Newport 91150 V Reference Cell and adjusted to 1000 W m−2, with an average light flux of 33 W m−2 from 300 to 400 nm. Samples were pumped through a flow-through irradiation cell into an equilibration vial with 750 μL of volume to allow equilibration with air and to prevent oxygen starvation. Samples were then drawn through an Aqualog spectrofluorometer (Horiba Instruments) and pumped back through the irradiation cell. The short pathlength of the irradiation cell (1 mm) prevented screening effects and allowed for accurate and reproducible experiments, with at least 4-fold changes in DOC having no effect on fluorescence degradation kinetics (Timko et al., in press).
Absorbance and EEM spectra were collected simultaneously at 20 min intervals throughout the photo-irradiation experiments. Excitation scans were recorded from 600 to 220 nm in 2 nm steps. Emission spectra were collected in ~3 nm steps from 211.5 to 617.7 nm, with integration times of 1 s. Spectra were converted to Quinine Sulfate Units (QSU) by dividing fluorescence intensities by the fluorescence intensity of 1 mg L−1 standard reference quinine sulfate or to Raman Units (RU) by dividing intensities by the area under the water Raman peak at 350 nm excitation (emission range 383–442 nm). Rayleigh- and Raman scattering and inner filter effects were corrected for by the Aqualog software and in MATLAB with the methods described by Zepp et al. (2004). Methanol extracts of cruise samples not used in photo-irradiation experiments were dried under N2, dissolved in NanoPure water, and fluorescence spectra recorded as above.
Photo-degradation of PARAFAC Components C2 and C4 (see below) were modeled using a double exponential function using IGOR Pro (WaveMetrics, Inc):
where the fluorescence (F) at time t is modeled as the loss of the labile (L) and semi-labile (SL) fractions at rate constants k (Sleighter et al., 2014; Timko et al., in press). Samples were irradiated without pH adjustment or control. The pH of samples increased slightly (0.09–0.65 pH units, 0.32 pH units average) during 24 h of irradiation, with the maximum change of 0.65 pH units occurring with the 3000 m depth sample. In a previous study, rates of FDOM loss during irradiations of Suwannee River natural organic matter were shown to be not significantly different when the pH was varied by 1 pH unit; we therefore assumed that the small pH changes during irradiations in this study had no significant impact on the reaction kinetics (Timko et al., in press).
PARAFAC Modeling
PARAFAC modeling was conducted using the drEEM toolbox (Murphy et al., 2013). A total of 611 EEMs, of which 173 were from cruise samples and 438 from photo-irradiation experiments, were visually investigated, and outliers (scans with bubbles, spectral errors, etc.) removed. Samples were normalized to unit variance to reduce concentration effects during modeling, and the normalization reversed after model completion. Excitation wavelengths < 250 nm showed high leverages (deviation from average distribution), most likely due to higher relative values and/or the lower signal to noise ratio at such wavelengths (Stedmon and Bro, 2008); removal of these wavelengths improved the modeling, namely the spectral loadings of longer-wavelength components. Two separate models were fit: the East Atlantic transect (surface and 200 m depth), and the Sargasso Sea samples (including spectra collected during photo-irradiation experiments). Evaluation of spectral loadings, split-half validation, random initialization analysis, and rigorous residuals analyses were performed as described elsewhere (Stedmon and Bro, 2008; Murphy et al., 2013). Criteria for final model assignment were (1) split-half validation (2) residuals analysis and (3) spectral loadings.
Ultrahigh Resolution Mass Spectrometry
The solid-phase extracted samples from the July 2013 depth profile at BATS (26 samples total) were analyzed using the electrospray ionization (ESI) source of the Bruker Apex QE 12 Tesla FT-ICR-MS located at the Helmholtz Center for Environmental Health, Munich, Germany. Samples were diluted with methanol 1:20 before injection to avoid overloading the ion cyclotron resonance ion trap which could lead to peak splitting and inconsistent calibration across the desired mass range (147–2000 Dalton). To avoid any cross-contamination between samples, an automated cleaning procedure was implemented that used 600 μL (80% methanol, 20% pure water) at a flow rate of 300 μL min−1 between samples. The sample flow rate was set to 3 μL min−1, and ESI was run in negative mode at −3.6 kV. Five hundred spectra were averaged to obtain a mass accuracy better than 0.2 ppm and an average mass resolution of about 500,000 at m/z 350–400. The MS system was pre-calibrated using arginine and then post-calibrated by using known DOM m/z ions (255.08741 = C12H15O6, 297.09798 = C14H17O7, 367.13984 = C18H23O8, 491.15589 = C24H27O11, 553.1562 = C25H29O14, 611.19814 = C28H35O15, and 707.25566 = C34H43O16) throughout the entire mass range of interest (200–800 Da). The signal to noise ratio was set to 10 and mass lists were subsequently generated.
The mass resolution and accuracy of the FT-ICR-MS system allowed molecular formula assignments to ions up to m/z 800. Not all m/z ions could be assigned, indicating that some m/z peaks were outside of the used atomic combination of 12C0−∞, 1H0−∞, 16O0−∞, 14N0−3, and 32S0−2, as well as the following isotopologs 13C, and 34S. Visualization of complex mass spectrometric data have been achieved by elemental or van Krevelen diagrams (van Krevelen, 1950). A modified Kendrick plot was also used to visualize homologs series that are spaced only by CH2 groups (Yekta et al., 2012).
Multivariate Statistical Analysis
All data were normalized via autoscaling by subtracting the average of a variable from the data and then dividing by the standard deviation, allowing for multivariate statistical analysis (Bro and Smilde, 2014). All generated mass lists of all FT-ICR-MS samples were then combined in a large matrix. The generation of the matrix was undertaken by searching m/z ions within an error of 0.2 ppm to be able to assign one m/z value to all intensities of all spectra. If a m/z was found in one sample but not in others, the missing intensity value was replaced by 0. This approach resulted in a matrix where all m/z ions represented the variables and the m/z intensities the data. Principal component analyses (PCA) were undertaken on the normalized FT-ICR-MS and EEM-PARAFAC data sets, respectively. The normalized fluorescence data was then used to create a resemblance matrix using Spearman Rank Correlations. This EEM-PARAFAC resemblance matrix was then used for the canonical analysis on principal coordinates (CAP) of the FT-ICR-MS data matrix. CAP analysis allowed to discriminate between sets of variables, in this case, between the EEM-PARAFAC Components and m/z molecular ions and their intensities.
Results
PARAFAC Modeling
PARAFAC analysis of the Sargasso Sea dataset (492 EEMs) produced a five component model (split-half validated, >99.8% explained variance; Figure 1). The components contained “humic-like” components characterized by fluorescence in the visible region, as well as components in the UVA portion of the spectrum. This UVA fluorescence is characteristic of small aromatic molecules, including the amino acids tryptophan and tyrosine. The model components were labeled according to conventional terminology as “marine-like” C1 (ex/em = < 250 (306)/404 nm), “terrestrial-like” C2 (<250 (360)/447), UVA component C3 (<250 (282)/332), “terrestrial-like” C4 (276(399)/497), and UVA component C5 (276/304) (Coble, 2007; Stedmon and Nelson, 2015). To examine the robustness of the model, a five component model was fit to only the East Atlantic cruise data (119 EEMs), with 99.7% explained variance. Models with more than five components could not be split-half validated. Models with less than five components showed significant peaks and troughs throughout the residuals, indicative of a poor model fit, while the residuals of the five component models only showed minor peaks along the Raman and Rayleigh scattering lines (Murphy et al., 2013). The components in both the East Atlantic and the Sargasso Sea models were very similar with regards to peak location and shape, especially for the visible fluorescent components (Figure 2). This similarity provides a strong validation that the modeling of the EEMs collected during photo-irradiation experiments are indicative of fluorescence changes occurring in the natural environment, even on large geographical scales. Hence, the observed results on the photochemical changes in marine FDOM are not limited to the Sargasso Sea, but can presumably generalized, at least to the greater Atlantic Ocean.
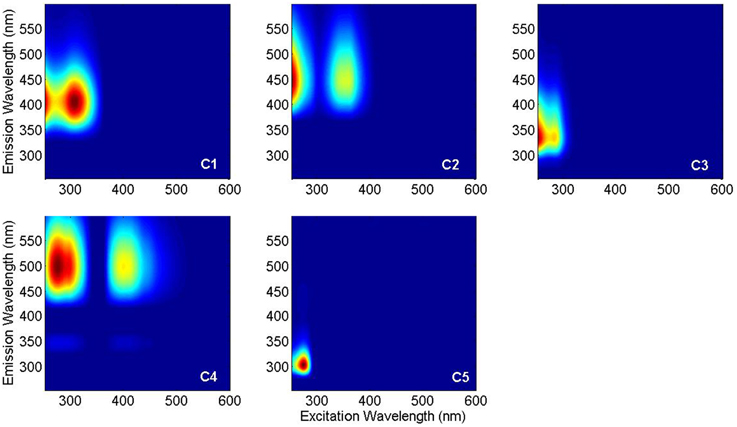
Figure 1. PARAFAC components in Sargasso Sea FDOM: marine-like C1, terrestrial-like C2, UVA C3, terrestrial-like C4, and UVA C5.
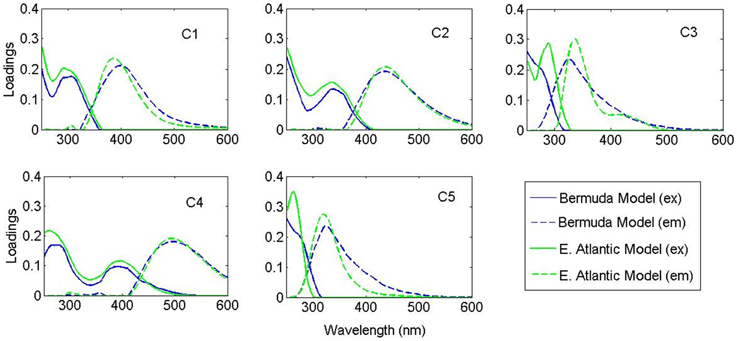
Figure 2. Spectral loadings of the PARAFAC components in the Bermuda model (blue) and East Atlantic model (green).
Depth Dependence of FDOM Fluorescence Intensity at BATS
All three visible fluorescence components (C1, C2, and C4) were significantly depleted in surface waters and increased with depth (Figure 3). The intensity of marine-like C1 was on average 3.4 times higher below 1000 m than at the surface. The intensity of “terrestrial-like” components C2 and C4 were also higher below 1000 m (5.9 and 5.6 times, respectively) than at the surface. In contrast, UVA component C5 was maximal at the surface and decreased with depth, albeit less dramatically. On average, C5 intensity was 1.5 times higher at the surface than in waters >1000 m depth. UVA component C3 showed no strong depth-dependence. No strong correlations between PARAFAC component intensity and apparent oxygen utilization (AOU) were seen, although the small dataset (two depth profiles) prevented detailed interpretation of these results.
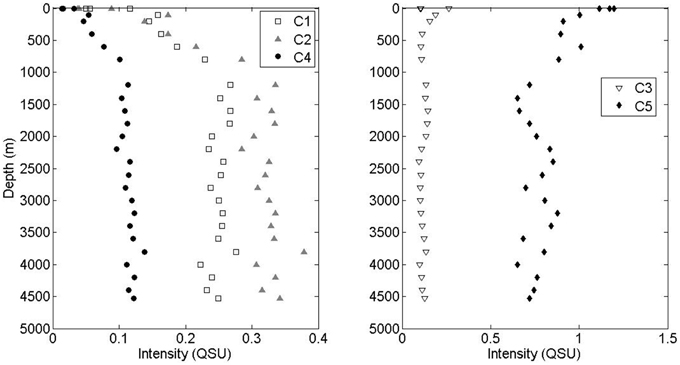
Figure 3. Depth profiles of visible fluorescence components C1, C2, and C4 and UVA components C3 and C5.
Photo-degradation Kinetics of FDOM At BATS
EEMs before and after irradiation, and differential plots, are shown in Figure 4. Terrestrial-like components C2 and C4 showed significant photo-lability at all depths. The long-wavelength component C4 showed greater relative fluorescence loss (%), whereas component C2 showed greater total loss in fluorescence (Figure 5). The rate of loss of the semi-labile fraction, kSL, showed no depth-dependent trend, with an average 0.063 ± 0.008 h−1 for C2 and 0.069 ± 0.008 h−1 for C4. The rate of loss of the labile fraction, kL, was faster in the surface and 110 m samples (2.2 ± 0.2 h−1 and 1.4 ± 0.2 h−1 for C2 and C4, respectively) than in the deep samples (1.1 ± 0.1 h−1 and 0.89 ± 0.08 h−1 for C2 and C4, respectively). Loss of C2 over the 24 h irradiations was lowest in the surface sample (38%), followed by the 110 m sample (42%), while samples at depth showed extremely similar C2 loss (50 ± 1%). Loss of C4 showed a similar trend, with the least amount of fluorescence lost in the surface sample (51%), while the samples at greater depth all showed similar loss (60 ± 3%).
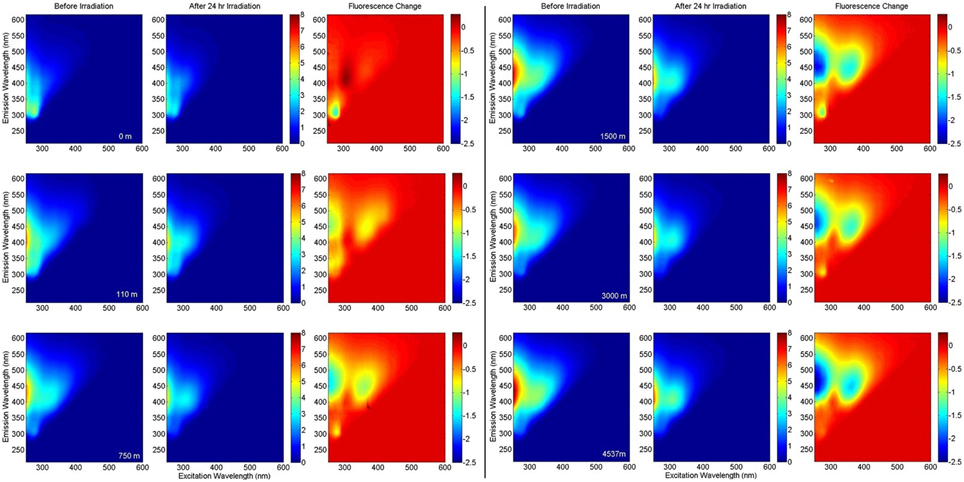
Figure 4. EEM fluorescence of BATS samples at various depths before and after irradiation, and the fluorescence change. All fluorescence intensities are in Raman Units.
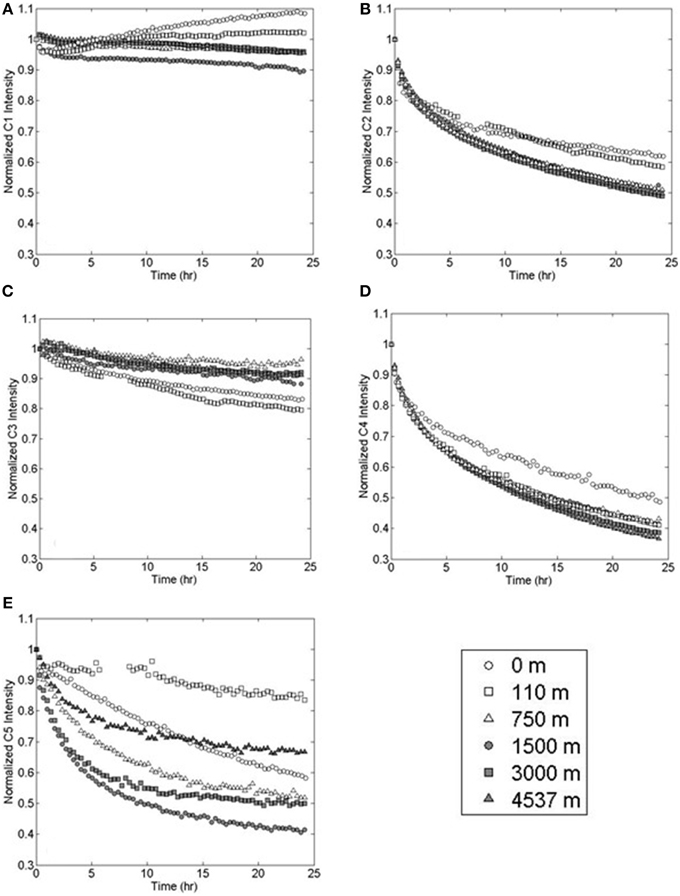
Figure 5. Photo-degradation of PARAFAC components (A) marine-like C1, (B) terrestrial-like C2, (C) UVA C3, (D) terrestrial-like C4, and (E) UVA C5 at various depths in the Sargasso Sea.
Marine-like component C1 showed variable, but more limited, photo-reactivity than either C2 or C4 (Figure 5). At the surface, C1 fluorescence decreased by 4% in the first 20 min of irradiation and then increased to a final value which was 8% higher than the initial fluorescence. Similarly, C1 fluorescence at 110 m depth (the chlorophyll fluorescence maximum) initially decreased by 3% and then increased to a final value that was 2% greater than the initial fluorescence. In deep waters, C1 fluorescence decreased over the 24 h irradiation period by 10% at 1500 m depth and by an average of 5% at other depths.
UVA fluorescent components C3 and C5 showed variable photo-lability (Figures 5C,E). Maximum decreases in C3 fluorescence over the 24 h irradiation period were observed at the surface (15%) and at the 110 m chlorophyll fluorescence maximum (20%). The minimum decrease in C3 fluorescence was observed at 750 m depth (<4%). Samples from 1500, 3000, and 4537 m depths showed intermediate decreases in fluorescence (12, 8, and 9%, respectively). Component C5 fluorescence intensity decreases ranged from 16 to 58% with no discernable depth trend.
Ultrahigh Resolution Mass Spectrometry
The majority of m/z peaks were shared between all samples in the 0–4525 m depth profile at the BATS site. However, direct comparison between averaged surface samples collected at BATS in 2013 and the 4525 m sample (35 m above bottom) revealed distinct characteristic and unique signatures (Figure 6). In surface waters, there were 165 unique CHO molecular ions at a signal to noise ratio of 10, representing largely aliphatic compounds with hydrogen to carbon ratios (H/C) between 1.5 and 2.0 and oxygen to carbon ratios (O/C) between 0.2 and 0.7, as well as 90 nitrogen-containing ions (CHNO). These occupied the same aliphatic area within the chemical space indicative of presumably labile compounds, with the exception of a distinct higher abundant group centered on H/C of 1.2 and O/C of 0.5. Interestingly, the largest unique signature was the presence of 230 high abundant sulfur-containing ions that again were localized in the aliphatic region of the van Krevelen diagram.
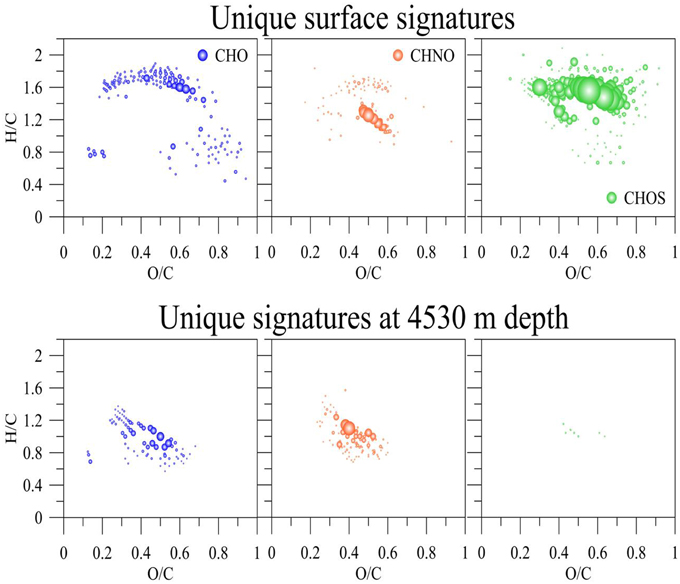
Figure 6. Unique assigned molecular formulas of the SPE-DOM at 5 m and 4530 m depth collected at BATS in the Sargasso Sea, 2013.
In contrast to surface waters, waters at 4525 m depth contained unique low abundant hydrogen deficient molecular CHO (n = 78) and CHNO (n = 112) ions that showed H/C of 0.6–1.2 and O/C of 0.2–0.6 but very few unique CHOS ions. Hence, aliphatic compounds were enriched at the surface and more aromatic compounds were present at depths. This finding agrees with the increase of FDOM with depth and the biological, and potentially photochemical, production of labile aliphatic compounds at the surface.
Statistical Evaluation of FT-MS and EEM PARAFAC Data
The PCA results from the FT-ICR-MS data clearly differentiated molecular variations in surface, mixed layer, and waters from >800 m depth (Figure 7B). A Spearman Rank correlation of the variables (m/z) and the Principal Component 1 (indicative of depth) revealed similar patterns in the van Krevelen diagram (Figure 8) when compared to the unique signatures (Figure 6): aliphatic CHO and CHNO ions correlated well with the surface while more hydrogen-deficient ions correlated with depth. However, the region of the van Krevelen with O/C ratios between 0.5 and 0.8 and H/C ratios between 0.5 and 1.2 was much more occupied (Figure 8, CHO plot). This region in the van Krevelen diagram has been previously suggested to be highly correlated with CDOM that can be flocculated by aluminum sulfate in a drinking water treatment plant (Gonsior et al., 2014b).
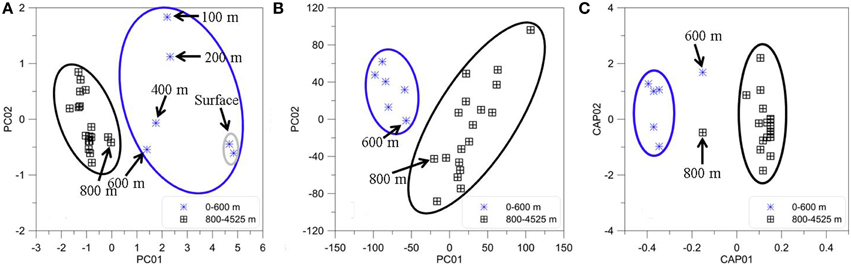
Figure 7. Statistical analyses of BATS depth profile (2013). (A) Principal Components One and Two for all PARAFAC component intensities. (B) Principal Components One and Two for all FT-ICR-MS m/z molecular ions and their intensities for the same samples. (C) Canonical analysis on principal coordinates (CAP) of the normalized EEM resemblance matrix and the FT-ICR-MS data.
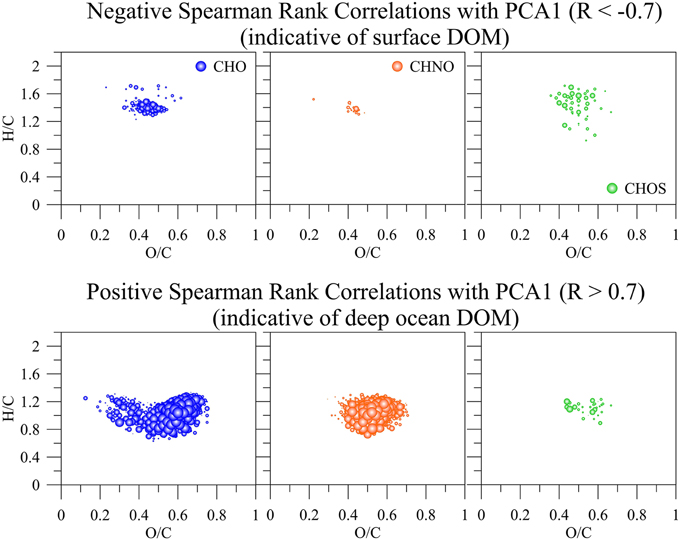
Figure 8. Positive (indicative of surface DOM) and negative (indicative of deep ocean DOM) Spearman Rank correlations greater R = 0.7 and lower −0.7, respectively of all common m/z ions, their intensities, and assigned molecular formulas with the first principal component (PCA1) derived from SPE-DOM samples collected at BATS in 2013 and analyzed by FT-ICR-MS. The bubble size corresponds to R-values between 0.7 and 1 and −0.7 and −1, respectively.
PCA was also carried out on the intensities of the five PARAFAC components (Figure 7A) Results showed a similar separation between surface and deep waters as for the FT-ICR-MS data (Figure 7B). Lastly, Canonical Analysis on Principal coordinates (CAP) (Anderson and Willis, 2003) was used to correlate the two independent FT-ICR-MS and EEM-PARAFAC datasets (Figure 7C). In this method, ordination can be constrained by using any dissimilarity measures while also incorporating the correlation structures of variables. Results of the CAP analysis of the EEM-PARAFAC data resemblance matrix (Spearman Rank correlations) with the FT-ICR-MS data also showed a clear separation between surface, mixed layer and >800 m samples (Figure 7C) along CAP Component 1 (CAP1). Eigenvector values of CAP1 were then used to distinguish between m/z ions and associated molecular formulas that were indicative of surface and mixed layer (negative values) and of the deep ocean (positive values). Results again indicate enrichment in aliphatic compounds (CHO, CHNO) and substantial sulfur-containing molecules (CHOS) in the surface waters and enrichment in more unsaturated/aromatic compounds and polyphenolic-like composition at depth (Figure 9).
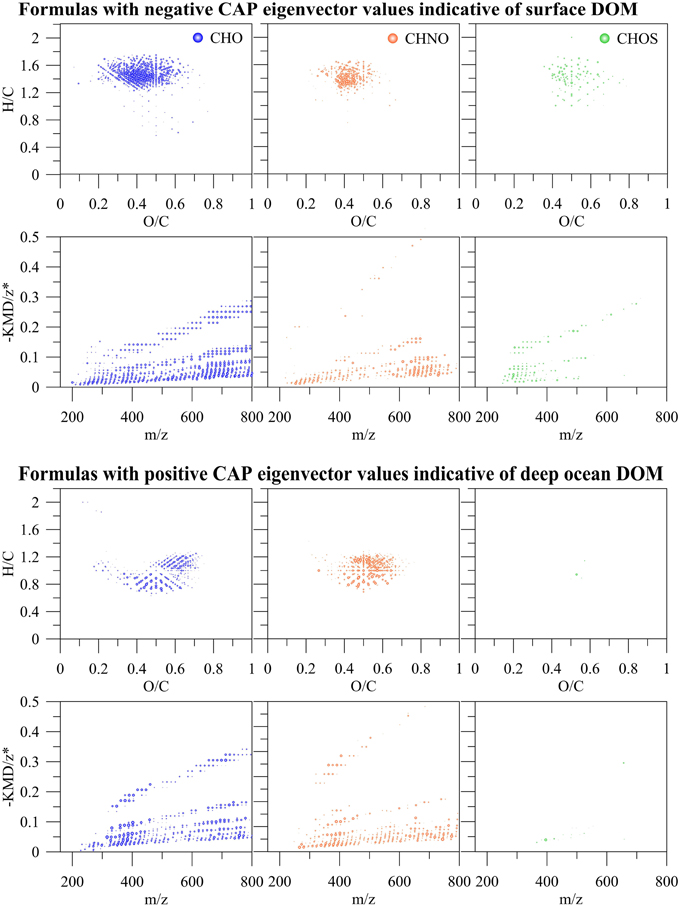
Figure 9. m/z ions and associated molecular formulas with negative and positive eigenvector values of the canonical analysis on principal coordinate 1 (CAP1) of the EEM resemblance matrix and the FT-ICR-MS data of all SPE-DOM samples collected at BATS in 2013 (see also Figure 7C).
Discussion
Photochemical loss of fluorescence in Sargasso Sea waters was dominated by terrestrial-like components C2 and C4. The photo-reactivity of these components explains why these components were found to be depleted at the ocean surface (Jørgensen et al., 2011). The lesser degradation in the surface samples was expected, as the most photo-labile structures were already bleached from the surface water. Interestingly, the kinetic analysis showed no depth-dependent trends in the rate of loss of the semi-labile fraction of each component, kSL. This suggests that the groups of fluorophores responsible for this fraction of the fluorescence are compositionally similar at all depths, while the labile fraction, kL, may consist of different classes of compounds that contain similar fluorescent moieties. Photo-degradation of terrestrial-like components C2 and C4 showed similar relative kinetics to Suwannee River Natural Organic Matter (IHSS standard), with C4 losing a greater percentage of its initial fluorescence, but C2 losing greater total fluorescence (Timko et al., in press). The fluorophores responsible for C4 fluorescence are believed to be high molecular weight (poly)phenolic compounds, which are some of the most reactive sites in CDOM (McNally et al., 2005; Boyle et al., 2009; Kellerman et al., 2015). The abundance and photo-lability of terrestrial-like C2 and C4 at depth could be due to the prevalence of terrestrial organic matter in Arctic waters, where this DOM is subducted before it can be extensively photo-bleached (Benner et al., 2005). Alternatively, there is growing evidence that these “terrestrial” signals may be produced in situ microbially (Shimotori et al., 2012; Jørgensen et al., 2014), and/or excreted by macro brown algae (Shank et al., 2010), zooplankton, and Trichodesmium sp. (Steinberg et al., 2004).
In contrast to the terrestrial-like FDOM signals, marine-like C1 showed limited photo-degradation, and even slight production in surface waters. Marine-like C1 production may have only been seen in the surface and 110 m samples due to lack of precursor material in deeper waters. Such materials may include tryptophan, tyrosine, and other low molecular weight aromatic structures, which have been shown to produce CDOM and “humic-like” FDOM photochemically (Biers et al., 2007; De Laurentiis et al., 2013; Bianco et al., 2014). UVA component C5 was significantly enriched in the surface and 110 m samples, and while typically are classified as “protein-like,” may also contain low molecular weight aromatics. Input of these precursors was likely from primary producers in the photic zone (Jørgensen et al., 2011), as well as CDOM exuded by the brown macroalgae Sargassum natans (Shank et al., 2010), which is prevalent in the Sargasso Sea in July, when sampling occurred. Despite its lack of photo-degradation and even slight photo-production, C1 was found to be depleted in the surface ocean, which has been shown previously (Heller et al., 2013). The observed photo-products may not be photo-stable over long time periods, as photo-degradation of marine FDOM has been shown during longer irradiation experiments (Helms et al., 2013). Dried PPL extracts were reconstituted in deionized water for the photo-irradiation experiments, removing the potential impact of reactive halogen species on FDOM loss. Previous work showed that while halides had little effect on the photo-bleaching of terrestrial FDOM, an algal exudate showed enhanced FDOM loss in the C1 region when halides were present (Grebel et al., 2009). Additionally, Romera-Castillo et al., reported loss of fluorescence in the C1 region during microbial incubations (Romera-Castillo et al., 2011). Photo-bleaching via reactive halogen species or microbial degradation (all samples in this study were filter sterilized) may therefore further account for the depletion of C1 fluorescence in the surface ocean.
Protein-like compounds undergo both sunlight-induced direct photolysis and indirect photolysis via reactive intermediate species. The location of reactive sites such as tryptophan and tyrosine within the structure are a critical factor in reaction rates, with steric hindrances affecting reactions with singlet oxygen and proximity to DOM sensitizers/quenchers (Janssen et al., 2014; Lundeen et al., 2014). The kinetics of UVA fluorescence loss (C3 and C5) are likewise complicated by the fact that protein-like fluorescence undergoes variable quenching depending on the location of fluorescent amino acids in (or free from) the protein structure (Kronman and Holmes, 1971; Lakowicz, 2006). Additionally, protein-like fluorescence has been shown to be quenched by humic substances (Wang et al., 2015). The effects of quenching on the UVA fluorescence intensity could not be determined due to the changes in quantity and quality of the proteinaceous and humic-like materials during irradiation. Therefore, while these components showed photo-lability, alternate techniques would be necessary to accurately quantify changes in proteinaceous material. Nevertheless, the photo-lability of these components is likely offset by high primary production in the surface ocean.
Ultrahigh resolution mass spectrometry showed unique aliphatic signatures in the surface waters, including a diverse group of aliphatic sulfur-containing molecular ions which may be generated by photoautotrophs or communities depending on primary production (Figure 6). The principal component analysis using the m/z ions and their intensities (Figure 8), as well as the correlation between the mass peaks and the fluorescence (Figure 9) associated aliphatic compounds with surface waters and hydrogen-deficient compounds with deep water samples. The enrichment of aliphatic compounds in marine surface waters have been previously documented and is in good agreement with our data (Flerus et al., 2012). In 57 day irradiations of Congo River water, the majority of photo-resistant peaks and photo-products identified by FT-ICR-MS were aliphatic, while aromatic compounds were the most photo-reactive (Stubbins et al., 2010). NMR and FTIR spectroscopy have similarly identified aromatic sites as the most photo-labile (Thorn et al., 2010; Helms et al., 2014). These depth-dependent trends match those of the North Pacific, including an apparent homogeneity in the FT-ICR peaks below 1000 m depth (Medeiros et al., 2015). This apparent homogeneity is notable because it matched exactly the trends observed in EEM-PARAFAC components that are indicative for conjugated aromatic compounds such as polyphenols.
Fluorescence in the marine- and terrestrial-like regions of the EEM have been shown to be produced by microbes (Rochelle-Newall and Fisher, 2002; Biers et al., 2007), and correlated well with apparent oxygen utilization (AOU) at depth (Yamashita and Tanoue, 2008; Jørgensen et al., 2011; Kowalczuk et al., 2013; Catalá et al., 2015; Lønborg et al., 2015). The microbial carbon pump is believed to produce (semi)refractory molecules, including CDOM and FDOM, in the mesopelagic zone, which are then transported to the deep ocean (Jiao et al., 2010; Flerus et al., 2012; Hansell, 2013). The fast photo kinetics shown in this study as well as the enrichment in hydrogen-deficient molecular ions at depth and depletion of these molecules at the surface highly suggests that deep-sea FDOM is very unlikely to survive overturning circulation and hence cannot be responsible for the DOM component that contributes to the very old apparent 14C age of deep sea DOM of 3700–6000 years (Bauer et al., 1992).
Conflict of Interest Statement
The authors declare that the research was conducted in the absence of any commercial or financial relationships that could be construed as a potential conflict of interest.
Acknowledgments
This project was supported by the Maryland Sea Grant REU program in summer 2013 and 2014. This is contribution 5083 of the University of Maryland Center for Environmental Science. Shiptime aboard the RV Atlantic Explorer was kindly provided by the Oceanic Flux Program (OFP) time-series (NSF OCE 0927098 and OCE 1234294). This material is based upon work supported by the National Science Foundation Graduate Research Fellowship Program under Grant No. DGE-1321846 (SAT).
References
Anderson, M. J., and Willis, T. J. (2003). Canonical analysis of principal coordinates: a useful method of constrained ordination for ecology Ecology 84, 511–525. doi: 10.1890/0012-9658(2003)084[0511:CAOPCA]2.0.CO;2
Andrew, A. A., Del Vecchio, R., Subramaniam, A., and Blough, N. V. (2013). Chromophoric dissolved organic matter (CDOM) in the Equatorial Atlantic Ocean: optical properties and their relation to CDOM structure and source. Mar. Chem. 148, 33–43. doi: 10.1016/j.marchem.2012.11.001
Bauer, J. E., Williams, P. M., and Druffel, E. R. M. (1992). 14C activity of dissolved organic carbon fractions in the north-central Pacific and Sargasso Sea. Nature 357, 667–670. doi: 10.1038/357667a0
Benner, R., Louchouarn, P., and Amon, R. M. W. (2005). Terrigenous dissolved organic matter in the Arctic Ocean and its transport to surface and deep waters of the North Atlantic. Global Biogeochem. Cycles 19:GB2025. doi: 10.1029/2004GB002398
Bianco, A., Minella, M., De Laurentiis, E., Maurino, V., Minero, C., and Vione, D. (2014). Photochemical generation of photoactive compounds with fulvic-like and humic-like fluorescence in aqueous solution. Chemosphere 111, 529–536. doi: 10.1016/j.chemosphere.2014.04.035
Biers, E. J., Zepp, R. G., and Moran, M. A. (2007). The role of nitrogen in chromophoric and fluorescent dissolved organic matter formation. Mar. Chem. 103, 46–60. doi: 10.1016/j.marchem.2006.06.003
Boyle, E. S., Guerriero, N., Thiallet, A., Del Vecchio, R., and Blough, N. V. (2009). Optical Properties of Humic Substances and CDOM: Relation to Structure. Environ. Sci. Technol. 43, 2262–2268. doi: 10.1021/es803264g
Bro, R., and Smilde, A. K. (2014). Principal component analysis. Anal. Methods 6, 2812–2831. doi: 10.1039/c3ay41907j
Catalá, T. S., Reche, I., Fuentes-Lema, A., Romera-Castillo, C., Nieto-Cid, M., Ortega-Retuerta, E., et al. (2015). Turnover time of fluorescent dissolved organic matter in the dark global ocean. Nat Commun 6:5986. doi: 10.1038/ncomms6986
Chen, H., Stubbins, A., Perdue, E. M., Green, N. W., Helms, J. R., Mopper, K., et al. (2014). Ultrahigh resolution mass spectrometric differentiation of dissolved organic matter isolated by coupled reverse osmosis-electrodialysis from various major oceanic water masses. Mar. Chem. 164, 48–59. doi: 10.1016/j.marchem.2014.06.002
Coble, P. G. (1996). Characterization of marine and terrestrial DOM in seawater using excitation emission matrix spectroscopy. Mar. Chem. 51, 325–346. doi: 10.1016/0304-4203(95)00062-3
Coble, P. G. (2007). Marine optical biogeochemistry: the chemistry of ocean color. Chem. Rev. 107, 402–418. doi: 10.1021/cr050350+
Cooper, W. J., Zika Rod, G., Petasne Robert, G., and Fischer Anne, M. (1989). “Sunlight-induced photochemistry of humic substances in natural waters: major reactive species,” in Aquatic Humic Substances, eds I. H. Suffet, and P. MacCarthy (Washington, DC: American Chemical Society), 333–362.
D'andrilli, J., Dittmar, T., Koch, B. P., Purcell, J. M., Marshall, A. G., and Cooper, W. T. (2010). Comprehensive characterization of marine dissolved organic matter by Fourier transform ion cyclotron resonance mass spectrometry with electrospray and atmospheric pressure photoionization. Rapid Commun. Mass Spectrom. 24, 643–650. doi: 10.1002/rcm.4421
De Laurentiis, E., Maurino, V., Minero, C., Vione, D., Mailhot, G., and Brigante, M. (2013). Could triplet-sensitised transformation of phenolic compounds represent a source of fulvic-like substances in natural waters? Chemosphere 90, 881–884. doi: 10.1016/j.chemosphere.2012.09.031
Dittmar, T., Koch, B., Hertkorn, N., and Kattner, G. (2008). A simple and efficient method for the solid-phase extraction of dissolved organic matter (SPE-DOM) from seawater. Limnol. Oceanogr. Methods 6, 230–235. doi: 10.4319/lom.2008.6.230
Dittmar, T., Whitehead, K., Minor, E. C., and Koch, B. P. (2007). Tracing terrigenous dissolved organic matter and its photochemical decay in the ocean by using liquid chromatography/mass spectrometry. Mar. Chem. 107, 378–387. doi: 10.1016/j.marchem.2007.04.006
Flerus, R., Lechtenfeld, O. J., Koch, B. P., Mccallister, S. L., Schmitt-Kopplin, P., Benner, R., et al. (2012). A molecular perspective on the ageing of marine dissolved organic matter. Biogeosciences 9, 1935–1955. doi: 10.5194/bg-9-1935-2012
Gao, H. Z., and Zepp, R. G. (1998). Factors influencing photoreactions of dissolved organic matter in a coastal river of the southeastern United States. Environ. Sci. Technol. 32, 2940–2946. doi: 10.1021/es9803660
Gonsior, M., Hertkorn, N., Conte, M. H., Cooper, W. J., Bastviken, D., Druffel, E., et al. (2014a). Photochemical production of polyols arising from significant photo-transformation of dissolved organic matter in the oligotrophic surface ocean. Mar. Chem. 163, 10–18. doi: 10.1016/j.marchem.2014.04.002
Gonsior, M., Peake, B. M., Cooper, W. T., Podgorski, D. C., D'andrilli, J., Dittmar, T., et al. (2011). Characterization of dissolved organic matter across the Subtropical Convergence off the South Island, New Zealand. Mar. Chem. 123, 99–110. doi: 10.1016/j.marchem.2010.10.004
Gonsior, M., Schmitt-Kopplin, P., and Bastviken, D. (2013). Depth-dependent molecular composition and photo-reactivity of dissolved organic matter in a boreal lake under winter and summer conditions. Biogeosciences 10, 6945–6956. doi: 10.5194/bg-10-6945-2013
Gonsior, M., Schmitt-Kopplin, P., Stavklint, H., Richardson, S. D., Hertkorn, N., and Bastviken, D. (2014b). Changes in dissolved organic matter during the treatment processes of a drinking water plant in Sweden and formation of previously unknown disinfection byproducts. Environ. Sci. Technol. 48, 12714–12722. doi: 10.1021/es504349p
Grebel, J. E., Pignatello, J. J., Song, W., Cooper, W. J., and Mitch, W. A. (2009). Impact of halides on the photobleaching of dissolved organic matter. Mar. Chem. 115, 134–144. doi: 10.1016/j.marchem.2009.07.009
Hansell, D. A. (2013). Recalcitrant dissolved organic carbon fractions. Ann. Rev. Mar. Sci. 5, 421–445. doi: 10.1146/annurev-marine-120710-100757
Hansell, D. A., Carlson, C. A., Repeta, D. J., and Schlitzer, R. (2009). Dissolved organic matter in the ocean: a controversy stimulates new insights. Oceanography 22, 202–211. doi: 10.5670/oceanog.2009.109
Heller, M. I., Gaiero, D. M., and Croot, P. L. (2013). Basin scale survey of marine humic fluorescence in the Atlantic: Relationship to iron solubility and H2OO2. Global Biogeochem. Cycles 27, 88–100. doi: 10.1029/2012GB004427
Helms, J. R., Mao, J., Stubbins, A., Schmidt-Rohr, K., Spencer, R. G. M., Hernes, P. J., et al. (2014). Loss of optical and molecular indicators of terrigenous dissolved organic matter during long-term photobleaching. Aquat. Sci. 76, 353–373. doi: 10.1007/s00027-014-0340-0
Helms, J. R., Stubbins, A., Perdue, E. M., Green, N. W., Chen, H., and Mopper, K. (2013). Photochemical bleaching of oceanic dissolved organic matter and its effect on absorption spectral slope and fluorescence. Mar. Chem. 155, 81–91. doi: 10.1016/j.marchem.2013.05.015
Hertkorn, N., Benner, R., Frommberger, M., Schmitt-Kopplin, P., Witt, M., Kaiser, K., et al. (2006). Characterization of a major refractory component of marine dissolved organic matter. Geochim. Cosmochim. Acta 70, 2990–3010. doi: 10.1016/j.gca.2006.03.021
Herzsprung, P., Von Tümpling, W., Hertkorn, N., Harir, M., Büttner, O., Bravidor, J., et al. (2012). Variations of DOM quality in inflows of a drinking water reservoir: linking of van krevelen diagrams with EEMF spectra by rank correlation. Environ. Sci. Technol. 46, 5511–5518. doi: 10.1021/es300345c
Janssen, E. M. L., Erickson, P. R., and Mcneill, K. (2014). Dual roles of dissolved organic matter as sensitizer and quencher in the photooxidation of tryptophan. Environ. Sci. Technol. 48, 4916–4924. doi: 10.1021/es500535a
Jiao, N., Herndl, G. J., Hansell, D. A., Benner, R., Kattner, G., Wilhelm, S. W., et al. (2010). Microbial production of recalcitrant dissolved organic matter: long-term carbon storage in the global ocean. Nat. Rev. Microbiol. 8, 593–599. doi: 10.1038/nrmicro2386
Jørgensen, L., Stedmon, C. A., Granskog, M. A., and Middelboe, M. (2014). Tracing the long-term microbial production of recalcitrant fluorescent dissolved organic matter in seawater. Geophys. Res. Lett. 41, 2481–2488. doi: 10.1002/2014GL059428
Jørgensen, L., Stedmon, C. A., Kragh, T., Markager, S., Middelboe, M., and Søndergaard, M. (2011). Global trends in the fluorescence characteristics and distribution of marine dissolved organic matter. Mar. Chem. 126, 139–148. doi: 10.1016/j.marchem.2011.05.002
Kellerman, A. M., Kothawala, D. N., Dittmar, T., and Tranvik, L. J. (2015). Persistence of dissolved organic matter in lakes related to its molecular characteristics. Nature Geosci 8, 454–457. doi: 10.1038/ngeo2440
Kieber, D. J., Mcdaniel, J., and Mopper, K. (1989). Photochemical source of biological substrates in seawater- implications for carbon cycling. Nature 341, 637–639. doi: 10.1038/341637a0
Koch, B. P., Witt, M. R., Engbrodt, R., Dittmar, T., and Kattner, G. (2005). Molecular formulae of marine and terrigenous dissolved organic matter detected by electrospray ionization Fourier transform ion cyclotron resonance mass spectrometry. Geochim. Cosmochim. Acta 69, 3299–3308. doi: 10.1016/j.gca.2005.02.027
Kowalczuk, P., Tilstone, G. H., Zablocka, M., Roettgers, R., and Thomas, R. (2013). Composition of dissolved organic matter along an Atlantic Meridional Transect from fluorescence spectroscopy and Parallel Factor Analysis. Mar. Chem. 157, 170–184. doi: 10.1016/j.marchem.2013.10.004
Kronman, M. J., and Holmes, L. G. (1971). The fluorescence of native, denatured and reduced-denatured proteins. Photochem. Photobiol. 14, 113–134. doi: 10.1111/j.1751-1097.1971.tb06157.x
Lechtenfeld, O. J., Kattner, G., Flerus, R., Mccallister, S. L., Schmitt-Kopplin, P., and Koch, B. P. (2014). Molecular transformation and degradation of refractory dissolved organic matter in the Atlantic and Southern Ocean. Geochim. Cosmochim. Acta 126, 321–337. doi: 10.1016/j.gca.2013.11.009
Lønborg, C., Yokokawa, T., Herndl, G. J., and Antón Álvarez-Salgado, X. (2015). Production and degradation of fluorescent dissolved organic matter in surface waters of the eastern north Atlantic ocean. Deep Sea Res. I Oceanogr. Res Papers 96, 28–37. doi: 10.1016/j.dsr.2014.11.001
Lundeen, R. A., Janssen, E. M. L., Chu, C., and Mcneill, K. (2014). Environmental photochemistry of Amino Acids, Peptides and Proteins. CHIMIA Int. J. Chem. 68, 812–817. doi: 10.2533/chimia.2014.812
McNally, A. M., Moody, E. C., and Mcneill, K. (2005). Kinetics and mechanism of the sensitized photodegradation of lignin model compounds. Photochem. Photobiol. Sci. 4, 268–274. doi: 10.1039/b416956e
Medeiros, P. M., Seidel, M., Powers, L. C., Dittmar, T., Hansell, D. A., and Miller, W. L. (2015). Dissolved organic matter composition and photochemical transformations in the Northern North Pacific Ocean. Geophys. Res. Lett. 42, 863–870. doi: 10.1002/2014GL062663
Miller, W. L., and Zepp, R. G. (1995). Photochemical production of dissolved inorganic carbon from terrestrial organic matter: Significance to the oceanic organic carbon cycle. Geophys. Res. Lett. 22, 417–420. doi: 10.1029/94GL03344
Murphy, K. R., Stedmon, C. A., Graeber, D., and Bro, R. (2013). Fluorescence spectroscopy and multi-way techniques. PARAFAC. Anal. Methods 5, 6557–6566. doi: 10.1039/c3ay41160e
Nelson, N. B., and Siegel, D. A. (2013). “The global distribution and dynamics of chromophoric dissolved organic matter,” in Annual Review of Marine Science, Vol. 5, eds C. A. Carlson and S. J. Giovannoni (Palo Alto, CA: Annual Reviews), 447–476.
Rochelle-Newall, E. J., and Fisher, T. R. (2002). Production of chromophoric dissolved organic matter fluorescence in marine and estuarine environments: an investigation into the role of phytoplankton. Mar. Chem. 77, 7–21. doi: 10.1016/S0304-4203(01)00072-X
Roettgers, R., and Koch, B. P. (2012). Spectroscopic detection of a ubiquitous dissolved pigment degradation product in subsurface waters of the global ocean. Biogeosciences 9, 2585–2596. doi: 10.5194/bg-9-2585-2012
Romera-Castillo, C., Sarmento, H., Álvarez-Salgado, X. A., Gasol, J. M., and Marrasé, C. (2011). Net production and consumption of fluorescent colored dissolved organic matter by natural bacterial assemblages growing on marine phytoplankton exudates. Appl. Environ. Microbiol. 77, 7490–7498. doi: 10.1128/AEM.00200-11
Shank, G. C., Lee, R., Vahatalo, A., Zepp, R. G., and Bartels, E. (2010). Production of chromophoric dissolved organic matter from mangrove leaf litter and floating Sargassum colonies. Mar. Chem. 119, 172–181. doi: 10.1016/j.marchem.2010.02.002
Shimotori, K., Watanabe, K., and Hama, T. (2012). Fluorescence characteristics of humic-like fluorescent dissolved organic matter produced by various taxa of marine bacteria. Aquat. Microbial. Ecol. 65, 249–260. doi: 10.3354/ame01552
Sleighter, R. L., Cory, R. M., Kaplan, L. A., Abdulla, H. A. N., and Hatcher, P.G. (2014). A coupled geochemical and biogeochemical approach to characterize the bioreactivity of dissolved organic matter from a headwater stream. J. Geophys. Res. Biogeosci. 119, 1520–1537. doi: 10.1002/2013JG002600
Stedmon, C. A., and Bro, R. (2008). Characterizing dissolved organic matter fluorescence with parallel factor analysis: a tutorial. Limnol. Oceanogr. Methods 6, 572–579. doi: 10.4319/lom.2008.6.572
Stedmon, C. A., and Nelson, N. B. (2015). “The optical properties of DOM in the Ocean,” in Biogeochemistry of Marine Dissolved Organic Matter, eds D. A. Hansell and C. A. Carlson (New York, NY: Academic Press), 481–508.
Steinberg, D. K., Nelson, N. B., Carlson, C. A., and Prusak, A. (2004). Production of chromophoric dissolved organic matter (CDOM) in the open ocean by zooplankton and the colonial cyanobacterium Trichodesmium spp. Mar. Ecol. Prog. Ser. 267, 45–56. doi: 10.3354/meps267045
Stubbins, A., Lapierre, J.-F., Berggren, M., Prairie, Y., Dittmar, T., and Del Giorgio, P. (2014). What's in an EEM? Molecular signatures associated with dissolved organic fluorescence in boreal Canada. Environ. Sci. Technol. 48, 10598–10606. doi: 10.1021/es502086e
Stubbins, A., Spencer, R. G. M., Chen, H., Hatcher, P. G., Mopper, K., Hernes, P. J., et al. (2010). Illuminated darkness: Molecular signatures of Congo River dissolved organic matter and its photochemical alteration as revealed by ultrahigh precision mass spectrometry. Limnol. Oceanogr. 55, 1467–1477. doi: 10.4319/lo.2010.55.4.1467
Thorn, K. A., Younger, S. J., and Cox, L. G. (2010). Order of functionality loss during photodegradation of aquatic humic substances. J. Environ. Qual. 39, 1416–1428. doi: 10.2134/jeq2009.0408
Timko, S. A., Gonsior, M., and Cooper, W. J. (in press). Influence of pH on fluorescent dissolved organic matter photo-degradation. Water Res. doi: 10.1016/j.watres.2015.08.047
Tranvik, L. J., and Bertilsson, S. (2001). Contrasting effects of solar UV radiation on dissolved organic sources for bacterial growth. Ecol. Lett. 4, 458–463. doi: 10.1046/j.1461-0248.2001.00245.x
van Krevelen, D. W. (1950). Graphical-statistical method for the study of structure and reaction processes of coal. Fuel 29, 269–284.
Vione, D., Minella, M., Maurino, V., and Minero, C. (2014). Indirect photochemistry in sunlit surface waters: photoinduced production of reactive transient species. Chem. A Eur. J. 20, 10590–10606. doi: 10.1002/chem.201400413
Wang, Z., Cao, J., and Meng, F. (2015). Interactions between protein-like and humic-like components in dissolved organic matter revealed by fluorescence quenching. Water Res. 68, 404–413. doi: 10.1016/j.watres.2014.10.024
Yamashita, Y., and Tanoue, E. (2008). Production of bio-refractory fluorescent dissolved organic matter in the ocean interior. Nat. Geosci. 1, 579–582. doi: 10.1038/ngeo279
Yekta, S. S., Gonsior, M., Schmitt-Kopplin, P., and Svensson, B. H. (2012). Characterization of dissolved organic matter in full scale continuous stirred tank biogas reactors using ultrahigh resolution mass spectrometry: a qualitative overview. Environ. Sci. Technol. 46, 12711–12719. doi: 10.1021/es3024447
Keywords: marine dissolved organic matter, excitation emission matrix fluorescence, photodegradation, CDOM, PARAFAC
Citation: Timko SA, Maydanov A, Pittelli SL, Conte MH, Cooper WJ, Koch BP, Schmitt-Kopplin P and Gonsior M (2015) Depth-dependent photodegradation of marine dissolved organic matter. Front. Mar. Sci. 2:66. doi: 10.3389/fmars.2015.00066
Received: 03 July 2015; Accepted: 24 August 2015;
Published: 09 September 2015.
Edited by:
Christopher Osburn, North Carolina State University, USAReviewed by:
John Robert Helms, Old Dominion University, USAX. Antón Álvarez-Salgado, Consejo Superior de Investigaciones Científicas, Spain
Copyright © 2015 Timko, Maydanov, Pittelli, Conte, Cooper, Koch, Schmitt-Kopplin and Gonsior. This is an open-access article distributed under the terms of the Creative Commons Attribution License (CC BY). The use, distribution or reproduction in other forums is permitted, provided the original author(s) or licensor are credited and that the original publication in this journal is cited, in accordance with accepted academic practice. No use, distribution or reproduction is permitted which does not comply with these terms.
*Correspondence: Stephen A. Timko, Department of Civil and Environmental Engineering, University of California, Irvine, 808 Engineering Tower, Irvine, CA 92617, USA, stimko@uci.edu