A comparison of the 31 January–1 February 1953 and 5–6 December 2013 coastal flood events around the UK
 Matthew P. Wadey1*
  Ivan. D. Haigh1,2
  Robert J. Nicholls3 Jennifer M. Brown4 Kevin Horsburgh4 Ben Carroll5
  Shari L. Gallop1,6 Travis Mason7 Elizabeth Bradshaw8
- 1Ocean and Earth Science, National Oceanography Centre, University of Southampton, Southampton, UK
- 2School of Civil, Environmental and Mining Engineering and the UWA Oceans Institute, The University of Western Australia, Crawley, WA, Australia
- 3Faculty of Engineering and the Environment, University of Southampton, Southampton, UK
- 4National Oceanography Centre, Liverpool, UK
- 5ABP Marine Environmental Research Ltd, Southampton, UK
- 6Department of Environmental Sciences, Macquarie University, North Ryde, NSW, Australia
- 7Channel Coastal Observatory, National Oceanography Centre, Southampton, UK
- 8British Oceanographic Data Centre, National Oceanography Centre, Liverpool, UK
A North Sea storm surge during 31 January–1 February 1953 caused Northwest Europe's most severe coastal floods in living memory. This event killed more than 2000 people on the coasts of England, the Netherlands, and Belgium. In the UK, where this study focuses, this event was a pivotal influence for flood risk management. Subsequent progress included a national tide gauge network, a storm surge forecasting and warning service, and major defense upgrades such as the Thames Barrier. Almost 60-years later, on 5–6 December 2013 Storm “Xaver” generated a surge event of similar magnitude. This paper describes a detailed comparison of these two events in the UK in terms of: (1) the meteorological conditions; (2) the observed high sea levels; and (3) the coastal flooding and impacts. The 1953 storm had a more southerly track and generated bigger waves due to the north-northwesterly onshore winds off East Anglia. The 2013 storm had a more west-to-east path from the north Atlantic to Scandinavia. Consequently, the 1953 high waters were more extreme in the southern North Sea. However, the 2013 event coincided with larger astronomical tides, resulting in a larger spatial “footprint”. The extreme sea levels impacted communities on the west, east, and south coasts, with 2800 properties flooded during the 2013 event, compared to 24,000 properties (mainly between the Humber and Thames) in 1953. The 1953 floods remain a benchmark in the UK as an event which included failed defenses, damaged property and infrastructure and loss of life. Measures taken after 1953 greatly reduced the consequences of the 5–6 December 2013 storm. Continued monitoring of extreme sea levels and their consequences is important to inform a realistic perspective on future planning and resilience.
Introduction
Many regions around the world have suffered terrible losses from extreme sea levels and coastal floods. The last decade has witnessed two of the most costly natural disasters in US history: Hurricane Katrina in 2005 (Jonkman et al., 2009) and Hurricane Sandy in 2012 (Blake et al., 2013). Coastal flooding from these two events caused >1000 deaths. In May 2008 Cyclone Nargis crossed southern Myanmar, which generated a 5m high storm surge inundating >50 km inland, killing 130,000 people (Fritz et al., 2009; Lin et al., 2009). In November 2013, Typhoon Haiyan impacted the central Philippines, leaving nearly 8000 people dead, missing, or injured, and more than 1.1 million houses damaged or destroyed with most of the impacts caused by the storm surge (LeComte, 2014). Over the coming century, sea level rise (SLR) will allow extreme sea level events to occur more frequently (Haigh et al., 2010; Wahl et al., 2011), a situation potentially worsened by rapid coastal development (e.g., Neumann et al., 2015; Stevens et al., 2015). Therefore, monitoring and understanding coastal flood events is important to provide a perspective on future planning and resilience.
Northern Europe has a long history of severe coastal flooding (c.f. Lamb, 1991). The North Sea region is notorious for storm surges and coastal floods, and is adjacent to many low-lying hinterlands which contain highly populated urban areas, infrastructure, and agricultural land. The shallow bathymetry and narrower shape of the basin further south, allows storms from the North Atlantic to pile water up against the southern coastlines. All eight countries that border the North Sea have experienced repeated human and agricultural losses from the sea (Gönnert et al., 2001; Plüß et al., 2001; De Kraker, 2006). Coastal floods are documented to have killed 100,000 people in the UK in 1099, with large events and death tolls also in 1212, 1421, and 1446, 1468, 1539, 1552, and 1570 (Gönnert et al., 2001). Since 1900, storm surge damage along the East Coast of the UK occurred in 1901, 1906, 1944, 1953, 1976, 1978, 1983, 1993 (ABI, 2006), and 2007 (Horsburgh et al., 2008). Central London was last flooded by a storm surge (exacerbated by heavy river flow) on 7 January 1928, when a 1.5 m surge propagated up the Thames River killing 14 people (BBC, 2014a).
In the UK, the most severe coastal flood in living memory occurred during 31 January-1 February 1953, which killed 307 people along the east coast of England, 1836 people in the Netherlands, and up to 40 in Belgium (RMS, 2003; Baxter, 2005; Gerritsen, 2005; McRobie et al., 2005). There were also >250 boating-related deaths (Kelman, 2009), including 19 in Scotland (Hickey, 2001) and 133 in the sinking of the Princess Victoria ferry in the Irish Sea. These figures exclude deaths in the aftermath related to illness and stress. This flood event reinforced changes to risk management, embodied by the Delta Works programme in the Netherlands and the Thames Barrier and associated defenses in the UK, which has been operational since 1982. These defenses, forecasting, warning systems, and evacuation plans have been tested by several storm surges since 1953 (see Appendix 1), most notably during 5–6 December 2013 when Storm “Xaver” (also called “Bodil” or “Sven” in Scandinavia) impacted coastlines in Ireland, Scotland, Wales, northwest England, the North Sea, and the English Channel. This brought intense media coverage and prompted comparisons with 31 January-1 February 1953. It has been widely referred to as the “biggest North Sea surge for 60 years” (e.g., Harwood, 2013; BBC, 2014b).
The aim of this paper is to compare the coastal flood events of 31 January-1 February 1953 with 5–6 December 2013, with a focus on the UK. The main objectives are first to contrast the meteorological forcing; second to compare the high sea levels observed during both events, contrasting the tidal, surge, and mean sea level (MSL) components that combined to generate high water levels; and third to compare the coastal flooding and impact, and discuss the role of the improved flood defenses and storm surge forecasting since 1953. Before the early 1990s, tide gauges (and a high quality sea level record) covered much less of the UK's coastline; hence part of the motivation of this paper was to gather data so that the 1953 floods could be sufficiently represented in a new UK database of coastal flood events described by Haigh et al. (2015). This follows a recent detailed assessment of water levels and geomorphological impacts in the North Sea during the December 2013 event by Spencer et al. (2015), reminiscent of Steers (1953)—which was a key publication following the 1953 event.
The structure of the paper is as follows: to next describe the data sources and the methodology, then the three objectives are addressed by comparison of the meteorological conditions, comparison of observed high waters, and comparison of coastal flooding and impacts, respectively. A discussion of the key findings, along with conclusions are given in the discussion and conclusions.
Data and Methods
The first objective was to compare the meteorological conditions of both events. This was primarily assessed by using MSL pressure and wind fields from the twentieth century Reanalysis, Version 2 (Compo et al., 2011). These meteorological fields are available every 6 h and have a horizontal resolution of 2° and were downloaded from the reanalysis web page (http://www.esrl.noaa.gov/psd/data/gridded/data.20thC_ReanV2.html). An interactive MATLAB® interface was used, developed by Haigh et al. (2015), to digitize the track of each storm, starting from when the low-pressure systems developed, until when the storms dissipated or moved beyond latitude 20°E. Different disciplines capture storm tracks in different ways. For this analysis the storm tracks were captured by selecting the grid point of lowest atmospheric pressure at each 6-h time step (Figures 1, 2). From the start to the end of the storm, we recorded the 6-hourly: (1) time; (2) latitude and (3) longitude of the minimum atmospheric pressure cell; and (4) the minimum mean sea level pressure.
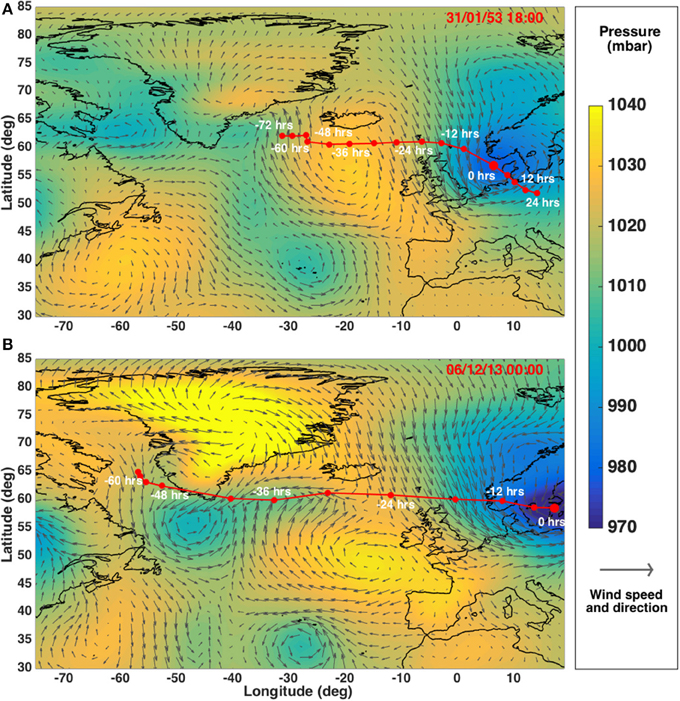
Figure 1. (A) Synopses of storm track and wind-field for the 31 January–1 February 1953 storm, and (B) the 5–6 December 2013 storm.
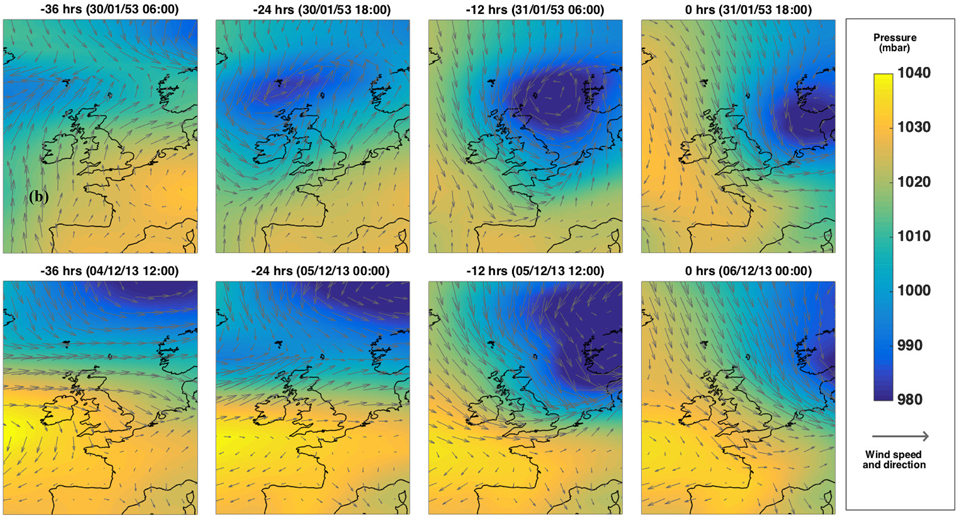
Figure 2. Closer view of 12-hourly wind and pressure in the 1953 and 2013 events (0 h is nearest pressure-wind reading to the time of the largest return period HW of each event in the UK Class A tide gauge database).
To compare water levels during both events, the second objective, a variety of data sources were utilized. The main data source for the 5–6 December 2013 event were 15-minute sea level time series from 39 of the UK's national “Class A” tide gauge sites. This network is managed by the National Oceanography Centre (NOC) and is owned and funded by the Environment Agency (EA). Quality controlled data from this network were downloaded from the British Oceanographic Data Centre (BODC; www.bodc.ac.uk). Time series from a further three east coast gauges (Scarborough, Herne Bay, and Deal Pier) and six south coast gauge sites (Arun, Sandown, Lymington, Swanage, West Bay Harbour, Teignmouth) were downloaded from the Channel Coastal Observatory (www.channelcoast.org). These record sea level every 10-minutes. Datasets from two additional tide gauges on the south coast (Southampton Dock Head and Calshot), and six on the northeast coast (Spurn Head, King George Dock, Grimsby, Blacktoft, Brough, South Ferriby) were obtained from Associated British Ports (ABP).
A direct comparison of 2013 water levels with the 1953 event is difficult due to a lack of 1953 data. In 1953 there was not a national tide gauge network, and high frequency time series of sea level were recorded on paper charts (many of which have been lost or not yet digitized) rather than digitally. In addition, several tide gauges failed during the storm. Only four national tide gauges (Newlyn, Immingham, North Shields, and Aberdeen) are available to directly compare between 1953 and 2013 (Table 1). Therefore, to compare sea levels during both events, data was gathered from several other sources (listed in Table 2) at multiple coastal locations (shown in Figure 3).
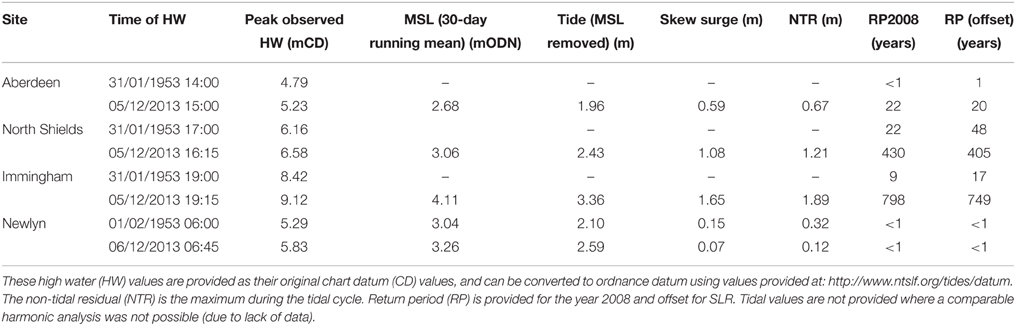
Table 1. Sites with tide gauge data from the BODC for 1953 and 2013.
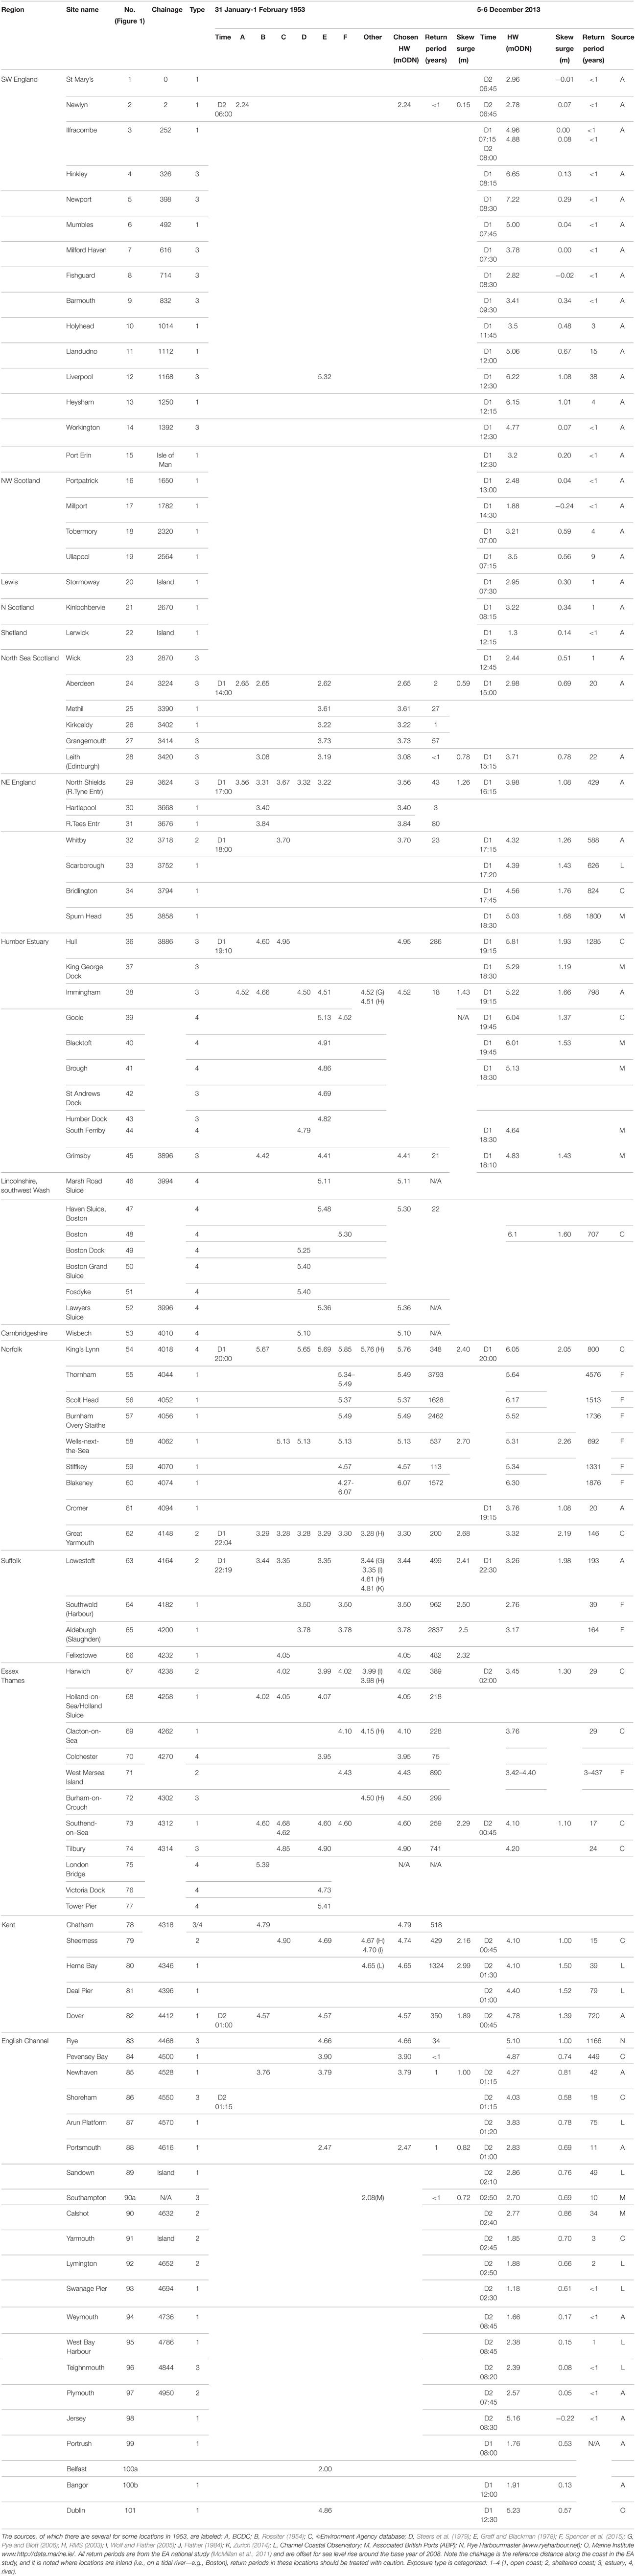
Table 2. High water (sea level) data for the 31 January–1 February 1953 and 5–6 December 2013 events.
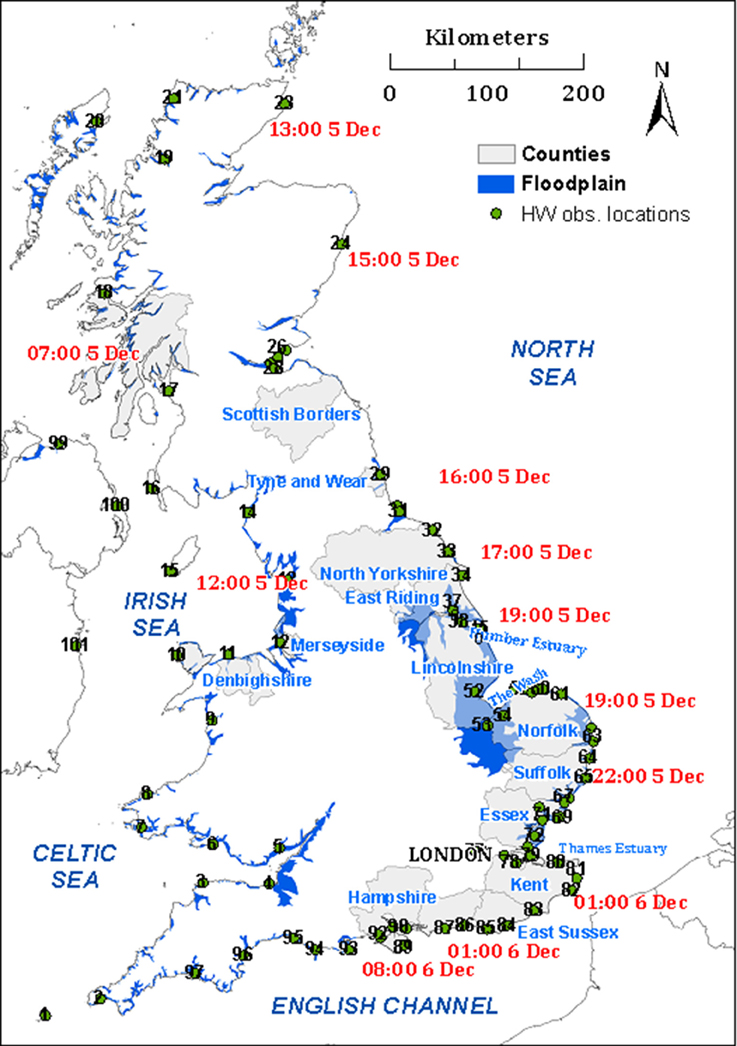
Figure 3. Map of UK counties referred to throughout the paper. Also shown are the locations of HW recordings (refer to Table 2 for site names and data sources), and timings of HW during 5–6 December 2013 (which were similar to the timing of the HWs of 31 January-1 February 1953). The background blue shaded area is land surface that is below a static extreme water level (approximately 1 in 200 years), and which without defenses is theoretically susceptible to coastal inundation.
A well-known source of sea levels for the 1953 event is Rossiter (1954), who tabulated hourly time series over the 7-day period centered around 31 January 1953. This covered 15 UK gauges between Aberdeen and Newhaven, and single measurements at three other locations (Lowestoft, Great Yarmouth, and Southend). Single high water (HW) level values at many stations recorded during the 1953 event are also held by the EA and are available in reports accessible online (e.g., Johnson, 2014). In addition, a database of the annual highest observed sea levels around the coast of Great Britain was used, obtained from tide gauges and tide registers. This was collated by Graff and Blackman (1978), who expanded the earlier data collation of Suthons (1963) and Lennon (1963). This source is only used if other measurements are unavailable, and it is assumed that the 1953 maxima are likely to represent the 31 January-1 February event (on the east and southeastern coasts). Other sources have already compiled data of the 1953 event, including Steers et al. (1979), Flather (1984), RMS (2003), and Wolf and Flather (2005). Furthermore, Spencer et al. (2014, 2015) recently compiled sea levels for the 2013 event, which are especially detailed in North Norfolk and Suffolk—we use 17 of these from Spencer et al. (2015) where corresponding values for 1953 are also provided.
This improved collation of sea level records for the 1953 event, highlights that some of the values quoted for the same sites (but from different sources) do not always agree. Examples include Great Yarmouth, where there are six mentions of HW, the maximum, and minimum varying by 0.02 m; whereas at North Shields the five sources vary by up to 0.43 m. The reason for the difference between values (taken from different sources) is not clear. Possible issues include datum conversion (e.g., from local chart to Ordnance Datum), rounding of decimals (e.g., from the datum conversion, or imperial to metric conversion), and error in interpretation of the original chart values. Where there is more than one value for any given site, it is stated (in Table 2) which value was selected for plotting (Figures 4, 5). This is based upon judgment about the most likely value, although it cannot be conclusively stated whether the “chosen” HW value is correct (therefore it is important to list all sources). The four BODC (Source “A”) values are considered the most reliable; otherwise the modal value (where more than two values were available) was used, and in some instances a mean value (e.g., at Sheerness). Where there are closely adjacent values in upper reaches of estuaries and rivers (e.g., the Humber, Boston etc.), a single representative value for plotting (Figures 4, 5) is applied.
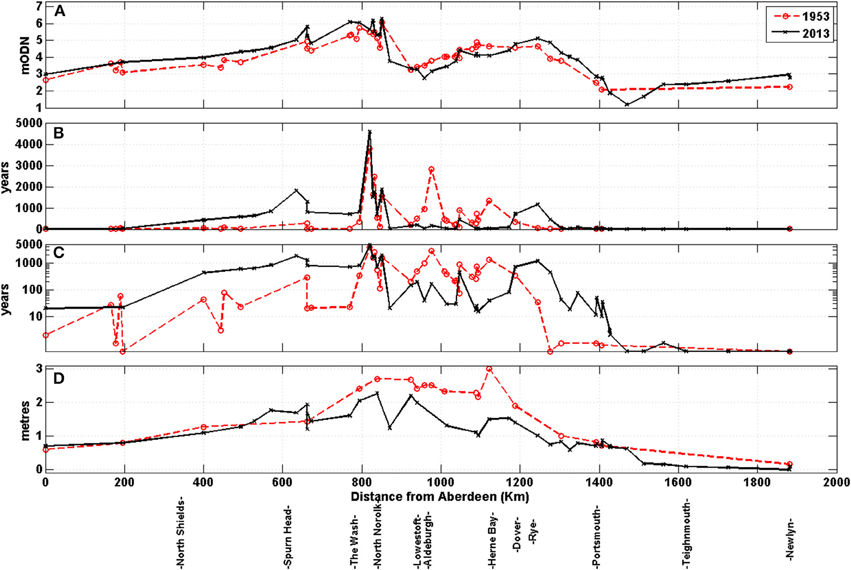
Figure 4. Line plot to compare the: (A) observed high waters; (B) return periods on a non-logarithmic y-scale and (C) on a logarithmic y-scale; and (D) skew surges of the 1953 and 2013 events in the North Sea.
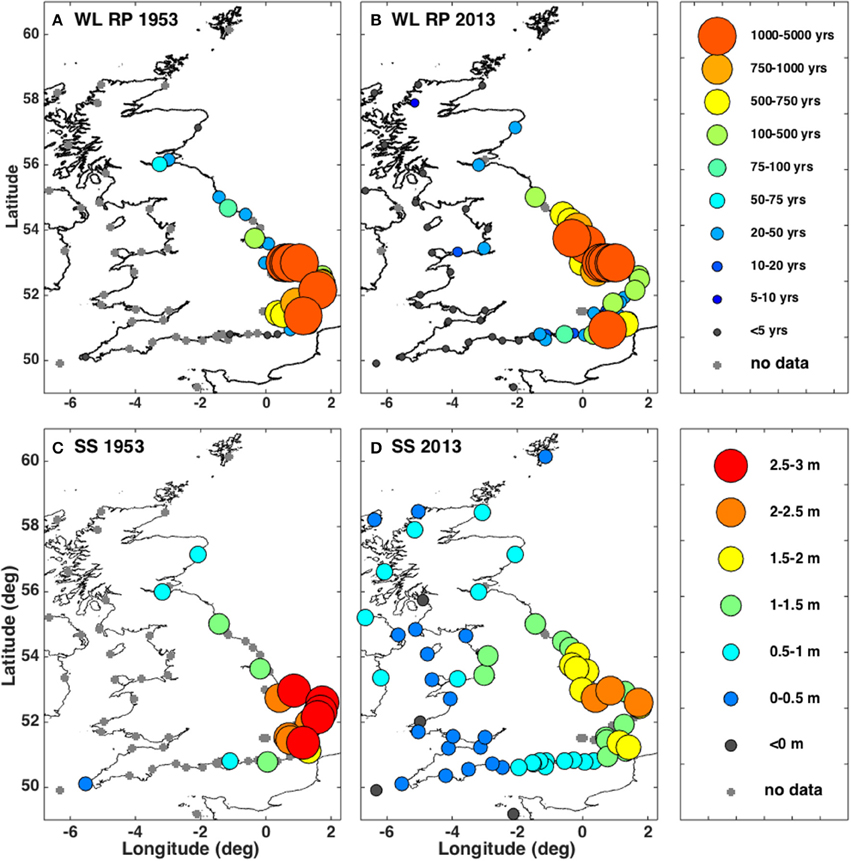
Figure 5. Return periods of (A) 1953 and (B) 2013; and skew surge heights during (C) 1953 and (D) 2013 events. Note the return periods are offset for SLR in both events.
Where high frequency time series longer than a month of data are available, sea levels were separated into the main component parts of tide, non-tidal residual (usually mostly surge) and MSL (Pugh, 1987); as described in Wadey et al. (2014). Where possible when comparing residuals we refer to the “skew surge,” i.e., the peak observed HW minus the peak tidal HW (de Vries et al., 1995; Horsburgh and Wilson, 2007). For most of the 1953 HW recordings, there is not enough data available for a comparative tidal analysis. This is because the data is a single HW value, or in the case of Rossiter (1954), a 7-day time-series. Hence the focus here is on the high waters (HWs), although we assembled predicted tide and surge heights (quoted) from a range of existing sources to allow for a basic comparison of the contribution of the respective sea level components to the total HW levels. All time refers to Greenwich Mean Time (GMT), and (with the exception of Table 1) elevations are metres above Ordnance Datum Newlyn (mODN)—the UK's principle national elevation benchmark, which is approximately MSL at Newlyn Cornwall 1915–1921.
Each HW was assigned a return period value using the latest Environment Agency (EA) national extreme value statistics (McMillan et al., 2011; Batstone et al., 2013), which are relative to a baseline MSL (year 2008). The rate of mean SLR at the UK's longest tide gauge record at Newlyn, Cornwall (which traverses the years 1953 and 2013) has a linear rate of 1.81 mm/year (Wadey et al., 2014). This suggests that MSL in December 2013 was 0.11 m higher than it would have been in January 1953. Therefore, return periods are discussed with reference to both the EA's 2008 values and also to the offset sea level (to give a better indication of the return period water level in 1953). An improvement in future work would be to offset return periods in context with regionally variable SLR (e.g., due to vertical land movement, c.f. Shennan and Horton, 2002; Bradley et al., 2009). Caution is advised where we have associated the EA's open coast return period levels with HWs recorded in estuaries and rivers (particularly where highlighted by location type “4” in the fifth column of Table 2), since these were generated for open coast conditions.
It is emphasized that the scope of this paper is to provide only a basic synthesis of the impacts (for the third objective). For 1953, several key sources provided details of the impacts along the east coast, notably Steers (1953) who surveyed the damage and described meteorological conditions, flooding, and erosion impacts. Other detailed accounts of the human losses are provided by Pollard (1978) and Summers (1978) and in Essex (which was one of the worst-hit areas) by Grieve (1959). The human impact is also captured by Baxter (2005). Kelman (2009) provides possibly the most detailed itemization of the fatalities in the UK. In the case of the 2013 event, media reports, and literature continue to emerge about the 2013 event in the form of reports (e.g., ABPmer, 2014; EA, 2014a) and peer-reviewed research (Sibley et al., 2015; Spencer et al., 2015).
Comparison of the Meteorological Conditions
The first objective is to compare the meteorological forcing during both events. Both storms, as noted by Spencer et al. (2015), fit a “SE tracking” category, of the three types of North Sea synoptic storm climatology defined by Muir Wood et al. (2005). Such storms are characterized by an intensifying circulation moving in a south-easterly direction around a high pressure system located to the west of Ireland, causing high winds over the western North Sea which later becomes directed southward. The rate of movement of the storm center is significant to the duration of the wind blowing over the sea surface, which is important for the growth of waves and surge: the development of the 2013 event was much quicker than the 1953 event (Sibley et al., 2015). The distinct characteristics of each storm affected the extremity of HWs, waves, and flooding observed in 1953 and 2013.
The 1953 storm developed to the southeast of Greenland on 28 January and moved eastwards, crossing Scotland to the north, before traveling in a south-eastward path across the North Sea and into Germany (Figure 1A). The track of the depression from the Atlantic over the north of Scotland into the North Sea, and the accompanying movement of the high-pressure system behind it, meant that powerful northerly winds swept down the eastern UK coast and the western part of the North Sea. The central pressure of the storm over the northern North Sea dropped to 964 mbars at 06:00–12:00 on 31 January (MetOffice, 2014a) (having been at 1004 mbar at 12:00 on 29 January) (Steers, 1953). At 18:00 on 31 January when the storm's effects at the coast were becoming apparent, very strong northerly winds were generated over the North Sea, attributable to interaction with the high pressure (anticyclone) to the west of the UK (Figure 2A). On 31 January 1953 at Costal Hill, Orkney, wind gusts of up to 110 knots [204 km h−1] were recorded, and 60 knot [111 km h−1] wind speeds in Aberdeenshire (Wolf and Flather, 2005); whilst the highest recorded 10-min mean wind speed at Stonehaven, Scotland was 65 knots [120 km h−1] from a northwest direction (Hickey, 2001).
In the 2013 event, Storm “Xaver” developed off the coast of Greenland on 4 December, enhanced by another low pressure system located over the Norwegian Sea (Figure 1). It progressively deepened as it tracked across the north of Scotland and Northern Europe on 4–5 December; and on 5 December the eastward track developed a south-easterly component as the system moved around the area of high pressure to the west of Ireland. The damaging effects of winds were notable from 08:00, 5 December in Scotland, blowing debris onto railway tracks and closing train services, and killing a lorry driver in West Lothian. High winds continued into the early afternoon, with incidences of wave overtopping (and localized flooding) on the west coast. On the east coast of England, maximum wind speeds were recorded during the afternoon to early evening—which, as described later, is significant with regard to the timing of the HWs. For example along the coast of Suffolk during the 2013 event, the maximum wind gusts (56 km h−1) were reached before 18:00 on 5 December, about 4 h before HW—by which time the wind direction was also more north-easterly and slightly offshore (Figure 2B). On 5–6 December the storm moved across southern parts of Norway and Sweden (Figure 1); with the lowest area of central pressure of 960 mbar over the area of maximum intensity in the Baltic Sea, and as low as 959 mbar over southern Sweden (Mills et al., 2013). On 5 December 2013, wind had gusted widely at 60–70 knots [111–130 km h−1] across Scotland, with Altnaharra (Sutherland) recording a gust of 81 knots [150 km h−1]. The mountain station at Aonach Mor (at an elevation of 1130 m) recorded a gust of 123 knots [228 km h−1]. Gusts also exceeded 60 knots [111 km h−1] along North Sea and Irish Sea coasts and over 70 knots [130 km h−1] in the Western Isles.
The maximum wind speeds recorded at weather stations in Scotland during the 1953 and 2013 storms were similar—both storms generated extreme peak wind speeds. However, as shown in Figure 1A, the passage of the 1953 storm track from Ireland into Europe was exceptionally slow taking 24 h to reach the coast off the Netherlands. The 2013 storm took approximately half this time to reach the same longitude. In regard to the 1953 event, Steers (1953) remarked that: “the great damage to forests in north-eastern Scotland in itself implies something quite exceptional” (similar damages were not reported for 2013). In the southern North Sea basin, compared to 2013, the 1953 wind speeds were stronger and more sustained across the North Sea during the 1953 event, hence increasing the wave heights and the likelihood of coincidence of the peak storm conditions with high tide. The 2013 storm track was similar to that of 1953 in its approach to northeast Scotland (Figure 1). However, the 1953 storm tracked southwards into the Netherlands, whereas the 2013 storm continued along a more eastward trajectory over Scandinavia. This meant that on the night of the 31 January 1953, the low pressure system and winds were more pronounced in the southern North Sea—strong winds (and waves) focused upon shorelines from Yorkshire to the Thames, close in time to the peak of the high water levels. The 1953 storm track allowed for a north-south elongated wind field over the North Sea, increasing wave fetch and surge generating winds. The 1953 storm center also moved relatively slowly toward the southern North Sea, steadily increasing the duration of northerly gales and worsening sea conditions that impacted N-NE facing coasts (Flather, 1984).
In summary, while there are similarities in weather conditions during both storms, there are also key differences, such as the more southerly track over the North Sea during 1953. Steers (1953) described the noon forecast issued on 31 January: “All districts will have gale force winds, severe in many places, and squally showers, mainly of hail, or snow. Considerable snowfall may occur over high ground. Thunderstorms will occur here and there. It will be cold.” Notable was the lack of emphasis upon coastal flooding. The disastrous surge of 1953 was predicted by the Met Office and the Dutch Surge Warning Service; although systems for warning the public were not effective, and there was a lack of preparation. In contrast, before the 2013 event, a surge ensemble forecast was generated and disseminated as flood warnings. This forecast performed well, indicating a “low risk” of a high impact event 7 days in advance. By 5–6 days ahead of the event, a “significant risk” of an unusually dangerous period of surge activity (when combined with high tides) was forecast (Sibley et al., 2015). Subsequently, the Flood Forecasting Centre was able to pass briefings to the EA on 1 December, and on 5 December a COBRA (Cabinet Office Briefing Room A) meeting occurred reflecting the highest level of preparation in the UK for a potential regional or national disaster.
Comparison of Observed High Waters
The second objective was to compare the HW observations around the UK coast during both events, and contrast the relative tide, surge, and MSL contributions to the HWs and the respective return periods of these levels. A summary of HW values at sites around the UK is listed in Table 2. Due to the limited data for the 1953 event, the most accurate comparison of HWs is along the stretch of coastline from Aberdeen in Scotland to Newhaven in the English Channel. The HW levels listed in Table 2 for different sites are plotted in Figure 4A against the distance along the coast from Aberdeen (“chainage”). The chainage values align with the Environment Agency's 2 km-spaced points each of which is associated with extreme sea level statistics (McMillan et al., 2011; Batstone et al., 2013), which are later used to discuss return periods of each event. A comparison of the HW return periods and the size of the skew surges are illustrated in Figures 4, 5 using line and dot plots, respectively.
Overview of High Water Elevations around the UK
A first key difference between the events, evident by considering the values listed in Table 2 and plotted in Figures 4, 5, was that the 1953 HWs were smaller on the northeast and south coasts, compared to December 2013. It can be inferred that the 5–6 December 2013 event also resulted in larger and more extreme HWs in Wales and northwest England, although there is a lack of data on the west coast for the 1953 event. As noted in Section Comparison of Coastal Flooding and Impacts (and Appendix 2), there are no reports of flooding for areas other than the east coast during the 1953 event. The levels available in the Graff and Blackman (1978) database suggest that the 2013 event was larger on the west coast: the maximum HWs for the year 1953 at Liverpool and Dublin were smaller by 0.90 m and 0.37 m, respectively (than the HWs recorded at these sites on 5 December 2013). On the northeast coast of England, in Yorkshire to Lincolnshire, the 2013 HWs were, in places, more than half a meter larger than those of 1953. There were larger HWs during 31 January–1 February 1953 from Suffolk to Kent (Figure 4B), although in parts of Norfolk, Suffolk, and south Kent, HWs were similar between both events. In the Essex, Thames, and Kent region the 1953 HWs were, in places, more than half a meter higher than those of 2013. However, the 2013 HWs were larger from Dover (by approximately 0.2 m) and along the English Channel (in the order of half a meter beyond Dover to the far southwest) (Figure 4A).
High Water Timing and Extremes
Now, the timing of HW and the estimated return periods is considered, including a more detailed comparison of the HWs. The timing of HW is shown in Figure 3, and listed (where available) in Table 2. In December 2013, extreme HW events in UK coastal waters began at around 07:00 on 5 December, in northwest Scotland. This included 1 in 5 to 1 in 10 return period HWs at Tobermory and Ullapool. By early afternoon extreme HWs impacted Wales and Liverpool Bay. At Liverpool, the 2013 HW was approximately a 1 in 40 year return period. At 12:45 on 5 December 2013 at Wick in the North Sea, the HW was a 1 in 1 year return period, and reached Aberdeen by 15:00 as a 1 in 22 year return period. The 1953 HW at Aberdeen was 0.33 m smaller than 2013, although the 1953 record was not complete (Figure 7A) and Hickey (2001) suggested the possibility that the peak was underestimated. At Leith (north Edinburgh) 140 km further south, 2013's HW was up to 0.63 m larger than in 1953, but again there is doubt over the reliability of the 1953 level which Rossiter (1954) “treated with some reserve.” An hour later, HW reached 200 km further south at North Shields (River Tees Entrance): the 2013 HW was 0.42 m larger than in 1953 and 100 km further south on the Yorkshire coast, the Whitby HW of 2013 was over 0.6 m higher than it had been in 1953. Further, south, the HW at Immingham in the Humber Estuary, occurred at approximately 19:00, with the 2013 HW exceeding the 1953 HW by as much as 0.7 m.
At the same time as water levels peaked in the Humber, HW was also occurring 100 km away in North Norfolk where Stoddard (2014) described that 2013 HWs were at least equal to and probably greater than the 1953 HWs. The HWs on this part of the coast were extreme in both events: at Wells almost a 1 in 700 year return period in 2013, and over 1 in 500 year return period in 1953. Following the 2013 event, Spencer et al. (2014) surveyed over 250 reference points (e.g., water marks on buildings, erosional notching, debris lines) in North Norfolk. This confirmed that along this 45 km coastline the peak water levels of 5–6 December 2013 were comparable to, and in places higher, than 1953 flood levels; although with complex inter-site variability (e.g., due to a combination of still water level, wave run-up, bathymetry and geomorphic setting). The 2013 HW return period is an outlier at Cromer (northeast Norfolk) at only 1 in 25 years (a 1953 comparative measurement is unavailable). Swell waves have been known to cause underestimation of HW at this location, due to drawdown of air in the pneumatic tubing (UKCMF, 2013), and wave action beneath Cromer Pier rendered the tide gauge readings unsuitable for analysis of the 2013 event (Spencer et al., 2015).
HW took 3 h to travel 70 km from Cromer to Lowestoft (north Suffolk), where the 1953 HW was larger by 0.18 m. At King's Lynn, in the southern Wash and 7 km inland on the River Ouse, the 2013 HW exceeded the 1953 HW by almost 0.3 m and also exceeded the previous largest event of this region, on 11 January 1978 (Steers et al., 1979; Spencer et al., 2015). Further east at Wells-next-the-Sea, the 2013 HW was 0.18 m larger than in 1953. Nearer the Norfolk-Suffolk county border at Great Yarmouth (<20 km north of Lowestoft), the 2013 HW was only a few centimeters larger (0.02–0.05 m) than the 1953 HW.
To the south of Great Yarmouth, the 1953 HW was in most locations higher than it had been in 2013 (Figures 4B–D); with the exception in southern Suffolk at enclosed tidal locations, such as the Deben frontage in Waldringfield (60 km south of Lowestoft and several km inland on the tidal Deben) for which Whiting (2014) noted that the 2013 HW exceeded the 1953 HW. However, on the Suffolk open coast the 1953 HWs considerably exceeded those of 2013, by 0.74 m at Southwold and by 0.61 m at Aldeburgh, which in 1953 respectively reached return periods of almost 1000 and 3000 years. The time of HW at these locations was around 23:00 (in 1953 and 2013). Extreme HWs were recorded around the coastlines of Essex, Thames Estuary and Kent after midnight. On the Suffolk side of the county border (with Essex to the south) lies Felixstowe, and < 5 km further south (in Essex) is Harwich. The 1953 HW at Felixstowe was 0.6 m larger than the 2013 HW at Harwich (the nearest site for comparison in this area). The 2013 HW did not exceed 1 in 30 years at Harwich, Clacton, and Tilbury (on the Thames outer estuary), although it may have been higher at West Mersea Island on the outer Blackwater estuary as suggested by an upper measurement surveyed by Spencer et al. (2015). At Felixstowe the 1953 HW was 1 in 500 years, and at Southend almost 1 in 300 years, and in excess of 1 in 700 years at Tilbury. The HW at 03:00 on the 6 December 2013 was the highest at the mouth of the Thames Estuary since construction of the Thames Barrier was completed in 1982 (Reeder, 2013), but was not as large as the HW in 1953, as shown by the 0.6–0.7 m higher values (than of 2013) recorded at Sheerness and Tilbury. In 1953, the surge propagated upstream and came level with the Chelsea Embankment, nearly flooding central London (RMS, 2003). On the Thames, the December 2013 surge did not propagate beyond Greenwich, due to closure of the Thames Barrier, although caused a 2 m difference in water height between the front and back of the barrier, which remained closed for 2 days (Insurance Journal, 2013; The Actuary, 2013). At Herne Bay on the north side of the Kent peninsula, the 1953 HW was 0.69 m larger than the 2013 HW (Figure 7D) and >1 in 1000 year return period. Further south at Dover, the 2013 HW exceeded the 1953 HW by over 0.2 m and was almost a 700 year return period—although the 1953 HW event was also extreme (a 1 in 350 year return period).
On the second day of each event (1 February 1953 and 6 December 2013) extreme HWs occurred in the eastern English Channel. At Rye Harbor, 45 km southwest of Dover, the 2013 HW was 1 in 1000 years and larger than the 1953 HW by 0.44 m. At Newhaven, Sussex, 50 km east-southeast of Rye, the 2013 HW was a 1 in 40 year return period, and 0.48 m larger than HW in 1953 (Figure 7E). By 02:00 the HW was occurring 90 km further east of Newhaven, in the Solent. At Portsmouth the 2013 HW was 0.36 m larger than in 1953. Note that at Portsmouth and Rye, the 1953 HW levels are based on the assumption that the annual maxima for 1953 in the Graff and Blackman (1978) database is attributable to the 1953 event. At Portsmouth the 2013 HW was the second highest (since the record starts in 1961), with a skew surge component of almost 0.7 m. The furthest west that an extreme HW occurred in 2013 (related to the propagation of the North Sea surge) was a 1 in 1 year event at West Bay in Dorset, comprising a 0.15 m skew surge at 08:45 on 6 December—almost 18 h after HW at Aberdeen and 8 h after HW at Dover.
Reasons for High Water and Extremes Variation between Events
The 5–6 December 2013 event has been referred to as the biggest North Sea surge for 60 years (e.g., BBC, 2013i), although for this assessment it is important to differentiate the terms “surge” and “high water”—the former refers to a meteorological component of sea level, the latter is the total observed sea level height. Both events comprised large storm surges: the largest observed in 1953 was 3.9 m at Harlingen (Netherlands) (Wolf and Flather, 2005), whilst satellite images during the 2013 event detected peak residuals of up to 3.4 m, as part of the surge spanned 200 km into the North Sea (Mills et al., 2013).
The skew surges of the 1953 and 2013 events were of similar height in Scotland (0.6–0.7 m at Aberdeen) and northeast England, although with different timings of surge peak in relation to time of tidal HW. For example, the 2013 peak surge at North Shields and Immingham occurred 1–2 h before high tide; whereas the 1953 peak surge followed after high tide (Figures 7B,C). However, it was in the southern North Sea that the 1953 HWs exceeded those of 2013, especially along the open coast between Norfolk and Kent. This was due to the amplification of the surge, from the more southerly track of the 1953 storm and extreme winds which can effectively generate a larger surge across the shallower southern North Sea waters. One of the largest observed 2013 skew surges was 2 m at Lowestoft, which was exceeded by the 2.4 m skew surge of 1953. There were even larger 1953 skew surges of approximately 2.7 m at Great Yarmouth and 3 m at Herne Bay (whereas the 2013 skew surge at Herne Bay was less than half this size). This suggests that the 1953 skew surge was probably larger along >750 km of coast (in the southern North Sea and also as it propagated into the English Channel). However, the 2013 event coincided with a period of higher astronomical tide. This meant that the 1953 HWs exceeded the 2013 HWs over a much smaller area (approximately 200 km), because the tide played a greater role in determining extreme sea level heights outside of the surge-dominated southern North Sea basin. The higher tide during the 2013 event is, for example, apparent from the data at Newlyn (Table 1) where a harmonic analysis was undertaken using the observed time series. The 6 December 2013 morning high tide was 0.49 m larger than the equivalent 1 February 1953 tide. Tidal predictions suggested a similar order of difference between the two events at Immingham and North Shields.
Large storm surges from the North Sea are known to propagate through the Straits of Dover (Rossiter, 1954) and as far west as the Solent (Henderson and Webber, 1977; Haigh et al., 2004, 2010). In the 2013 event this surge transmission into the English Channel can be tracked by 15 observations (inclusive of Dover to Newlyn): the skew surge amplitude remains quite large even as far as Swanage (Dorset) at 0.6 m, although is smaller at Weymouth (0.17 m), and in the far southwest 0.07 m at Newlyn (with a 0.12 m maximum non-tidal residual in the same tidal cycle). For the 1953 event, observations are unavailable between Portsmouth and Newlyn, although at each of these sites the surge was larger than in 2013. At Newlyn the skew surge and maximum non-tidal residual were 0.15 m and 0.32 m, respectively (0.08 m and 0.2 m larger than those that occurred in 2013), (Table 1 and Figure 7F).
Comparison of Coastal Flooding and Impacts
The third and final objective was to compare the coastal flooding and impact of both events. We reiterate that this is not a comprehensive analysis, but gives a snapshot of impacts in each region.
A simplified summary of impacts is provided in Figures 6A,B, and Appendix 2 (Supplementary Materials) where the references provided contain more detail. An important difference between the events is highlighted by the fact that flood impacts in 1953 are primarily measured by loss of life (affecting Lincolnshire to the Thames), whilst in 2013 impacts are measured by property flooding (from Wales, clockwise around the coast to Hampshire). The 1953 floods affected over 1600 km of the east coast and inundated 647 km2 of land (Steers, 1953; RMS, 2003). Flood defenses are known to have breached at about 1200 locations during the 1953 event (RMS, 2003), where breach refers to structural failures that generally cause the fastest rising water levels and most prolonged flooding (c.f. Muir Wood and Bateman, 2005). There were over 307 deaths, and 24,000 damaged houses (of which 500 were totally destroyed) and 200 industrial facilities damaged by floodwater (RMS, 2003). At a number of locations properties were subjected to the repeated entry of the tides for days to weeks as seawater continued to flow through breaches; although the huge repair and recovery operation meant that around 90% of the breaches in England were closed within a month (RMS, 2003).
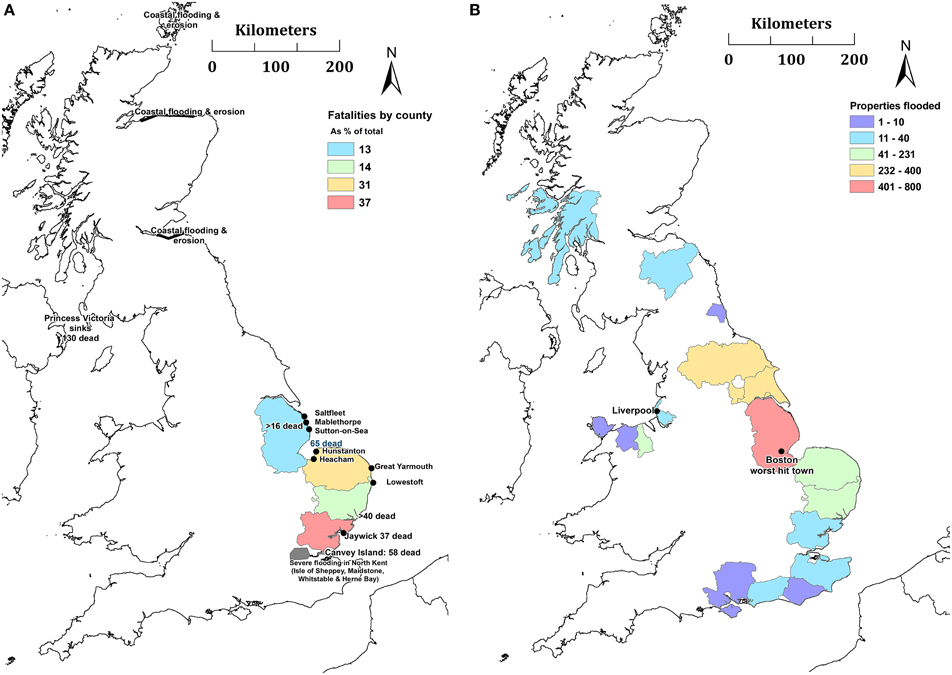
Figure 6. (A) Summary of the main impacts of 1953—based upon human fatalities. Fuller summaries can be found in Steers (1953), Baxter (2005), and Hickey (2001). (B) Summary of the main impacts of 2013, based upon properties affected by flooding.
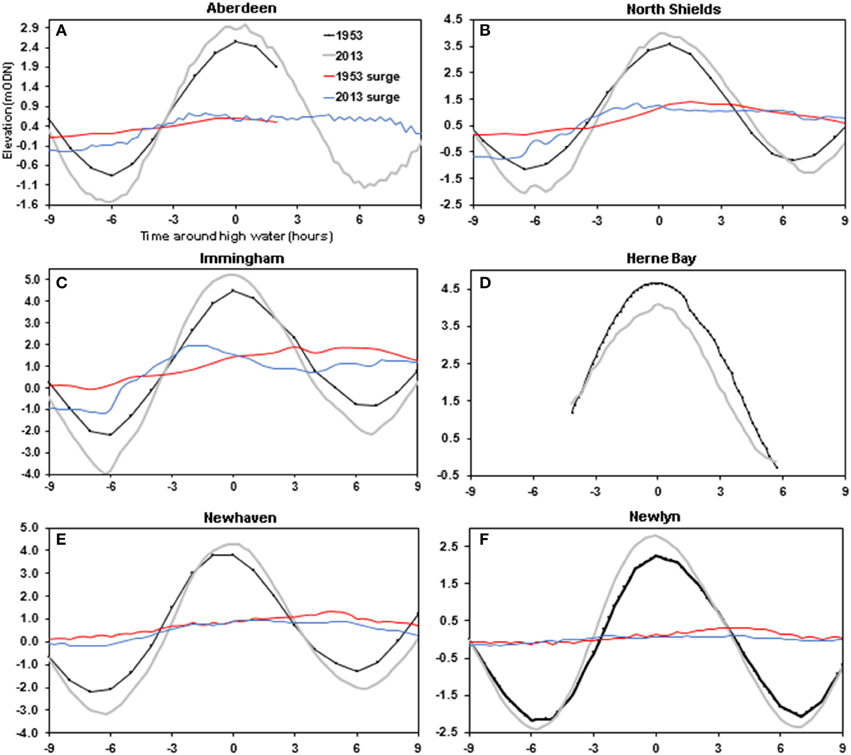
Figure 7. Selection of 1953 and 2013 sea level time series recorded and corresponding surge values at: (A) Aberdeen, (B) North Shields, (C) Immingham, (D) Herne Bay, (E) Newhaven, and (F) Newlyn; with 1953 sea level and surge represented by the black and red lines, and the 2013 sea level and surge represented by the gray and blue lines.
The December 2013 event killed 15 people in northwest Europe (Zurich, 2014), with no reported fatalities from the coastal floods. In the UK, the 2013 event's total flood extent is not quantified although the available estimates indicate this is dwarfed by 1953. It was generally acknowledged that defenses prevented much more serious losses (e.g., Zurich, 2014), although the total damage to the EA in December 2013 (for defense repairs and flood operations) was estimated to be in the range £44 million to £83 million (MetOffice, 2014b). Over 2800 properties were reported flooded (EA, 2014d), and an estimated 6800 ha [6.8 km2] of agricultural land (EA, 2014b). Land flooded behind overtopped and breached earthen barriers amounted to 480 ha [4.8 km2] in North Norfolk, and 660 ha [6.6 km2] in Suffolk (Spencer et al., 2015); and there was 2.4 km2 of flooding in East Riding, Yorkshire (ERYC, 2014).
In the 2013 event over 10,000 people were evacuated along the east coast, and 800,000 properties were protected by 2800 km of flood defenses (along the UK's coastline). Throughout Europe, insured losses were in the range of EUR 1.4–1.9 Billion, an aggregated figure for both wind damage and storm surge-related flooding (Zurich, 2014); and initial estimates for insured losses due to the floods in the UK were up to £100 million (Insurance Times, 2013), with some of the largest insurance claims attributable to business interruption, in addition to property damage claims (Artemis, 2013). Recent and comprehensive damage estimates are not publicly unavailable. We can generate a speculative approximation (for property damage cost) if assuming each of the 2800 properties flooded (Table 3) experienced somewhere between £10,000 and £30,000 damage (if flood depths are assumed as in the range 0.1–0.5 m, and values are taken from an average residential depth-damage curve by Penning-Rowsell et al., 2005). From this, 2013's coastal flooding property damage may have been in the range of £28–£84 million. The largest damages of the 2013 event occurred in northeast England and parts of Lincolnshire; whilst the hardest hit town was Boston, Lincolnshire (north of The Wash on the banks of the River Haven). This included flooding of 701 residential and 118 commercial properties, with almost £3 million damage to defenses, and £1 million damage to the Stump Church (EA, 2014a). The 1953 event in Boston did not cause severe damage or loss of life; whereas the 11–12 January 1978 event flooded 180 properties (due to a wall collapse, and had a larger HW than 1953 by 0.25 m) (Steers et al., 1979). The 2013 HW levels exceeded (by over half a meter) both the 1953 and 1978 events and caused more severe flooding.
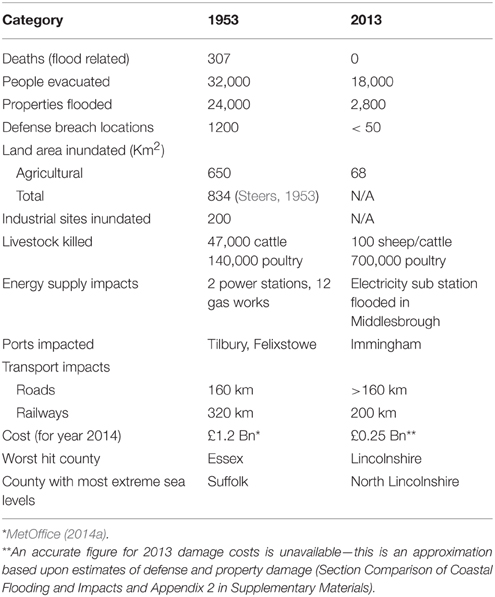
Table 3. Summary of the impacts during the 1953 and 2013 events in the UK, primarily from data compiled by the Environment Agency.
In 2013, there were numerous reports of roads affected by coastal flooding, and railway damage (e.g., Conwy Valley line, Lowestoft-Norwich, Lowestoft-Ipswich, and Brighton-Seaford) which caused disruption—for example in Sussex flooding occurred during the morning of 6 December (at peak commute times). Some communities and habitats on the east coast are in the process of recovering more than a year on from the event (e.g., BBC, 2014c,d; National Trust, 2014). Both events caused substantial coastal erosion (an issue which is discussed less in this paper than flooding). This includes morphological changes that were both permanent (e.g., cliff collapse) and temporary (e.g., over-wash of barriers, breaches which have since re-sealed). The 1953 storm was a prominent morphological event along the Suffolk coastline (Pye and Blott, 2006, 2009)—and comparisons of barrier retreat (Grove, 1953; Spencer et al., 2015) for Covehithe (Suffolk) and Scolt Head (Norfolk) suggest 1953 was more severe (in erosion terms) than 2013. More recently there has been the increasing availability of data and methods which allow for a detailed spatial analysis: Spencer et al. (2015) determined that the December 2013 event resulted in “a pulse of shoreline translation landwards equivalent to about 10 years of normal shoreline retreat.” In northeast, the higher 2013 HW (than 1953) caused greater coastal erosion and damage. For example, the 2013 event damage caused to Spurn Head (the iconic sand spit at the mouth of the Humber) was described as a site of “desolation” and for which a “new landscape” emerged (whilst Steers noted this area was not severely impacted in 1953) (Hull Daily Mail, 2013). In NW England, the 2013 impacts included dune frontage losses (4.5–12 m) along the Sefton shoreline in Liverpool Bay (Smith, 2014), and retreat of dunes in the order of 10 m in multiple locations in Wales (CNC/NRW, 2014b).
Off the west coast, storm conditions in the Irish Sea sank the Princess Victoria on the morning of 31 January 1953, killing 133 people (Jonkman and Kelman, 2005); although there are no reports of flooding in adjacent coastal areas. In contrast, during the better forecasted 2013 event there were no maritime disasters, but flooding hit coastal communities during the early afternoon on 5 December, on the north coast of Wales and the west coast of England. The town of Rhyl (North Wales) was severely impacted and over 400 people evacuated. In northwest England sea walls were overtopped and there were instances of flooding around Liverpool Bay. Further north there were also floods across Lancashire, notably in Blackpool, and Cumbria.
The 1953 storm had major impacts in Scotland, exacerbated by the post-war disrepair of defenses (Lamb, 1991; Hickey, 2001). Nineteen people died in boating-related incidents caused by the rough seas and more than 41 locations were affected by coastal flooding (Hickey, 2001). Impacts were felt along almost the entire coastline of mainland Scotland and as far north as the Orkney Isles—and Hickey (2001) concluded: “The storm of 31 January to 1 February 1953 is probably the most devastating to have affected Scotland over the last 500 years.” Coastal flooding mostly occurred in the Orkney Isles and NE Scotland. The 2013 storm also caused wind-related damages and coastal flooding—although most notably on the west coast for example in the town of Oban within Argyll and Bute.
In the northern regions of the English North Sea, coastal damage was reported in both 1953 and 2013, with flooding in Northumberland, Durham, and on the coasts of north-east Yorkshire. The 2013 event was here, in places, more severe than 1953. The Tyne catchment was affected by flooding in both events—although the effects are more pronounced in 2013 for the city of Newcastle, 15 km from the River Tyne Entrance where the HW was 1 in 400 years at North Shields. Further south at Sunderland on the River Wear there were incidences of flooding in 2013 (but no known flooding during 1953). In the Yorkshire town of Whitby the 2013 HW was half a meter higher than in 1953, and up to 200 properties were flooded in 2013 (whereas in 1953 there is only evidence of overtopping). In the Humber, following flood warnings throughout the day, water began to overtop defenses at Victoria Dock in Hull at 17:30, 5 December 2013 (Skinner, 2013). The city's flood barrier held, with 0.4 m to spare, although overtopping at other locations flooded 400 properties (HCC, 2014). The Port of Immingham flooded, with severe damage to the dock facilities (ABPmer, 2014). Locations along the tidal River Trent (connected to the Humber) were also flooded.
The county of Lincolnshire suffered 42 fatalities in 1953: towns from Cleethorpes and southwards were badly hit and it was reported that “the army took over” in what the press dubbed the “Lincolnshire Dunkirk.” Situated approximately 18 km from the North Sea on the River Nene in the Fens of Cambridgeshire, the town of Wisbech experienced flooding in both events, although more severely during 1953. In Norfolk the 1953 event killed over 100 people (80 of these fatalities were in north Norfolk) (Kelman, 2009), and ruined 3500 homes (BBC, 2003). In just one coastal section (Heacham and Downham Market) 40 km2 of land was flooded (Grove, 1953). The 2013 event inundated 150 properties and at least 4.8 km2 of land in north Norfolk (Spencer et al., 2015). Erosion and environmental impacts in 2013 were severe although not as dramatic as in 1953. Steers (1953) noted that “Along the coast of north Norfolk, from Old Hunstanton to Weybourne, the most obvious effect of the storm was the flooding of all the reclaimed marshes. The sea walls were overtopped, and breaches formed in most cases from the rear.” At King's Lynn, one-fifth of the town flooded in 1953, 1800 people were evacuated from their homes and there were 15 deaths—cars were picked up by the force of the floodwater and the streetlights of London Road “exploded” as the water rose, plunging the town into darkness as dead animals floated down the streets (Lynn Museum, n.d.). Along the cliffed coast of Norfolk, the 1953 event caused flooding and erosion, particularly the lower cliffs at Bacton and Walcott. Walcott was flooded in 2013, although more severely in 1953 when the town's main street was “destroyed, and many buildings wrecked” (Steers, 1953). Further south, at Great Yarmouth, 10 people were killed in 1953, and floods ruined 3500 homes (BBC, 2003); whereas in 2013 “a few” properties were flooded and 600 people were moved to an evacuation center (GYBC, 2014).
In Suffolk, as a result of the 1953 event there was “not a single estuary or valley that was not affected by the flooding” (Steers, 1953) and off the coast the Lowestoft trawler Guava sank, killing 11 men. On land 46 people were killed (drowned, shock, or exposure) and >20,000 acres of land were flooded (Suffolk Coastal, 2013). This included 41 deaths in Felixstowe due to the catastrophic collapse of flood walls on the Orwell Estuary. The resulting torrent of water flooded the south of the town, and at Langer (an estate of single story prefabricated houses), homes were washed away and occupants struggled to climb to safety on their roofs, and 30 died (Baxter, 2005). The 2013 event inundated 230 properties across the county, and the town of Lowestoft was flooded in both events (LL, 2014)—although more severely in 1953 (approximately 400 properties, compared to 100 in 2013). There were however no fatalities in Lowestoft from the 1953 flood (e.g., GNUK, 2013). In Essex the 1953 flood killed 120 people—impacts were much less in 2013 (40 properties flooded, no loss of life). Particularly high mortality rates occurred at Jaywick (36 of the 700 residents died) and Canvey Island (58 of 12,000 residents were killed), from a combination of drowning and exposure (including strokes, heart failure, and accidents) (Grieve, 1959; Baxter, 2005; Jonkman and Kelman, 2005). A further 889 flood casualties were admitted/treated at the local hospitals, and additional deaths of elderly (after the flood) are not recorded in the official figures (Baxter, 2005). In Harwich, seven people were killed as floodwater flowed into the town from three sides (HD, 2014), described as a “two meter high wall of rolling water” (ERO, 2013).
In the Thames region on 31 January-1 February 1953, flooding impacted Tilbury to London's docklands. Oil refineries, factories, cement works, gasworks, and electricity generating stations were flooded and brought to a standstill. In London's East End, 100 yards [91 m] of sea wall collapsed, causing more than 1130 houses to be flooded killing one person at Tidal Basin (Taylor, 2011) and 640,000 m3 of Thames water to flow into the streets of West Ham (MetOffice, 2014b). Floods impacted the BP oil refinery on the Isle of Grain, and the Naval Dockyard at Sheerness. The 1953 HW did not quite overtop the Thames embankment and proceed to flood central London. In Kent, during 1953 more than 5000 acres [20 km2] land was flooded, and thousands of livestock were drowned; whereas in 2013 the county did not experience as widespread flooding as was predicted (1000 homes in Sandwich, Seasalter, Faversham, and Medway were evacuated). There are no known incidences of the 1953 event causing flooding on English Channel coasts, which is in contrast to 2013. In Sussex homes, roads, railways, and Shoreham airport were inundated on the 6 December. Locations in West Sussex, Havant, Chichester, Isle of Wight, Hampshire, and the New Forest were flooded overnight, mainly those within the tidal reaches of rivers and harbors. Sea water covered roads and threatened properties as far along the English Channel as the city of Southampton (over 600 km along the coast from Lincolnshire, and 200 km west of Dover).
Discussion
The first objective was to compare the meteorological characteristics of the 1953 and 2013 events. Both were storm types known to produce dangerous surges over the North Sea; although as highlighted the 2013 event also produced extreme sea level conditions on the west coast (especially Liverpool Bay). On the east coast, the 1953 storm moved more slowly as it tracked toward the southern North Sea. This caused a more extreme sea surface response and higher HWs in the Anglia, Thames, and North Kent regions; whereas the 2013 HW was more extreme to the north of Norfolk (and also outside of the North Sea). As noted by Flather (1984) the intensity, track, elongation, and slow speed, were all characteristics that made the 1953 storm capable of producing such severe wave and surge conditions in the southern North Sea.
The second objective, to compare high water levels, included a collation of sea levels at 100 observation locations around the UK. Both events generated extreme return period HWs—the 1953 HWs were larger than the 1 in 500 year return period at 23 locations, and the 2013 HWs were above this threshold at 18 locations. The extremity of some of the very large return periods (>1000 years) could be artifacts of the data length and analysis, although mostly are in locations where the meteorological conditions and local impacts are also documented as severe (e.g., North Norfolk in both events; Southwold, Aldeburgh, and Herne Bay in 1953; Spurn Head and Humber region in 2013). There was a difference in the spatial footprint of the events. The available data suggests that the 1953 extreme HWs began with a 1 in 2 year HW at Aberdeen, and moving south to a 1 in 1 year HW at Portsmouth. Muir Wood et al. (2005) remarked that the 1953 surge affected 1600 km of the coastline of eastern England. In addition to the east coast, the 2013 observations show that extreme HWs affected the west coast along two separate 350 km-long coastal segments: the four tide gauges from north Wales to Morecambe Bay (Holyhead, Llandudno, Liverpool, and Heysham) and four gauges in northwest Scotland (Tobermory, Ullapool, Stornoway, and Kinlochbervie). In-between these areas there were non-extreme HWs (at the Workington, Port Erin, Portpatrick, and Millport gauges on the coastline adjacent to the Isle of Man and Northern Island). The south coast footprint of 2013's extreme HWs was from Dover to West Bay, Dorset (a 1 in 1 year HW)—an almost 400 km coastal length. The larger spatial footprint of the 2013 extreme HWs highlights the significance of the astronomical tidal component. When it is a period of spring tides, then it will be spring tide mostly everywhere within the same cycle; whereas the extreme surge generation of 1953, as commented by Flather (1984), took place in a few areas of limited extent where the strongest winds and currents occurred in a favorable combination. In the southern North Sea, the 1953 surge was more than 1 m larger than the surge of 2013; whereas the tide of the 1953 event was in places approximately 0.5 m less than that of the 2013 event—due to the 2013 event occurring in the middle of the spring cycle, and being toward the peak of the 18.6 year lunar nodal cycle. Steers (1953) commented that (of the 1953 HW): “the surge did not occur at the top of the tide and, did not occur on a high spring tide: the predicted tides for January 31 were 1–3 feet [0.3–0.9 m] less (according to locality) than can occur at other times of the year.”
There are many further factors that caused the different incidences of flooding between the events and locations. Waves superimposed upon extreme HWs are a particularly critical factor: damage and overtopping can occur from the impacts of individual waves, and also from increased still water level. Wave setup can contribute to an increase in nearshore sea level of more than 10% of the deep water significant wave height (WMO, 1998). Spencer et al. (2015) compared numerical modeling of the 1953 event (Wolf and Flather, 2005) to the 2013 offshore wave observations; which suggested that significant waves heights in North Norfolk at Scolt Head and Cley would have been 2.2 m and 2.7 m in 2013, compared to 4.4 m and 5.5 m, respectively in 1953. The North Kent coastline is also orientated to have faced the persistent northerly winds that ensued at the time of the 1953 HW. Hence both surge and wave set-up could explain the extreme HW the return periods observed during the 1953 event at the exposed coasts of Suffolk (Southwold and Aldeburgh) and North Kent (Herne Bay). Furthermore, longer wave periods are also likely (during 1953's prolonged northerly gales) which would have further exacerbated run-up and flooding. Observers commented that the 2013 event would have been much worse in Norfolk and Suffolk given larger waves (e.g., Suffolk Coastal, 2013). As previously noted, localized effects (e.g., bathymetry combined with various nearshore storm-tide-wave processes) along this coastline can cause complex alongshore variations in HW (Lewis et al., 2013); as reflected in the surveys of Spencer et al. (2014, 2015).
In Liverpool Bay, the 2013 event comprised an ideal combination of conditions to cause coastal flooding, which included south-westerly winds that veered to the west, which also coincided with high tide (within the large tidal range of this region) (c.f. Brown et al., 2010). In other work, consideration of wave height and HW in a joint probability analysis at Liverpool vastly increased the event return period estimate (to >1 in 200 years), compared to considering water level alone; with the same analysis having the opposite effect in Suffolk (Wadey et al., 2015). The 2013 HWs were larger than 1953 HWs in several rivers and estuaries; for example, the Rivers Tyne and Humber, and also at Boston and King's Lynn. The tide and the storm track may be attributed to this; and in Suffolk there were some higher 2013 HWs along rivers (e.g., the Deben) which were in contrast to adjacent open coast areas (where 1953 HWs had been larger). Several aspects of these events warrant future work; for example the influence of (freshwater) river levels, since Steers (1953) commented how it was fortunate that the rivers (particularly those flowing through the fenlands—the marshy areas of eastern England) were not in flood, which would have resulted in extensive freshwater flooding. Given additional influences such as wave set-up and freshwater input, future joint-probability comparisons could consider additional variables to sea (tide-surge) level. It should also be noted that where there were hourly water level values (in the 1953 data) these are more likely to have underestimated maximum HW readings (whereas the tide gauges in 2013 provided readings of at least 15-minute resolution).
The linear MSL trend 1915–2014 at Newlyn suggests 0.11 m SLR from 1953 to 2013 (Wadey et al., 2014). The magnitude of the respective tide and surges of the events, and the effects of waves, make it awkward to infer what role that changes to MSL may have played in the 2013 flood event. However, in south coast areas where tidal range and surge heights are less extreme than on the west and east coasts, this may have important future implications. For example in the city of Southampton properties on low-lying, undefended areas of the River Itchen came with “several centimeters” of flooding (Taylor, 2013). As sea levels rise, future surges that propagate from the North Sea will be a growing threat, although the worst coastal impacts to the central and southwest English Channel coast result from south-westerly storms (since the accompanying extreme waves can overtop coastal defenses) (e.g., Wadey et al., 2013a,b; Palmer et al., 2014).
The starkest contrast between these events was the greater human impact of the 1953 floods, especially the large loss of life. Floods also inundated more land and were more prolonged, with the destruction of properties and damage (for many years) of large swathes of agricultural land. This is partly attributed to the complete lack of flood warnings, the poor state of coastal flood defenses, and vulnerable post-war (e.g., prefabricated) housing. The risk management responses to this event were pivotal in reduction of consequences in events since then, including in 2013.
Conclusions
This paper has described and compared the two most significant North Sea surge events to impact the UK over a 60-year period. This included descriptions of meteorological conditions, a collation of high water data at 100 locations, and an overview of flooding impacts.
The first objective, a comparison of the storms, utilized a wind and pressure field data set; and also revisited observations from previous studies. This highlights how both storms shared some similarities in the northern UK, but the 1953 storm tracked further south, in an unusually slow manner which caused extreme wave and surge setup in the southern North Sea. The nature of the 2013 storm's track over the west coast was also conducive to extreme sea levels in those regions, particularly in Liverpool Bay.
The second objective, the high water comparison, highlighted that both storms produced extreme sea levels, especially on the east coast. In 1953 these were dominated by the surge component, particularly in the southern North Sea. The 2013 event produced similar surge heights to 1953 in northeast England and towards Norfolk, but was also characterized by a large tidal component. In 2013 however, there was not such strong wind set-up in the southern North Sea. The 1953 data is too sparse for a definitive comparison with 2013 on the west coast and for much of the English Channel; although the available observations suggest that the 2013 event produced more extreme sea levels (than 1953) in northwest England and the English Channel. Both surges propagated eastwards at least as far as Newlyn, where 1953's surge was larger but the total HW was smaller (as a result of the larger tide in 2013). The assessment of floods also revealed complex spatial variations that we could not fully explain. For example the 1953 and 2013 floods were worse than one another for different areas in Scotland; whilst Spencer et al. (2014) observed detailed alongshore variability in Norfolk's coastal water levels. Localized effects (e.g., tide locking of rivers, high rainfall, local magnification of surge, wind direction, waves, resonant waves etc.) may be relevant for a more detailed comparison of events at some locations, and are areas for future research.
The third objective, to compare the consequences of each event, captured only a small but representative sample of the human (and other) impacts that occurred. Both events caused extensive flooding, with the worst impacts aligning quite closely with the locations of the most extreme HWs. The 31 January–1 February 1953 floods are well-known as the worst natural catastrophe to impact the UK in living memory. This was a consequence of the extremity of the surge and wave conditions, the lack of warnings and preparation, and the pre-existing state of the defenses. Floods severely impacted Scotland and the east coast from Lincolnshire to Kent, with highest loss of life in Essex. The 2013 floods also occurred mainly along the east coast, although particularly affecting regions further north (e.g., Humber and North Lincolnshire). However, 2013 was not just an east coast flood, with floods also in northwest England, Wales and on the south coast as far as the Solent—areas outside of the North Sea accounted for up to 20% of the national total of flooded properties.
The analysis here illustrates the value of tide and wave data to characterize and understand extreme coastal flood events. However, hourly records from many tide gauges have been lost or are inaccessible for the 1953 event, only single HW values remain. This lack of sea level time series is unfortunate, and limits the detail within the HW comparison. Furthermore, many of these values are accompanied by some uncertainty. Given the sparse data available for the 1953 event, it would be interesting in future work to generate comparative numerical simulations of the 1953 and 2013 events to further explore their different behavior, such as the high sea levels on the west coast. This would build on the earlier work such as Wolf and Flather (2005). Field collection of HW marks (Steers, 1953; Spencer et al., 2014, 2015) complement (and can compensate for) a lack of digital data. In related work, Haigh et al. (2015) have developed a UK database called SurgeWatch (http://www.surgewatch.org). This paper's collation of data about the 1953 event allows a comparison with other events such as the 2013 event, and is an integral part of the database. Similar analyses are happening elsewhere (e.g., Needham et al., 2015). This shows that it is important that coastal flood events are systematically monitored and understood. Such documentation of flood event characteristics, mechanisms and impacts can provide useful data for future flood planning, and education.
Conflict of Interest Statement
The authors declare that the research was conducted in the absence of any commercial or financial relationships that could be construed as a potential conflict of interest.
Acknowledgments
We thank the following for providing sea level data: the British Oceanographic Data Centre, National Tidal, and Sea Level Facility, Channel Coastal Observatory, Associated British Ports; and the Environment Agency (also for the sea level return periods). MW, IH, and JB's contributions to this paper were funded through the Engineering and Physical Science Research Council (EPSRC) Flood Memory Project (grant number EP/K013513/1).
Supplementary Material
The Supplementary Material for this article can be found online at: https://www.frontiersin.org/article/10.3389/fmars.2015.00084
References
ABI. (2006). Coastal Flood Risk – Thinking for Tomorrow, Acting Today. Summary report commissioned by the Association of British Insurers, caried out by by Entec in collaboration with Risk Management Solutions and Risk & Policy Analysts. Available online at: http://static1.1.sqspcdn.com/static/f/270724/1875611/1220367794127/abi_coastal_flooding_report.pdf?token=u6qVELwpoHYO6xSI99wr9agO0ww%3D (Accessed November 19, 2014).
ABPmer. (2014). Ensuring Flood Resilience: An overview of 5/6 December 2013 UK storm surge. Report: 1400/30. ABP Marine Environmental Research.
Artemis. (2013). Flood Defences Keep Windstorm Xaver Insured Losses Down. Available Online at: http://www.artemis.bm/blog/2013/12/11/flood-defences-keep-windstorm-xaver-insured-losses-down/ (Accessed July 14, 2015).
Bates, P. D., Dawson, R. J., Hall, J. W., Horritt, M. S., Nicholls, R. J., Wicks, J., et al. (2005). Simplified two-dimensional numerical modelling of coastal flooding and example applications. Coast. Eng. 52, 793–810. doi: 10.1016/j.coastaleng.2005.06.001
Batstone, C., Lawless, M., Tawn, J., Horsburgh, K., Blackman, D., McMillan, A., et al. (2013). A UK best-practice approach for extreme sea-level analysis along complex topographic coastlines. Ocean Eng. 71, 28–39. doi: 10.1016/j.oceaneng.2013.02.003
Baxter, P. J. (2005). The east coast Big Flood, 31 January–1 February 1953: a summary of the human disaster. Philos. Trans. R. Soc. 363, 1293–1312. doi: 10.1098/rsta.2005.1569
BBC. (2003). Norfolk Remembers the Floods of 1953 - 01 February 2003 1642 GMT. Available Online at: http://www.bbc.co.uk/norfolk/senseofplace/floods1953.shtml (Accessed November 19, 2014).
BBC. (2013a). 400 People Leave Homes in Rhyl After Flooding. 5 December 2013 Last Updated at 19:20 GMT. Available Online at: http://www.bbc.co.uk/news/uk-wales-25237781 (Accessed November 13, 2013).
BBC. (2013b). Flooding in New Brighton leaves cars and shops under water 5 December 2013 Last updated at 16:19. Available Online at: http://www.bbc.co.uk/news/uk-england-merseyside-25232665 (Accessed November 13, 2014).
BBC. (2013c). Newcastle Storms: Court Evacuated Over River Flooding 5 December 2013 Last Updated at 18:25. Available Online at: http://www.bbc.co.uk/news/uk-england-tyne-25231342 (Accessed November 13, 2014).
BBC. (2013d). Shoreham Airport Under Water After Tidal Surge. 6 December 2013 Last Updated at 18:52 GMT. Available Online at: http://www.bbc.co.uk/news/uk-england-sussex-25267611 (Accessed November 13, 2013).
BBC. (2013e). Tidal Surge: Homes in Whitby flooded 6 December 2013 Last updated at 14:05 GMT. Available Online at: http://www.bbc.co.uk/news/uk-25258150 (Accessed November 13, 2014).
BBC. (2013f). Flood of 1953: Memories from Kent. 30 January 2013. Available Online at: http://www.bbc.co.uk/news/uk-england-kent-21262231 (Accessed March 25, 2015).
BBC. (2013g). Flood of 1953: Protecting Kent from Another Surge. 31 January 2013. Available Online at: http://www.bbc.co.uk/news/uk-england-kent-21274713 (Accessed March, 2015).
BBC. (2013h). Norfolk Floods: Seven Hemsby Homes Badly Damaged by Waves. 6 December 2013. Available online at: http://www.bbc.co.uk/news/uk-england-norfolk-25254808 (Accessed April 22, 2015).
BBC. (2013i). Lethal Storm and Tidal Surge Sees Thousands Out of Homes. 6 December 2013. Available Online at: http://www.bbc.co.uk/news/uk-25220224 (Accessed April 22, 2015).
BBC. (2014a). The Great 1928 Flood of London. BBC News Magazine. Available Online at: http://www.bbc.co.uk/news/magazine-26153241 (Accessed February, 2014).
BBC. (2014b). 10 Key Moments of the UK Winter Storms, 17 February 2014. BBC News. Available Online at: http://www.bbc.co.uk/news/uk-26170904 (Accessed April, 22 2015).
BBC. (2014c). East Coast Storm Surge: What Happened Next? BBC News Norfolk. By Richard Haugh, 5 December 2014. Available Online at: http://www.bbc.co.uk/news/uk-england-norfolk-30183045 (Accessed May, 14 2015).
BBC. (2014d). Boston Floods: A Year on from the Tidal Surge. By Dave Wade BBC News, East Midlands. Available Online at: http://www.bbc.co.uk/news/uk-england-lincolnshire-30225852 (Accessed May, 14 2015).
Berwickshire News. (2013). VIDEO: Storm Hits Eyemouth Harbour, by Simon Duke. Available Online at: http://www.berwickshirenews.co.uk/news/local-news/all-local-news/video-storm-hits-eyemouth-harbour-1-3222261 (Accessed November, 13 2014).
Blake, E. S., Kimberlain, T. B., Berg, R. J., Cangialosi, J., and Beven, II, J. L. (2013). Tropical cyclone report: hurricane sandy. Nat. Hurric. Center 12, 1–10. Available online at: http://www.nhc.noaa.gov/data/tcr/AL182012_Sandy.pdf
Bradley, S. L., Milne, G. A., Teferle, F. N., Bingley, R. M., and Orliac, E. J. (2009). Glacial isostatic adjustment of the British Isles: new constraints from GPS measurements of crustal motion. Geophys. J. Int. 178, 14–22. doi: 10.1111/j.1365-246X.2008.04033.x
Brown, J. M., Souza, A. J., and Wolf, J. (2010). An investigation of recent decadal-scale storm events in the eastern Irish Sea. J. Geophys. Res. 115, C05018. doi: 10.1029/2009JC005662
Chronicle Live. (2013). Newcastle Quayside Flooded Following Tidal Surge Caused by Storm - 21:42, 5 December 2013. By Sarah Jeffery. Avaialble Online at: http://www.chroniclelive.co.uk/news/north-east-news/newcastle-quayside-flooded-following-tidal-6377123 (Accessed March, 2015).
CNC/NRW. (2014a). Wales Coastal Flooding Review Phase 1 Report – Assessment of Impacts. Cyfoeth Naturiol Cymru/Natural Resources Wales. Available Online at: http://naturalresourceswales.gov.uk/content/docs/pdfs/flooding-and-alerts-pdfs/wales-coastal-flooding-review-phase-1.pdf?lang=en (Accessed November 13, 2014).
CNC/NRW. (2014b). “Welsh coastal storms, december 2013 & january 2014 – an assessment of environmental change,” in Natural Resources Wales Natural Resources Wales Evidence Report No. 33 eds C. Duigan, N. Rimington, and M. Howe. Available Online at: http://naturalresources.wales/media/1976/welsh-coastal-storms-december-2013-and-january-2014-an-assessment-of-environmental-change.pdf (Accessed May 13, 2015).
Collins, R. (2013). The 1953 Lincolnshire Floods ~ Disaster ! Lincolnshire thro' History, Life, Lens and Words. A Site About Everything and Nothing! Available Online: http://www.rodcollins.com/wordpress/the-1953-lincolnshire-floods-disaster (Accessed November 4, 2014).
Compo, G. P., Whitaker, J. S., Sardeshmukh, P. D., Matsui, N., Allan, R., Yin, X., et al. (2011). The twentieth century reanalysis project. Q. J. R. Meteorol. Soc. 137, 1–28. doi: 10.1002/qj.776
Curran, J. (2014). Agency board meeting 11 February 2014. Chief Executive's Report, Board report Number: SEPA 09/14, Scottish Environment Protection Agency (SEPA). Available Online at: https://www.sepa.org.uk/media/41535/sepa-09-14-chief_executive_report_feb2014.pdf (Accessed November 9, 2014).
Davies, A. (2013). Statement: Recent Flooding in North Wales - your Senedd. Available Online at: http://www.yoursenedd.com/debates/2013-12-10-statement-recent-flooding-in-north-wales (Accessed November 13, 2014).
De Kraker, A. M. J. (2006). Flood events in the southwestern Netherlands and coastal Belgium, 1400–1953. Hydrol. Sci. J. 51, 913–929. doi: 10.1623/hysj.51.5.913
de Vries, H., Breton, M., de Mulder, T., Krestenitis, Y., Ozer, J., Proctor, R., et al. (1995). A comparison of 2D storm surge models applied to three shallow European seas. Environ. Softw. 10, 23–42. doi: 10.1016/0266-9838(95)00003-4
EA. (2011). Somerset Floods - 30 Years On! 13-Dec-2011 Environment Agency. Available online at: http://www.environment-agency.gov.uk/news/135721.aspx
EA. (2014a). Appendix (b) Section 19 December 2013 East Coast Surge. Environment Agency. Available Online at: http://lincolnshire.moderngov.co.uk/documents/s7054/Tidal%20Surge%20Event%20-%20Coastal%20Surge%20-%20Appendix%20A3.pdf (Accessed November 4, 2014).
EA. (2014b). Managing Flood and Coastal Erosion Risks in England 1 April 2013 to 31 March 2014. Environment Agency. Available Online at: https://www.gov.uk/government/uploads/system/uploads/attachment_data/file/356341/S18_report_2013_14_Final_v2.pdf (Accessed November, 19 2014).
EA. (2014c). Tidal Surge Recovery Briefing, Environment Agency 28 March 2014. Available Online at: http://www.norfolkcoastaonb.org.uk/mediaps/pdfuploads/pd003172.pdf (Accessed November 4, 2014).
EA. (2014d). Properties Flooded Since the Start of December 2013. Figure Produced by the Environment Agency, Ref no: 100026380, 2014. Available Online at: https://www.facebook.com/environmentagency/photos/a.10152005392033026.1073741829.169797688025/10152005392148026/ (Accessed April 22, 2015).
EA/GOVUK. (2014). Work Begins on Boston Flood Bank - Press Release by the Environment Agency 1 October 2014. Available Online at: https://www.gov.uk/government/news/work-begins-on-boston-flood-bank (Accessed April 22, 2015).
ERO. (2013). The 1953 Floods in Essex - from the Blog of the Essex Record Office, the Storehouse of Essex History. Available Online at: http://www.essexrecordofficeblog.co.uk/the-1953-floods-in-essex/ (Accessed October 31, 2014).
ERYC. (2014). Flood Investigation Report - Tidal Surge on 5 December 2013. Report to The Cabinet, 24 June 2014 by East Riding of Yorkshire Council. Available Online at: http://www.eastriding.gov.uk/public_reports/TheCabinet/24%20June%202014/Flood%20Investigation%20Report%20-%20Tidal%20Surge%20on%205%20December%202013.pdf (Accessed November, 13 2013).
Essex Life (2013). Personal Memories of the Floods of 1953. Available online at: http://www.essexlifemag.co.uk/people/personal_memories_of_the_floods_of_1953_1_1923995 (Accessed October 26, 2015).
Essex Record Office (2013). The 1953 Floods in Essex. The Blog of the Essex Record Office, the Storehouse of Essex History. Available online at: http://www.essexrecordofficeblog.co.uk/the-1953-floods-in-essex/ (Accessed October 26, 2013).
Fenland Citizen (2013). Flooding in Wisbech. Available online at: http://www.fenlandcitizen.co.uk/news/latest-news/flooding-in-wisbech-1-5731934 (Accessed March 25, 2015).
Flather, R. A. (1984). A numerical model investigation of the storm surge of 31 January and 1 February 1953 in the North Sea. Q. J. R. Meteorol. Soc. 110, 591–612. doi: 10.1002/qj.49711046503
Fritz, H. M., Blount, C. D., Thwin, S., Thu, M. K., and Chan, N. (2009). Cyclone Nargis storm surge in Myanmar. Nat. Geosci. 2, 448–449. doi: 10.1038/ngeo558
Gerritsen, H. (2005). What happened in 1953? The big flood in the Netherlands in retrospect. Philos. Trans. R. Soc. A 363, 1271–1291. doi: 10.1098/rsta.2005.1568
Gönnert, G., Dube, S. K., Murty, T. S., and Siefert, W. (2001). Global Storm Surges: Theory Observation and Applications. Heide in Holstein: Westholsteinische Verlagsanstalt Boyens & Co, 623.
GNUK. (2013). UK: Memories of the Great Flood of 1953 – 310113 1310z - January 31, 2013 by Goaty's News. Available Online at: https://goatysnews.wordpress.com/2013/01/31/uk-memories-of-the-great-flood-of-1953-310113-1310z/ (Accessed May 1, 2015).
Graff, J., and Blackman, D. L. (1978). Analysis of maximum sea levels in southern England. Coast. Eng. 53, 931–948. doi: 10.9753/icce.v16.%25p
Grieve, H. E. P. (1959). The Great Tide: The Story of the 1953 Flood disaster in Essex. Chelmsford: County Council of Essex.
GYBC. (2014). Draft Report on the Council Response to the Tidal Surge 5/6th December 2013. Great Yarmouth Borough Council. Available Online at: http://great-yarmouth.cmis.uk.com/Great-Yarmouth/Document.ashx? (Accessed November 19, 2014).
HCC. (2014). Hull City Council Flood Investigation Report December 2013 City Centre Tidal Surge Flood Event. 4 February, 2014. Available Online at: https://cmis.hullcc.gov.uk/ (Accessed November 13, 2014).
HD. (2014). A Memorable Year: Harwich Flood Disaster 1953. Website published by Harwich & Dovercourt “a time gone by”. Available Online at: http://www.harwichanddovercourt.co.uk/a-memorable-year/ (Accessed October 28, 2014).
Haigh, I., Butcher, P., Harris, J. M., Cooper, N. J., and Trip, I. (2004). “Developing an improved understanding of storm surges in the Solent,” in 39th DEFRA Flood and Coastal Management Conference, June 29 - July 1 2004, (York).
Haigh, I., Nicholls, R., and Wells, N. (2010). Assessing changes in extreme sea levels: application to the English Channel, 1900–2006. Continen. Shelf Res. 30, 1042–1055. doi: 10.1016/j.csr.2010.02.002
Haigh, I. D., Wadey, M. P., Gallop, S. L., Loehr, H., Nicholls, R. J., Horsburgh, K., et al. (2015). A user-friendly database of coastal flooding in the United Kingdom from 1915–2014. Sci. Data 2:150021. doi: 10.1038/sdata.2015.21
Harwood. (2013). Highest North Sea Surge for 60 Years. eSurge. Available Online at: http://www.storm-surge.info/highest-north-sea-surge-60-years (Accessed May 28, 2015).
Heart. (2013). Essex: Flooding Latest. 6th December 2013, 11:29. Available Online at: http://www.heart.co.uk/essex/news/local/west-mersea-severe-flood-warning-issued/ (Accessed November 13, 2013).
Henderson, G., and Webber, N. B. (1977). Storm surges in the UK south coast. Dock Harb. Authority 57, 21–22.
Hickey, K. R. (2001). The storm of 31 January to 1 February 1953 and its impact on Scotland. Scott. Geograph. Magaz. 117, 283–295. doi: 10.1080/00369220118737129
Horsburgh, K. J., Williams, J. A., Flowerdew, J., and Mylne, K. (2008). Aspects of operational forecast model skill during an extreme storm surge event. J. Flood Risk Manage. 1, 213–221. doi: 10.1111/j.1753-318X.2008.00020.x
Horsburgh, K. J., and Wilson, C. (2007). Tide-surge interaction and its role in the distribution of surge residuals in the North Sea. J. Geophys. Res. 112, 1–13. doi: 10.1029/2006jc004033
Hull Daily Mail. (2013). What Next for Spurn Point, left desolate by North Sea tidal Surge? Available Online at: http://www.hulldailymail.co.uk/Spurn-Point-left-desolate-North-Sea-tidal-surge/story-20374811-detail/story.html (Accessed May 14, 2015).
Insurance Journal. (2013). AIR Estimates Windstorm Xaver Insured Losses: $963 Million to $1.92 Billion. December 13, 2013. Available Online at: http://www.insurancejournal.com/news/international/2013/12/13/314377.htm (Accessed July 14, 2015).
Insurance Times. (2013). PwC: Friday's Floods to Cost Insurers up to £100m. 10 December 2013 |By Newsdesk. Available Online at: http://m.insurancetimes.co.uk/pwc-fridays-floods-to-cost-insurers-up-to-100m/1406182.article (Accessed August 20, 2015).
ITV. (2013). North Blyth Hit by Floods - 5 December 2013 at 7:35pm. Available Online at: http://www.itv.com/news/tyne-tees/update/2013-12-05/north-blyth-hit-by-floods/ (Accessed November 14, 2014).
IWCP. (2013). Firefighters on Alert for Flooding; Article by Richard Wright, Friday, December 6, 2013, Isle of Wight County Press. Available Online at: http://www.iwcp.co.uk/news/news/firefighters-on-alert-for-flooding-51989.aspx?mn=2 (Accessed November 13, 2014).
Johnson, M. (2014). December 2013 Tidal Surge. Environment Agency Presentation by Mark Johnson – Area Coastal Manager, Essex Coastal Forum, 25 February 2014. Available Online at: http://dnn.essex.gov.uk/coastalforum/AboutUs/Meetings.aspx (Accessed November 13, 2013).
Jonkman, S., and Kelman, I. (2005). “Deaths during the 1953 North Sea storm surge,” in Proceedings of the Solutions to Coastal Disasters Conference, American Society for Civil Engineers (ASCE) (Charleston, SC). 8–11.
Jonkman, S. N., Maaskant, B., Boyd, E., and Levitan, M. L. (2009). Loss of life caused by the flooding of new orleans after hurricane Katrina: analysis of the relationship between flood characteristics and mortality. Risk Anal. 29, 676–698. doi: 10.1111/j.1539-6924.2008.01190.x
Kelman, I. (2009). 1953 Storm Surge Deaths: U.K. Version 5, 17 August 2009 (Version 1 was 30 November 2002). Available online at: http://www.ilankelman.org/disasterdeaths/1953DeathsUK.doc
Kent News (2013). Remembering the Floods of 1953 - Devastation in North Kent. Article by N. Ames. Available online at: http://www.kentnews.co.uk/news/remembering_the_floods_of_1953_1_1856346 (Accessed March 25, 2015).
Kent Online. (2013a). Families Start to Return Home after Severe Flood Warnings for Kent and Hundreds of Homes Evacuated Amid Worst Tidal Storm Surge in Decades. 07 December 2013. Available Online at: http://www.kentonline.co.uk/kent/news/kent-floods-9812/ (Accessed November 13, 2014).
Kent Online. (2013b). Tidal Surge Brings Floods to Sandwich and Dover. 06 December 2013. Available Online at: http://www.kentonline.co.uk/deal/news/tidal-surge-latest-residents-evacuated-9892/ (Accessed April 22, 2015).
Lamb, H. (1991). Historic Storms of the North Sea, British Isles and Northwest Europe. Cambridge: Cambridge University Press.
LeComte, D. (2014). International weather highlights 2013: super typhoon haiyan, super heat in Australia and China, a long winter in Europe. Weatherwise 67, 20–27. doi: 10.1080/00431672.2014.899800
Lennon, G.W. (1963). A frequency investigation of abnormally high tidal levels at certain west coast ports. Proc. Inst. Civil Eng. 25, 451–484. doi: 10.1680/iicep.1963.10543
Lewis, M., Schumann, G., Bates, P., and Horsburgh, K. (2013). Understanding the variability of an extreme storm tide along a coastline. Estuar. Coast. Shelf Sci. 123, 19–25. doi: 10.1016/j.ecss.2013.02.009
Lin, I. I., Chen, C. H., Pun, I. F., Liu, W. T., and Wu, C. C. (2009). Warm ocean anomaly, air sea fluxes, and the rapid intensification of tropical cyclone Nargis (2008). Geophys. Res. Lett. 36:L03817. doi: 10.1029/2008gl035815
LL. (2014). Great Floods of Lowestoft 1953 & 2013. Posted on 29 April 2014 by ‘Love Lowestoft’. Available Online at: http://www.lovelowestoft.co.uk/tag/lowestoft-floods-1953/ (Accessed May 1, 2015).
Lumbroso, D. M., and Vinet, F. (2011). A comparison of the causes, effects and aftermaths of the coastal flooding of England in 1953 and France in 2010. Nat. Hazards Earth Syst. Sci. 11, 2321–2333. doi: 10.5194/nhess-11-2321-2011
Lynn Museum. (n.d.). The 1953 Floods at King's Lynn. Available online at: http://www.museums.norfolk.gov.uk/view/NCC095922 (Accessed March 2015).
May, V. (1980). SPURN HEAD. Available online at: http://jncc.defra.gov.uk/pdf/gcrdb/GCRsiteaccount2111.pdf (Accessed October 25, 2015).
McMillan, A., Batstone, C., Worth, D., Tawn, J. A., Horsburgh, K., and Lawless, M. (2011). Coastal Flood Boundary Conditions for UK Mainland and Islands. Project: SC060064/TR2: Design Sea Levels. Bristol: Environment Agency.
McRobie, A., Spencer, T., and Gerritsen, H. (2005). The big flood: north sea storm surge. Philos. Trans. R. Soc. A 363, 1263–1270. doi: 10.1098/rsta.2005.1567
MetOffice. (2014a). 1953 East Coast Flood - 60 Years On. Available Online at: http://www.metoffice.gov.uk/news/in-depth/1953-east-coast-flood (Accessed February 2015).
MetOffice. (2014b). The Devastation Floods Can Cause - Met Office Education. Available Online at: http://www.metoffice.gov.uk/education/teens/case-studies/floods (Accessed November 19, 2014).
Mills, I., Scharroo, R., and Fenoglio, L. (2013). “Xaver affected much of northern Europe on 5 and 6 December and caused worst storm surge for decades in the North Sea,” in Report for EUMETSAT. Available online at: http://www.eumetsat.int/website/home/Images/ImageLibrary/DAT_2087062.html (Accessed November 19, 2014).
Muir Wood, R., and Bateman, W. (2005). Uncertainties and constraints on breaching and their implications for flood loss estimation. Philos. Trans. R. Soc. A 363, 1423–1430. doi: 10.1098/rsta.2005.1576
Muir Wood, R., Drayton, M., Berger, A., Burgess, P., and Wright, T. (2005). Catastrophe loss modelling of storm-surge flood risk in eastern England. Philos. Trans. R. Soc. A 363, 1407–1422. doi: 10.1098/rsta.2005.1575
National Trust. (2014). December 2013 Tidal Storm Surge, One Year On. Blakeney National Nature Reserve. Available Online at: http://www.nationaltrust.org.uk/blakeney/visitor-information/article-1355872771719/ (Accessed May 14, 2015).
NCC. (2010). Level 1 Strategic Flood Risk Assessment. Appendix A: Historical Flood Events. Northumberland County Council. Available Online at: http://www.northumberland.gov.uk/idoc.ashx?docid=1f474bcd-b02e-46fd-bfb0-2faa7e12a41f&version=-1 (Accessed November 14, 2014).
NCC. (2015). Northumberland County Council Flood Investigation Report - Investigation of the Tidal Surge 5th/6th December 2013. Available online at: http://www.northumberland.gov.uk/WAMDocuments/9471BDBE-05BB-4730-8277-60F9ECC7D9E5_1_0.pdf?nccredirect=1 (Accessed November 13, 2014).
Needham, H., Keim, B. D., and Sathiaraj, D. (2015). A review of tropical cyclone−generated storm surges: global data sources, observations and impacts. Rev. Geophys. 53, 545–591. doi: 10.1002/2014RG000477
Neumann, B., Vafeidis, A. T., Zimmerman, J, and Nicholls, R. J. (2015). Future coastal population growth and exposure to sea-level rise and coastal flooding - a global assessment. PLoS ONE 10:e0118571. doi: 10.1371/journal.pone.0118571
News North Wales. (2014). £11m Flood Plan for Denbighshire Set to be Approved- Published date: 23 July 2014 |Published by: Staff Reporter. Available Online at: http://www.newsnorthwales.co.uk/news/135953/-11m-flood-plan-for-denbighshire-set-to-be-approved.aspx (Accessed November 13, 2014).
NRA Anglian. (n.d.). Ipswich Flood Defences. National Rivers Authority Anglian Region., Monograph - Date Unknown (Before 1996). Available Online at: http://ea-lit.freshwaterlife.org/archive/ealit:2828/OBJ/20001205.pdf (Accessed May 27, 2015).
Oban Times. (2013). Winds Batter West Highlands and Islands - on December 5th, 2013. The Oban & West Highland Times. Available Online at: http://www.obantimes.co.uk/2013/12/05/winds-batter-west-highlands-and-islands/ (Accessed November 13, 2014).
Palmer, T., Nicholls, R., Wells, N., Saulter, A., and Mason, T. (2014). Identification of ‘energetic’swell waves in a tidal strait. Cont. Shelf Res. 88, 203–215. doi: 10.1016/j.csr.2014.08.004
Parker, S. (2014). Flooding to properties in Rhyl - report by Steve Parker of Debignshire County Council. Available online at: http://www.dailypost.co.uk/news/north-wales-news/magnitude-rhyl-floods-highlighted-shocking-8878726 (Accessed November 13, 2014).
Penning-Rowsell, E., Johnson, C., Tunstall, S., Tapsell, S., Morris, J., Chatterton, J., et al. (2005). The Benefits of Flood and Coastal Risk Management: A Handbook of Assessment Techniques. London: Middlesex University Press.
Plüß, A., Rudolph, E., and Schrödter, D. (2001). Characteristics of storm surges in German estuaries. Clim. Res. 18, 71–76. doi: 10.3354/cr018071
Pollard, M. (1978). North Sea Surge: Story of the East Coast Floods of 1953. Lavenham: Terence Dalton.
Posner, R. (2004). Wyre Flood and Coastal Defence Strategy Plan, March 2004. Report Produced by Wyre Borough Council.
Pratt, I. (1995). The storm surge of 21 February 1993. Weather 50, 42–48. doi: 10.1002/j.1477-8696.1995.tb06075.x
Pugh, D. T. (1987). Tides, Surges Mean Sea-Level: A Handbook For Engineers And Scientists. Hoboken, NJ: John Wiley, 472.
Pye, K., and Blott, S. J. (2006). Coastal processes and morphological change in the Dunwich-Sizewell area, Suffolk, UK. J. Coast. Res. 22, 453–473. doi: 10.2112/05-0603.1
Pye, K., and Blott, S. J. (2009). Progressive breakdown of a gravel-dominated coastal barrier, Dunwich–Walberswick, Suffolk, U.K.: processes and implications. J. Coast. Res. 25, 589–602. doi: 10.2112/07-0982.1
Reeder, T. (2013). The storm surge of 2013 – 6th December. London Climate Change Partnership. Available online at: http://climatelondon.org.uk/articles/the-storm-surge-of-2013/ (Accessed October 31, 2014).
Rossiter, J. R. (1954). The North Sea storm surge of 31 january and 1 february 1953. Philos. Trans. R. Soc. Lond. Ser. A Math. Phys. Sci. 246, 371–400. doi: 10.1098/rsta.1954.0002
Ruocco, A., Nicholls, R., Haigh, I., and Wadey, M. (2011). Reconstructing coastal flood occurrence combining sea level and media sources: a case study of the Solent, UK since 1935. Nat. Hazards 59, 1773–1796. doi: 10.1007/s11069-011-9868-7
SDC. (2014). East Coast Tidal Surge - 5 & 6 December 2013. Suffolk District Council. Available online at: http://www.suffolkcoastal.gov.uk/yourdistrict/planning/coastal-management/tidalsurge/ (Accessed October 28, 2014).
Shennan, I., and Horton, B. (2002). Holocene land- and sea-level changes in Great Britain. J. Q. Sci. 17, 511–526. doi: 10.1002/jqs.710
Sibley, A., Cox, D., and Titley, H. (2015). Coastal flooding in England and Wales from Atlantic and North Sea storms during the 2013/2014 winter. Weather 70, 62–70. doi: 10.1002/wea.2471
Skegness Today. (2013). The Great Flood – 50th Anniversary Supplement, Issue 1-3. Avaialble online at: http://www2.skegnesstoday.co.uk/sites/floods/floods2_8.html (Accessed April 22, 2015).
Skegness Standard. (2014). FEATURE: December Storm Surge 2013 - Impact on Local Wildlife One Year on, by Lee Croft. Available online at: http://www.skegnessstandard.co.uk/news/local/feature-december-storm-surge-2013-impact-on-local-wildlife-one-year-on-1-6449673 (Accessed May 14, 2015).
Skinner, C. (2013). The Surge 2013. Posted on “GEES-ology: Geography, Environment and Earth Science in action” Webpage, Wednesday 11 December 2013. Available online at: http://gees-talk.blogspot.co.uk/2013/12/the-surge-2013.html (Accessed March, 2015).
Smith, P. H. (2014). Effects of Winter Storm Surges on the Sefton Coast, North Merseyside. Sand Dune and Shingle Network Eighteenth Newsletter, March 2014. Linking Science and Management. Liverpool Hope University. Available online at: http://coast.hope.ac.uk/media/liverpoolhope/contentassets/images/coast/media,38794,en.pdf (Accessed Novermber 6, 2014).
Spencer, T., Brooks, S. M., Möller, I., and Evans, B. R. (2014). where local matters: impacts of a major north sea storm surge. Eos Trans. Am. Geophys. Union 95, 269–270. doi: 10.1002/2014EO300002
Spencer, T., Brooks, S. M., Evans, B. R., Tempest, J. A., and Möller, I. (2015). Southern North Sea storm surge event of 5 December 2013: water levels, waves and coastal impacts. Earth Sci. Rev. 146, 120–145. doi: 10.1016/j.earscirev.2015.04.002
Steers, J., Stoddart, D., Bayliss-Smith, T., Spencer, T., and Durbidge, P. (1979). The storm surge of 11 January 1978 on the east coast of England. Geogr. J. 145, 192–205. doi: 10.2307/634386
Steers, J. A. (1953). The East Coast floods, january 31 - february 1 1953. Geogr. J. 119, 280–295. doi: 10.2307/1790640
Stevens, A. J., Clarke, D., Nicholls, R. J., and Wadey, M. P. (2015). Estimating the long-term historic evolution of exposure to flooding of coastal populations. Nat. Hazards Earth Syst. Sci. Discuss. 3, 1681–1715. doi: 10.5194/nhessd-3-1681-2015
Stoddard, A. (2014). The December 2013 Floods - a North Norfolk Perspective. Rare Bird Alert report by Andy Stoddard. Available online at: http://www.rarebirdalert.co.uk/v2/Content/The_December_2013_Floods_a_north_Norfolk_perspective.aspx?s_id=990948523 (Accessed October 28, 2013).
STV News. (2013). Nineteen Flood Warnings Issued as Storm Surge Hits East Coast. By Cara Sulieman 5 December 2013 15:01 GMT. Available online at: http://news.stv.tv/east-central/251759-nineteen-flood-warnings-issued-as-storm-surge-forecast-for-east-coast/ (Accessed May 7, 2015).
Suffolk Coastal. (2013). The Great Flood of 1953 in Suffolk - Report by the Coastal Management Team of Suffolk Coastal and Waveney District Councils, the Environment Agency and Red Cross. Available online at: http://www.suffolkcoastal.gov.uk/yourdistrict/planning/coastal-management/intelligence-information/1953-floods/ (Accessed November 19, 2014).
Sunderland Echo. (2013). Sunderland Counting Cost of Storm Damage. Published 11:30 Saturday 14 December 2013. Available online at: http://www.sunderlandecho.com/news/sunderland-counting-cost-of-storm-damage-1-6315599 (Accessed March, 2015).
Suthons, C.T. (1963). Frequency of occurrence of abnormally high sea levels on the east and south coasts of England. Proc. Inst. Civil Eng. 25, 433–450. doi: 10.1680/iicep.1963.10542
Taylor, K. (2011). The Great Flood of Canning Town. 1st February 1953. A Record of the Flood and the Aftermath taken from Archive Records and Personal Memories of Canning Town People. Available online at: http://www.docklandsmemories.org.uk/Floods1953.pdf (Accessed November 19, 2014).
Taylor, P. (2013). Southampton has a North Sea Storm Surge! Report provided by Peter Taylor, resident of St Denys, Southampton.
The Actuary. (2013). Insured Losses from Cyclone Xaver ‘Could Reach €1.4bn’. 13 DEC 2013 |THE ACTUARY TEAM. Available online at: http://www.theactuary.com/news/2013/12/insured-losses-from-cyclone-xaver-could-reach-14bn/ (Accessed July 24, 2015).
The Bay. (2013). Lancashire & Cumbria Hit By Floods. Thursday, December 5th 2013 13:15. Available online at: http://www.thebay.co.uk/news/local-news/lancashire-and-cumbria-hit-by-floods/ (Accessed November 13, 2014).
The Southwold Museum. (n.d.). The Sea – Killer Floods. Story and Pictures. Available online at: http://www.southwoldmuseum.org/thesea_1953Floods.htm (Accessed May 14, 2015).
UKCMF. (2013). UK Coastal Monitoring and Forecasting Annual Report for 2013 for the UK National Tide Gauge Network. Available online at: https://www.bodc.ac.uk/data/online_delivery/ntslf/reports/documents/2013annualreport.pdf (Accessed August 20, 2015).
Wadey, M. P., Brown, J. M., Haigh, I. D., Dolphin, T., and Wisse, P. (2015). Assessment and comparison of extreme sea levels and waves during the 2013/14 storm season in two UK coastal regions. Nat. Hazards Earth Syst. Sci. 15, 2209–2225. doi: 10.5194/nhess-15-2209-2015
Wadey, M. P., Haigh, I., and Brown, J. (2014). A century of sea level data and the UK's 2013/14 storm surges: an assessment of extremes and clustering using the Newlyn tide gauge record. Ocean Sci. Discuss. 11, 1995–2028. doi: 10.5194/osd-11-1995-2014
Wadey, M. P., Nicholls, R. J., and Haigh, I. (2013a). Understanding a coastal flood event: the 10th March 2008 storm surge event in the Solent, UK. Nat. Hazards, 67, 829–854. doi: 10.1007/s11069-013-0610-5
Wadey, M. P., Roberts, H., and Harris, J. (2013b). Impacts of climate change on built structures (onshore and coastal). MCCIP Sci. Rev. 4, 284–294. doi: 10.14465/2013.arc30.284-294
Wahl, T., Jensen, J., Frank, T., and Haigh, I. (2011). Improved estimates of mean sea level changes in the German Bight over the last 166 years. Ocean Dyn. 61, 701–715. doi: 10.1007/s10236-011-0383-x
Wells, N. C., Baldwin, D. J., Wang, J. Y., and Collins, M. B. (2001). Modelling of extreme storm surge events in the English Channel for the period 14–18 December 1989. Glob. Atmos. Ocean Syst. 7, 275–294.
Welsh Consumer Council. (1992). In Deep Water: A Study of Consumer Problems in Towyn and Kinmell Bay after the 1990 Floods. Welsh Consumer Council.
Whiting. (2014). East Coast Tidal Surge Report, Essex Coastal Forum & Essex County Council (Author: Mark Whiting), 7 December 2013. Available online at: http://dnn.essex.gov.uk/coastalforum/News/NewsReport/TabId/2353/ArtMID/5993/ArticleID/323/Default.aspx (Accessed October 28, 2014).
Wirral. (2014). Flood Investigation Report for December 5th 2013, Wirral Council. Available online at: http://www.wirral.gov.uk/my-services/advice-and-benefits/emergencies/floods/flood-monitoring-and-reports (Accessed November 13, 2014).
WMG. (2013). UPDATE: Roads Reopen Across Cumbria after County Hit by Strong Winds. The West Moorland Gazette. Available online at: http://www.thewestmorlandgazette.co.uk/news/10857068.UPDATE__Roads_reopen_across_Cumbria_after_county_hit_by_strong_winds/?ref=rss (Accessed April 22, 2015).
WMO. (1998). World Meteorological Organization – Guide to Wave Analysis and Forecasting, 2nd Edn., WMO Report No. 702. Available online at: https://www.wmo.int/pages/prog/amp/mmop/documents/WMO%20No%20702/WMO702.pdf (Accessed July 24, 2015).
Wolf, J., and Flather, R. A. (2005). Modelling waves and surges during the 1953 storm. Philos. Trans. R. Soc. A Math. Phys. Eng. Sci. 363, 1359–1375. doi: 10.1098/rsta.2005.1572
Yates, B. (2013). Flood 6th December 2013. Available Online at http://www.ryeharbour.net/picture/number364.asp (Accessed August 15, 2014).
YV. (1978). Britain Battered By Storm - 13 January 1978. Youngstown Vindicator. Available online at: https://news.google.com/newspapers?id=opNIAAAAIBAJ&sjid=vYMMAAAAIBAJ&dq=storm+1978+january+north+sea&pg=1444,4177071&hl=en (Accessed August 20, 2015).
Zurich. (2014). After the storm: how the UK's flood defences performed during the surge following Xaver – Risk Nexus. Zurich Insurance Group Limited, 32. Available online at: http://www.preventionweb.net/english/professional/publications/v.php?id=39185 (Accessed November 9, 2014).
Keywords: storm surge, coastal flooding, 1953 flood, 2013 Xaver storm, North Sea, extreme sea levels, return periods
Citation: Wadey MP, Haigh ID, Nicholls RJ, Brown JM, Horsburgh K, Carroll B, Gallop SL, Mason T and Bradshaw E (2015) A comparison of the 31 January–1 February 1953 and 5–6 December 2013 coastal flood events around the UK. Front. Mar. Sci. 2:84. doi: 10.3389/fmars.2015.00084
Received: 28 May 2015; Accepted: 05 October 2015;
Published: 06 November 2015.
Edited by:
Isabel Iglesias, Centro Interdisciplinar De Investigação Marinha E Ambiental, PortugalReviewed by:
Antonio Olita, National Research Council, ItalyIvica Vilibic, Institute of Oceanography and Fisheries, Croatia
Matthew Lewis, Bangor University, UK
Copyright © 2015 Wadey, Haigh, Nicholls, Brown, Horsburgh, Carroll, Gallop, Mason and Bradshaw. This is an open-access article distributed under the terms of the Creative Commons Attribution License (CC BY). The use, distribution or reproduction in other forums is permitted, provided the original author(s) or licensor are credited and that the original publication in this journal is cited, in accordance with accepted academic practice. No use, distribution or reproduction is permitted which does not comply with these terms.
*Correspondence: Matthew P. Wadey, m.p.wadey@soton.ac.uk