Mass and UV-visible spectral fingerprints of dissolved organic matter: sources and reactivity
 Heather E. Reader
 Colin A. Stedmon
 Nikoline J. Nielsen
 Emma S. Kritzberg
- 1Department of Biology/Aquatic Ecology, Lund University, Lund, Sweden
- 2Section for Marine Ecology and Oceanography, National Institute of Aquatic Resources, Technical University of Denmark, Charlottenlund, Denmark
- 3Department of Plant and Environmental Sciences, University of Copenhagen, Copenhagen, Denmark
Advanced analytical techniques have revealed a high degree of complexity in the chemical makeup of dissolved organic matter (DOM). This has opened the door for a deeper understanding of the role of DOM in the aquatic environment. However, the expense, analytical cost, and challenges related to interpretation of the large datasets generated by these methods limit their widespread application. Optical methods, such as absorption and fluorescence spectroscopy are relatively inexpensive and easy to implement, but lack the detailed information available in more advanced methods. We were able to directly link the analysis of absorption spectra to the mass spectra of DOM using an in-line detector system coupled to multivariate data analysis. Monthly samples were taken from three river mouths in Sweden for 1 year. One subset of samples was exposed to photochemical degradation and another subset was exposed to long-term (4 months) biological degradation. A principle component analysis was performed on the coupled absorption-mass spectra data. Loading spectra for each principle component show distinct fingerprints for both reactivity (i.e., photochemical, biological degradation) and source (i.e., catchment land cover, temperature, hydrology). The fingerprints reveal mass-to-charge values that contribute to optical signals and characteristics seen in past studies, and emphasize the difficulties in interpreting changes in bulk CDOM characteristics resulting from multiple catchment processes. The approach provides a potential simple method for using optical indicators as tracers for more complex chemical processes both with regards to source material for DOM and the past reactive processing of DOM.
Introduction
Dissolved organic matter (DOM) is a large and dynamic pool of reduced carbon, and is an active component of aquatic systems. One of the characteristics of DOM is the ability of a fraction of DOM to absorb light (i.e., chromophoric or colored DOM, CDOM). Typically, the absorption spectrum of CDOM is characterized by a smooth decrease from the ultraviolet across the visible. The spectrum generally appears featureless, with a near exponential decline with increasing wavelength. Despite this, particular absorption properties are linked to the general characteristics of DOM as a whole. The slope of the absorption spectrum has been shown to be inversely correlated to molecular size (Helms et al., 2008), and the specific ultraviolet absorbance (SUVA, ratio of absorbance at 254 nm to dissolved organic carbon concentration) is positively correlated to aromatic content (Weishaar et al., 2003). CDOM and its fluorescent fraction (FDOM) have been suggested as tracers of processes both biotic (i.e., plankton growth, microbial degradation) and abiotic (photochemistry, physical mixing) in aquatic environments (Coble et al., 1993; Helms et al., 2008; Walker et al., 2009). While the ease of measuring these optical characteristics lends themselves to use as tracers, studies show that they are not always conservative (Vodacek et al., 1997; Granskog et al., 2012).
Recent advances in analytical capabilities have allowed for a more detailed look at the molecular characteristics of DOM. In particular, ultra-high resolution mass spectrometry has revealed the presence of tens of thousands of distinct molecular formula making up the whole of the DOM (Kujawinski et al., 2004; Koch et al., 2005; Mopper et al., 2007). Other molecular level analyses, such as nuclear magnetic resonance (NMR) techniques reveal similar complexity in the DOM pool (Hertkorn et al., 2013). The information inherent in these analyses is vast, but the difficulty of operating and expense of these analyses limit their application on a large scale, as well as do the challenges related to data interpretation.
There is a growing need to understand CDOM on a molecular level, in order to better understand what insight it can provide on both the fate of DOM and its effects on aquatic ecosystems (Stubbins et al., 2014). A molecular understanding of CDOM will facilitate the use of CDOM as a tracer of biogeochemical processes, and help to elucidate its function as an active component of the carbon cycle. Progress is impeded by the vast amounts of data generated by current analytical techniques and discrepancies between the analytical windows of different techniques. What is required to use these techniques to their full advantage is the development of suitable data analysis approaches that can link different analyses.
To achieve a better understanding of the molecular and optical characteristics of DOM and how they are linked, we sampled three contrasting boreal rivers in Sweden monthly over a period of 1 year. Seasonal sub-samples were exposed to both photochemical and biological degradation. Samples were further analyzed with coupled absorbance spectroscopy and mass spectrometry. The incorporation of geographic, seasonal, microbial, and photochemical variability in the DOM composition in the dataset made it ideal for developing a multivariate data analysis approach capable of fusing data from different detectors and ultimately linking the optical and mass spectrometric characteristics of DOM from these three catchments.
Materials and Methods
Sampling and Reactivity Experiments
Three distinct river catchments were selected for the year-long study of DOM chemistry (March 2012–February 2013, Figure 1). Ume river, by far the largest catchment, is also the most northern catchment. Ume catchment covers a large range of altitudes, with its headwaters originating high in the Swedish alps, and has a large variety of catchment land cover types. The larger Ume catchment is divided into two large subcatchments, Ume river, which is high altitude and also highly regulated with several hydropower dams and Vindeln catchment, which is unregulated and largely forested. The forested parts of the catchment have been previously shown to drive seasonal DOM dynamics (Reader et al., 2014), thus characteristics such as flow and temperature have been calculated for the Krycklan subcatchment, which is a forested, low altitude subcatchment of Vindeln catchment (Laudon et al., 2013). The two smaller rivers, Emån river, and Lyckeby river, are located in southern Sweden. In contrast to Ume, Emån, and Lyckeby catchments are entirely low altitude, strongly forest dominated, and possess only one main catchment. Details of specific catchment characteristics can be found in Table 1.
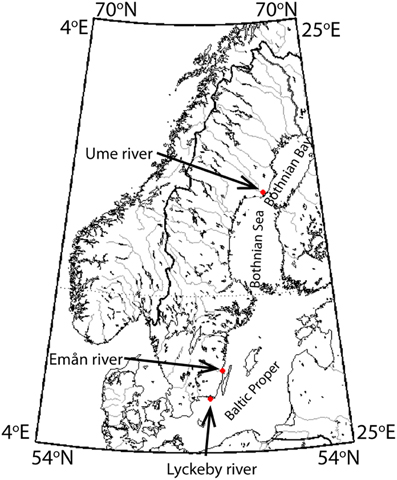
Figure 1. Map of sampling locations, adapted from Reader et al. (2014).
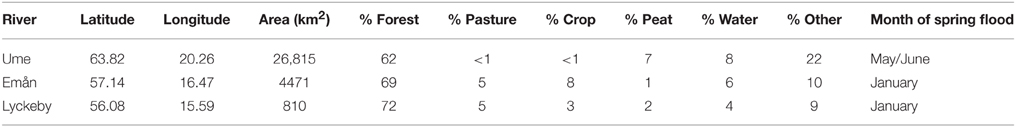
Table 1. Catchment characteristics (adapted from Reader et al., 2014).
Samples were collected in acid-cleaned polycarbonate bottles and stored on ice in the dark until return to the laboratory (< 8 h). Samples for in situ extractions were filtered through GF/F filters (ashed, 4 h, 450°C, Whatman) and subsequently through 0.2 μm polycarbonate filters (Millipore). After filtration, samples were acidified to pH = 2 using 2 M HCl and stored at 4°C until extraction (< 1 week). Samples for photochemistry were filtered in the same manner as the field samples, but they were left at their original pH until after irradiation. Samples for microbial degradation were filtered only through GF/F filters to remove large particles and plankton, whilst keeping the microbial community largely intact.
Samples for microbial degradation were spiked with inorganic nutrients (, , ) to a final ratio better than 45C:9N:1P, to ensure carbon limitation rather than any other nutrient (Goldman et al., 1987). Samples were then placed in the dark at ambient temperature (mean 20.6°C) for 4 months. The months for microbial incubations were chosen to cover a variety of catchment conditions, and were March, May, August, and January, representing early spring, late spring, summer and winter conditions, respectively. After incubation, samples were filtered through 0.2 μm, and acidified to pH = 2.
Samples for photochemical degradation were irradiated in 1 L beakers with depths of 11 cm sealed with quartz lids at 15°C under UV-A centered lamps for 6 days (intensity of 1.07 mW cm−2, integrated from 250 to 700 nm). Months used for photochemical degradation were May, August, October, and January, representing spring, summer, fall, and winter, respectively. After irradiation, samples were acidified to pH = 2 prior to solid phase extraction.
Extraction and Preparation for Analysis
Total organic carbon content was measured using a Shimadzu TOC V-CPN in TC mode. In TC mode, dissolved organic carbon (DOC) is measured as the difference between the total carbon (TC) in the filtered sample and the inorganic carbon (IC), purged from the sample using hydrochloric acid (HCl) in the sampling syringe. The TOC was calibrated daily using sodium hydrogen phthalate standards for organic carbon and sodium carbonate for inorganic carbon. Total volume of sample extracted for analysis was calculated with the goal of loading 2.5 mg of organic matter on 1 g of PPL cartridge. For the microbial and photochemical treatments, the total volume extracted was the same as in situ sample. Two 1-g cartridges were used for each sample. Volumes of water extracted on each cartridge ranged from 100 mL to 2 L. Prior to extraction, cartridges were soaked in methanol overnight to remove any potential contaminants on the PPL, and then rinsed with 100 mL of Milli-Q water. After sample loading, cartridges were rinsed with 30 mL of pH = 2 Milli-Q water (adjusted with 2 M HCl). Cartridges were dried with air, and then subsequently extracted using 20 mL HPLC grade methanol (Merck) at 2 mL/min. Samples were evaporated to a total volume of 4 mL and stored at −18°C until analysis.
Details on MS Analysis
Aliquots of 400 μL were evaporated to dryness and reconstituted in an equivalent volume of mobile phase. Samples were analyzed on an Acquity UPLC (Waters, Milford, MA, USA) equipped with a binary solvent delivery system and operated in direct injection mode. The UPLC is connected in series to a diode-array detector (DAD, 220–499 nm, 1 nm resolution, 20 scans s−1) and to an electrospray ionization (ESI) Ultima Global quadrupole time-of-flight (QTOF) mass spectrometer (Waters Micromass). Ionization was performed in both positive and negative ion mode, and the MS operated in TOF scan mode (m/z = 100–2000), and the quadrupole served as an ion focusing devise (RF only). The ESI source operating conditions were: ion source temperature 120°C, desolvation gas temperature 250°C, cone gas flow 25 L h−1 (ESI+) and 50 L h−1 (ESI−), desolvation gas flow 700 L h−1, capillary voltage 2.5 kV (ESI+) and 2.0 kV (ESI−), cone voltage 20 V, scan time 1 s and interscan delay 0.1 s. Results presented here are only from the negative ion mode. The mobile phase consisted of 10 mmol NH4HCO3 dissolved in 80:20 (v/v) glass distilled water:methanol and adjusted to pH 8.2 with drops of NH4OH. The injection volume was 1 μL and the flow operated at 0.100 mL/min (DI). Samples were run in a randomized order, with repeated analysis of two randomly chosen samples, and a third sample that was extracted multiple times.
Transferring Data to Computing Environment
Data was retrieved using the Masslynx v4.2 (Waters Micromass), and exported as NetCDF-files with the DataBridge application. NetCDF-files were imported into MATLAB 7.9.0 (R2009b; The MathWorks) using in-house programmed routines (courtesy of G. Tomasi and J. Christensen, Copenhagen University) while binning the TOF m/z-axis to nominal m/z-values.
Data Analysis
To prepare the data for principle component analysis both the mass spectra and the absorbance spectra were subjected to pre-processing routines. The goal of the pre-processing was to ensure that neither the mass nor the absorbance spectra would dominate the analysis alone. The mass spectra were binned to integer m/z-values from 100 to 2000, and the ion count was summed for each m/z across the injection peak, summing a total of 156 scans for each sample. Prior to statistical analysis, each spectra were normalized to the total ion count, and then the columns (i.e., m/z-values) were mean centered. The normalization and mean centering of the data removes concentration effects and focuses the analysis on variability between samples (Christensen and Tomasi, 2007).
Absorbance spectra from 250 to 499 nm at the height of the injection peak were off scale due to the highly colored nature of the samples, and therefore discarded. Only spectra from the leading and tailing edge of the injection peak, where the measurement was within the linear range used in the subsequent analysis. Each spectrum was normalized to its integral to remove intensity effects and the mean of these normalized spectra was taken for analysis. Samples were then mean centered.
After individual normalization routines, the corresponding mass spectra and absorbance spectra were concatenated into a single “spectrum.” The samples were then split into two data sets, one containing all of the in situ samples, the biological samples, the photochemical samples and several re-extracted samples for a total of 66 samples. The second data set (total of 28 samples) contained the repeated measurements of two randomly chosen samples (Ref1 and Ref2) to allow an assessment of the analytical reproducibility of the chemical analysis. It further contained an additional five samples that were separate extractions of the same sample, to allow for an assessment of the analytical reproducibility of the method including the laboratory extraction.
A matrix was created to classify each sample in the analysis by river, month of sampling, and treatment. Principle component analysis was run on the sample data set using PLS Toolbox (7.2 Eigenvector). The reference samples were projected onto the model identified and the standard deviation of each reference was calculated for each principle component. To ensure the validity of the results, and specifically to ensure that neither the mass spectra nor the UV-visible spectra were overwhelming the results, principle component analysis was also run on the two spectra separately. Both of the separate analyses returned the same components as the concatenated model, verifying the validity of the results.
Flow data for each site for the duration of the sampling period was obtained from the Swedish Meteorological and Hydrological Institute's Vattenweb (SMHI, http://vattenwebb.smhi.se/station/). Temperature data was obtained from the SMHI's Luftweb (http://luftwebb.smhi.se/). Catchment areas and land cover data were obtained from the Swedish Statistical Board (http://www.scb.se).
Results
A five principle component model that explained 91.47% of the variance in the dataset was identified (PC1 → 59.38%, PC2 → 21.17%, PC3 → 7.81%, PC4 → 1.65%, PC5 → 1.45%). Each principle component was related to an identifiable environmental variable within the dataset. In all, the analytical and experimental variability was minor. The individual reference scores on each component clustered together, as indicated by small standard deviation for each component (Table 2). Furthermore, in all PCs the range of scores is several times higher than the mean standard deviation of the references. The standard deviation for the experimental reference (E-test), was not larger than that of the two analytical references (Ref1 and Ref2), indicating that variations in the laboratory due to sample preparation and extraction were negligible compared to the analytical variability.
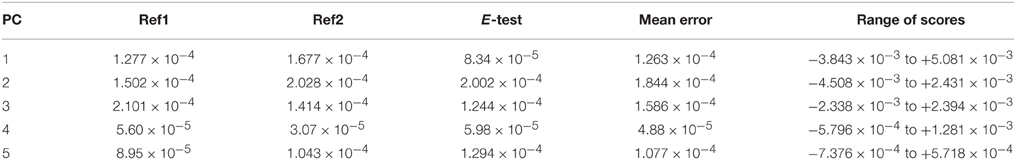
Table 2. Standard deviations of principle component scores for the three reference samples and the range of scores for each PC.
PC1
Principle component 1 represented the changes in the mass and absorbance spectra that were driven by photochemical degradation. Photodegraded samples scored higher (all positively) on PC1 compared to the original in situ non-degraded samples, for all seasons (Figure 2A). The relative analytical error for PC1 (i.e., mean error PC1/std.dev. of the change in scores for each river) was 8, 11, and 16% for Ume, Emån, and Lyckeby rivers, respectively. The mass spectrum loadings show that for the positively scoring photodegraded samples there is a loss of compounds with masses above 550 Da as well as below 200 Da (Figure 2C), while in the mid-range values there is an overall production, resulting from the breakdown of larger molecules.
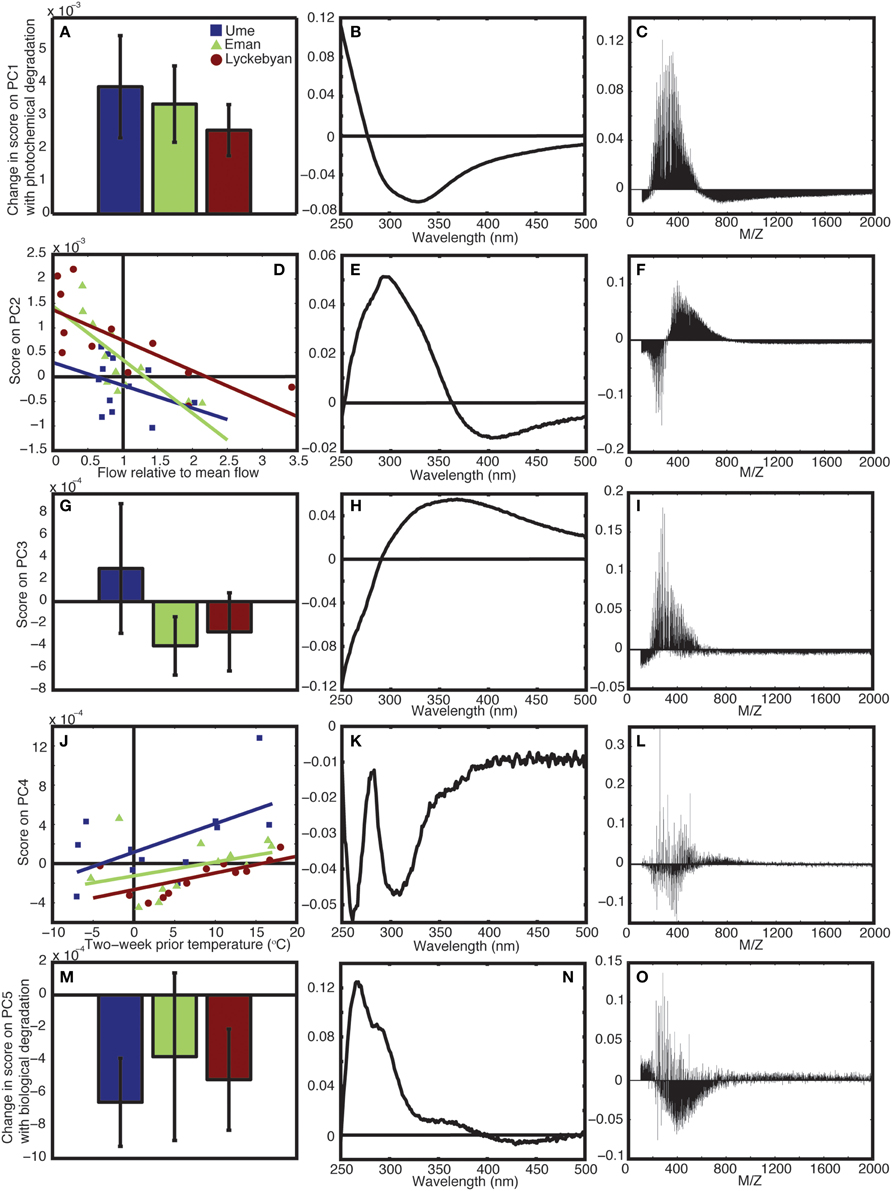
Figure 2. Results from principle component analysis. (A) Shows the change in score on PC1 with photochemical degradation, (B,C) show the corresponding absorbance and mass loadings for PC4, respectively. (D) Shows the scores on PC2 relative to flow in the rivers, (E,F) show the corresponding absorbance and mass loadings for PC2, respectively. (G) Shows the mean and range of the PC3 scores for in situ samples for each river, (H,I) show the corresponding absorbance and mass loadings for PC4, respectively. (J) Shows the scores on PC4 relative to the temperature in the catchment, (K,L) show the corresponding absorbance and mass loadings for PC4, respectively. (M) Shows the change in score on PC5 for the long-term biological degradation samples, (N,O) show the corresponding absorbance and mass loadings for PC5, respectively. In all cases, blue is Ume river, green is Em5n river, and red is Lyckeby river.
The absorbance loadings (Figure 2B) show a broad decrease in loading across the visible and UV, with a maximum relative decrease between 300 and 350 nm. Below approximately 277 nm, there is an increase in loading. The combination of increase in the low UV wavelengths and decrease across the mid-range UVs and into the visible corresponds to a steepening of the absorption spectrum of the sample. This is further supported by the change in the UV spectral slope of the original pre-normalization absorption spectrum, which shows increases in spectral slope for all photodegraded samples (Figure 3). Furthermore, Figure 4 shows how the average mass of the samples decreases with increasing spectral slope, with the photochemically degraded samples clustering with high slope and low average mass.
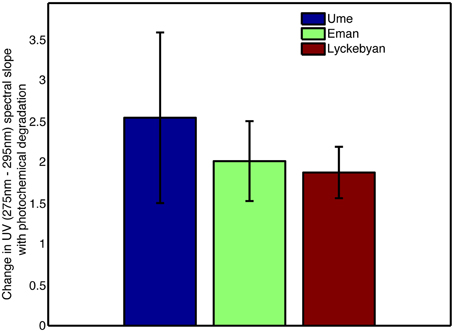
Figure 3. Change in UV (275–295 nm) spectral slope for each catchment for photodegraded samples, prior to normalization routine.
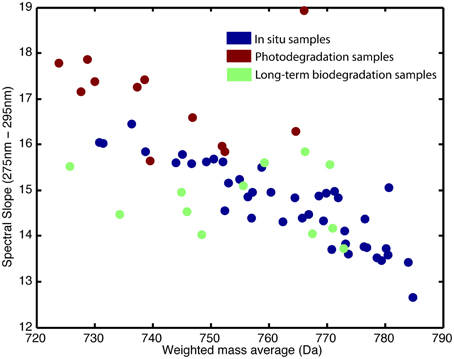
Figure 4. Weighted mass average of samples in relation to UV (275–295 nm) spectral slope. Blue represents in situ samples, red represents photodegraded samples, and green represents the long-term biodegraded samples.
PC2
The second principle component (PC2) is correlated to flow conditions in the catchments. When discharge is low relative to the annual mean discharge in the catchment, the score on PC2 is high. As the relative flow increases, the score on PC2 decreases (Figure 2D). The relationship is statistically significant for both Emån (r = −0.77, p < 0.01) and Lyckeby catchments, (r = −0.73, p < 0.01), the two smaller and largely forested catchments. In Ume catchment the correlation is not significant (r = −0.3549, p = 0.2586), however, when considering flow in just the forested parts of the catchment, the relationship becomes significant (r = −0.58, p < 0.05). The higher scores for low flow conditions corresponds to an increase in mid-range mass values, from 300 to 800 Da, along with a strong decrease in the relative contribution of masses below 300 Da (Figure 2F).
In the corresponding absorbance loading, the low flow conditions lead to an increase in UV absorbance, with the highest relative increase at 300 nm, and a decrease in relative absorbance in the visible wavelengths (Figure 2E). As the flow approaches the annual mean discharge value (1 on the x axis) and beyond, into spring flood and high precipitation event type conditions, the score on PC2 approaches 0 and even extends slightly below 0. This means that the loading patterns indicated in the mass spectrum and the absorbance spectrum are no longer found in the total spectrum, or that their contribution is in fact very low during these conditions.
PC3
The third principle component (PC3) splits between the three different catchments. Emån and Lyckeby catchments are similar in terms of forest cover and agricultural land-use (see Table 1), while Ume catchment covers a much larger variety of land covers. This can be seen in the PC3 scores (Figure 2G) where over the year Emån and Lyckeby catchments score overall negatively (or very weakly positively), while Ume catchment scores positively or weakly negatively over the year. The analytical error on this component is between 27 and 60% of the total range of scores.
There is a greater proportion of masses within sizes 200–500 Da in Ume catchment compared to both Emån and Lyckeby catchments (Figure 2I). Interestingly, the m/z loading spectrum for this component is more specific with selected m/z peaks in the 250–500 Da range also showing removal. The absorbance loadings (Figure 2H) show a broad increase in Ume at wavelengths above 300 nm with a decrease below 300 nm, while the opposite occurs in Emån and Lyckeby catchments (i.e., these two catchments see a relative increase in the low UV and a relative decrease above 300 nm). This corresponds to more shallow spectral slopes for Ume catchment samples and steeper of spectral slopes in both Emån and Lyckeby catchments.
PC4
Principle component 4 (PC4) is correlated to temperature within the catchment (2-week mean temperature prior to sampling date, Figure 2J). In both Ume and Lyckeby catchment the correlation is significant (r = 0.58, p < 0.05; r = 0.67, p < 0.05, respectively). In Emån catchment, the relationship is not significant (r = 0.37, p = 0.24), however this is driven by an outlier value in February only. Removal of this month from the analysis renders the correlation significant (r = 0.75, p < 0.001). Scores on PC4 also increase with increasing lake area in the catchments (Table 1 and Figure 2J), with Ume having higher scores on average, decreasing with Emån and again with Lyckeby.
In contrast to the first three principle components, the loadings for both the mass spectra and the absorbance spectrum are more variable. Within the same size class, mass values are both produced and removed from the mass spectrum (Figure 2L). In colder temperatures, the loadings show depletion of all mass values with positive loadings, and production of mass values with negative loadings. In the warmer summer months the opposite is true, with preferential removal of the mass values with negative loadings and production of those with positive loadings. Table 3 shows significantly high/low loaded m/z-values for PC4. There are indications of pairs or series of separated by unit spacing of 14 (i.e., CH2) groups being removed, suggestive of degradation of hydrocarbon chains. Similarly, the absorbance loading spectrum (Figure 2K) is more complex, with all values loading negatively (i.e., removed from the spectrum in the positively scoring warm summer months, and added to the spectrum in the negatively or zero scoring cold winter months). Two peaks of interest occur, being much more strongly removed in the summer months, at 260 and ~305 nm.
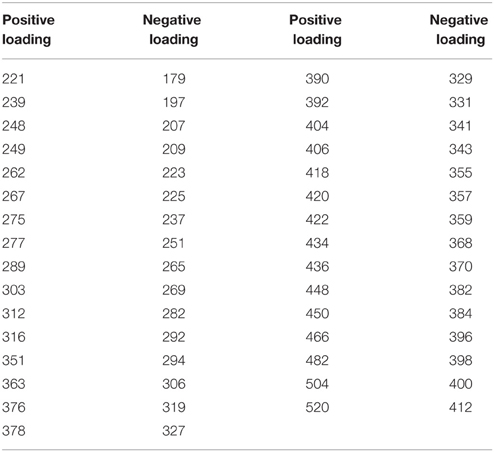
Table 3. Mass spectrum peaks of note from PC4 (with loading intensities higher or lower than 0.05/−0.05).
PC5
Principle component 5 (PC5) shows a strong decrease in loadings for all three rivers, across the four seasons sampled as a result of biodegradation (Figure 2M). The in situ samples score positively or near to zero, while all samples subjected to long-term (4 months) biological degradation processes score negatively. Though the total amount of variance explained by this component is relatively small, the analytical error is smaller than the variance of the means and differences (Ume: 37%, Emån: 20%, Lyckeby: 33%), indicating that this component is a valid explanatory variable in this model. Like PC4, the mass spectrum (Figure 2O) shows more selectivity than the first three components. There appears to be a broad production of organic matter metabolites between 250 and 700 Da with peak degradation 450 Da. However, this is not consistent and there are many m/z-values that are strongly degraded (positive loading) in this region as well. Table 4 shows the values of strongly degraded and produced m/z-values (loading intensity larger than ±0.04) for PC5. This selectivity is an additional indicator of microbial processing.
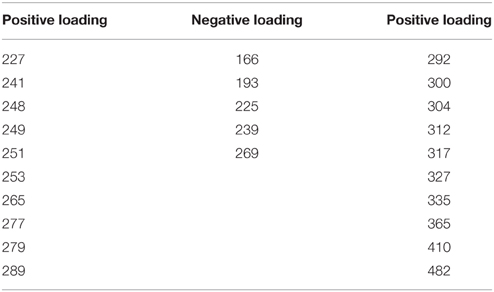
Table 4. Mass spectrum peaks of note from PC5 (with loading intensities higher or lower than 0.04/−0.04).
The absorbance loading (Figure 2N) shows a characteristic selective decrease with biological degradation (positive loading), with a peak decrease at 265–270 nm and a shoulder in the spectrum at 285–295 nm. There is again a slight shoulder around 370 nm and very little loading in the visible wavelengths, indicating that long-term biodegradation mostly affects the UV portion of the absorbance spectrum.
Discussion
Recent advances in analytical methods to characterize DOM have led to widespread availability of both molecular and optical data sets (Coble, 2007; Mopper et al., 2007; Nelson and Siegel, 2013). The complexity of the DOM pool is clear from ultra-high resolution mass spectrometry studies, as they generally find that DOM occupies all of the compositional space (Mopper et al., 2007; Kujawinski et al., 2009). Data reduction is necessary to extract meaningful variability in the data. Here, the use of PCA focuses on the variability between samples. The analysis offers an advantage over bulk approaches as additional information is gained by linking the mass spectra and the absorbance spectra in the same analysis. The absorbance detector and the mass detector are in-line, meaning that the two sample properties are measured on the same sample that has experienced the same treatment (extraction, concentration, etc). The advantage of linking the two together directly in the PCA is that the absorbance loadings and mass spectrum loadings are caused by the same features in the sample, i.e. the compounds that make up the mass spectrum in each loading are the ones that cause the features seen in the absorbance spectrum or are at least strongly correlated to them.
Reactivity Fingerprints—Photochemistry
The most dominant signal in the dataset is driven by photochemical degradation. A clear signal of photochemical fading is seen in the absorbance loadings for PC1; large scale removal of absorbance in the UV and visible, and a relative increase in absorbance at wavelengths between 250 and 290 nm. This relative shift in the spectrum corresponds to a steepening of the spectral slope of CDOM absorbance in the UV, which is a well-known photochemical phenomenon (Del Vecchio and Blough, 2002; Helms et al., 2008). This steepening of the spectral slope is easily seen in the original absorbance spectra before the PCA normalization (Figure 3), lending further support to the identification of photochemical processes in these samples. This commonly observed steepening of the spectral slope of CDOM is due to a shift in overall average molecular size of the DOM (Figure 4; Helms et al., 2008; Dalzell et al., 2009), which is clearly seen in the mass spectrum loadings of PC1 (Figure 2C). The loadings are dominated by a marked shift in m/z-values, with preferential degradation of molecules with m/z over 550, which subsequently produces smaller molecules, with masses between 200 and 550 m/z. This shift in molecule size of the entire pool from large average molecular size to smaller average molecular size is consistent with what is known of photochemical mechanisms in natural waters; particularly the production of indiscriminate reactive oxygen species leads to the breakdown of large structures into smaller ones (Blough and Zepp, 1995; Andrews et al., 2000).
Reactivity Fingerprints—Microbial Activity
The fifth PC is driven by long-term microbial degradation processes. While there is a general trend of production at smaller m/z ranges (i.e., 250–800), there are striking patterns of selective degradation of certain m/z-values within this range (see Table 4). These select m/z-values have the potential to be used as biomarkers of microbial degradation due to their unique signature, and deserve further consideration in future studies. In general, microbial degradation is more selective than photochemical degradation. There is some selectivity also seen in the absorbance loading where there is a strong peak and shoulder being removed from the absorbance spectrum in the microbially degraded samples. Despite general production of relatively low mass values, this does not correspond to a concurrent increase in CDOM absorbance.
Catchment Fingerprints
The catchment related components show both differences between catchments, as well as more general environmental forcing. PC3 is catchment specific, showing a clear difference between Ume catchment and the relatively similar Emån and Lyckeby catchments. The increase in smaller compounds (m/z range 200–500) in Ume catchment suggests that these compounds come from grass and scrubland rather than the more diagenetically altered and potentially more condensed peat and forest sourced compounds (present in all three catchments). The absorbance loadings show a concurrent lessening of the influence of mid-UV absorbance for Ume as well, which further suggests a lower relative contribution from aromatic and conjugated compounds in that catchment.
PC2 and PC4 both show environmental forcing, namely, hydrology and temperature, respectively. In PC2, low flow conditions lead to an increase in the relative contribution of peat and wetlands, as well as drainage through deeper layers of forest soil. The importance of the boreal forest and associated peat and wetlands has been seen before in bulk DOC studies (Bishop et al., 1993; Cole et al., 2007; Asmala et al., 2013), and specifically in these catchments (Reader et al., 2014). Here we can see the expected shift in the absorbance spectra as these sources become dominant under low flow conditions, with a strong increase in mid- to-low UV absorption and a smaller decrease from 350 nm into the visible, effectively an increase in the spectral slope ratio (SR; Helms et al., 2008). The mass spectrum loading shows that this effect is driven by ions with higher m/z-values. Correlation between increasing SR and increased m/z-value as seen in the PC2 loadings during low flow has been previously reported in bulk DOM studies (Helms et al., 2008). The compounds in this type of DOM have typically undergone more diagenesis than fresher material delivered to aquatic systems during high flow conditions, and are made up of more aromatic and condensed structures, hence the higher mass and absorption signals.
PC4 reflects a different kind of microbial activity than PC5. The increase in loading of PC4 with increasing catchment temperatures is seen in all three catchments, with a maximum in the summer months when microbial activity is highest. Moreover, there is a concurrent increase in the loading of PC4 with the total lake area, further supporting the importance of microbial processing of the DOM within the catchment. The mass loadings here show more selectivity with respect to m/z-values, unlike the loadings driven by river flow in PC2, where the m/z loading shows a distinct shift between high and low values. The selective nature of this PC is reflected again in the absorbance loading which shows two distinct peaks of negative loadings in the UV (i.e., the two troughs seen in Figure 2K). Shifts in the absorbance spectrum of CDOM due to microbial activity are often subtle (Miller and Moran, 1997), however, given the selective nature of microbial activity, it is likely to cause this type of peak followed by trough character.
This method of analysis highlights the true effect of microbial activity on the absorbance spectra of natural waters, which cannot be seen with simplified methods such as spectral slope or wavelength ratios. At this point, it is not possible to determine whether this signal is driven by bacterial degradation or by phytoplankton growth, since both these processes tend to exhibit maxima under similar conditions (i.e., warm, high insolation summer months). However, given the ease with which this effect was detected in the analysis, it would be relatively straightforward to address this in future studies.
The results presented emphasize how difficult it can be to use bulk CDOM measures, such as spectral slope, to systematically indicate changes in CDOM character resulting from changes in the balance of catchment processes (e.g. microbial activity and hydrological residence time). This in part may explain contradictory seasonal trends from different catchments. It is clear that the analysis presented here is able to distinguish the different processes in such a way that much more information about the DOM character is revealed.
An Approach for Better Understanding the Biogeochemistry of DOM
Repeated analysis of three independent and randomly chosen samples allowed for an assessment of the ability of the method to successfully detect differences between samples. For all five PCs the spread of the repeated measures was small compared to the differences between treatments/sources etc. Low error combined with the easily identifiable environmental variables for each PC, means the multivariate approach to fingerprinting DOM in aquatic environments offers novel and powerful insight into the cycling of DOM. The breakdown of an individual sample's mass and/or absorbance spectrum into individual components allows for these samples characteristics to be used as effective tracers of source and reactivity in the environment. The consistent and logical patterns that are seen in this dataset confirm the power of this approach.
Several series of mass peaks were found to be preferentially removed or produced by biological processes in the samples. While the resolution of the mass spectrometer employed in this study is not high enough to conclusively identify the individual molecular formulas producing these signals, this result offers a direction that ultra-high resolution studies could take by targeting specific mass values of interest. These potentially novel biomarkers could lend insight into the cycling of DOM through aquatic systems, as well as informing what compounds produce the unique absorbance signals seen in the couple absorbance loadings.
Furthermore, the uncoupled mass and absorbance spectra revealed that these components are easily identifiable without putting the two datasets together. This not only lends support to the integrity of the analysis, but also offers a simple and fast approach to optical DOM tracers, where one could envision using this approach on simple absorbance data, if the mass spectrometer were not available.
The approach presented in this study is the first of its kind to conclusively link the mass spectra and absorbance spectra of dissolved organic matter into one analysis. The technique provides insight into the cycling of organic matter, both source and reactivity in aquatic systems. Results confirm what earlier bulk chemical studies suggested about the effect of broad abiotic processing of DOM and its effect on both the molecular content of DOM, as well as the optical properties DOM imparts on aquatic systems. Furthermore, this technique allows for the fingerprinting of more subtle biotic processes, which have long been known to be more selective than abiotic chemistry, and reveals their distinct signature on DOM's molecular composition and optical activity. The potential biomarkers, identified in both the mass spectra and the absorbance spectra offer directions for further study into the interactions of the microbial community and DOM cycling. The sources and reactivity of DOM in these rivers have been systematically identified, and these fingerprints have the potential to be used to trace these characteristics throughout the aquatic system, leading to a better understanding of the complex dynamics of DOM in the global carbon cycle.
Author Contributions
HR, CS, EK designed the study, HR performed fieldwork, and prepared samples for analysis, NN ran samples on the UPLC system, transferred the data to the computing environment and contributed methods to the manuscript, HR analyzed the data and wrote the manuscript with significant input from CS and EK.
Conflict of Interest Statement
The authors declare that the research was conducted in the absence of any commercial or financial relationships that could be construed as a potential conflict of interest.
Acknowledgments
This work was supported by the Swedish Research Council (VR, no. 2010-4081; granted to EK), the Managing Multiple Stressors in the Baltic Sea project, FORMAS grant no. 217-2010-1267, and Danish Research Council for Independent Research (DFF 1323-00336).
References
Andrews, S. S., Caron, S., and Zafiriou, O. C. (2000). Photochemical oxygen consumption in marine waters: a major sink for colored dissolved organic matter? Limnol. Oceanogr. 45, 267–277. doi: 10.4319/lo.2000.45.2.0267
Asmala, E., Autio, R., Kaartokallio, H., Pitkänen, L., Stedmon, C. A., and Thomas, D. N. (2013). Bioavailability of riverine dissolved organic matter in three Baltic Sea estuaries and the effect of catchment land use. Biogeosciences 10, 6969–6986. doi: 10.5194/bg-10-6969-2013
Bishop, K. H., Lundström, U. S., and Giesler, R. (1993). Transfer of organic C from forest soils to surface waters: example from northern Sweden. Appl. Geochemistry 8(Suppl.), 11–15. doi: 10.1016/S0883-2927(09)80003-6
Blough, N. V, Zepp, R. G. (1995). “Reactive oxygen species in natural waters,” in Active Oxygen in Chemistry, ed C. S. Foote (Dordrecht: Springer Netherlands), 280–333.
Christensen, J. H., and Tomasi, G. (2007). Practical aspects of chemometrics for oil spill fingerprinting. J. Chromatogr. A 1169, 1–22. doi: 10.1016/j.chroma.2007.08.077
Coble, P. G. (2007). Marine optical biogeochemistry: the chemistry of ocean color. Chem. Rev. 107, 402–418. doi: 10.1021/cr050350+
Coble, P. G., Schultz, C. A., and Mopper, K. (1993). Fluorescence contouring analysis of doc intercalibration experiment samples -z a comparison of techniques. Mar. Chem. 41, 173–178. doi: 10.1016/0304-4203(93)90116-6
Cole, J. J., Prairie, Y. T., Caraco, N. F., McDowell, W. H., Tranvik, L. J., Striegl, R. G., et al. (2007). Plumbing the global carbon cycle: integrating inland waters into the terrestrial carbon budget. Ecosystems 10, 171–184. doi: 10.1007/s10021-006-9013-8
Dalzell, B. J., Minor, E. C., and Mopper, K. M. (2009). Photodegradation of estuarine dissolved organic matter: a multi-method assessment of DOM transformation. Org. Geochem. 40, 243–257. doi: 10.1016/j.orggeochem.2008.10.003
Del Vecchio, R., and Blough, N. V (2002). Photobleaching of chromophoric dissolved organic matter in natural waters: kinetics and modeling. Mar. Chem. 78, 231–253. doi: 10.1016/S0304-4203(02)00036-1
Goldman, J. C., Caron, D. A., and Dennett, M. R. (1987). Regulation of gross growth efficiency and ammonium regeneration in bacteria by substrate C:N ratio. Limnol. Oceanogr. 32, 1239–1252. doi: 10.4319/lo.1987.32.6.1239
Granskog, M. A., Stedmon, C. A., Dodd, P. A., Amon, R. M. W., Pavlov, A. K., de Steur, L., et al. (2012). Characteristics of colored dissolved organic matter (CDOM) in the Arctic outflow in the Fram Strait: assessing the changes and fate of terrigenous CDOM in the Arctic Ocean. J. Geophys. Res. 117:C12021. doi: 10.1029/2012jc008075
Helms, J. R., Stubbins, A., Ritchie, J. D., Minor, E. C., Kieber, D. J., and Mopper, K. (2008). Absorption spectral slopes and slope ratios as indicators of molecular weight, source, and photobleaching of chromophoric dissolved organic matter. Limnol. Oceanogr. 53, 955–969. doi: 10.4319/lo.2008.53.3.0955
Hertkorn, N., Harir, M., Koch, B. P., Michalke, B., and Schmitt-Kopplin, P. (2013). High-field NMR spectroscopy and FTICR mass spectrometry: powerful discovery tools for the molecular level characterization of marine dissolved organic matter. Biogeosciences 10, 1583–1624. doi: 10.5194/bg-10-1583-2013
Koch, B. P., Witt, M. R., Engbrodt, R., Dittmar, T., and Kattner, G. (2005). Molecular formulae of marine and terrigenous dissolved organic matter detected by electrospray ionization Fourier transform ion cyclotron resonance mass spectrometry. Geochim. Cosmochim. Acta 69, 3299–3308. doi: 10.1016/j.gca.2005.02.027
Kujawinski, E. B., Del Vecchio, R., Blough, N. V., Klein, G. C., and Marshall, A. G. (2004). Probing molecular-level transformations of dissolved organic matter: insights on photochemical degradation and protozoan modification of DOM from electrospray ionization Fourier transform ion cyclotron resonance mass spectrometry. Mar. Chem. 92, 23–37. doi: 10.1016/j.marchem.2004.06.038
Kujawinski, E. B., Longnecker, K., Blough, N. V., Del Vecchio, R., Finlay, L., Kitner, J. B., et al. (2009). Identification of possible source markers in marine dissolved organic matter using ultrahigh resolution mass spectrometry. Geochim. Cosmochim. Acta 73, 4384–4399. doi: 10.1016/j.gca.2009.04.033
Laudon, H., Taberman, I., Ågren, A., Futter, M., Ottosson-Löfvenius, M., and Bishop, K. (2013). The Krycklan Catchment Study—a flagship infrastructure for hydrology, biogeochemistry, and climate research in the boreal landscape. Water Resour. Res. 49, 7154–7158. doi: 10.1002/wrcr.20520
Miller, W. L., and Moran, M. A. (1997). Interaction of photochemical and microbial processes in the degradation of refractory dissolved organic matter from a coastal marine environment. Limnol. Oceanogr. 42, 1317–1324. doi: 10.4319/lo.1997.42.6.1317
Mopper, K., Stubbins, A., Ritchie, J. D., Bialk, H. M., and Hatcher, P. G. (2007). Advanced instrumental approaches for characterization of marine dissolved organic matter: extraction techniques, mass spectrometry, and nuclear magnetic resonance spectroscopy. Chem. Rev. 107, 419–442. doi: 10.1021/cr050359b
Nelson, N. B., and Siegel, D. A. (2013). The global distribution and dynamics of chromophoric dissolved organic matter. Ann. Rev. Mar. Sci. 5, 447–476. doi: 10.1146/annurev-marine-120710-100751
Reader, H. E., Stedmon, C. A., and Kritzberg, E. S. (2014). Seasonal contribution of terrestrial organic matter and biological oxygen demand to the Baltic Sea from three contrasting river catchments. Biogeosciences 11, 3409–3419. doi: 10.5194/bg-11-3409-2014
Stubbins, A., Lapierre, J.-F., Berggren, M., Prairie, Y. T., Dittmar, T., and del Giorgio, P. A. (2014). What's in an EEM? Molecular signatures associated with dissolved organic fluorescence in boreal Canada. Environ. Sci. Technol. 48, 10598–10606. doi: 10.1021/es502086e
Vodacek, A., Blough, N. V., DeGrandpre, M. D., Peltzer, E. T., and Nelson, R. K. (1997). Seasonal variation of CDOM and DOC in the Middle Atlantic Bight: terrestrial inputs and photooxidation. Limnol. Oceanogr. 42, 674–686. doi: 10.4319/lo.1997.42.4.0674
Walker, S. A., Amon, R. M. W., Stedmon, C., Duan, S. W., and Louchouarn, P. (2009). The use of PARAFAC modeling to trace terrestrial dissolved organic matter and fingerprint water masses in coastal Canadian Arctic surface waters. J. Geophys. Res. 114:G00F06. doi: 10.1029/2009jg000990
Keywords: dissolved organic matter, optical properties, absorbance spectra, mass spectrometry, biogeochemistry
Citation: Reader HE, Stedmon CA, Nielsen NJ and Kritzberg ES (2015) Mass and UV-visible spectral fingerprints of dissolved organic matter: sources and reactivity. Front. Mar. Sci. 2:88. doi: 10.3389/fmars.2015.00088
Received: 14 August 2015; Accepted: 14 October 2015;
Published: 29 October 2015.
Edited by:
Christopher Osburn, North Carolina State University, USAReviewed by:
John Robert Helms, Morningside College, USAMarta Plavsic, Rudjer Boskovic Institute, Croatia
Copyright © 2015 Reader, Stedmon, Nielsen and Kritzberg. This is an open-access article distributed under the terms of the Creative Commons Attribution License (CC BY). The use, distribution or reproduction in other forums is permitted, provided the original author(s) or licensor are credited and that the original publication in this journal is cited, in accordance with accepted academic practice. No use, distribution or reproduction is permitted which does not comply with these terms.
*Correspondence: Heather E. Reader, hrea@aqua.dtu.dk