Using Ecological Thresholds to Inform Resource Management: Current Options and Future Possibilities
 Melissa M. Foley1*†
  Rebecca G. Martone1
  Michael D. Fox1†
  Carrie V. Kappel2
  Lindley A. Mease3 Ashley L. Erickson3
  Benjamin S. Halpern2,4,5 Kimberly A. Selkoe2,6
  Peter Taylor7
  Courtney Scarborough2
- 1Center for Ocean Solutions, Stanford Woods Institute, Monterey, CA, USA
- 2National Center for Ecological Analysis and Synthesis, Santa Barbara, CA, USA
- 3Center for Ocean Solutions, Stanford Woods Institute, Stanford, CA, USA
- 4Bren School of Environmental Science and Management, University of California Santa Barbara, Santa Barbara, CA, USA
- 5Department of Life Sciences, Imperial College London, Ascot, UK
- 6Hawai‘i Institute of Marine Biology, Kâne‘ohe, HI, USA
- 7Waterview Consulting, Harpswell, ME, USA
In the face of growing human impacts on ecosystems, scientists and managers recognize the need to better understand thresholds and non-linear dynamics in ecological systems to help set management targets. However, our understanding of the factors that drive threshold dynamics, and when and how rapidly thresholds will be crossed is currently limited in many systems. In spite of these limitations, there are approaches available to practitioners today—including ecosystem monitoring, statistical methods to identify thresholds and indicators, and threshold-based adaptive management—that can be used to help avoid reaching ecological thresholds or restore systems that have crossed them. We briefly review the current state of knowledge and then use real-world examples to demonstrate how resource managers can use available approaches to avoid crossing ecological thresholds. We also highlight new tools and indicators being developed that have the potential to enhance our ability to detect change, predict when a system is approaching an ecological threshold, or restore systems that have already crossed a tipping point.
Introduction
Non-linear threshold responses are common in ecological systems (Scheffer et al., 2001a; Knowlton, 2004), driven by both natural and human-induced pressures on ecosystems. Threshold responses are characterized by a rapid, non-linear change in the ecosystem in response to an environmental pressure. As the number, extent, and intensity of human impacts expand (Halpern et al., 2008, 2015), strongly non-linear responses in ecosystems become even more likely (Crain et al., 2008), and can lead to unwanted shifts in ecosystem state, slow recovery of systems back to desired states (Hughes, 1994; Hughes et al., 2013b), and altered ecosystem function and delivery of services (Folke et al., 2004). Research addressing potential threshold responses of ecosystems to human pressures has increased in the last decade, and has largely focused on identifying drivers and mechanisms of observed shifts, investigating what confers resilience to ecosystems, and developing early warning indicators that could help scientists and practitioners identify ecological thresholds before they are crossed (Scheffer et al., 2001b; Hughes et al., 2013b). This research holds great promise for strengthening ecosystem management practices to avoid dramatic and unwanted shifts in ecosystem state. Indeed, identifying thresholds can enhance environmental decisionmaking and management because they provide opportunities for managers to set non-arbitrary targets and reference points (Suding and Hobbs, 2009; Samhouri et al., 2011). For most practitioners, however, the research remains too theoretical or impractical to implement, despite being encouraged or even mandated by law (Kelly et al., 2015).
Incorporating ecological thresholds into management can be a daunting task. In many ecosystems we have limited ability to predict if a threshold exists, when and how rapidly it will be crossed, and if positive feedback loops that entrain the new state will develop. Uncertainty in our assessment of ecosystem traits, pressures that push systems toward thresholds, and how they affect management or restoration decisions adds to the challenge of managing ecosystem thresholds (Huggett, 2005). Yet ignoring them is risky. Recent syntheses show that non-linear responses are common (Burkett et al., 2005; Karr et al., 2015; Hunsicker et al., in press; Kappel et al., in review), and examples from around the world show that incorporating information about threshold behavior into resource management can facilitate improved management outcomes (Kelly et al., 2014). Major advances in threshold science provide new opportunities for practitioners to employ a wide range of methods to examine the dynamics of ecosystems before and after they cross thresholds (Wang et al., 2012; Kéfi et al., 2014), monitor ecosystem indicators that provide early warning of impending change (Samhouri et al., 2009; Tomczak et al., 2013), and uncover the mechanisms and drivers responsible for ecosystem shifts (Scheffer et al., 2009).
To facilitate transfer of ecological threshold science out of the often technical and specialized realms of theory, modeling, and experimentation and into the realm of practical implementation, we provide an accessible overview of approaches to identify ecological thresholds and their indicators. Throughout, we use examples to demonstrate how this science is being applied today. We also highlight new approaches and tools that are being developed that are likely to advance the identification and use of thresholds in management. While some of these approaches and tools are complex and data intensive, we think it is important to highlight them in the context of this review. Threshold science is a rapidly evolving field that has many challenges to overcome, but the insights it can provide are urgently needed to address current resource use and management problems. Managing for thresholds goes hand-in-hand with increasing calls for practitioners to use an ecosystem-based management framework to address cumulative impacts of multiple stressors, account for the complexities of coupled socio-ecological systems, and sustainably manage emerging uses (McLeod and Leslie, 2009; Halpern and Fujita, 2013). This synthesis provides key information and perspectives necessary to retool traditional management strategies and integrate techniques that will facilitate more holistic and successful ecosystem-based management in the future. To avoid confusion over terminology, Table 1 contains a glossary of terms and definitions we use throughout this paper.
Table 1. Glossary of terms used.
Threshold Responses and Ecosystem Drivers
Interactions between ecosystem state, pressures, and rate of change can determine the trajectory a system follows and how quickly that change occurs (Bestelmeyer et al., 2011). In general, an ecosystem can respond one of three ways when exposed to a pressure or combination of pressures—with a linear (or smooth), continuous threshold (or abrupt), or discontinuous threshold (hysteretic) response (Figure 1). Of the three types, abrupt and hysteretic threshold responses are of most concern for management because changes in ecosystem state or function tend to occur abruptly with a small change in a given pressure (Figures 1B,C,E,F), and are therefore more difficult to predict. Hughes et al. (2013b) demonstrated that ecosystem response can be more complex than these three responses. In some slow-responding systems, ecosystem components may continue to change linearly after the threshold of pressure(s) has been exceeded and exhibit non-linear change well after the tipping point has been crossed. Systems that exhibit hysteresis—those that can exist in two or more alternative states under the same environmental conditions (Scheffer et al., 2001a)—are of particular concern because they do not recover along the same pathway when the pressure is reduced or removed from the system (Suding and Hobbs, 2009; Figure 1C). In addition, ecosystem recovery along these alternate pathways is often slower and may require multiple pressures to be reduced (Box 1). For example, overfishing of zooplanktivorous fish from the Black Sea changed the abundance and composition of the zooplankton community. Despite management intervention to reduce fishing pressure, the key driver, the system did not return to its original state because a positive feedback loop involving changes in productivity and predator-prey dynamics shifted the system to a stable, alternative state (Daskalov et al., 2007). Slow-responding and hysteretic systems underscore the need for understanding ecosystem dynamics and interactions between pressures and ecological components so that more effective, targeted strategies can be developed, such as disrupting or preventing positive feedback loops from becoming established (Nyström et al., 2012).
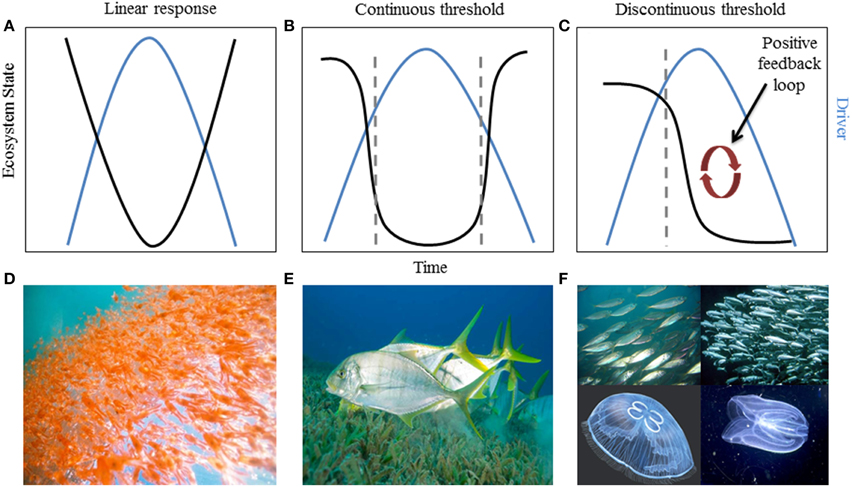
Figure 1. Relationship between ecosystem state and time with respect to an environmental pressure in systems that exhibit (A) linear response (smooth), (B) a continuous threshold (abrupt), or (C) a discontinuous threshold (hysteresis). Dashed gray lines indicate where the system exhibits a non-linear threshold response. Examples of systems that have shown these dynamics: (D) linear tracking of krill abundance to the Pacific Decadal Oscillation (Bestelmeyer et al., 2011); (E) seagrass habitat threshold changes due to a reduction in freshwater flow to Florida Bay (see “Case Study” Section); and (F) the Black Sea fishery92s lack of recovery when fishing pressure was reduced, due to feedbacks that stabilized an alternate state (Daskalov et al., 2007).
BOX 1. USING TIME-SERIES DATA TO UNDERSTAND ECOSYSTEM RESPONSE TO MULTIPLE DRIVERS.
Multiple drivers may combine to push an ecosystem toward a threshold or prevent recovery after a threshold has been crossed. Time-series data can help managers understand what changes have occurred historically and what management options may be most effective for ecosystem recovery.
Elkhorn Slough, California, USA
An analysis of long-term time-series data from the Elkhorn Slough estuary in California showed a shift from an eelgrass-dominated to a crab-dominated ecosystem, as nutrient concentrations increased and sea otter numbers declined. Using these data, along with spatial data and experimental research, researchers revealed that the presence and abundance of key functional groups can be critical to the recovery of an eelgrass system that has been exposed to nutrient pollution. Contrary to expectations, nutrient reductions alone did not result in eelgrass recovery in the slough. After being hunted to near extinction, the reintroduction of sea otters to Central California began to effect change in the slough through a trophic cascade. Otters preyed on crabs, releasing many grazers from predation pressure. The growing population of grazers, in turn, reduced the amount of algae growing on the eelgrass, allowing it to flourish. In this example, both a reduction in nutrients and the reintroduction of a top predator were required to mitigate the effects of nutrient pollution (Hughes et al., 2013a).
Baltic Sea, Europe
Time-series data from the Baltic Sea showed a dramatic pelagic food web shift in the late 1980s to early 1990s. A shift in the North Atlantic Oscillation (NAO) altered thermal, salinity, and nutrient regimes of the Baltic Sea (Alheit et al., 2005; Möllmann et al., 2009). This, in combination with overfishing, disrupted the four level trophic cascade—including cod (piscivore), sprat (zooplanktivore), zooplankton, and phytoplankton—that had characterized the system for decades (Casini et al., 2009). The combination of climate–and human-induced pressures on the Baltic Sea ecosystem resulted in a new ecosystem state characterized by hysteresis, where continued fishing pressure and a high abundance of sprat prevented the recovery of cod and reestablishment of the original trophic cascade even after hydrological conditions were again favorable for cod larvae (Lindegren et al., 2010).
Pressures, or drivers, acting on ecosystems are numerous and occur over multiple temporal and spatial scales. Drivers can be proximal, such as disease outbreaks on coral reefs, or distal, such as changing global temperatures, agricultural land use, or market pricing (Mora, 2009; Kittinger et al., 2012). Drivers can also occur on local (e.g., pollution, resource harvesting) to global spatial scales (e.g., climate change, biogeochemical cycle alteration). The spatial scale at which drivers operate and how quickly the system responds to those drivers, in part determine the type of threshold dynamic a system is likely to exhibit and the potential for successful restoration (Osman et al., 2010; Walker et al., 2012; Hughes et al., 2013b). Identifying threshold changes within the complex landscape of interacting drivers and ecological processes is challenging but necessary to provide practitioners with guidance on the types of ecosystem features and interactions that are important to ecosystem resilience (e.g., Foley et al., 2010) and the combinations of drivers that are likely to push a system over a threshold.
Managing for Thresholds Today
In spite of the challenges associated with identifying thresholds, and the complexity of ecosystems, practitioners are currently using an array of methods to implement threshold-based management with some success. Kelly et al. (2014) reviewed 51 management case studies from systems that demonstrated threshold behaviors. They found that successfully avoiding a threshold or recovering after a tipping point was crossed was correlated with three features: (1) using routine ecosystem monitoring to assess progress toward management objectives, (2) explicitly considering the potential or known threshold in management decisionmaking, and (3) managing drivers and ecosystem responses at the appropriate spatial scale. We build on this work by reviewing our current scientific knowledge behind the diverse suite of approaches being used in a range of locations. These examples demonstrate that in many types of systems it is possible to successfully avoid or recover from crossing ecological thresholds using existing management strategies.
Using Monitoring and Indicators to Measure Progress
Successful monitoring activities focus on identifying relevant ecosystem variables and tracking them on temporal and spatial scales relevant to the ecosystem threshold (Biggs et al., 2009). Consistent and timely monitoring of ecological components and processes is one of the main activities scientists and practitioners can perform to avoid ecological thresholds. Ecological changes that may be indicative of an approaching threshold include loss of key functional groups (e.g., primary producers, top predators, habitat-forming species), changes in community composition (e.g., species invasion), loss of species diversity, and reduced connectivity between systems and populations (Suding and Hobbs, 2009). Actively monitoring ecological metrics on relevant temporal and spatial scales is vital for practitioners to decipher drivers of ecosystem change, anticipate upcoming shifts, and trigger appropriate, proactive management actions, particularly when mitigation is not an option. In addition to monitoring data, historical ecological analysis and long-term datasets can provide insights on which ecosystem processes are most critical to maintain in order to avoid a tipping point or recover from a shift in ecosystem state (Box 1). Using these ecosystem features as a guide, practitioners can develop an integrated understanding of how drivers are likely to affect key features of the ecosystem and determine whether increasing or maintaining the type and intensity of pressures is likely to result in threshold behavior, and evaluate the relative impact of alternative management actions by being cognizant of which pressures drive ecosystem shifts, which are controllable, and how quickly a system may react to a change in drivers.
For example, scientists and managers are currently developing ecosystem indicators for Caribbean coral reefs based on threshold responses of the ecosystem to overfishing (Karr et al., 2015). By analyzing monitoring data from a large number of sites that span a gradient of fishing intensity and reef condition, Karr et al. found that lower fish biomass was correlated with several other ecosystem condition variables, including decreased fish diversity and coral cover, and increased macroalgal cover. In this system, reductions in fish biomass are therefore a good potential indicator of forthcoming ecosystem shifts. Similar to research from the Indian Ocean (McClanahan et al., 2011), Karr et al. discovered that at two particular levels of fish biomass (50 and 30% of the mean unfished biomass in Caribbean no-take marine reserves, respectively), clusters of ecosystem condition metrics exhibited threshold responses. When fish biomass fell below the first threshold (50% of mean unfished biomass) they observed decreased fish species richness and increased macroalgal cover. When fish biomass fell below the second threshold (30% of mean unfished biomass) additional changes were detected, including reduced coral cover and urchin and herbivorous fish abundance and higher ratios of macroalgae to coral (see Figure 3 in Karr et al., 2015), indicative of a phase shift to algal dominance. Importantly, fish biomass thresholds and indicators were robust across scales (i.e., similar patterns are seen at local and regional scales) and can be used in data-limited systems. Using fish biomass as a threshold indicator shows promise for managing Caribbean coral reef health because proactive reef management is possible in areas where thresholds have not been crossed. In addition, monitoring costs to track fish biomass are relatively low.
Practicing Proactive, Threshold-based Adaptive Management
Timing of management intervention is critical to avoid a tipping point or restore a system that has already crossed one (Biggs et al., 2009). In some cases, it may be necessary to quickly implement management actions to avoid a tipping point. However, many management and political paradigms are not structured to support rapid decisionmaking and are often reactive rather than proactive. In many cases, this leads to thresholds being crossed rather than avoided, and leaves practitioners with the impractical and sometimes impossible task of trying to restore ecosystems to their previous state. In addition, the speed that a system responds to management intervention can vary depending on how quickly the system reacts to changes in external drivers (Hughes et al., 2013b). Some pressures have the potential to be eliminated quickly (e.g., by closing a fishery), but it may take years until effects of that action are seen on a system-wide scale, because ecosystem processes may respond to a management action on a slower time scale than drivers (Carpenter et al., 1999; Biggs et al., 2009). Implementing an adaptive management process that supports timely and responsive management actions that are tied to changes in ecosystem metrics helps promote prospective threshold-based management and can enhance management outcomes (Kelly et al., 2014).
The South Florida Management District used an adaptive management approach to identify what caused the Florida Bay ecosystem to undergo dramatic ecological changes and develop a recovery plan to avoid threshold responses in the system. Upstream land use changes in the 1970s caused salinity in Florida Bay to increase, eventually leading to a mass seagrass die-off in the late 1980s (Zieman et al., 1999; Gunderson, 2001; Madden et al., 2009). Loss of seagrass altered a suite of ecosystem conditions, including lower dissolved oxygen, higher nutrient concentrations, and reduced abundance of key grazers (Figure 2; Zieman et al., 1999). The system ultimately crossed a threshold into a new state where phytoplankton blooms began to plague the bay and commercially important fish populations plummeted (Zieman et al., 1999; Madden et al., 2009). Regional management authorities ultimately determined that increased salinity was the primary driver of seagrass mortality and broader ecosystem change. The South Florida Management District subsequently implemented the Minimum Flows and Levels program (F.A.C., 2012) to monitor freshwater inputs to the bay. When freshwater flows drop below a specific management target, upstream agricultural and municipal users are prohibited from diverting water. Managers also track ecological indicators of seagrass health, including distribution, cover, and species composition on a weekly basis. These data are used to determine efficacy of target-based control rules around water delivery and are critical for evaluating and adjusting management to avoid future tipping points (Rudnick et al., 2005; Madden et al., 2009). Through successful identification of the primary driver of change, ecosystem monitoring, and adaptive management actions, the South Florida Management District was able to control the driver and substantially improve health and stability of the seagrass community in the bay.
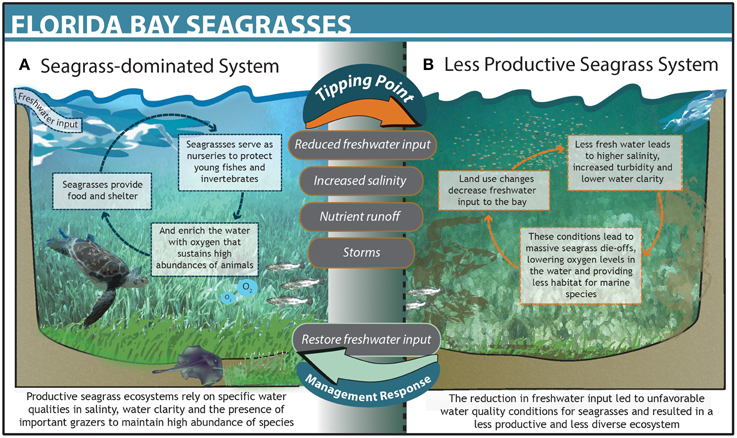
Figure 2. The dynamics and structure of Florida Bay before (A) and after (B) crossing a threshold. The upper gray text bubbles between states denote drivers that pushed the system across a threshold and lower bubbles denote management action taken that restored the systems to its previous state.
Managing Drivers and Ecosystem Response at Appropriate Scales
Smaller jurisdictional scales may have greater success meeting threshold-based targets than systems managed at larger scales (Kelly et al., 2014). The absolute size of “small” vs. “large” is likely to be related to the scale of the driver that is pushing a system toward a tipping point. Scheffer and Carpenter (2003) found that primary pressures in some small-scale systems, such as lakes, are more tractable from a management standpoint because local inputs can be regulated more quickly and effectively than regional inputs. Marine protected areas may be an effective management strategy for managing drivers and ecosystem response at small scales, as well as increasing the resilience of the ecosystem at larger scales (Ling et al., 2009; Dixson et al., 2014). In some cases, however, processes and drivers operating at larger scales can override the effects of small-scale management intervention or lead to unintended consequences (Walker et al., 2012). To the extent practical, practitioners should design and implement management actions aligned with the spatial scale of the driver they are targeting and the observed ecosystem response, while remaining aware of the potential for larger scale interactions. We contrast two examples below to show how these ideas have been used in management contexts. While these case studies come from two terrestrial systems, the methods used and lessons learned are highly transferrable to marine systems.
Scientists working in the Great Basin sagebrush rangelands in the western U.S. developed ecosystem state transition models that incorporated the ecological complexity of the system and quantified a number of biotic and abiotic thresholds driven by fire regimes, invasive species, and climate (Allen-Diaz and Bartolome, 1998; Briske et al., 2005; Petersen et al., 2009). Using these models, scientists deduced that cattle overgrazing the grasslands drove the system to cross a threshold of woody species abundance, leading to an increase in wildfire frequency, and intensity (Figure 3). The system reached a second threshold following significant erosion of the understory by fire, resulting in an overabundance of invasive grasses. Scientists developed models at the spatial scale of the ecosystem components most valued by managers, helping them identify the most management-relevant indicators for the system, such as percent bare ground between perennial native plants. In this system, however, solely understanding the spatially relevant dynamics was not enough to prevent continued overgrazing and subsequent threshold changes within invasive species–and fire-driven regimes. Applying threshold science in this context proved to be more complex than Florida Bay in part because the spatial scale of the system is larger, there are multiple agencies involved in managing the system, and some drivers (e.g., climate change) are not aligned with the scales of management.
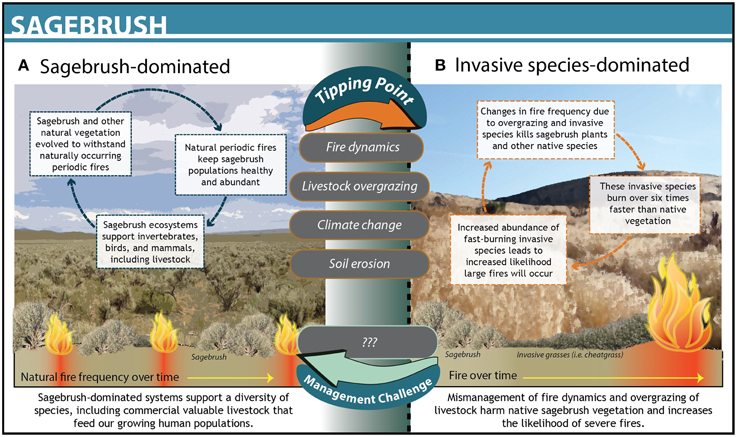
Figure 3. The dynamics and structure of Sagebrush grasslands in Nevada before (A) and after (B) crossing a threshold. The upper gray text bubbles between states denote drivers that pushed the system across a threshold. No management actions were taken in this system.
In many systems, it is likely that a combination of ecological features, threshold-based management, and spatially appropriate management will result in successful avoidance or recovery from non-linear threshold responses. Eglin Air Force Base in Florida, USA, has undertaken a massive restoration effort in recent years to facilitate the recovery of longleaf pine (Pinus palustris). At Eglin, the scale of management was closely matched to the scale of the longleaf pine ecosystem and the drivers—changes to local fire and soil disturbance regimes—that originally pushed the system beyond a tipping point (Hardesty et al., 2000). Longleaf pines historically covered much of the southeastern U.S. but were replaced by other, less fire-dependent species as fires were suppressed and the fire interval increased from years to decades (McCay, 2000). Isolated stands of longleaf pines existed at the base but were outcompeted by sand pines (Pinus clausa), which do not require fire for seed germination. After a multi-million dollar weapons testing contract was rejected due to Eglin's inability to describe potential impacts to the federally endangered red-cockaded woodpecker (Picoides borealis), which relies on longleaf pines for critical habitat, resource managers at Eglin developed a management plan to restore the population of longleaf pines. One of the main components of the plan, which was informed by scientific experiments and modeling, was a burn regime timed to better match the longleaf pine life cycle and targeted in areas that were suitable habitat for longleaf pines (Hardesty et al., 2000). By reintroducing fire to Eglin, managers reintroduced a driver in order to foster conditions that were present prior to the ecosystem shift. Managers and scientists also monitored recovery and used adaptive management to fine-tune fire regimes over time. Eglin Air Force Base now has the largest stand of longleaf pines in the U.S. and is a site of critical conservation importance (Hardesty et al., 2000). This management effort was largely successful because the scales of driver and ecosystem response were closely aligned, external drivers were minimal, monitoring occurred regularly, and management plans were adapted over time using data from experimental plots and models.
Methods and Tools in Development
The above examples highlight some of the ecological indicators and adaptive approaches already being used to aid management. To advance the science and application of ecosystem thresholds in resource management, scientists are working to develop additional tools that may improve our ability to determine if threshold behavior is likely to occur in an ecosystem, identify drivers, and estimate how quickly a threshold is approaching. To develop these tools, scientists are using evidence from systems that have exhibited threshold dynamics and adapting analytical tools and approaches from economics, climatology, and ecological modeling. In most cases, these analytical techniques use either spatially or temporally replicated data representing metrics of ecosystem condition, anthropogenic driver levels, and environmental factors that contribute to “background” variation in ecological state to account for noise in driver-response relationships. Non-parametric statistical methods that make no a priori assumptions about the shape of relationships are generally used to examine these datasets and characterize driver-response relationships. Below we describe some of the methods (Table 2) that are being used to derive estimates of thresholds (e.g., change-point analyses, redundancy analyses), understand what drives systems across thresholds (e.g., multivariate autoregressive state-space models, structural equation modeling), and develop early warning indicators of change (e.g., rising autocorrelation and variance). Each approach has its strengths and limitations, including aspects of data requirements, directionality, and applicability.
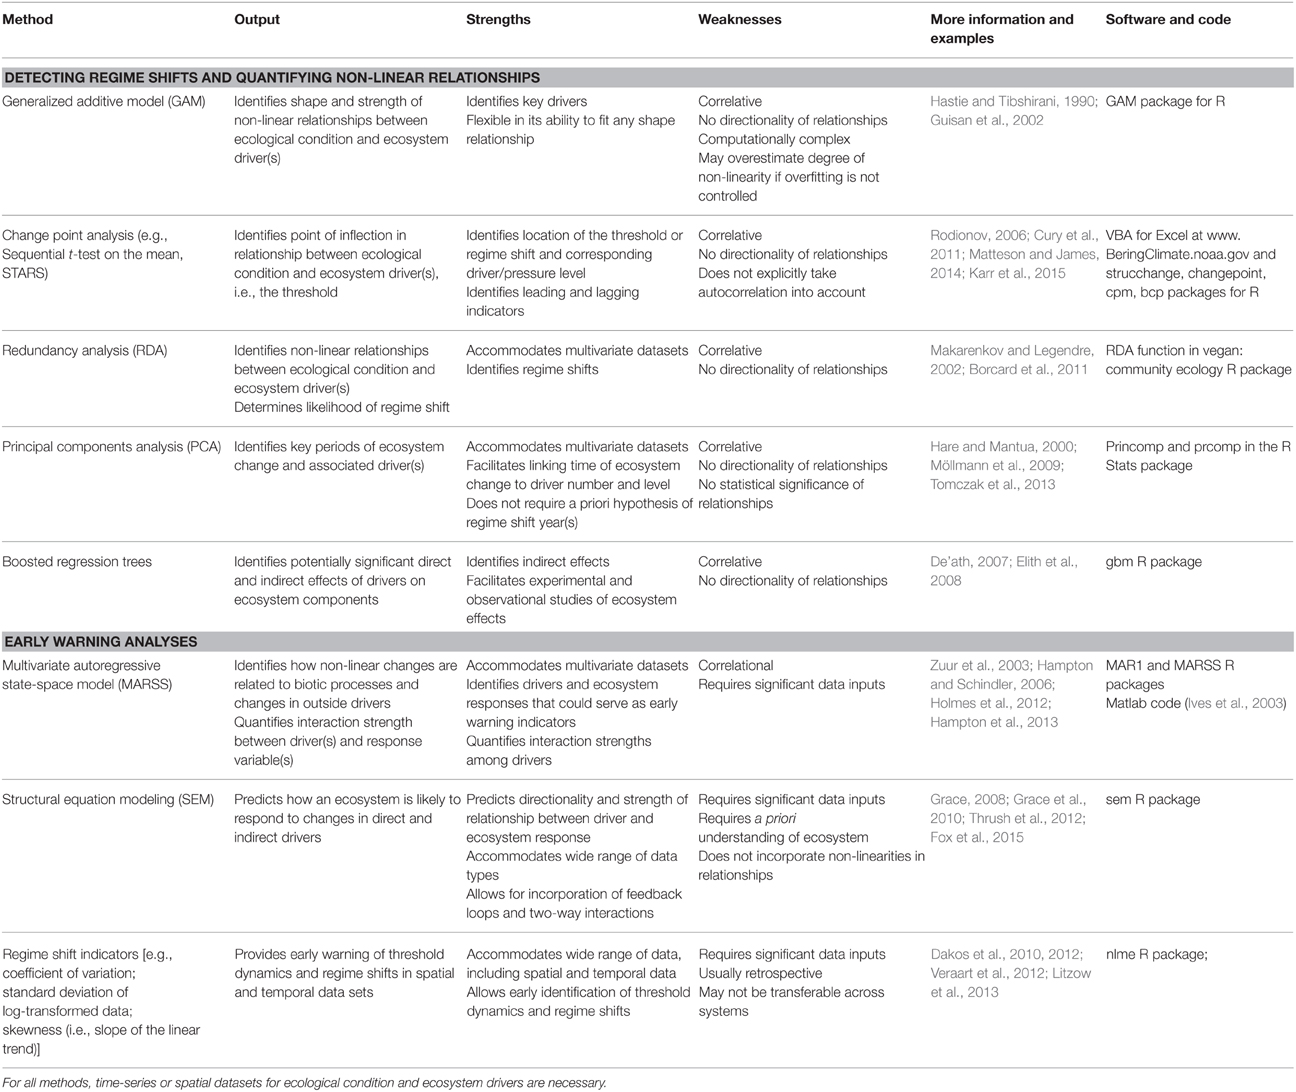
Table 2. Methods used to estimate ecosystem thresholds, identify drivers of change, and provide early warning of threshold response.
Correlational analysis can be used to fit non-linear relationships between drivers and ecosystem condition by assessing the levels of potential drivers at all sites (or time points). Generalized additive models (GAMs) are the most common statistical method used to examine such relationships, using effective degrees of freedom as a measure of the strength of non-linearity. Change-point analysis—sequential t-tests on the mean (STARS) or second derivatives—can then be used to identify the point of inflection or threshold in a non-linear relationship. For example, Cury et al. (2011) used GAMs to establish numerical relationships between seabird breeding success and prey abundance and then applied change-point analysis to find the most likely point at which the slope of the relationship changed, i.e., the threshold level of prey abundance that resulted in a rapid change in breeding success (see Figure 2A in Cury et al., 2011 for example of GAM and change-point analysis results). Their analysis resulted in a rule of thumb they called “one-third for the birds,” which provides a simple and quantitative target for managers to consider when evaluating forage fish abundance and determining allowable catch.
Multivariate statistical tests such as principal components analysis (PCA) and redundancy analysis (RDA) are also useful for examining relationships between drivers and ecological responses, identifying regime shifts, and, in combination with change point approaches described above, determining thresholds, particularly in multivariate datasets. For example, scientists have identified regime shifts in the Central Baltic (see Box 1) by applying PCA to environmental time-series data to determine key periods of ecosystem change, followed by STARS analysis to identify the threshold (Möllmann et al., 2009; Tomczak et al., 2013). Redundancy analysis is a similar approach that can account for non-linear relationships between drivers and ecological responses (Makarenkov and Legendre, 2002; Borcard et al., 2011). Perry and Masson (2013) used RDA to analyze regime shifts in the Salish Sea. They identified a set of six explanatory variables (Chinook salmon hatchery releases, recreational fishing effort, human population size, sea surface temperature, wind, and the North Pacific Gyre Oscillation index) as good predictors of regime shifts. Other methods like boosted regression trees are also being used to identify potentially significant indirect and direct effects in ecosystems, and facilitate hypothesis-driven experimental and observational studies (Elith et al., 2008; Jouffray et al., 2015). While these approaches can be used to identify potential early warning indicators for monitoring ecosystem change, one disadvantage is that they are correlative and thus do not consider directionality (e.g., fishing effort could both influence and be influenced by ecosystem condition).
There are additional multivariate approaches that are better suited to detect patterns in time-series data. For example, dynamic factor analysis (DFA) is a dimension-reduction technique that can be used to examine relationships between response and explanatory variables (Zuur et al., 2003). Scientists have applied DFA to compare trends across ecosystems (Link et al., 2009) and to identify the major drivers of ecosystem changes, such as relationships between warmer sea surface temperatures and higher salmon abundance in the Gulf of Alaska and eastern Bering Sea (Stachura et al., 2013). Multivariate autoregressive state-space models (MARSS) can be used to examine how non-linear responses in ecological communities are related to biotic processes and changes in exogenous drivers (Hampton and Schindler, 2006). The strength of MARSS models is that they can focus attention on key drivers of community change and quantify interaction strengths among drivers. Choosing among these models will depend on the question of interest, the data type, and model assumptions.
While these statistical approaches can be used to identify correlations among drivers and responses, other methods go beyond correlation and can be used to determine the directionality of these relationships. One powerful technique for this is structural equation modeling (SEM), which enhances the ability to distinguish between alternative hypotheses, examining how properties of the ecosystem will respond to a set of direct and indirect drivers (Grace, 2008; Grace et al., 2010). For example, applying SEM to both experimental and observational data, Elahi and Sebens (2012) found that sea urchins are predominantly responsible for creating available space in rocky subtidal ecosystems by grazing algae, but other grazers (i.e., chitons) also play an important role, suggesting the system has some redundancy in the grazer functional role, which may change the threshold dynamics of the system. The SEM approach is flexible (Grace, 2008) but requires significant data inputs and a good a priori understanding of the system (Grace et al., 2010).
In many ecosystems, the potential for threshold dynamics was discovered only in hindsight by applying these or other statistical methods after a threshold had been crossed. While these studies can be useful, being able to anticipate and avoid them helps practitioners to make more efficient, proactive, and sustainable resource management choices. To date, much of this research has focused on developing early warning indicators—metrics that trend in parallel to complex ecosystem dynamics (Box 2; Scheffer et al., 2009, 2012; Dakos et al., 2012). A phenomenon known as “critical slowing down” (Drake and Griffen, 2010; Dakos et al., 2012), in which the time it takes a system to recover from a disturbance increases due to loss of resilience, is thought to be one of the most robust early warning indicators of an impending ecological threshold being reached (Scheffer et al., 2009). Other indicators that a system may be approaching an ecosystem threshold include “flickering” between alternate ecosystem states (Dakos et al., 2012), increased autocorrelation (Biggs et al., 2009; Dakos et al., 2010, 2012), and increased variability (Carpenter and Brock, 2006; Daskalov et al., 2007). While their potential is alluring, some scientists question the utility and generality of these early warning indicators (e.g., Boettiger and Hastings, 2012). Boettiger and Hastings suggest it is unlikely that general indicators exist across systems because the context in which a system approaches a threshold is likely to be unique. Instead, they push for data-driven exploration—such as the analyses described above—and experimentation within systems to identify system-specific characteristics of impending thresholds.
BOX 2. MAJOR CATEGORIES OF EARLY WARNING INDICATORS (EWI).
Critical slowing down and flickering. As a system approaches a threshold, the time it takes a system to recover from a disturbance increases due to loss of resilience (Scheffer et al., 2009) and the structure and/or function of the ecosystem starts to alternate between two states over a short time period (Dakos et al., 2012).
Autocorrelation. Change across ecosystems tends to become correlated in space and time prior to a tipping point (Biggs et al., 2009; Kéfi et al., 2014). This shift occurs when large-scale dynamics dominate ecosystem response rather than within system dynamics that maintained stability and functioning prior to ecosystem decline.
Variance. The response of ecosystem components to drivers becomes more variable as a threshold is approached. Increased variance can be detected with little underlying knowledge of “normal” ecosystem dynamics (Carpenter and Brock, 2006; Litzow et al., 2013), and can be detected in spatial and temporal analyses (Donangelo et al., 2010).
One of the current challenges to the validity of many of the early warning indicators developed to date is that they have mainly been tested using model simulations (Kéfi et al., 2014). Researchers rely on model simulations because they can generate high resolution, long-term data series, which are required for these methods but are rare in real-world systems. To advance the applicability of these largely theoretical simulations, researchers are beginning to test these indicators in experimental and natural biological systems, incorporating key metrics such as variance, autocorrelation, and time lags into traditional ecological sampling and analysis designs. For example, Veraart et al. (2012) tested the applicability of critical slowing down as an early warning indicator in populations of cyanobacteria. As predicted, cyanobacteria populations declined non-linearly once a critical light level was surpassed. As the cyanobacteria populations approached the light threshold, their ability to recover from small pressures consistently decreased. In one of the few tests of theoretical early warning indicators using real ecosystem data, Litzow et al. detected rising spatial variance in fisheries catch time series as a precursor to historical fishing collapses in the Gulf of Alaska and Bering Sea (Litzow et al., 2013).
Conclusion
Many ecosystems are at risk of crossing a threshold due to background disturbances and anthropogenic pressures that erode natural resilience, increasing their susceptibility to large, stochastic disturbances (Scheffer et al., 2001a; Folke et al., 2004; Hughes et al., 2013b). While researchers are making great progress in repurposing analyses and developing early warning indicators, numerous challenges remain in the application of threshold and early warning indicator science to management and policy. In spite of these challenges, as we have shown with multiple examples, practitioners can manage for thresholds now using quantitative targets, responsive monitoring, and appropriately scaled management actions. While these metrics and features do not indicate how close a system is to a threshold, they are important for building practitioners' capacity to consider and avoid thresholds. As additional tools and analyses are further refined, managers can also continue developing an improved understanding of their system and the type of ecological response that is most likely to occur if a threshold is crossed. Improving our understanding of complex ecological interactions and the application of theory to real management needs will increase our ability to detect and avoid ecological thresholds and facilitate better management outcomes and the development of adaptive management strategies.
Author Contributions
All authors contributed to reviewing the literature and writing and editing of the manuscript.
Conflict of Interest Statement
The authors declare that the research was conducted in the absence of any commercial or financial relationships that could be construed as a potential conflict of interest.
Acknowledgments
This publication is part of a larger effort from the Ocean Tipping Points project (oceantippingpoints.org) that is funded by the Gordon and Betty Moore Foundation. We acknowledge the many conversations with colleagues in this project that helped inform this work.
References
Alheit, J., Möllmann, C., Dutz, J., Kornilovs, G., Loewe, P., Mohrholz, V., et al. (2005). Synchronous ecological regime shifts in the central Baltic and the North Sea in the late 1980s. ICES J. Mar. Sci. 62, 1205–1215. doi: 10.1016/j.icesjms.2005.04.024
Allen-Diaz, B., and Bartolome, J. W. (1998). Sagebrush grass vegetation dynamics: comparing classical and state-transition models. Ecol. Appl. 8, 795–804.
Bestelmeyer, B. T., Ellison, A. M., Fraser, W. R., Gorman, K. B., Holbrook, S. J., Laney, C. M., et al. (2011). Analysis of abrupt transitions in ecological systems. Ecosphere 2, art129. doi: 10.1890/ES11-00216.1
Biggs, R., Carpenter, S. R., and Brock, W. A. (2009). Turning back from the brink: detecting an impending regime shift in time to avert it. Proc. Nat. Acad. Sci. U.S.A. 106, 826–831. doi: 10.1073/pnas.0811729106
Boettiger, C., and Hastings, A. (2012). Quantifying limits to detection of early warning for critical transitions. J. R. Soc. Inter. 9, 2527–2539. doi: 10.1098/rsif.2012.0125
Borcard, D., Gillet, F., and Legendre, P. (2011). “Unconstrained ordination,” in Numerical Ecology with R (New York, NY: Springer), 115–151. doi: 10.1007/978-1-4419-7976-6_5
Briske, D. D., Fuhlendorf, S. D., and Smeins, F. E. (2005). State-and-transition models, thresholds, and rangeland health: a synthesis of ecological concepts and perspectives. Rangeland Ecol. Manag. 58, 1–10. doi: 10.2111/1551-5028(2005)58<1:SMTARH>2.0.CO;2
Briske, D. D., Fuhlendorf, S. D., and Smeins, F. E. (2006). A unified framework for assessment and application of ecological thresholds. Rangeland Ecol. Manag. 59, 225–236. doi: 10.2111/05-115R.1
Burkett, V. R., Wilcox, D. A., Stottlemyer, R., Barrow, W., Fagre, D., Baron, J., et al. (2005). Nonlinear dynamics in ecosystem response to climatic change: case studies and policy implications. Ecol. Complex. 2, 357–394. doi: 10.1016/j.ecocom.2005.04.010
Carpenter, S. R., and Brock, W. A. (2006). Rising variance: a leading indicator of ecological transition. Ecol. Lett. 9, 311–318. doi: 10.1111/j.1461-0248.2005.00877.x
Carpenter, S. R., Ludwig, D., and Brock, W. A. (1999). Management of eutrophication for lakes subject to potentially irreversible change. Ecol. Appl. 9, 751–771. doi: 10.1890/1051-0761(1999)009[0751:MOEFLS]2.0.CO;2
Casini, M., Hjelm, J., Molinero, J.-C., Lövgren, J., Cardinale, M., Bartolino, V., et al. (2009). Trophic cascades promote threshold-like shifts in pelagic marine ecosystems. Proc. Nat. Acad. Sci. U.S.A. 106, 197–202. doi: 10.1073/pnas.0806649105
Crain, C. M., Kroeker, K., and Halpern, B. S. (2008). Interactive and cumulative effects of multiple human stressors in marine systems. Ecol. Lett. 11, 1304–1315. doi: 10.1111/j.1461-0248.2008.01253.x
Cury, P. M., Boyd, I. L., Bonhommeau, S., Anker-Nilssen, T., Crawford, R. J., Furness, R. W., et al. (2011). Global seabird response to forage fish depletion—one-third for the birds. Science 334, 1703–1706. doi: 10.1126/science.1212928
Dakos, V., van Nes, E. H., D'Odorico, P., and Scheffer, M. (2012). Robustness of variance and autocorrelation as indicators of critical slowing down. Ecology 93, 264–271. doi: 10.1890/11-0889.1
Dakos, V., van Nes, E. H., Donangelo, R., Fort, H., and Scheffer, M. (2010). Spatial correlation as leading indicator of catastrophic shifts. Theor. Ecol. 3, 163–174. doi: 10.1007/s12080-009-0060-6
Daskalov, G. M., Grishin, A. N., Rodionov, S., and Mihneva, V. (2007). Trophic cascades triggered by overfishing reveal possible mechanisms of ecosystem regime shifts. Proc. Nat. Acad. Sci. U.S.A. 104, 10518–10523. doi: 10.1073/pnas.0701100104
De'ath, G. (2007). Boosted trees for ecological modeling and prediction. Ecology 88, 243–251. doi: 10.1890/0012-9658(2007)88[243:BTFEMA]2.0.CO;2
Dixson, D. L., Abrego, D., and Hay, M. E. (2014). Chemically mediated behavior of recruiting corals and fishes: a tipping point that may limit reef recovery. Science 345, 892–897. doi: 10.1126/science.1255057
Donangelo, R., Fort, H., Dakos, V., Scheffer, M., and van Nes, E. H. (2010). Early warnings for catastrophic shifts in ecosystems: comparison between spatial and temporal indicators. Int. J. Bifurcat. Chaos 20, 315–321. doi: 10.1142/S0218127410025764
Drake, J. M., and Griffen, B. D. (2010). Early warning signals of extinction in deteriorating environments. Nature 467, 456–459. doi: 10.1038/nature09389
Elahi, R., and Sebens, K. P. (2012). Consumers mediate natural variation between prey richness and resource use in a benthic marine community. Mar. Ecol. Prog. Ser. 452, 131. doi: 10.3354/meps09603
Elith, J., Leathwick, J. R., and Hastie, T. (2008). A working guide to boosted regression trees. J. Anim. Ecol. 77, 802–813. doi: 10.1111/j.1365-2656.2008.01390.x
F.A.C. (2012). 40E Florida Administrative Code Section 8.011 - Minimum Water Flows and Levels. West Palm Beach, FL: Florida Administrative Code; South Florida Water Management District.
Foley, M. M., Halpern, B. S., Micheli, F., Armsby, M. H., Caldwell, M. R., Crain, C. M., et al. (2010). Guiding ecological principles for marine spatial planning. Mar. Policy 34, 955–966. doi: 10.1016/j.marpol.2010.02.001
Folke, C., Carpenter, S., Walker, B., Scheffer, M., Elmqvist, T., Gunderson, L., et al. (2004). Regime shifts, resilience, and biodiversity in ecosystem management. Annu. Rev. Ecol. Evol. Syst. 35, 557–581. doi: 10.1146/annurev.ecolsys.35.021103.105711
Fox, J., Nie, Z., Byrnes, J., Culbertson, M., Debroy, S., Friendly, M., et al. (2015). SEM: Structural Equation Models. Available online at: http://cran.r-project.org/web/packages/sem/sem.pdf
Grace, J. B. (2008). Structural equation modeling for observational studies. J. Wildl. Manage. 72, 14–22. doi: 10.2193/2007-307
Grace, J. B., Anderson, T. M., Olff, H., and Scheiner, S. M. (2010). On the specification of structural equation models for ecological systems. Ecol. Monogr. 80, 67–87. doi: 10.1890/09-0464.1
Groffman, P. M., Baron, J. S., Blett, T., Gold, A. J., Goodman, I., Gunderson, L. H., et al. (2006). Ecological thresholds: the key to successful environmental management or an important concept with no practical application? Ecosystems 9, 1–13. doi: 10.1007/s10021-003-0142-z
Guisan, A., Edwards, T. C., and Hastie, T. (2002). Generalized linear and generalized additive models in studies of species distributions: setting the scene. Ecol. Modell. 157, 89–100. doi: 10.1016/S0304-3800(02)00204-1
Gunderson, L. H. (2001). South Florida: the reality of change and the prospects for sustainability: managing suprising ecosystems in Southern Florida. Ecol. Econ. 37, 371–378. doi: 10.1016/S0921-8009(01)00179-3
Halpern, B. S., Frazier, M., Potapenko, J., Casey, K. S., Koenig, K., Longo, C., et al. (2015). Spatial and temporal changes in cumulative human impacts on the world's ocean. Nat. Commun. 6:7615. doi: 10.1038/ncomms8615
Halpern, B. S., and Fujita, R. (2013). Assumptions, challenges, and future directions in cumulative impact analysis. Ecosphere 4, art131. doi: 10.1890/ES13-00181.1
Halpern, B. S., Walbridge, S., Selkoe, K. A., Kappel, C. V., Micheli, F., D'Agrosa, C., et al. (2008). A global map of human impact on marine ecosystems. Science 319, 948–952. doi: 10.1126/science.1149345
Hampton, S. E., Holmes, E. E., Scheef, L. P., Scheuerell, M. D., Katz, S. L., Pendleton, D. E., et al. (2013). Quantifying effects of abiotic and biotic drivers on community dynamics with multivariate autoregressive (MAR) models. Ecology 94, 2663–2669. doi: 10.1890/13-0996.1
Hampton, S. E., and Schindler, D. E. (2006). Empirical evaluation of observation scale effects in community time series. Oikos 113, 424–439. doi: 10.1111/j.2006.0030-1299.14643.x
Hardesty, J., Adams, J., Gordon, D., and Provencher, L. (2000). Simulating management with models. Conserv. Pract. 1, 26–32. doi: 10.1111/j.1526-4629.2000.tb00157.x
Hare, S. R., and Mantua, N. J. (2000). Empirical evidence for North Pacific regime shifts in 1977 and 1989. Prog. Oceanogr. 47, 103–145. doi: 10.1016/S0079-6611(00)00033-1
Hastie, T., and Tibshirani, R. (1990). Exploring the nature of covariate effects in the proportional hazards model. Biometrics 46, 1005–1016. doi: 10.2307/2532444
Holmes, E. E., Ward, E. J., and Wills, K. (2012). Marss: multivariate autoregressive state-space models for analyzing time-series data. R J. 4, 11–19.
Huggett, A. J. (2005). The concept and utility of ‘ecological thresholds’ in biodiversity conservation. Biol. Conserv. 124, 301–310. doi: 10.1016/j.biocon.2005.01.037
Hughes, B. B., Eby, R., van Dyke, E., Tinker, M. T., Marks, C. I., Johnson, K. S., et al. (2013a). Recovery of a top predator mediates negative eutrophic effects on seagrass. Proc. Nat. Acad. Sci. U.S.A. 110, 15313–15318. doi: 10.1073/pnas.1302805110
Hughes, T. P. (1994). Catastrophies, phase-shifts, and large-scale degradation of a Caribbean coral-reef. Science 265, 1547–1551. doi: 10.1126/science.265.5178.1547
Hughes, T. P., Linares, C., Dakos, V., van de Leemput, I. A., and van Nes, E. H. (2013b). Living dangerously on borrowed time during slow, unrecognized regime shifts. Trends Ecol. Evol. 28, 149–155. doi: 10.1016/j.tree.2012.08.022
Hunsicker, M. E., Kappel, C. V., Selkoe, K. A., Halpern, B. S., Scarborough, C., and Mease, L. (in press). Characterizing driver-response relationships in marine pelagic ecosystems for improved ocean management. Ecol. Appl. doi: 10.1890/14-2200.1
Ives, A., Dennis, B., Cottingham, K., and Carpenter, S. (2003). Estimating community stability and ecological interactions from time-series data. Ecol. Monogr. 73, 301–330. doi: 10.1890/0012-9615(2003)073[0301:ECSAEI]2.0.CO;2
Jouffray, J.-B., Nyström, M., Norström, A. V., Williams, I. D., Wedding, L. M., Kittinger, J. N., et al. (2015). Identifying multiple coral reef regimes and their drivers across the Hawaiian archipelago. Philos. Trans. R. Soc. B Biol. Sci. 370:20130268. doi: 10.1098/rstb.2013.0268
Karr, K. A., Fujita, R., Halpern, B. S., Kappel, C. V., Crowder, L., Selkoe, K. A., et al. (2015). Thresholds in Caribbean coral reefs: implications for ecosystem-based fishery management. J. Appl. Ecol. 52, 402–412. doi: 10.1111/1365-2664.12388
Kéfi, S., Guttal, V., Brock, W. A., Carpenter, S. R., Ellison, A. M., Livina, V. N., et al. (2014). Early warning signals of ecological transitions: methods for spatial patterns. PLoS ONE 9:e92097. doi: 10.1371/journal.pone.0092097
Kelly, R. P., Erickson, A. L., and Mease, L. A. (2014). How not to fall off a cliff, or using tippin gpoints to improve environmental management. Ecol. Law Q. 41, 843–886.
Kelly, R. P., Erickson, A. L., Mease, L. A., Battista, W., Kittinger, J. N., and Fujita, R. (2015). Embracing thresholds for better environmental management. Philos. Trans. R. Soc. B Biol. Sci. 370:20130276. doi: 10.1098/rstb.2013.0276
Kittinger, J. N., Finkbeiner, E. M., Glazier, E. W., and Crowder, L. B. (2012). Human dimensions of coral reef social-ecological systems. Ecol. Soc. 17:17. doi: 10.5751/ES-05115-170417
Knights, A. M., Koss, R. S., and Robinson, L. A. (2013). Identifying common pressure pathways from a complex network of human activities to support ecosystem-based management. Ecol. Appl. 23, 755–765. doi: 10.1890/12-1137.1
Knowlton, N. (2004). Multiple “stable” states and the conservation of marine ecosystems. Prog. Oceanogr. 60, 387–396. doi: 10.1016/j.pocean.2004.02.011
Lindegren, M., Diekmann, R., and Möllmann, C. (2010). Regime shifts, resilience and recovery of a cod stock. Mar. Ecol. Prog. Ser. 402, 239–253. doi: 10.3354/meps08454
Ling, S. D., Johnson, C. R., Frusher, S. D., and Ridgway, K. R. (2009). Overfishing reduces resilience of kelp beds to climate-driven catastrophic phase shift. Proc. Nat. Acad. Sci. U.S.A. 106, 22341–22345. doi: 10.1073/pnas.0907529106
Link, J. S., Stockhausen, W. T., Skaret, G., Overholtz, W., Megrey, B. A., Gjøsæter, H., et al. (2009). A comparison of biological trends from four marine ecosystems: synchronies, differences, and commonalities. Prog. Oceanogr. 81, 29–46. doi: 10.1016/j.pocean.2009.04.004
Litzow, M. A., Mueter, F. J., and Urban, J. D. (2013). Rising catch variability preceded historical fisheries collapses in Alaska. Ecol. Appl. 23, 1475–1487. doi: 10.1890/12-0670.1
Madden, C. J., Rudnick, D. T., McDonald, A. A., Cunniff, K. M., and Fourqurean, J. W. (2009). Ecological indicators for assessing and communicating seagrass status and trends in Florida Bay. Ecol. Indic. 9S, S68–S82. doi: 10.1016/j.ecolind.2009.02.004
Makarenkov, V., and Legendre, P. (2002). Nonlinear redundancy analysis and canonical correspondence analysis based on polynomial regression. Ecology 83, 1146–1161. doi: 10.1890/0012-9658(2002)083[1146:NRAACC]2.0.CO;2
Matteson, D. S., and James, N. A. (2014). A nonparametric approach for multiple change point analysis of multivariate data. J. Am. Stat. Assoc. 109, 334–345. doi: 10.1080/01621459.2013.849605
McCay, D. H. (2000). Effects of chronic human activities on invasion of longleaf pine forests by sand pine. Ecosystems 3, 283–292. doi: 10.1007/s100210000026
McClanahan, T. R., Graham, N. A., MacNeil, M. A., Muthiga, N. A., Cinner, J. E., Bruggemann, J. H., et al. (2011). Critical thresholds and tangible targets for ecosystem-based management of coral reef fisheries. Proc. Nat. Acad. Sci. U.S.A. 108, 17230–17233. doi: 10.1073/pnas.1106861108
McLeod, K. L., and Leslie, H. (2009). Ecosystem-Based Management for the Oceans. Washington, DC: Island Press.
Möllmann, C., Diekmann, R., Müller-Karluis, B., Kornilovs, G., Plikshs, M., and Axe, P. (2009). Reorganization of a large marine ecosystem due to atmospheric and anthropogenic pressure: a discontinuous regime shift in the Central Baltic Sea. Glob. Change Biol. 15, 1377–1393. doi: 10.1111/j.1365-2486.2008.01814.x
Mora, C. (2009). Degradation of Caribbean coral reefs: focusing on proximal rather than ultimate drivers. Reply to Rogers. Proc. R. Soc. B Biol. Sci. 276, 199–200. doi: 10.1098/rspb.2008.1289
Nyström, M., Norström, A. V., Blenckner, T., de La Torre-Castro, M., Eklöf, J. S., Folke, C., et al. (2012). Confronting feedbacks of degraded marine ecosystems. Ecosystems 15, 695–710. doi: 10.1007/s10021-012-9530-6
Osman, R. W., Munguia, P., Whitlatch, R. B., Zajac, R. N., and Hamilton, J. (2010). Thresholds and multiple community states in marine fouling communities: integrating natural history with management strategies. Mar. Ecol. Prog. Ser. 413, 277–289. doi: 10.3354/meps08673
Perry, R. I., and Masson, D. (2013). An integrated analysis of the marine social-ecological system of the Strait of Georgia, Canada, over the past four decades, and development of a regime shift index. Prog. Oceanogr. 115, 14–27. doi: 10.1016/j.pocean.2013.05.021
Petersen, S. L., Stringham, T. K., and Roundy, B. A. (2009). A process-based application of state-and-transition models: a case study of Western Juniper (Juniperus occidentalis) encroachment. Rangeland Ecol. Manage. 62, 186–192. doi: 10.2111/06-171.1
Rodionov, S. N. (2006). Use of prewhitening in climate regime shift detection. Geophys. Res. Lett. 33:L12707. doi: 10.1029/2006GL025904
Rudnick, D. T., Ortner, P. B., Browder, J. A., and Davis, S. M. (2005). A conceptual ecological model of Florida Bay. Wetlands 25, 870–883. doi: 10.1672/0277-5212(2005)025[0870:ACEMOF]2.0.CO;2
Samhouri, J. F., Levin, P. S., and Harvey, C. J. (2009). Quantitative evaluation of marine ecosystem indicator performance using food web models. Ecosystems 12, 1283–1298. doi: 10.1007/s10021-009-9286-9
Samhouri, J. F., Levin, P. S., James, C. A., Kershner, J., and Williams, G. (2011). Using existing scientific capacity to set targets for ecosystem-based management: a puget sound case study. Mar. Policy 35, 508–518. doi: 10.1016/j.marpol.2010.12.002
Scheffer, M., Bascompte, J., Brock, W. A., Brovkin, V., Carpenter, S. R., Dakos, V., et al. (2009). Early-warning signals for critical transitions. Nature 461, 53–59. doi: 10.1038/nature08227
Scheffer, M., Carpenter, S., Foley, J. A., Folke, C., and Walker, B. (2001a). Catastrophic shifts in ecosystems. Nature 413, 591–596. doi: 10.1038/35098000
Scheffer, M., and Carpenter, S. R. (2003). Catastrophic regime shifts in ecosystems: linking theory to observation. Trends Ecol. Evol. 18, 648–656. doi: 10.1016/j.tree.2003.09.002
Scheffer, M., Carpenter, S. R., Lenton, T. M., Bascompte, J., Brock, W., Dakos, V., et al. (2012). Anticipating critical transitions. Science 338, 344–348. doi: 10.1126/science.1225244
Scheffer, M., Straile, D., van Nes, E. H., and Hosper, H. (2001b). Climatic warming causes regime shifts in lake food webs. Limnol. Oceanogr. 46, 1780–1783. doi: 10.4319/lo.2001.46.7.1780
Stachura, M. M., Mantua, N. J., Scheuerell, M. D., and Bradford, M. (2013). Oceanographic influences on patterns in North Pacific salmon abundance. Can. J. Fish. Aquat. Sci. 71, 226–235. doi: 10.1139/cjfas-2013-0367
Suding, K. N., and Hobbs, R. J. (2009). Threshold models in restoration and conservation: a developing framework. Trends Ecol. Evol. 24, 271–279. doi: 10.1016/j.tree.2008.11.012
Thrush, S. F., Hewitt, J. E., and Lohrer, A. M. (2012). Interaction networks in coastal soft-sediments highlight the potential for change in ecological resilience. Ecol. Appl. 22, 1213–1223. doi: 10.1890/11-1403.1
Tomczak, M. T., Heymans, J. J., Yletyinen, J., Niiranen, S., Otto, S. A., and Blenckner, T. (2013). Ecological network indicators of ecosystem status and change in the Baltic Sea. PLoS ONE 8:e75439. doi: 10.1371/journal.pone.0075439
Veraart, A. J., Faassen, E. J., Dakos, V., van Nes, E. H., Lürling, M., and Scheffer, M. (2012). Recovery rates reflect distance to a tipping point in a living system. Nature 481, 357–359. doi: 10.1038/nature11029
Walker, B. H., Carpenter, S. R., Rockstrom, J., Crépin, A.-S., and Peterson, G. D. (2012). Drivers, “slow” variables, “fast” variables, shocks, and resilience. Ecol. Soc. 17:30. doi: 10.5751/ES-05063-170330
Wang, R., Dearing, J. A., Langdon, P. G., Zhang, E., Yang, X., Dakos, V., et al. (2012). Flickering gives early warning signals of a critical transition to a eutrophic lake state. Nature 492, 419–422. doi: 10.1038/nature11655
Zieman, J. C., Fourqurean, J. W., and Frankovich, T. A. (1999). Seagrass die-off in Florida Bay: long-term trends in abundance and growth of turtlegrass, Thalassia testundinum. Estuaries 22, 460–470. doi: 10.2307/1353211
Keywords: thresholds, early warning indicators, non-linear change, resilience, tipping point, recovery
Citation: Foley MM, Martone RG, Fox MD, Kappel CV, Mease LA, Erickson AL, Halpern BS, Selkoe KA, Taylor P and Scarborough C (2015) Using Ecological Thresholds to Inform Resource Management: Current Options and Future Possibilities. Front. Mar. Sci. 2:95. doi: 10.3389/fmars.2015.00095
Received: 04 September 2015; Accepted: 22 October 2015;
Published: 09 November 2015.
Edited by:
Ellen Hines, San Francisco State University, USAReviewed by:
Marco Milazzo, University of Palermo, ItalyRochelle Diane Seitz, Virginia Institute of Marine Science, USA
Copyright © 2015 Foley, Martone, Fox, Kappel, Mease, Erickson, Halpern, Selkoe, Taylor and Scarborough. This is an open-access article distributed under the terms of the Creative Commons Attribution License (CC BY). The use, distribution or reproduction in other forums is permitted, provided the original author(s) or licensor are credited and that the original publication in this journal is cited, in accordance with accepted academic practice. No use, distribution or reproduction is permitted which does not comply with these terms.
*Correspondence: Melissa M. Foley, mfoley@usgs.gov
†Present Address: Melissa M. Foley, U.S. Geological Survey, Pacific Coastal and Marine Science Center, Santa Cruz, USA;
Michael D. Fox, Center for Marine Biodiversity and Conservation, Scripps Institution of Oceanography, La Jolla, CA, USA