Sound Science: Maintaining Numerical and Statistical Standards in the Pursuit of Noise Exposure Criteria for Marine Mammals
 Andrew J. Wright
- Environmental Science and Policy, George Mason University, Fairfax, VA, USA
Establishing noise exposure criteria for marine mammals has proven to be a difficult and contentious issue. Over the last decade, several attempts have been made to provide scientifically-based exposure criteria. While representing the “best available science” on the issue, these criteria, and the assumptions underpinning them, have led to considerable discussion among both scientists and policy-makers. However, one area where there has been little or no debate is around the use of appropriate statistical and other numerical procedures in the various criteria-establishing methodologies. A common issue, arising from a desire to include as much data as possible, is pseudoreplication. Examples from acoustic criteria are the use of many data points from a single animal to establish a value for one species and the use of several points from one species to set values for a functional hearing group. Less fundamental, but equally problematic for the application of the criteria to policy, is the failure to adequately represent uncertainty around proposed criteria through the use of confidence intervals. Other issues include the uneven treatment of different data in terms of transformation protocols and extrapolation, and the determination of which “outliers” to discard. Each of these errors introduces bias into the resulting criteria. Thus, despite the paucity of relevant data, we need to meet such statistical standards to truly provide objective advice that rises to the level of the “best available science.”
Introduction
Establishing noise exposure criteria for marine mammals has proven to be a difficult and contentious issue. Early limits were set mostly on expert opinion, allowing for extensive debate over their merits. There was thus much interest in the first comprehensive attempt to address the issue with scientifically-based methodology (Southall et al., 2007). Despite criticisms, this methodology represented, at the time, the “best available science” on the issue. Although not universally adopted, this methodology has been subsequently adapted and expanded (National Oceanic and Atmospheric Administration (NOAA), 2013, based largely on Finneran and Jenkins, 2012), criticized and counter-proposed (e.g., Wood et al., 2012; Tougaard et al., 2015), and revised (NOAA, 2015, based largely on Finneran, 2015).
Much of the discussions have been focused on how to use auditory weighting appropriately for marine mammals where data is lacking or non-existent. Weighting functions (which are effectively the mirror image of an audiogram) are used to determine the level of sound as it is perceived by any given animal. For example, the level of a dog whistle is down-weighted substantially under human weighting curves as we are not very sensitive (if at all) at those frequencies. Southall et al. (2007) produce fairly flat M-weighting curves for five functional hearing groups, the application of which drew criticism from Tougaard et al. (2015). Criteria proposed since have been moving toward applying species-specific inverse-audiograms (much like human A-weighting; Finneran and Jenkins, 2012; NOAA, 2013; Tougaard et al., 2015). However, disagreement persists over if, or how, these can be applied to the management of species gathered in groups, even those based on related hearing capabilities (e.g., Finneran, 2015; Tougaard et al., 2015).
Other major areas of disagreement include: the use of individual species to represent entire hearing groups; the extrapolation of any data to the low-frequency hearing group (baleen whales) where no data exist; the use of masked hearing thresholds; what exactly represents the onset of “injury”; and how natural variability should be considered. The applicability of data on hearing and threshold shifts collected using different methodologies and the transition of pulsed to non-pulsed sounds with distance from the source are likely to be added to this list following decisions made in the latest criteria proposal (NOAA, 2015).
One area where there has been little or no debate is around the use of appropriate statistical and other numerical procedures. This may be because there is no significance testing involved, which would probably have led more scientists to consider this aspect. However, establishing noise exposure criteria involves several numerical elements that should be subjected to statistical standards and other numerical best practice. Accordingly, this manuscript discusses some of these concerns, drawing from several attempts to propose criteria, but focusing on the most recent (NOAA, 2015) proposal given that it supersedes much included in the earlier reviews and efforts.
Pseudoreplication
Pseudoreplication is the application of statistical techniques to data from “replicates” that are, in some way, not statistically independent (Hurlbert, 1984). While most frequently recognized by scientists when attempting to assess significance in their data, the specter of pseudoreplication still looms over the use of data when attempting to create generalized audiograms, weighting curves or criteria for PTS or TTS (permanent or temporary threshold shift) onset. This is due to the need to avoid using multiple samples that are not independent to generate trends (e.g., Lazic, 2010; Vaux et al., 2012). Interestingly, Southall et al. (2007) went to quite extensive lengths to avoid pseudoreplication in the data considered for behavioral criteria, but still considered TTS information obtained from the same animal across two (or more) different studies (e.g., Bottlenose dolphin BEN: Finneran et al., 2002, 2005). Pseudoreplication in these criteria is thus an oversight that has, surprisingly, persisted through the various discussions and revisions (including by this author) to date (e.g., NOAA, 2015; Tougaard et al., 2015) almost completely unchallenged.
The most recent criteria proposal (NOAA, 2015) suffers from pseudoreplication in numerous places. For example, the auditory and exposure weighting functions for each functional hearing group are based on composite audiograms (Finneran, 2015 Section 5 and Figure 16). These were generated by taking the median of all available audiograms from animals within that hearing group, after they had been normalized to 0 (zero) by adjusting each audiogram by the value at its most sensitive point. Prior to taking the median audiograms, the mean of any multiple measures for any given individual at any given frequency was calculated to facilitate this.
Leaving aside the issue of taking medians and means in a logarithmic scale, this introduced pseudoreplication into the procedure as multiple audiograms from a single species were used to construct the composite. Animals from the same species would be expected to have similar audiograms, which would mean that each audiogram ceases to be independent. Thus, if six audiograms from one species, Species A, were incorporated into a mean/median with one audiogram from another, Species B, then Species A would be over-represented at the expense of Species B. While not influencing the significance of a statistical result, this obviously introduces biases into the results. Accordingly, the audiograms from any given species should have been combined prior to the attempt to generate a more generalized audiogram for any given hearing group.
Later in the process of producing weighting functions Finneran (2015, Section 91) take another step in which the auditory weighting functions are converted to exposure weighting functions by fitting them to all the available data on behaviorally obtained TTS onset levels for that hearing group (Finneran, 2015, Figure 17). Here multiple data points from the same species and even the same individuals were included to provide the best fit (e.g., the data from the source labeled as “Finneran, 2013” in Finneran, 2015, Figure 18). However, this potentially introduces pseudoreplication on two levels. Firstly, multiple points from the same individual would not be independent in an effort to produce a generalized TTS onset function for that species and should thus be combined prior to aggregation, as discussed above. Secondly, if multiple data sets from one species are included they too would not be independent when considering functional hearing groups and thus should also be combined prior to the creation of cross-species composites.
Here the solution seems a little more complicated, given that multiple points are needed to establish TTS onset across a range of frequencies. However, TTS onset curves can be generated in the same way as composite-audiograms, by individual species and then functional hearing group in turn, in a stepped and even manner. A second option, akin to that suggested by Tougaard et al. (2015) would be to use the multiple data points to determine one value for the increase in SEL from audiogram-to-TTS onset for any given individual, then species, then functional hearing group. Additional data could be leveraged by applying TTS growth rates (e.g., those proposed by NOAA, 2015), to TTS data at levels above onset included in Table 6 (Finneran, 2015) to estimate actual onset levels.
It should be noted that Finneran (2015) excluded the higher value for TTS onset if there were two data points for the same species taken at the same frequency. Similarly, any overlapping audiogram points for the same animal at the same frequency were averaged. While not specifically undertaken with the goal of reducing pseudoreplication, these measures would have slightly reduced the extent of the problem. However, extensive pseudoreplication remained in the final composite audiograms and proposed criteria. This has serious implications for the use of medians, which tend to play down “outliers” in favor of more similar groupings in data sets.
Confidence Intervals
Marine mammal noise exposure criteria have been approached from a different perspective than the human A-weighting criteria. In humans, a 1-s equivalent sound exposure level (SEL) is set for an averaged continuous exposure of typically 8 h assuming a working-day exposure. There is no convenient time-window for this approach in marine mammals, so criteria are typically focused on determining the cumulative SEL from a single exposure event that is required to induce a particular impact (e.g., PTS under Southall et al., 2007; NOAA, 2013, 2015). With that in mind, efforts to date have typically determined this level by taking a mean (or median) from the available data.
Confidence in means and medians is typically dependent upon the spread around that data, as can be indicated by standard error or confidence intervals (CIs). Such variability was considered by the National Institute for Occupational Safety and Health (NIOSH) when they set their human workplace criteria (NIOSH, 1998) at an A-weighted 85 dB (dBA, presumably re: 20 μPa given that it is an-in air measurement). Based on data from 1172 males (Prince et al., 1997), NIOSH considered the probability that individuals at different ages would develop a PTS in hearing (i.e., permanent hearing loss) after various exposure periods (i.e., 5–10 and >10 years) at different specified noise levels, each with a 95% CI range (80, 85, and 90 dBA; Table 3-3 NIOSH, 1998). Different definitions of “hearing loss” were also considered (Table 3-4 NIOSH, 1998) and exposure standards were ultimately chosen with all that variability considered and expressly presented.
With regard to marine mammal criteria Tougaard et al. (2015) did not provide statistically generated CIs, but they did present ranges of reported observations (e.g., TTS onset in harbor porpoises at 100–110 dB above their pure tone hearing threshold). Similarly, Southall et al. (2007) reported data variability in the text of their review. However, the NOAA (2013, 2015) criteria proposals have not explicitly considered variability. This may be partly due to the multi-stepped processes upon which they are based (e.g., Finneran and Jenkins, 2012; Finneran, 2015), which make tracking the extent of uncertainty and variability from raw data to criteria difficult. However, without such detail a fully-informed decision cannot be made. This is especially important when considering excess risk. Excess risk is the proportion of a population sensitive enough to still suffer undesirable consequences of exposure at levels below a given criteria. NIOSH (1998) used the consideration of such variability to set excess risk to 8% for human population. Exclusive use of means and medians forces NOAA to accept an excess risk of approximately 50%.
For example, TTS onset for the low-frequency hearing group was estimated by Finneran (2015) by extrapolating from the median hearing-threshold-to-TTS-onset value over the other functional hearing groups. However, instead of a single value, a more robust representation of the data would have (after removing pseudoreplication) included means and CIs for each hearing group, as well as for the groups combined. NOAA (2015) would then have been able to consider the variability with other available information, such as the fact that TTS susceptibility increases at the most sensitive hearing frequencies (Wood et al., 2012). If NOAA had then selected the lower CI, this would be consistent with the incorporation of the lowest limits of a possible population size when calculating sustainable potential biological removal (PBR) level (e.g., Wade, 1998; Taylor et al., 2000). However, such action is not possible without an indication of variability in the data, preferably with an accompanied assessment of statistical power.
Process Inconsistencies
Tougaard et al. (2015) noted that Southall et al. (2007) had been inconsistent in their application of weighting to their proposed criteria. Using unweighted sound levels to establish criteria, but down-weighting values when testing to see if the criteria were exceeded by applying M-weighting, Southall et al. (2007) effectively proposed a more relaxed criteria than intended. NOAA (2013, 2015) attempted to correct this in their more recent criteria proposals. However, artificially relaxed criteria may still result from the inconsistent treatment of audiograms and TTS onset data in the underlying calculations (Finneran, 2015).
To demonstrate this we must consider the main objective and all essential steps of Finneran's (2015) process. The underlying goal was to estimate how much a sound level needs to be above hearing threshold to induce TTS. Given that any sound weighting is conventionally set to 0 at the frequency of greatest sensitivity, the total level of sound required to induce TTS onset at that frequency is the same as the unweighted sound level, making it easier to determine from published literature. This value is essentially represented in Finneran's (2015) models by the parameter K (although C plays a minor role, which will be discussed below).
While the exact process taken is difficult to determine from the text, it appears that, in summary, Finneran (2015) took the following steps to estimate K:
1. Normalized all audiograms to 0 using the lowest point on any given audiogram.
2. Produced a median composite normalized audiogram.
3. Created a mathematical function based upon the median composite normalized audiogram.
4. Corrected this function to the maximum sensitivity of the non-normalized audiogram for the hearing group.
5. Fitted the function to the non-normalized TTS onset data (continuous exposures only), producing an exposure function and the value for K.
By obtaining a median of the normalized audiograms, the composite takes on a different shape to any individual audiogram. Furthermore, despite shifting this composite to the maximum sensitivity of the non-normalized audiogram, differences have also been introduced between the level of each individual audiogram and the composite normalized audiogram. However, the actual TTS onset values are unaltered and remain “tied” to those original audiograms. As a consequence, any individual consistency in the hearing threshold-to-TTS onset component of K across the hearing range becomes lost and the function-fitting process becomes less meaningful.
To demonstrate this (setting aside the pseudoreplication contained in every step of the process), let us apply the same process to just two hypothetical data sets, each with an audiogram and five TTS onset points (Figure 1). While the two audiograms have different maximum sensitivities at different frequencies, the two data sets have roughly equal and comparable offsets between the threshold for signal detection (i.e., the audiogram) and TTS onset levels (the offset is represented by Aχ in Figure 1A). Following steps 1–3, the audiograms are normalized to 0 and a median composite function is produced (Figure 1B, left). To undertake step 4, a median composite function of the non-normalized audiograms is also produced (Figure 1B, right). The most sensitive part of the composite normalized audiogram is then adjusted to be at the same level as the minimum point (and thus maximum sensitivity) of the composite non-normalized audiogram, in accordance with step 4 (Figure 1C).
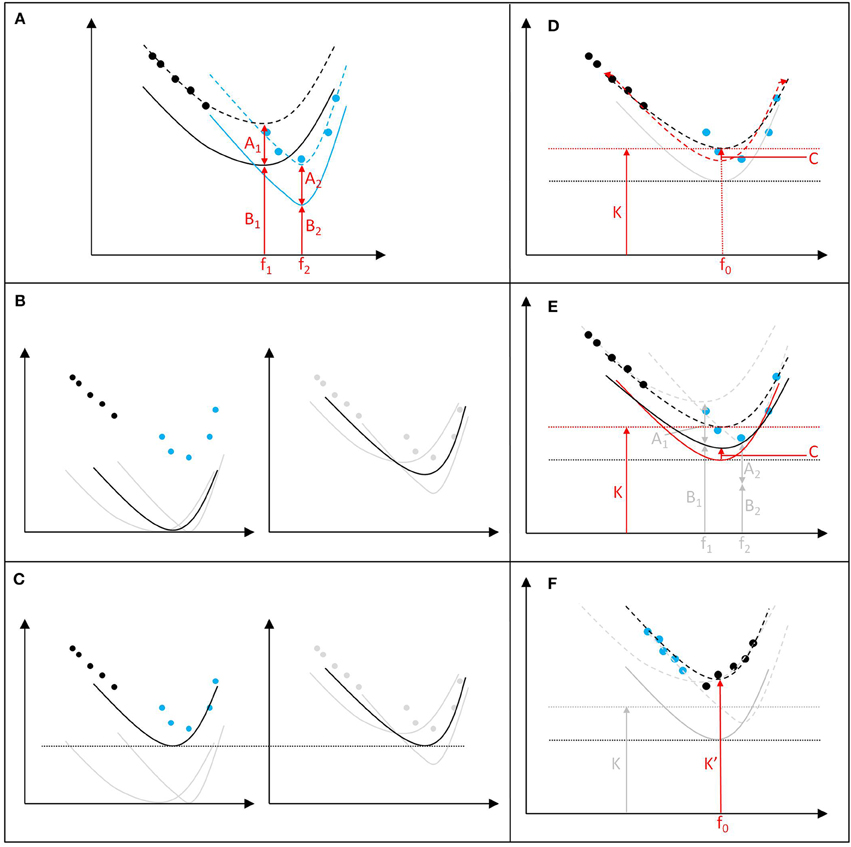
Figure 1. Constructing criteria under Finneran (2015). (A) Two hypothetical data sets from species 1 and 2 (black and blue, respectively) with audiograms (solid line), TTS onset data (filled circles), and associated TTS onset/exposure curve (hashed lines). For each species, A is the offset from hearing threshold to TTS onset at any frequency and B is the lowest sound level audible at the point of greatest sensitivity (f); (B) The audiograms are normalized to 0 and a median composite hearing function is produced (left), but a median composite function of the non-normalized audiograms is also produced (right); (C) The composite normalize audiogram is adjusted to be exactly as sensitive as the composite non-normalize audiogram; (D) The exposure function is then adjusted (from red to black hashed lines) to best fit the non-normalized TTS data to produce the exposure function and estimate TTS onset (K) at the most sensitive frequency (f0); and (E) The same fitting adjustments (from red to black solid lines) are then replicated for the audiogram/weighting function (introducing gain, C). However, (F) the value of K is highly dependent on the frequencies at which the TTS data was collected for each animal, even if different data points would have generated identical TTS onset/exposure curves.
The composite normalized audiogram is then converted to a mathematical function, the parameters of which are then adjusted (see Section 9, Figures 14–16, Finneran, 2015—a process that itself is subject to pseudoreplication) to best fit the non-normalized TTS data available to produce an exposure function and estimate K (Figure 1D). The equivalent flattening is then repeated for the original audiogram/weighting function, creating a discrepancy at f0 between the sensitivity of that function and that of the composite non-normalized audiogram (C in Finneran, 2015 and Figure 1E).
With the distribution of TTS onset data, the resulting exposure function under-estimates impact on hypothetical species 2 (blue points and associated TTS onset curve in Figure 1E). However, even with the same TTS onset curves, a different distribution of TTS data could produce a wildly different result that more substantially under-estimated impact on both species (e.g., the TTS onset function associated with K' in Figure 1F).
Although the above description is simplified from the full function-fitting process set forth in Finneran (2015) and adopted in the NOAA (2015) criteria, the central criticism that non-adjusted TTS onset data points for individuals are being fitted to a composite audiogram remains. Additionally, Finneran (2015) adds C to K to set the final TTS onset criteria (Table 8, Finneran, 2015). However, C results from the inconsistency of fixing the audiogram/weighting function to the most sensitive level prior to fitting, but fixing the exposure function and K to the data after the fitting process. Regardless, K is obtained from real-world unweighted data, which should be equal to conventionally weighted levels at the most sensitive frequencies. In fact, C is actually contained within K (Figure 1D), so its addition is artificially inflating the final criteria. This effectively results in the application of a less stringent weighting to criteria setting than criteria implementation in the same manner as Southall et al. (2007) and see Tougaard et al. (2015).
Other Issues
While the above issues represent the most extensive problems, a range of other numerical issues can be found in the various criteria. With relation to the newest criteria (NOAA, 2015), these relate to (among other things): the use of proxies and extrapolations when data are present (e.g., using TTS growth rates from a chinchilla, rather than the available marine mammal data); fitting curves to very small numbers of data points (e.g., pinniped weighting and exposure functions); and unreasonably discounting actual data from entire species (e.g., excluding data from auditory evoked potential studies.
Proposed Alternative Procedure
In an attempt to resolve the various above-mentioned issues, I propose the following alternative procedure:
1. Calculate audiogram-to-TTS onset (A) for each individual, either by using the lowest value or with indication of uncertainty by providing CIs with the mean. Including all available data would increase the statistical power of the assessment and reduce the overall CIs. Data from animals with known permanent hearing loss, or similar, should be excluded.
2. Calculate an A value for each species in a similar way, then an A value for each functional hearing group, with associated CIs. These values can then be used to directly inform policy makers on a possible weighted SEL level for TTS onset for each functional hearing group.
3. Normalize one single mean audiogram (using absolute levels, rather than dBs) for each species within each functional hearing group.
4. Create an envelope function for all the normalized audiograms, incorporating all audiogram points.
5. Adjust this to the most sensitive point on any single-species audiogram from that hearing group (B) for use as a weighting/exposure function.
This process would avoid pseudoreplication and several of the other numerical issues raised above. It also provides a range of values for K (i.e., B + Aχ), allowing for informed decision-making and, if necessary, the selection of different values for different legal standards. Furthermore, it would produce an audiogram that would account for the sensitivities of all the individuals measured to date. Given the limited number of data sets, this process would also go some distance toward reducing the potential for excess risk.
Conclusions
Much progress has been made in the advancement of acoustic exposure criteria for marine mammals. However, much uncertainty remains. Despite the need to rein in this uncertainty, we must not break statistical rules and numerical conventions to provide spurious solutions. Instead, we should seek to provide regulators with the best available scientific advice possible, while outlining the associated variability and uncertainty. This allows them to make the most informed decision possible, with due consideration of the existing uncertainty, within their particular legislative framework.
While it may be easy to forget that statistical standards, and data independence in particular, are applicable to data use for exercises other than significance testing, we must strive to remind ourselves. It is especially tempting in the world of marine mammals to use every available data point at our disposal. However, if we break statistical rules to do so we fail to produce the best available science.
Conflict of Interest Statement
The author is currently under contract with the Department of Conservation in New Zealand to revise the Code of Conduct for Seismic Surveys. Furthermore, the author has received various contracts on the issue of acoustic impacts on marine mammals, including specifically related to noise exposure criteria, with WWF, NRDC, and other environmental non-governmental organizations. None of the above-mentioned entities have provided comment on the manuscript or influenced it in any way.
The Review Editor Courtney E. Smith declares that, despite being previously co-authoring a paper with the author Adrew J. Wright, the review process was handled objectively and no conflict of interest exists.
Acknowledgments
Thanks are due to Frances Robertson and the three reviewers, whose comments have greatly improved this manuscript. This manuscript was produced without funding.
Footnotes
1. ^Although this section is for creating exposure functions for sonars, the direct incorporation into the NOAA, 2015 draft criteria displays an intention to apply this exposure function more generally.
References
Finneran, J. J. (2015). Auditory Weighting Functions and TTS/PTS Exposure Functions for Cetaceans and Marine Carnivores. San Diego, CA: SSC Pacific.
Finneran, J. J., Carder, D. A., Schlundt, C. E., and Ridgway, S. H. (2005). Temporary threshold shift in bottlenose dolphins (Tursiops truncatus) exposed to mid-frequency tones. J. Acoust. Soc. Am. 118, 2696–2705. doi: 10.1121/1.2032087
Finneran, J. J., and Jenkins, A. K. (2012). Criteria and Thresholds for U.S. Navy Acoustic and Explosive Effects Analysis. San Diego, CA: SPAWAR Systems Center Pacific.
Finneran, J. J., Schlundt, C. E., Dear, R., Carder, D. A., and Ridgway, S. H. (2002). Temporary shift in masked hearing thresholds in odontocetes after exposure to single underwater impulses from a seismic watergun. J. Acoust. Soci. Am. 111, 2929–2940. doi: 10.1121/1.1479150
Hurlbert, S. H. (1984). Pseudoreplication and the design of ecological field experiments. Ecol. Monogr. 54, 187–211. doi: 10.2307/1942661
Lazic, S. E. (2010). The problem of pseudoreplication in neuroscientific studies: is it affecting your analysis? BMC Neurosci. 11:5. doi: 10.1186/1471-2202-11-5
National Oceanic Atmospheric Administration (NOAA) (2013). Draft Guidance for Assessing the Effects of Anthropogenic Sound on Marine Mammals – Acoustic Threshold Levels for Onset of Permanent and Temporary Threshold Shifts, December 23, 2013. Maryland, MD: US Office of Commerce.
National Oceanic Atmospheric Administration (NOAA) (2015). Draft Guidance for Assessing the Effects of Anthropogenic Sound on Marine Mammal Hearing – Underwater Acoustic Threshold Levels for Onset of Permanent and Temporary Threshold Shifts. Revised Version for Second Public Comment Period, July 23, 2015. Maryland, MD: US Office of Commerce.
National Institute for Occupational Safety Health (NIOSH) (1998). Criteria for a Recommended Standard: Occupational Noise Exposure. Cincinnati, OH: United States Department of Health and Human Services.
Prince, M. M., Stayner, L. T., Smith, R. J., and Gilbert, S. J. (1997). A re-examination of risk estimates from the NIOSH Occupational noise and hearing survey (ONHS). J. Acoust. Soc. Am. 101, 950–963. doi: 10.1121/1.418053
Southall, B. L., Bowles, A. E., Ellison, W. T., Finneran, J. J., Gentry, R. L., Greene, C. R. Jr., et al. (2007). Marine mammal noise exposure criteria: initial scientific recommendations. Aquat. Mamm. 33, 411–521. doi: 10.1578/AM.33.4.2007.411
Taylor, B. L., Wade, P. R., DeMaster, D. P., and Barlow, J. (2000). Incorporating uncertainty into management models for marine mammals. Conserv. Biol. 14, 1243–1252. doi: 10.1046/j.1523-1739.2000.99409.x
Tougaard, J., Wright, A. J., and Madsen, P. T. (2015). Cetacean noise criteria revisited in the light of proposed exposure limits for harbour porpoise. Mar. Poll. Bull. 90, 196–208. doi: 10.1016/j.marpolbul.2014.10.051
Vaux, D. L., Fidler, F., and Cumming, G. (2012). Replicates and repeats—what is the difference and is it significant? a brief discussion of statistics and experimental design. EMBO Rep. 13, 291–296. doi: 10.1038/embor.2012.36
Keywords: marine mammal, acoustic exposure, statistics, management, hearing
Citation: Wright AJ (2015) Sound Science: Maintaining Numerical and Statistical Standards in the Pursuit of Noise Exposure Criteria for Marine Mammals. Front. Mar. Sci. 2:99. doi: 10.3389/fmars.2015.00099
Received: 27 August 2015; Accepted: 05 November 2015;
Published: 24 November 2015.
Edited by:
Romuald Lipcius, Virginia Institute of Marine Science, USAReviewed by:
Courtney E. Smith, University of Southern Mississippi, USACraig McPherson, JASCO Applied Sciences, Australia
Tiffini Brookens, Marine Mammal Commission, USA
Copyright © 2015 Wright. This is an open-access article distributed under the terms of the Creative Commons Attribution License (CC BY). The use, distribution or reproduction in other forums is permitted, provided the original author(s) or licensor are credited and that the original publication in this journal is cited, in accordance with accepted academic practice. No use, distribution or reproduction is permitted which does not comply with these terms.
*Correspondence: Andrew J. Wright, marinebrit@gmail.com