High Proline Content of Bacteria-Sized Particles in the Western North Pacific and Its Potential as a New Biogeochemical Indicator of Organic Matter Diagenesis
 Hiroyuki Takasu
 Toshi Nagata
- Atmosphere and Ocean Research Institute, The University of Tokyo, Kashiwa, Japan
Amino acid (AA) compositions were determined for bacteria-sized particles and particulate organic matter (POM) collected in offshore regions of the western North Pacific. The L-proline content of bacteria-sized particles was remarkably high, accounting for 46 ± 10% (mean ± SD, n = 3) of the total quantifiable AA (11 L-AAs and 2 D-AAs were quantified). The L-proline content was much higher than the corresponding values determined for isolated enteric and marine bacterial strains (2–9%). In POM, the L-proline content was low (<5% of total AA) in the upper layer (10–200 m), whereas it was high (20–26% of total AA) at a depth of 1000 m and was accompanied by the enrichment of D-enantiomers of AAs. L-proline enrichment in bacteria-sized particles and deep-water POM suggests a potential use of the L-proline content (mole%) as a new biogeochemical indicator of organic matter diagenesis.
Introduction
Photosynthetically produced organic matter in oceans is extensively altered by microbes and displays amino acid (AA) compositional signature that reflects the extent and nature of complex microbial reworking of organic matter (Keil et al., 2000). As degradation proceeds, non-protein AAs, including β-alanine, γ-amino butyric acid, and D-enantiomers of AAs are known to be enriched in the organic matter pool, thereby serving as useful indicators of organic matter diagenesis (Cowie and Hedges, 1992; Dauwe et al., 1999; Davis et al., 2009). This diagenetic alteration in AA composition is ascribed not only to the accumulation of metabolic intermediates (e.g., partial decarboxylation products, Cowie and Hedges, 1994) but also to the progressive addition of bacteria-derived organic matter during degradation (Pedersen et al., 2001; Kaiser and Benner, 2008; Davis et al., 2009). The abundance of D-AAs and muramic acids, which are molecular markers of bacterial cell wall and other constituents, in marine dissolved (DOM) and particulate organic matter (POM) has been used as an indicator of the contribution of bacterial remnants to marine organic matter pools (McCarthy et al., 1998; Kaiser and Benner, 2008).
Unlike D-enantiomers and other specific molecular markers, the composition of protein AAs has been generally considered to offer little potential as a bacterial source indicator, because the composition of protein AAs appears to vary little between bacteria and phytoplankton (Cowie and Hedges, 1992). However, the currently available data regarding the AA composition of marine bacteria are restricted to those determined for isolated bacterial strains grown under laboratory conditions (Cowie and Hedges, 1992; Brown et al., 1996; Kaiser and Benner, 2008) or bacterial assemblages in pre-incubated seawater (Simon and Azam, 1989). Data regarding natural marine bacterial assemblages are currently unavailable. Furthermore, because previous studies have generally used high-performance liquid chromatography after derivatization with o-phthaldialdehyde (OPA) for the determination of AA composition of bacteria (Simon and Azam, 1989; Cowie and Hedges, 1992; Kaiser and Benner, 2008), data regarding the abundance of proline, a secondary amine that does not react with OPA, is scarce for marine bacteria (Brown et al., 1996). More generally, our knowledge regarding proline content in phytoplankton and marine organic matter is also limited and the available data on phytoplankton are restricted to those for cultured strains in which proline accounted for 5–13% of total AAs (Brown, 1991). Because of the paucity of data on the proline abundance in marine organic matter and microbes, investigators have yet to explore the potential of proline content as an indicator of organic matter degradation state (Dauwe et al., 1999; Keil et al., 2000).
To fill in the gaps in our understanding of the AA composition of organic matter and microbes in marine environments, we collected bacteria-sized particles in seawater using the tangential flow filtration technique to determine their AA composition, including proline and D-enantiomers, using gas chromatography mass spectrometry (GC/MS; Metges et al., 1996). Previous studies have used the tangential flow filtration technique to collect bacteria for the determination of their carbon and nitrogen content (Fukuda et al., 1998) and AA yield (Kawasaki et al., 2011), although this approach has yet to be used for compositional analyses of AAs. With this technique, because bacteria are separated from larger particles on the basis of size-fractionation, small detrital (non-living) particles (Koike et al., 1990) are potentially collected together with bacteria, complicating the interpretation of the results (Kawasaki et al., 2011). Nonetheless, chemical analysis of bacteria-sized particles is an important initial step toward a better understanding of the biochemical composition of marine bacterial assemblages and organic matter. Furthermore, we examined depth-dependent (10–1000 m) changes in the AA composition of particulate organic matter (POM) collected in offshore waters of the western North Pacific.
Materials and Methods
Preparation of Bacterial Concentrate
Seawater samples were collected at three stations deployed in offshore regions (Station N, 46°59′N 160°00′E; Station S, 25°00′N 160°00′E; and Station 0, 37°45′N 143°16′E) of the western North Pacific Ocean (Table 1) on board the R/V Hakuho-maru (KH14-01; May 20–June 11, 2014). At stations N and S, seawater samples were collected at a depth of 200 m, using 12 L Niskin bottles (Niskin-X, General Oceanics, Miami, FL, USA) mounted on a conductivity, temperature, depth (CTD)/carousel sampler (Sea-Bird Model 9 plus; Sea-Bird Carousel-32, Sea-Bird Electronics, Bellevue WA, USA). At Station 0, the sample was collected from the surface (0 m) using a diaphragm pump (P152, Makita UK, Milton Keynes, UK). The samples were contained in 20-L polyethylene tanks and brought into a low-temperature laboratory (room temperature, 4°C) where the prefiltration of the seawater samples and the concentration of bacteria were conducted according to a modified version of the procedure followed by Fukuda et al. (1998). Approximately 200–500 L of seawater samples were pre-filtered by gravity through precombusted (450°C, 3 h) glass fiber filters using polypropylene in-line filter holders (PP47, Advantec, Tokyo, Japan) to eliminate large particles including phytoplankton, zooplankton, and detritus. For the prefiltration, GF/C filters (diameter, 47 mm; nominal pore size, 1.2 μm; Whatman, Maidstone, UK) were used at stations N and S, whereas GF/F filters (diameter, 47 mm; nominal pore size, 0.7 μm; Whatman) were used at station 0. The finer pore size filters were used at station 0 to reduce the inclusion of cyanobacteria in the filtrate. Then, the filtrate was filtered through a Vivaflow tangential flow filtration system (0.2-μm pore size polyether sulphone membrane; Sartorius, Göttingen, Germany) equipped with a peristaltic pump (Masterflex tubing pump system L/S; Masterflex, Gelsenkirchen, Germany, filtration speed of ca. 30 mL min−1) to obtain approximately 25 mL of the retentate for each sample. After the recovery of the retentate, the filtration system was flushed with 100 mL of the permeate. The flushed solution was then mixed with the retentate (final volume, approximately 125 mL). This mixture was contained in polypropylene centrifuge tubes (Protein LoBind Tubes, Eppendorf, Hamburg, Germany) and centrifuged at 15,000 × g for 30 min at 4°C (H-1500DR, Kokusan, Tokyo, Japan). After the centrifugation, the supernatant was removed and the pellets were resuspended in NaCl solution. To prepare the NaCl solution, sodium chloride (Special grade, Wako Pure Chemical Industries, Tokyo, Japan) was precombusted at 450°C for 3 h and dissolved in Millipore Milli Q water (18.2 MΩ, Millipore, Merck KGaA, Darmstadt, Germany). The concentration of NaCl solution was adjusted to be equivalent to the salinity of each seawater sample.
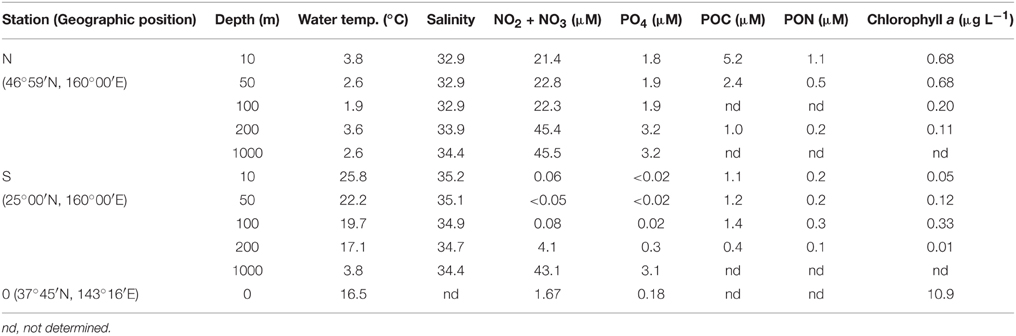
Table 1. Physical and chemical properties of seawater samples.
Collection of POM
At stations N and S, seawater samples for the determination of AAs in POM (hereafter, particulate AAs) were collected at depths of 10, 50, 100, 200, and 1000 m using 12-L Niskin bottles. For each layer, 20–40 L of seawater samples were filtered through precombusted (450°C, 3 h) GF/F filters (diameter, 47 mm; Whatman). These samples were stored in a freezer and used for the later analysis of AAs (see below). To determine chlorophyll a concentrations, 285-mL water samples were filtered through GF/F filters (diameter, 25 mm; Whatman).
Chemical Analyses
Derivatization for the determination of the D- and L-AA concentrations followed a modified version of the method followed by Metges et al. (1996). The sample (a filter or harvested bacterial cells) was contained in a 5-mL glass vial, amended with D-norleucine (Sigma-Aldrich, St. Louis, MO, USA; final conc. 0.12 mM) as an internal standard, and hydrolyzed with 1 mL of 12 N HCl at 110°C for 12 h. The hydrolysate was filtered through a quartz wool plug, and the filtrate was evaporated at 60°C under a N2 stream. The carboxyl group of AAs was esterified with thionyl chloride/2-propanol (v:v = 1:4) at 110°C for 2 h, and the unreacted solvent was evaporated at 50°C under a N2 stream. The amino group of AAs was acylated with pivaloyl chloride/dichloromethane (v:v = 1:4) at 110°C for 2 h, after which the unreacted solvent was evaporated at 50°C under a N2 stream. The dried derivatives of AAs were re-dissolved in 1 mL Milli-Q water and 2 mL dichloromethane/n-hexane (v:v = 5:6). The upper solvent layer with AAs was purified using a centrifugation device (Pall Nanosep MF GHP 0.45 μm, Pall, MI, USA) and pipetted into gas chromatograph (GC) vials (Agilent Technologies, Santa Clara, CA, USA). The purified solvent with AAs was evaporated at 50°C under an N2 stream. The residue was re-dissolved with 100-μL dichloromethane. AA concentrations were determined using a system consisting of a GC (Agilent HP 6890, Agilent Technologies) and a mass spectrometer (MS: HP MSD 5973, Agilent Technologies) within 24 h of derivatization. The GC was equipped with a capillary CP-Chirasil-L-Val column (0.25 mm, 25 m, film thickness: 0.12 μm, Agilent Technologies). The oven program was as follows: initial temperature of 80°C for 10 min, then ramping at 2°C min−1 to 100°C, ramping at 1°C min−1 to 110°C, ramping at 2°C min−1 to 130°C, ramping at 1°C min−1 to 150°C, and, finally, ramping at 4°C min−1 to 190°C. The derivatives eluting from the column were detected using the selective ion monitoring mode of a MS. All AAs were identified by coincidence in GC retention time and mass spectra with those of AA standards (Sigma-Aldrich). Peak areas were converted to concentrations using conversion factors obtained using standard AAs (Sigma-Aldrich). The relationship between peak area and AA concentration was linear within a concentration range of 0.01–0.7 mM. The concentrations were corrected for losses during sample processing using the recovery of the internal standard. For D-enantiomers, the racemization of AAs during sample processing was corrected using L-AA standards (Sigma-Aldrich). The limit of quantification (LOQ), defined as the mean blank value plus 10 × standard deviation for replicate measurements of the blank sample, was 0.020–0.441 nM. Under our sample processing and analytical conditions, AA concentrations were measurable (>LOQ) for glycine, L-alanine, L-valine, L-isoleucine, L-leucine, L-proline, L-threonine, a combined pool of L-aspartate and L-asparagine (L-Asx), L-serine, L-methionine, a combined pool of L-glutamate and L-glutamine (L-Glx), L-phenylalanine, D-alanine, D-valine, D-leucine, D-serine, D-methionine, a combined pool of D-glutamate and D-glutamine (D-Glx), and a combined pool of D-aspartate and D-asparagine (D-Asx), and D-phenylalanine. Glx and Asx notations were used because acid hydrolysis converts asparagine and glutamine to aspartate and glutamate, respectively. The standard deviation for replicate (n = 3) measurements of standard AA was less than 1.0% of the mean value for all AAs.
Nutrient concentrations were determined calorimetrically using an autoanalyzer (AACS II: Bran+Luebbe, Norderstedt, Germany) according to Armstrong et al. (1967). For the determination of the carbon and nitrogen content of the POM, the samples collected on GF/F filters were fumed with HCl to remove carbonate salts, dried in a desiccator, and analyzed using an elemental analyzer (Flash 2000, Thermo Fisher Scientific, Waltham, MA, USA). Acetanilide (Sigma-Aldrich) was used as a standard. The chlorophyll a concentration was determined by fluorometry (Fluorometer 10-AU, Turner Designs, Sunnyvale, CA, USA) according to Welschmeyer (1994).
Enumeration of Bacteria and Proteinaceous Particles
The recovery of bacteria during the concentration process was assessed by determining the bacterial abundance for the samples collected at each step. To enumerate bacteria, samples were fixed with glutaraldehyde (Wako Pure Chemical Industries, final concentration, 1%, vol/vol) and stored at 4°C in the dark until the preparation of microscope slides (within 3 days). Bacteria were stained with 4′,6-diamidino-2-phenylindole (DAPI, Wako Pure Chemical Industries, final conc. 10 μg mL−1, for 10 min), filtered on black-stained 0.2-μm pore size Nuclepore filters (Whatman), and counted under an epifluorescence microscope (BX61, Olympus, Tokyo, Japan; Porter and Feig, 1980) using an optical setting for DAPI (U-MWU2, Olympus). Note that DAPI-positive cells include both bacteria and archaea, although bacteria are generally known to dominate prokaryote communities in upper waters of subarctic and subtropical regions (Kirchman, 2012). At least 300 cells were counted for each filter. For the same slides, cyanobacteria were counted using an optical setting for phycoerythrin (U-MNIB2, Olympus). The length and width of each bacterial cell was measured in each sample using image analysis software (Image J; National Institutes of Health (NIH), Bethseda, MD, USA). Images were captured at a magnification of 1000 × with a charge-coupled device camera (DP70, Olympus). Bacterial cell volume was calculated as described by Gasol et al. (1995). To determine if non-living, proteinaceous particles were present in pre-filtered seawater, we counted the abundance of SYPRO-positive particles (SYPRO Orange, Invitrogen, Carlsbad, CA, USA; Straza et al., 2009). Particles on black-stained 0.2-μm-pore-size Nuclepore filters (Whatman) were stained with both DAPI and SYPRO Orange (final conc. 5 × 10⁻⁵, for 30 min) and counted under an optical setting for DAPI and SYPRO Orange (U-MNG2, Olympus). Because DAPI and SYPRO binds to DNA and protein, respectively, the difference between the abundance of SYPRO positive particles (bacterial and non-bacterial proteinaceous particles) and that of DAPI positive particles (bacteria) was considered to be representative of non-living, proteinaceous particles.
Cultures of Bacterial Strains
An enteric bacterium Escherichia coli K-12 and a marine bacterium Vibrio harveyi (a cosmopolitan species in the surface ocean) were obtained from the National Institute of Technology and Evaluation (NITE) Biological Resource Center, Japan. The growth medium for E.coli contained 10 g polypepton, 0.4 g yeast extract, and 1.0 g MgSO4 (Wako Pure Chemical Industries) in 1 L of Milli Q water. The growth medium for V. harveyi contained 10 g polypepton, 2.0 g yeast extract, 0.5 g MgSO4, and 250 mL of Milli Q water in 750 mL of the aged seawater (seawater collected at a depth of 200 m at station S was used after storage in the dark for ca. 6 months). Escherichia coli and V. harveyi were grown at 30 and 25°C, respectively, and harvested by centrifugation (H-1500DR, Kokusan, 15,000 × g, 5 min, 4°C) during the stationary growth phase.
Statistical Analysis
Statistical analyses were performed using R (R Development Core Team, 2015).
Results
Bacterial Recovery and the Contribution of Non-Bacterial Particles in the Retentate
Bacterial abundance in the seawater samples pre-filtered through GF/C (station N and S) or GF/F (station 0) glass fiber filters accounted for 21–93% of the total bacterial abundance in the unfiltered seawater (Table 2). After the tangential flow filtration, the bacterial abundance in the retentate was 95–342 times higher than that in the filtrate. Considering that the theoretical concentration factor was 4000 (stations N and S) or 1600 (station 0) during the tangential filtration, the recovery of bacteria during this process was calculated to be 2.4–21.4% (Table 2). The recovery of bacteria during the centrifugation of the retentate ranged from 94 to 95% (data not shown). The overall recovery of bacteria during the concentration steps varied in the range of 2.3–20.5%. Bacterial mean cell volume did not differ significantly (t-test, p > 0.05) between the filtrate and retentate (Table 3).
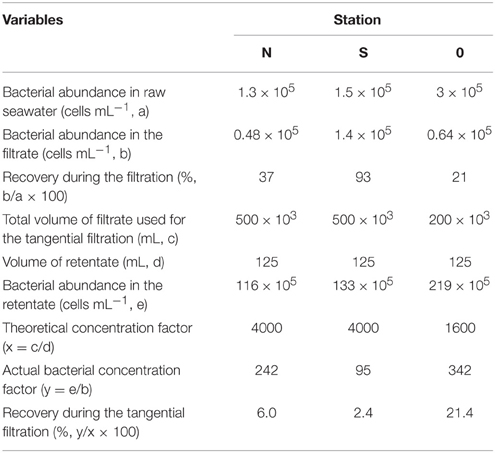
Table 2. Recovery of bacteria during the filtration and concentration steps.
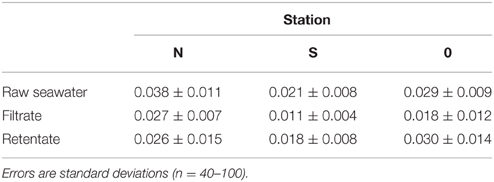
Table 3. Mean cell volumes of bacteria (μm3 cell−1) in raw seawater, filtrate and retentate.
Cyanobacterial abundance was less than the detection limit (<4.3 × 10² cells mL) or less than 0.001–0.1% of the bacterial abundance in the pre-filtered seawater samples. The abundance of SYPRO orange-stained particles did not differ from that of bacteria at stations N and 0, indicating that non-bacterial proteinaceous particle abundance was low (less than 0.001% of bacterial abundance). At station S, the abundance of SYPRO orange-stained particles (4.5 × 10⁵ particles mL−1) was higher than that of DAPI-positive cells. This result indicated that non-living, proteinaceous particle abundance accounted for 3.7% of total bacterial abundance at station S.
AA Composition of Bacteria-Sized Particles and Cultured Bacteria
The cellular contents of total AAs (12 L-AAs and two D-AAs) and D-AAs in bacteria-sized particles are presented in Table 4. The average contents of total AAs and the carbon in the form of AAs were 1230 ± 188 (± SD) amol cell−1 and 0.54 ± 0.10 fmol-C cell−1, respectively. D-AAs accounted for 2.5 ± 0.2% of total AAs.
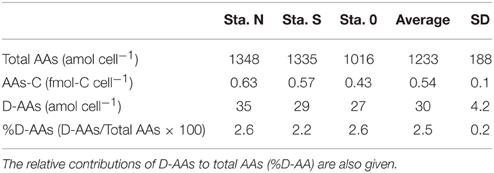
Table 4. Cellular contents of total AAs and carbon in the form of AAs (AAs-C) and D-AAs in bacteria-sized particles collected at three stations.
AA compositions (mole%) of bacteria-sized particles are given in Table 5. The AA distribution was characterized by a high contribution of L-proline. L-proline alone accounted for an average of 46 ± 9.9% (± SD; n = 3) of the total quantifiable AA pool at the three stations. The second most abundant AA was L-Asx, which accounted for 21 ± 6.3% of the total AA. Other AAs accounted for 0.4–8% of total quantifiable AA. The AA composition of cultured bacteria, including E. coli and V. harveyi, did not include large contributions from L-proline (mole%, 9.0 and 2.1% for E. coli and V. harveyi, respectively; Table 6). For both bacteria, the most abundant AA was L-Glx, followed by L-Asx (Table 6).
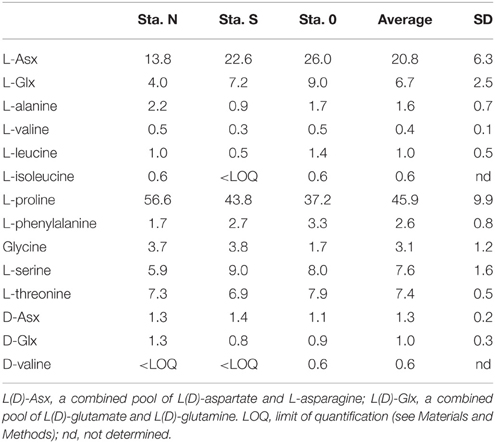
Table 5. Mole% of AAs in bacteria-sized particles.
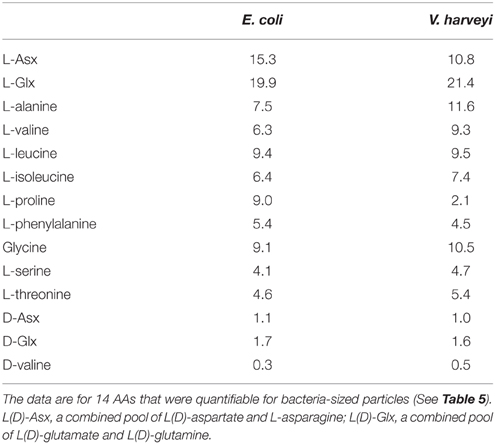
Table 6. Mole% of AAs in isolated bacterial strains grown in the laboratory.
AA Compositions of POM
Depth-dependent changes in particulate AA concentrations and compositions were examined at stations N and S. The surface waters of station N were cold and nutrient rich, whereas those of station S were warm and nutrient poor (Table 1). Chlorophyll a and particulate total AA concentrations in the upper layers (10–50 m) were higher at station N than station S. Particulate total AA concentrations generally decreased with depth, except for a low value at 10 m at station S, reaching a minimum at 1000 m (Figure 1). The concentrations of individual AAs also decreased with depth, although the extent of the attenuation differed among the different AAs. This resulted in a difference in the particulate AA composition between the upper layer and the depth of 1000 m (Figure 2). A prominent feature was the enrichment of L-proline in the POM collected at the depth of 1000 m. The mole% value of L-proline for samples collected at the depth of 1000 was 20 and 26% at stations S and N, respectively, which were 7–8 times greater than the corresponding values obtained for samples collected in the upper layers (10–200 m). POM samples collected at 1000 m were also enriched with D-AAs (D-Asx, D-Glx, and D-serine at station N and D-Glx and D-leucine at station S) relative to those collected in the upper layers (mole% of D-AAs values were 2–3 times higher at 1000 m than upper layers). In contrast, mole% values of L-Asx and L-Glx were high and low in the upper layer and at the depth of 1000 m, respectively (Figure 2). Principal component analysis (PCA) of particulate AAs yielded four PCs (eigenvalue >1), with PC1 alone explaining 39% of the total variation in the data (Figure 3, Supplementary Table 1). POM from the upper layer and the deep layer were clearly separated in PC1. D-Glx, D-Asx, L-proline, and glycine had a strong, negative loading in PC1. In contrast, L-Glx and L-Asx had large positive loadings in PC1. POM collected at the depth of 1000 m from stations N and S were plotted closely together, reflecting their high compositional similarity.
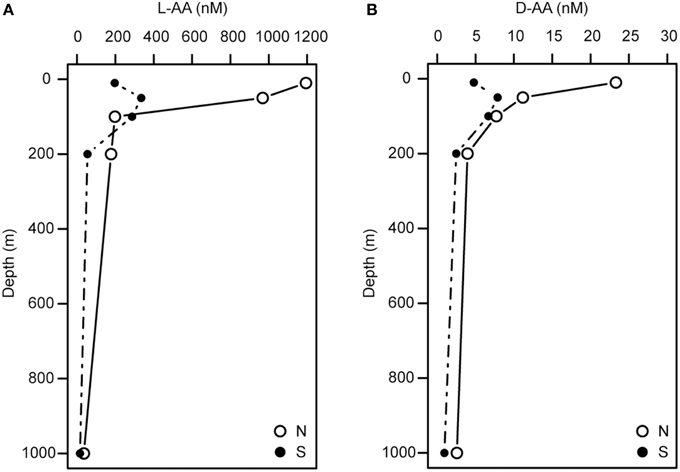
Figure 1. Depth profiles of the concentrations of particulate L-AAs (A) and D-AAs (B) at stations N and S.
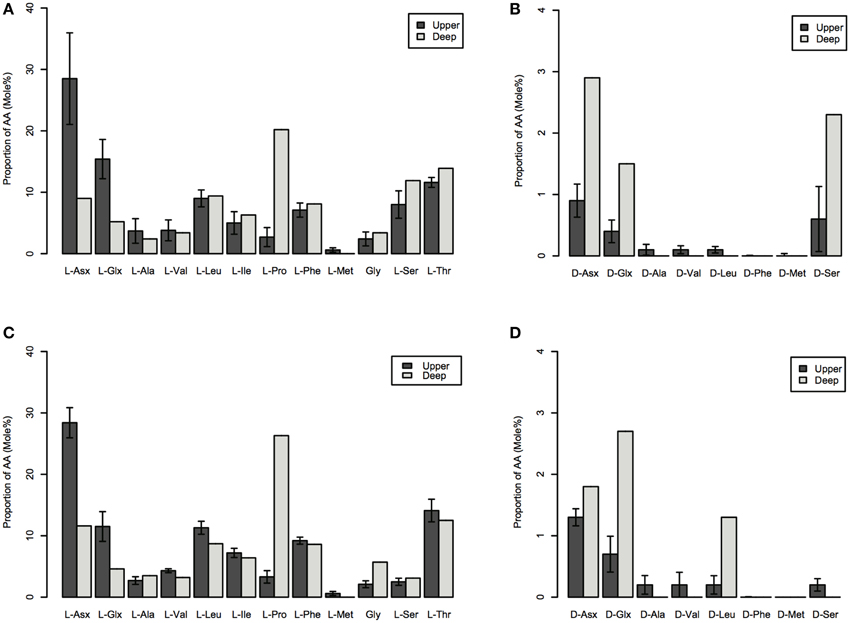
Figure 2. Mole% of particulate AAs collected in the upper (10–200 m) and the deep (at a depth of 1000 m) layers of stations N (A,B) and S (C,D). AAs: L-Asx, L-aspartate and L-asparagine; L-Glx, L-glutamate and L-glutamine; L-Ala, L-alanine; L-Val, L-valine; L-Leu, L-leucine; L-Ile, L-isoleucine; L-Pro, L-proline; L-Phe, L-phenylalanine; L-Met, L-methionine; Gly, glycine; L-Ser, L-serine; L-Thr, L-threonine; D-Asx, D-aspartate and D-asparagine; D-Glx, D-glutamate and D-glutamine; D-Val, D-valine; D-Leu, D-leucine; D-Phe, D-phenylalanine; D-Met, D-methionine; and D-Ser, D-serine. The data for the upper layer are the average of the four layers (errors are standard deviations).
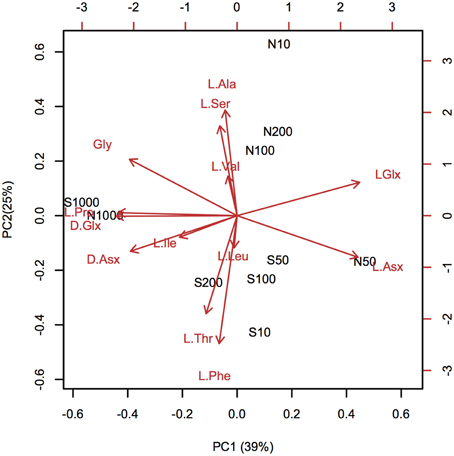
Figure 3. Principal component analysis (PCA) of particulate amino acid (AA) compositions. The biplot of the first two PCA axes (PC1 and PC2) shows site scores and variable loadings (red arrows). AA abbreviations are the same as in Figure 2. L-methionine and D-amino acids, except for D-Asx and D-Glx, were excluded from the PCA analysis, because these amino acids were under the quantification limits in the POM collected in the deep layers. Site scores are labeled as “station code-depth.” Statistical parameters are tabulated in Supplementary Table 1.
Discussion
Methodological Considerations
The abundance of bacteria recovered after the concentration (tangential flow and centrifugation) processes accounted for 2.3–20.5% of the total bacterial abundance in the pre-filtered seawater. Similar recoveries have been reported in previous studies that used large-volume tangential flow filtration techniques to concentrate natural bacterial assemblages (Benner, 1991; Fukuda et al., 1998). Although the procedures used in the concentration process differed among studies, the low recovery has been generally ascribed to the incomplete removal of bacteria that are firmly attached to filters. In our study, the bacterial cell size in the retentate (0.018–0.030 μm3) did not differ from that in the pre-filtered seawater and was within the range of the bacterial cell size reported for open ocean communities (0.020–0.042 μm3, Pomroy and Joint, 1999). These results suggest that the selectivity during the prefiltration and concentration process was minimal, at least in terms of bacterial cell size. We also note that, despite large variability in bacterial recovery, the proline content of bacteria-sized particles was consistently high at all stations. This fact gives us some added confidence about the robustness of the results.
The concentrate prepared by the tangential flow filtration potentially contained both cellular (bacterial) and submicron detrital particles. In this study, we found that non-living proteinaceous particles were less abundant or hardly detectable in the pre-filtered seawater. These results suggest that the influence of detritus on the AA composition of bacteria-sized particles was likely to be small. However, it is not clear whether the whole range of marine protaineous particles, with different chemical and physical features, were effectively detected by the SYPRO orange-staining method. Kawasaki et al. (2011) determined the carbon-normalized AA yield of bacteria-sized particles collected by the tangential flow filtration and suggested that 18–57% of AAs in the bacteria-sized particles might be associated with detritus. The potential problem of the inclusion of detrital particles in the concentrate will be further discussed in the next section.
AA Composition of Bacteria-Sized Particles and Cultured Bacteria
The AA composition clearly differed between bacteria-sized particles and cultured bacteria, including E.coli and V. harveyi. The AA composition that we determined for E.coli and V. harveyi was consistent with the data reported in the literature for E.coli and other isolated bacterial strains. The L-proline content was remarkably high in bacteria-sized particles relative to 11 cultured bacterial strains, including the two strains considered in this study (Figure 4). For this comparison, we considered the 11 AAs that were quantifiable for bacteria-sized particles as the “total” to facilitate a comparison (D- and L- forms were not distinguished because D-AA contents were not available in the dataset in the literature). The percentage of proline relative to the total AAs of bacteria-sized particles was, on average, eight times higher than that of cultured bacteria (Figure 4). The relative abundance of Asx in bacteria-sized particles was also higher than that in cultured bacteria.
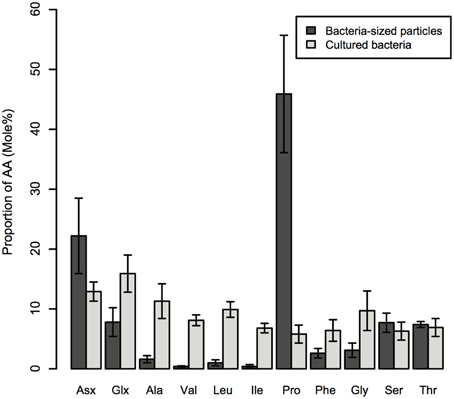
Figure 4. Average mole% of AAs for bacteria-sized particles and nine strains of cultured bacteria. Errors are standard deviations. AA abbreviations are the same as in Figure 2. For the details of cultured bacterial strains, see the legend of Figure 5.
The difference in AA composition between bacteria-sized particles and cultured bacteria was examined using PCA (Figure 5, Supplementary Table 2). PCA yielded two PCs (eigenvalue >1), with PC1 alone explaining 63% of the total variation in the data. Bacteria-sized particles were clearly separated from cultured bacteria in PC1 (Figure 5). Most of the AAs had a positive loading in PC1, whereas proline and Asx had a strong negative loading in PC1 (Figure 5).
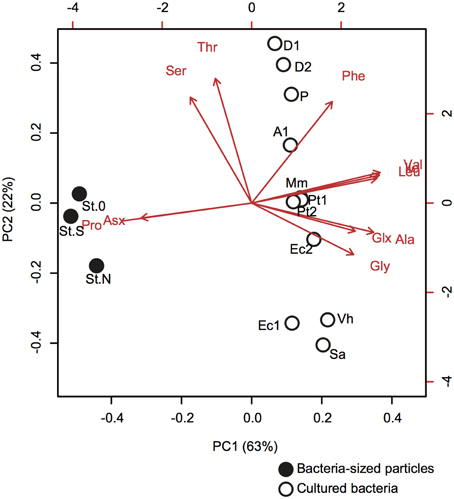
Figure 5. Principal component analysis (PCA) of the AA compositions of bacteria-sized particles (closed symbols with station codes) and cultured bacteria (open symbols with strain codes). The biplot of the first two PCA axes (PC1 and PC2) shows site scores and variable loadings (red arrows). AA abbreviations are the same as in Figure 2. For cultured bacteria, we used our own data obtained for E. coli (Ec1, this strain code corresponds to the label in the figure) and V. harveyi (Vh) (Table 6), and data reported in the literature (Brown et al., 1996; Okayasu et al., 1997). For this comparison, we used the data, including those on proline content, in the literature and considered only 11 amino acids quantified for bacteria-sized particles. The data in the literature consisted of nine isolated bacterial strains grown in the laboratory: [E.coli (Ec2)], Gram-positive [Staphylococcus aureus (Sa)] and marine bacteria [Aeromonas sp. ACM4771 (A1), Derxia sp. ACM 4722 (D1), Derxia sp. ACM 4773 (D2), Methylophilus methylotrophus NCIB 10515 (Mm), Pseudomonas testosterone ACM 4768 (Pt1), Pseudomonas testosterone ACM 4769 (Pt2), and Pseudomonas sp. ACM 4770(P)]. Statistical parameters are given in Supplementary Table 2.
The high L-proline content of bacteria-sized particles is intriguing. One possible explanation is that natural marine bacterial cells contain large quantities of proline or proline-rich constituents. Two lines of evidence support the notion that proline may play an important role in the physiology of natural marine bacteria. First, proline ATP-binding cassette transporters were found to be a major transporter gene from natural marine bacteria including the SAR11 clade (Poretsky et al., 2010; Gifford et al., 2013), which is the most abundant bacterial group in marine environments (Morris et al., 2002). Second, the transcriptome of a marine bacterium (Ruegeria pomeroyi) of the Roseobacter clade was enriched in transporters for proline under carbon-limited conditions (Chan et al., 2012). Proline is known to serve as one of the major organic compatible solutes for bacteria to maintain cellular osmotic pressure, which is essential for bacterial growth (Csonka, 1989). However, it is unlikely that proline, as a compatible solute or a cellular internal pool, can have a major effect on the AA composition of bulk bacterial cells. Assuming that the internal pool concentration of proline is <0.1–33 mM (Tempest and Meers, 1970) and that the water content of marine bacterial cells is 46–53% (Simon and Azam, 1989), it is estimated that proline in the internal pool accounts for only <0.01–0.5% of the total cellular AA for a bacterium with a cellular volume of 0.026–0.036 μm3. Nonetheless, given that the vast majority of natural marine bacteria have yet to be cultured for a thorough examination of their biochemical composition (Kirchman, 2012), we cannot totally exclude the possibility that proline-rich constituents are abundant in natural marine bacterial assemblages and play hitherto unidentified functional roles. A recent study found that peptidases which cleave mainly prolyl bonds were the most prevalent proteases in the genome of a marine Flavobacterium Formosa agariphila KMM 3901T, a specialist in the degradation of macromolecules in marine environments (Mann et al., 2013). Although the function of these prolyl peptidases is unclear, the genomic evidence is indicative of the existence of a hidden biochemical pathway involving proline. We clearly need more data on AA composition and proline content of a wider range of marine bacterial isolates, including those of oligotrophic bacteria that dominate oceanic communities. It is also important to investigate the influence of substrate and growth conditions on the proline content of marine bacteria.
Alternatively, the high proline content in bacteria-sized particles might be a reflection of the presence of proline-rich, non-living submicron particles in oceanic waters. Proline-rich regions of protein are widespread in both prokaryotic and eukaryotic cells (Williamson, 1994). If proline-rich proteins are less easily degradable than other proteins in marine environments, the proline content in detritus may increase as organic matter degrades. This hypothesis is partly supported by the results of Veuger et al. (2006), who found that proline, along with glycine and serine, was selectively preserved during the degradation of 13C-labeled bacterial biomass in marine sediments. Due to the unique chemical structure of proline, with the side-chain being cyclized on the amide position, proline-rich regions of protein are known to bind rapidly to other macromolecules in a less specific manner (Williamson, 1994). Proline also has a large flat hydrophobic surface that readily binds to other hydrophobic surfaces (Williamson, 1994). These characteristic features of proline and proline-rich proteins might help explain the selective preservation of proline in marine environments. In support of this notion, the association of protein with other macromolecules, especially with hydrophobic constituents such as the membrane and lipids, has been suggested to protect the protein from rapid degradation in seawater (Nagata et al., 1998; Borch and Kirchman, 1999; Nagata, 2008).
AA Composition of POM and the Potential of L-Proline as a Diagenesis Indicator
The mole% of D-AA has been used as an indicator of the bacterial contribution to marine organic matter (Pedersen et al., 2001; Kaiser and Benner, 2008). It has been generally suggested that the high D-AA content in altered organic matter pools may reflect the progressive addition of bacteria-derived organic matter during degradation (Pedersen et al., 2001; Kaiser and Benner, 2008). In our study, the mole% of D-AA in the POM collected at the depth of 1000 m was 2–3 times higher than that collected in the upper layer. These results indicate that the bacterial contribution to particulate AAs was higher in the deeper than upper layers. Interestingly, and consistent with the depth-dependent trend of %D-AA, we also found that the mole% of L-proline at the depth of 1000 m was 7–8 times higher than in the upper layers. The simultaneous enrichment of D-AA and proline in POM collected in deep water might imply that proline may be an indicator of organic matter degradation. This notion is supported by our finding that bacteria-sized particles were highly enriched with proline. The progressive addition of organic matter derived from bacteria or bacteria-sized particles to POM may result in an alteration in the AA composition toward a higher contribution from proline. Except for high proline content, the AA composition of deep POM was only weakly similar to that of bacteria-sized particles. A comparison using PCA of the AA composition between bacteria-sized particles and POM showed that the bacteria-sized particles and the deep POM formed different clusters in the bi-plot of PC1 vs. PC2 (data not shown). It should be noted that, unlike D-AA, proline is omnipresent among prokaryotic and eukaryotic sources. Thus, proline itself cannot be a specific biomarker of bacteria. Rather, we postulate that a high proline content (mole%) in the POM in deep water could be a reflection of either the addition of proline-rich bacterial remnants or the selective preservation of proline-rich components (sources can be either bacteria, other organisms, or both) during degradation. Given the paucity of data on the proline content in marine DOM, testing the applicability of these models, which are not necessarily mutually exclusive, to both the dissolved and particulate phases of organic matter in oceans should represent one of the major challenges for future research.
In conclusion, our determination of the AA composition of bacteria-sized particles and POM in oceanic waters revealed novel features in AA compositional variability. The outstanding features included a high proline content (mole%) in bacteria-sized particles. The proline content was also high in POM collected in deep water, indicating the presence of a potential link between organic matter degradation and proline enrichment. These results underscore the necessity of future studies to investigate the use of proline content as a new biogeochemical indicator of organic matter diagenesis. These studies should determine proline contents and their variability in a wider range of marine organic matter (including DOM and POM) and microbes (including bacteria and phytoplankton) in order to gain a more comprehensive understanding of the source, biochemical characteristics and biogeochemical role of proline-rich constituents in marine environments.
Author Contributions
HT and TN designed the experiment and conducted the field sampling together. HT conducted the tangentiall filtration, bacterial culture works, and chemicall analyses. HT and TN analyzed the data and wrote the paper.
Conflict of Interest Statement
The authors declare that the research was conducted in the absence of any commercial or financial relationships that could be construed as a potential conflict of interest.
Acknowledgments
We thank T. Miyajima and N. Saotome for assistance with the AA analysis. We also thank our colleagues and the captain, officers, and crew of the R/V Hakuho-maru for support during the cruise. We are grateful to K. Kogure and K. Hamasaki for cruise arrangement and to K. Seike and R. Kaneko for their support during the sampling and sample analyses. This research was financially supported by JST CREST, JSPS KAKENHI grant numbers 24241003 and 15H01725 awarded to TN and JSPS KAKENHI grant number 15J06912 awarded to HT.
Supplementary Material
The Supplementary Material for this article can be found online at: https://www.frontiersin.org/article/10.3389/fmars.2015.00110
References
Armstrong, F. A., Stearns, C. R., and Strickland, J. D. H. (1967). The measurement of upwelling and subsequent biological processes by means of the Technicon Autoanalyzer II and associated equipment. Deep Sea Res. 14, 381–389.
Benner, R. (1991). Ultra-filtration for the concentration of bacteria, viruses, and dissolved organic matter. Geophys. Monogr. 63, 275–280. doi: 10.1029/gm063p0181
Brown, M. R. (1991). The amino-acid and sugar composition of 16 species of microalgae used in mariculture. J. Exp. Mar. Biol. Ecol. 145, 79–99. doi: 10.1016/0022-0981(91)90007-J
Brown, M. R., Barrett, S. M., Volkman, J. K., Nearhos, S. P., Nell, J. A., and Allan, G. L. (1996). Biochemical composition of new yeasts and bacteria evaluated as food for bivalve aquaculture. Aquaculture 143, 341–360. doi: 10.1016/0044-8486(96)01286-0
Borch, N. H., and Kirchman, D. L. (1999). Protection of protein from bacterial degradation by submicron particles. Aquat. Microb. Ecol. 16, 265–272. doi: 10.3354/ame016265
Chan, L.-K., Newton, R. J., Sharma, S., Smith, C. B., Rayapati, P., Limardo, A. J., et al. (2012). Transcriptional changes underlying elemental stoichiometry shifts in a marine heterotrophic bacterium. Front. Microbiol. 3:159. doi: 10.3389/fmicb.2012.00159
Cowie, G. L., and Hedges, J. I. (1992). Sources and reactivities of amino acids in a coastal marine environment. Limnol. Oceanogr. 37, 703–724. doi: 10.4319/lo.1992.37.4.0703
Cowie, G. L., and Hedges, J. I. (1994). Biogeochemical indicators of diagenetic alteration in natural organic matter mixtures. Nature 369, 304–307. doi: 10.1038/369304a0
Csonka, L. N. (1989). Physiological and genetic responses of bacteria to osmotic stress. Microbiol. Rev. 53, 121–147.
Dauwe, B., Middelburg, J. J., Herman, P. M. J., and Heip, C. H. R. (1999). Linking diagenetic alteration of amino acids and bulk organic matter reactivity. Limnol. Oceanogr. 44, 1809–1814. doi: 10.4319/lo.1999.44.7.1809
Davis, J., Kaiser, K., and Benner, R. (2009). Amino acid and amino sugar yields and compositions as indicator of dissolved organic matter diagenesis. Org. Geochem. 40, 343–352. doi: 10.1016/j.orggeochem.2008.12.003
Fukuda, R., Ogawa, H., Nagata, T., and Koike, I. (1998). Direct determination of carbon and nitrogen contents of natural bacterial assemblages in marine environments. Appl. Environ. Microbiol. 64, 3352–3358.
Gasol, J. M., del Giorgio, P. A., Massana, R., and Duarte, C. M. (1995). Active versus inactive bacteria: size-dependence in a coastal marine plankton community. Mar. Ecol. Prog. Ser. 128, 91–97. doi: 10.3354/meps128091
Gifford, S. M., Sharma, S., Booth, M., and Moran, M. A. (2013). Expression patterns reveal niche diversification in a marine microbial assemblage. ISME J. 7, 281–298. doi: 10.1038/ismej.2012.96
Kaiser, K., and Benner, R. (2008). Major bacterial contribution to the ocean reservoir of detrital organic carbon and nitrogen. Limnol. Oceanogr. 53, 99–112. doi: 10.4319/lo.2008.53.1.0099
Kawasaki, N., Sohrin, R., Ogawa, H., Nagata, T., and Benner, R. (2011). Bacterial carbon content and the living and detrital bacterial contributions to suspended particulate organic carbon in the North Pacific Ocean. Aquat. Microb. Ecol. 62, 165–176. doi: 10.3354/ame01462
Keil, R., Tsamakis, E., and Hedges, J. I. (2000). “Early diagenesis of particulate amino acids in marine systems,” in Perspectives in Amino Acids and Protein Geochemistry, eds G. A. Goodfriend, M. J. Collins, M. L. Fogel, S. A. Macko, and J. E. Wehmiller (New York, NY: Oxford University Press), 69–82.
Koike, I., Hara, S., Terauchi, K., and Kogure, K. (1990). Role of sub-micrometer particles in the ocean. Nature 345, 242–244. doi: 10.1038/345242a0
McCarthy, M. D., Hedges, J. I., and Benner, R. (1998). Major bacterial contribution to marine dissolved organic nitrogen. Science 281, 231–234. doi: 10.1126/science.281.5374.231
Mann, A. J., Hahnke, R. L., Huang, S., Werner, J., Xing, P., Barbeyron, T., et al. (2013). The genome of the alga-associated marine flavobacterium Formosa agariphila KMM 3901T reveals a broad potential for degradation of algal polysaccharides. Appl. Environ. Microbiol. 79, 6813–6822. doi: 10.1128/AEM.01937-13
Metges, C. C., Petzke, K. J., and Hennig, U. (1996). Gas chromatography/combustion/isotope ratio mass spectrometric comparison of N-acetyl- and N-pivaloyl amino acid esters to measure 15N isotopic abundances in physiological samples: a pilot study on amino acid synthesis in the upper gastro-intestinal tract of minipigs. J. Mass. Spectrom. 31, 367–376.
Morris, R. M., Rappé, M. S., Cannon, S. A., Vergin, K. L., Siebold, W. A., Carlson, C. A., et al. (2002). SAR11 clade dominates ocean surface bacterioplankton communities. Nature 420, 806–810. doi: 10.1038/nature01240
Nagata, T. (2008). “Organic matter–bacteria interactions in seawater,” in Microbial Ecology of the Oceans, 2nd Edn., ed D. L. Kirchman (New York, NY: Wiley-Liss), 207–242.
Nagata, T., Fukuda, R., Koike, I., Kogure, K., and Kirchman, D. L. (1998). Degradation by bacteria of membrane and soluble protein in seawater. Aquat. Microb. Ecol. 14, 29–37. doi: 10.3354/ame014029
Okayasu, T., Ikeda, M., Akimonoto, K., and Sorimachi, K. (1997). The amino acid composition of mammalian and bacterial cells. Amino Acids 13, 379–391. doi: 10.1007/BF01372601
Pedersen, A.-G. U., Thomsen, T. R., Lomstein, B. A., and Jørgensen, N. O. G. (2001). Bacterial influence on amino acid enantiomerization in a coastal marine sediment. Limnol. Oceanogr. 46, 1358–1369. doi: 10.4319/lo.2001.46.6.1358
Pomroy, A., and Joint, I. (1999). Bacterioplankton activity in the surface waters of the Arabian Sea during and after the 1994 SW monsoon. Deep Sea Res. II 46, 767–794. doi: 10.1016/S0967-0645(98)00127-1
Porter, K. G., and Feig, Y. S. (1980). The use of DAPI for identifying and counting aquatic microflora. Limnol. Oceanogr. 25, 943–948. doi: 10.4319/lo.1980.25.5.0943
Poretsky, R. S., Sun, S., Mou, X., and Moran, M. A. (2010). Transporter genes expressed by coastal bacterioplankton in response to dissolved organic carbon. Environ. Microbiol. 12, 616–627. doi: 10.1111/j.1462-2920.2009.02102.x
R Development Core Team (2015). R: A Language and Environment for Statistical Computing. Vienna: R Development Core Team.
Simon, M., and Azam, F. (1989). Protein content and protein synthesis rates of planktonic marine bacteria. Mar. Ecol. Prog. Ser. 51, 201–213. doi: 10.3354/meps051201
Straza, T. R. A., Cottrell, M. T., Ducklow, H. W., and Kirchman, D. L. (2009). Geographic and phylogenetic variation in bacterial biovolume as revealed by protein and nucleic acid staining. Appl. Environ. Microbiol. 75, 4028–4034. doi: 10.1128/AEM.00183-09
Tempest, D. W., and Meers, J. L. (1970). Influence of environment on the content and composition of microbial free amino acid pools. J. General Microbiol. 64, 171–185. doi: 10.1099/00221287-64-2-171
Veuger, B., van Oevelen, D., Boschker, H. T. S., and Middelburg, J. J. (2006). Fate of peptidoglycan in an intertidal sediment: an in situ13C-labeling study. Limnol. Oceanogr. 51, 1572–1580. doi: 10.4319/lo.2006.51.4.1572
Welschmeyer, N. A. (1994). Fluorometric analysis of chlorophyll-a in the presence of chlorophyll-b and pheopigments. Limnol. Oceanogr. 39, 1985–1992. doi: 10.4319/lo.1994.39.8.1985
Keywords: amino acids, proline, enantiomers, bacteria, North Pacific, particulate organic matter
Citation: Takasu H and Nagata T (2015) High Proline Content of Bacteria-Sized Particles in the Western North Pacific and Its Potential as a New Biogeochemical Indicator of Organic Matter Diagenesis. Front. Mar. Sci. 2:110. doi: 10.3389/fmars.2015.00110
Received: 28 September 2015; Accepted: 27 November 2015;
Published: 16 December 2015.
Edited by:
Javier Arístegui, University of Las Palmas de Gran Canaria, SpainReviewed by:
Roberta L. Hansman, University of Vienna, AustriaFederico Baltar, University of Otago, New Zealand
Cindy Lee, Stony Brook University, USA
Copyright © 2015 Takasu and Nagata. This is an open-access article distributed under the terms of the Creative Commons Attribution License (CC BY). The use, distribution or reproduction in other forums is permitted, provided the original author(s) or licensor are credited and that the original publication in this journal is cited, in accordance with accepted academic practice. No use, distribution or reproduction is permitted which does not comply with these terms.
*Correspondence: Hiroyuki Takasu, takasu@nagasaki-u.ac.jp
†Present Address: Hiroyuki Takasu, Graduate School of Fisheries and Environmental Studies, Nagasaki University, Nagasaki, Japan