Site-Specific Assessments of the Abundance of Three Inshore Dolphin Species to Inform Conservation and Management
 Alexander M. Brown
 Lars Bejder
 Kenneth H. Pollock
 Simon J. Allen
- 1Cetacean Research Unit, School of Veterinary and Life Sciences, Murdoch University, Perth, WA, Australia
- 2The Western Australian Marine Science Institution, Perth, WA, Australia
- 3Department of Applied Ecology, North Carolina State University, Raleigh, NC, USA
- 4Centre for Marine Futures, Oceans Institute and School of Animal Biology, The University of Western Australia, Perth, WA, Australia
Assessing the abundance of wildlife populations is essential to their effective conservation and management. Concerns have been raised over the vulnerability of tropical inshore dolphins in waters off northern Australia to anthropogenic impacts on local populations, yet a lack of abundance data precludes assessment of their conservation status and the management of threats. Using small vessels as cost-effective research platforms, photo-identification surveys and capture-recapture models were applied to provide the first quantitative abundance data for Australian snubfin (Orcaella heinsohni), Australian humpback (Sousa sahulensis), and Indo-Pacific bottlenose dolphins (Tursiops aduncus) at five sites in the Kimberley region of north-western Australia. The abundance of each species was highly variable between different sites, likely reflecting species-specific habitat preferences. Within the c. 130 km2 study sites, the estimated abundance of most species was ≤ 60 individuals (excluding calves), and fewer than 20 humpback dolphins were identified at each site in any one 3–5 week sampling period. However, larger estimates of c. 130 snubfin and c. 160 bottlenose dolphins were obtained at two different sites. Several local populations showed evidence of site fidelity, particularly snubfin dolphins. By implementing a standardized, multi-site approach, data on local populations were provided within a broader, regional context, and indicated that each species is patchily distributed in the region. This highlights the need for site-specific baseline data collection using appropriate survey techniques to quantitatively assess the potential impacts of threatening activities to local populations. These findings further illustrate the need to gain a greater understanding of known and potential threats to inshore dolphin populations, their relative impacts, and to mitigate where necessary. An ideal candidate site for a long-term study of snubfin dolphin population dynamics is identified, where trends in abundance and their influencing factors could be investigated. The methods employed herein provide an example of rigorous, site-specific population assessments of inshore dolphins that are broadly applicable to such studies elsewhere.
Introduction
Estimating abundance is a key element of wildlife management strategies and important to assessing the conservation status of a species or population. They provide a base from which to investigate: trends in abundance (Gerrodette, 1987), natural vulnerability to extinction risk (Shaffer, 1981), the potential resilience to anthropogenic sources of mortality (Wade, 1998), and the biological significance of impacts of proposed anthropogenic activities (NRC, 2005). Cetaceans are long-lived species, with late maturation, low reproductive rates and often occupy high trophic levels; consequently, they are inherently vulnerable to human impacts and often in particular need of conservation action (Taylor, 2002; Lewison et al., 2004). However, due to their traits (highly mobile, problematic to observe), obtaining unbiased and precise abundance estimates of cetaceans can be difficult, expensive and time-consuming, particularly for species which are sparsely distributed across large and remote areas (Taylor and Gerrodette, 1993; Williams and Thomas, 2009; Peel et al., 2015). Overcoming these challenges has proven a significant impediment to cetacean research and the conservation status of numerous species and populations remains data deficient (IUCN, 2015). Due to their overlap with areas of considerable human activity, cetacean populations occupying near-shore coastal habitats are among the most threatened (e.g., Rojas-Bracho et al., 2006; Slooten et al., 2006, 2013) and in most need of quantitative data to inform management (Wilson et al., 1999; Parra et al., 2006a).
Three species of coastal dolphin inhabit shallow, inshore waters of northern Australia: the Australian snubfin dolphin (Orcaella heinsohni, hereafter “snubfin dolphin”), the Australian humpback dolphin (Sousa sahulensis, hereafter “humpback dolphin”), and the Indo-Pacific bottlenose dolphin (Tursiops aduncus, hereafter “bottlenose dolphin”). For all three species, a lack of data on their distribution, abundance and their trends precludes comprehensive assessment of their conservation status and the management of impacts on local populations (Beasley et al., 2012; Woinarski et al., 2014). Snubfin and humpback dolphins are of particular conservation concern. Globally, their distribution is restricted to shallow coastal and estuarine waters of northern Australia and southern New Guinea (Parra et al., 2002, 2004; Beasley et al., 2005, 2016; Jefferson and Rosenbaum, 2014). Available data suggest that both species are discontinuously distributed as small populations of 50-200 (e.g., Parra et al., 2006a; Palmer et al., 2014; Table 1), which exhibit site fidelity (Parra et al., 2006a; Cagnazzi et al., 2011, 2013a), limited gene flow between populations (Cagnazzi, 2011; Brown et al., 2014), and are reliant upon near-shore habitats (Parra et al., 2006b; Parra and Jedensjö, 2014). While snubfin and humpback dolphins are data deficient, both species have been assigned precautionary “near threatened”1 statuses by the International Union for Conservation of Nature (IUCN) in light of their apparent low population sizes and ongoing vulnerability to threats (Reeves et al., 2008a,b). Bottlenose dolphins are widely distributed in warm temperate to tropical shallow coastal waters of the Indo-Pacific (Krützen and Allen, 2008), and exhibit locally high abundances within some sub-tropical embayments of Australia (e.g., Preen et al., 1997; Chilvers and Corkeron, 2003). However, few data exist for bottlenose dolphins in waters off northern Australia (Beasley et al., 2012; Table 1), and, globally, they are considered “data deficient” by the IUCN (Hammond et al., 2012).
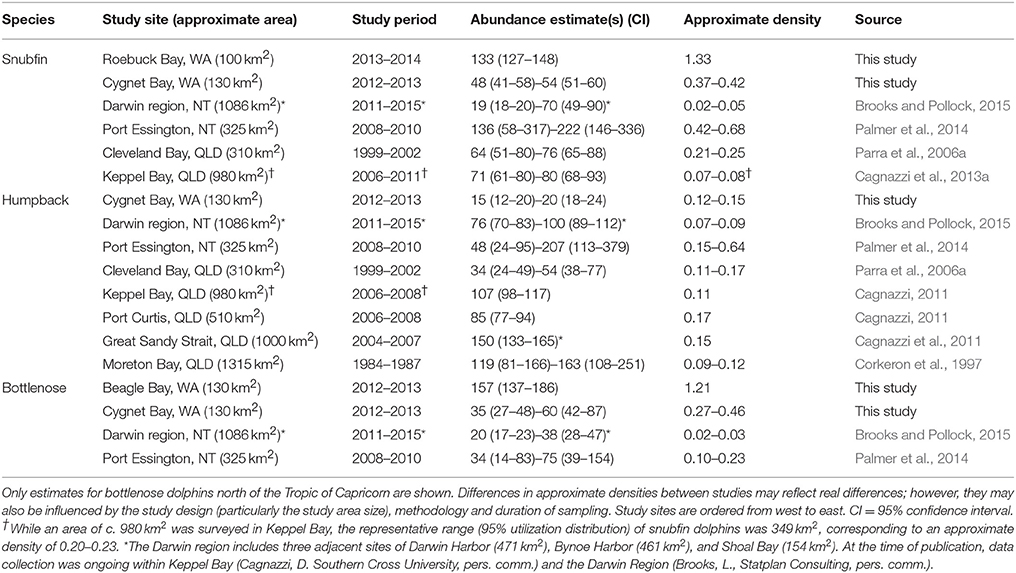
Table 1. Capture-recapture abundance estimates of snubfin, humpback, and bottlenose dolphins in Western Australia (WA), Northern Territory (NT), and Queensland (QLD).
Due to these data deficiencies, a range of potential (but largely unquantified) threats, and increasing development of coastal areas in recent decades, there have been repeated calls for improved baseline population data to support the conservation and management of inshore dolphins across northern Australia (e.g., Bannister et al., 1996; Ross, 2006; Department of the Environment, 2013a; Woinarski et al., 2014). All three species of inshore dolphin in north-western Australia are considered Matters of National Environmental Significance under national legislation (Environment Protection and Biodiversity Conservation Act, EPBC Act 1999); therefore, any action likely to have a significant impact on them must undergo environmental assessment (Department of the Environment, 2013b). However, the lack of baseline data on these species has contributed to their limited consideration in the Environmental Impact Assessment (EIA) of coastal developments to date, thereby perpetuating data deficiencies (Bejder et al., 2012). Despite the presence of numerous industrial port developments, no abundance estimates are currently available for any species of inshore dolphin across north-western Australia.
Our research aims to provide the first measures of snubfin, humpback and bottlenose dolphin abundance in north-western Australia. We focus on the Kimberley region, a remote coastline which has been subject to increasing interest for industrial port development in recent years (Department of State Development, 2010; Hanf et al., 2016). Using small vessels as a cost-effective platform, we applied a standardized photo-identification survey design to provide rigorous, site-specific baseline data at five near-shore study sites. We present encounter rates, numbers of individuals photo-identified, and capture-recapture estimates of absolute abundance. Repeated sampling provides information on the fidelity of animals to some sites. By surveying multiple study sites, we provide insight into the occurrence of inshore dolphins at a broader scale within the region, and potential movements between sites. We assess the utility of a series of abundance estimates for trend detection, and make corresponding recommendations for establishing an effective long-term study of population dynamics at an appropriate site. Based on these findings, a series of recommendations are made to support the conservation and management of inshore dolphins in northern Australia.
Methods
Study Area
The Kimberley coast of north-western Australia is long and intricate, with complex habitats subject to large, semi-diurnal tides of up to 10 m range (Cresswell et al., 2011; Figure 1). We selected five study sites: four coastal (Roebuck, Beagle, Cygnet, and Cone Bays) in the western Kimberley, and one estuarine (Inner Cambridge Gulf) in the eastern Kimberley. Combined, these sites represent 6% of the c. 6700 km length of the Kimberley mainland coastline2. Study sites were selected according to logistical constraints (e.g., accessibility, vessel launch facilities), reports of inshore dolphin sightings from local sources, and limited published sightings data (Thiele, 2010; Allen et al., 2012).
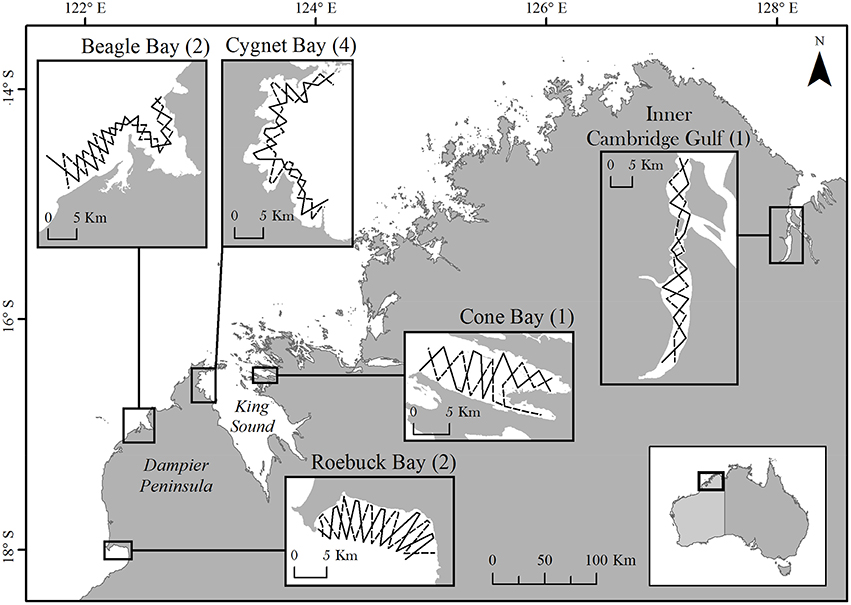
Figure 1. The Kimberley coastline of north-western Australia, showing study site locations. Numbers in parentheses indicate the number of sampling periods at each site. Only a single sampling period was conducted at Cone Bay and the Inner Cambridge Gulf due to resource limitations and very low encounter rates of dolphins, respectively. Insets show the two opposing pre-determined transect routes at each site. The coastline illustrated corresponds to the highest astronomical tide.
Data Collection
Study sites were surveyed between one and four times from 2012–2014 during the months of Apr–Jun and Sep–Oct: the dry season months which generally experience the calmest sea conditions (Table 3). For each site, we adopted a structured sampling procedure conforming to the principles of the Robust Design (Pollock, 1982; Pollock et al., 1990; Kendall et al., 1997; Smith et al., 2013), where multiple “secondary” sampling events (here, “transects”) occurred in relatively short succession over a 3–5 week “primary” period (here, “sampling period”). Successive sampling periods at the same site were separated by longer time intervals of 4–6 months.
Using a 5.6 m research vessel, study sites were surveyed by following two pre-determined transects of c. 60 km length, configured in an offset zig-zag pattern (Figure 1). At each site we aimed to cover a minimum area of c. 100 km2 at mean high water, representing a range of water depths appropriate for the species (Parra et al., 2006b). Transects extended from the coast to approximately the 10 m (lowest astronomical tide) depth contour. The two transect routes were completed alternately to a minimum total of five repeats during each sampling period. The inshore extent of survey effort varied according to the state of the tide and did not extend below 1.0 m water depth or < 200 m from shore. To reduce bias in our ability to detect dolphins, we aimed to conduct the vast majority of survey effort in Beaufort sea states ≤ two and wave height ≤ 0.3 m. Transects were completed in the shortest possible time at a survey speed of 10–12 km/h. If a transect could not be completed in a single day, effort was paused and resumed from that location at the next available opportunity (typically the following day).
A crew of 3–5 (mode = four) observers searched for dolphins from the front half of the vessel. Upon sighting dolphins, we departed from the survey transect route and approached the dolphin group to record date, time, GPS location, species, and group size, composition, and behavior. Two observers with digital SLR cameras attempted to obtain multiple photographs of the dorsal fins of all dolphins present so that at least one good-quality image of each individual present was obtained. We defined a “group” as one or more dolphins within 100 m of any other group member and involved in the same or similar behavioral activity (Bräger, 1999; Parra et al., 2006a).
Encounter Rates
Daily vessel GPS tracks were assigned on/off effort values and interpolated to lines of effort to calculate the length of each transect, which varied according to the tidal state. The total number of dolphins (including dependent calves) observed on a given transect was then divided by the transect length. Individual dolphins sighted more than once within a single transect (indicated by photo-identification) were not counted a second time. Per-transect dolphins/km values were summarized across all transects within a sampling period to provide a standardized measure of encounter rate as the mean (± SE) dolphins per km survey effort.
Image Processing
Individual dolphins were identified from photographs based on nicks and notches on the leading and trailing edges of the dorsal fin, resulting in a catalog of individuals for each study site (Würsig and Jefferson, 1990). Three different observers independently scored each individual (excluding calves) as D1 (highly distinctive), D2 (distinctive), or D3 (indistinctive) based on the number, and distinctiveness of their dorsal fin features (Urian et al., 1999, 2015). The final score was that given by ≥ two of the three observers. Both D1 and D2 individuals were included further in the analyses and are collectively referred to hereafter as “distinctive” (Nicholson et al., 2012).
A selection of the best images of each individual was retained and subject to a quality assessment based on published protocols (Rosel et al., 2011). The underlying assumption was that the least distinctive individual should be readily identifiable from the lowest quality image used in the analyses (Nicholson et al., 2012; Urian et al., 2015); images not meeting this criterion were excluded from the analyses. For consistency, the lead author performed all image quality assessments.
Rate of New Identifications, Resights Between Sampling Periods, and Movements of Individuals Between Sites
Capture histories were compiled for distinctive individuals and summary statistics were generated on the number of individuals that were re-sighted across multiple sampling periods at the same site. The cumulative number of distinctive individuals identified was calculated per day of effort and plotted as a discovery curve over time. Catalogs of distinctive individuals from each study site were cross-referenced to investigate the movement of individuals between study sites over the study period.
Proportion of Distinctive Individuals in the Population
The proportion of distinctive individuals in the population () was estimated using a group sighting-based method (as per Nicholson et al., 2012), with results pooled across sampling periods for each site to estimate a single distinctive proportion for each site/species. This method was favored over those based upon a random selection of images (e.g., Parra et al., 2006a; Palmer et al., 2014) due to potential issues of photographer bias toward more distinctive (see Read et al., 2003) or approachable individuals within a group.
Abundance Estimates
Where sufficient capture histories of distinctive animals were available, capture-recapture models were applied in program MARK (White and Burnham, 1999) to produce estimates of abundance, capture probabilities, and demographic parameters for the distinctive proportion of the population. As the number of sampling periods varied between sites, we did not restrict ourselves to a single modeling approach. Instead, we considered combinations of both open and closed models to investigate violations of closure assumptions and inform the selection of the most appropriate models for each site and species. We comprehensively considered the various assumptions and sources of bias in capture-recapture models using multiple validation approaches that are summarized in Table 2.
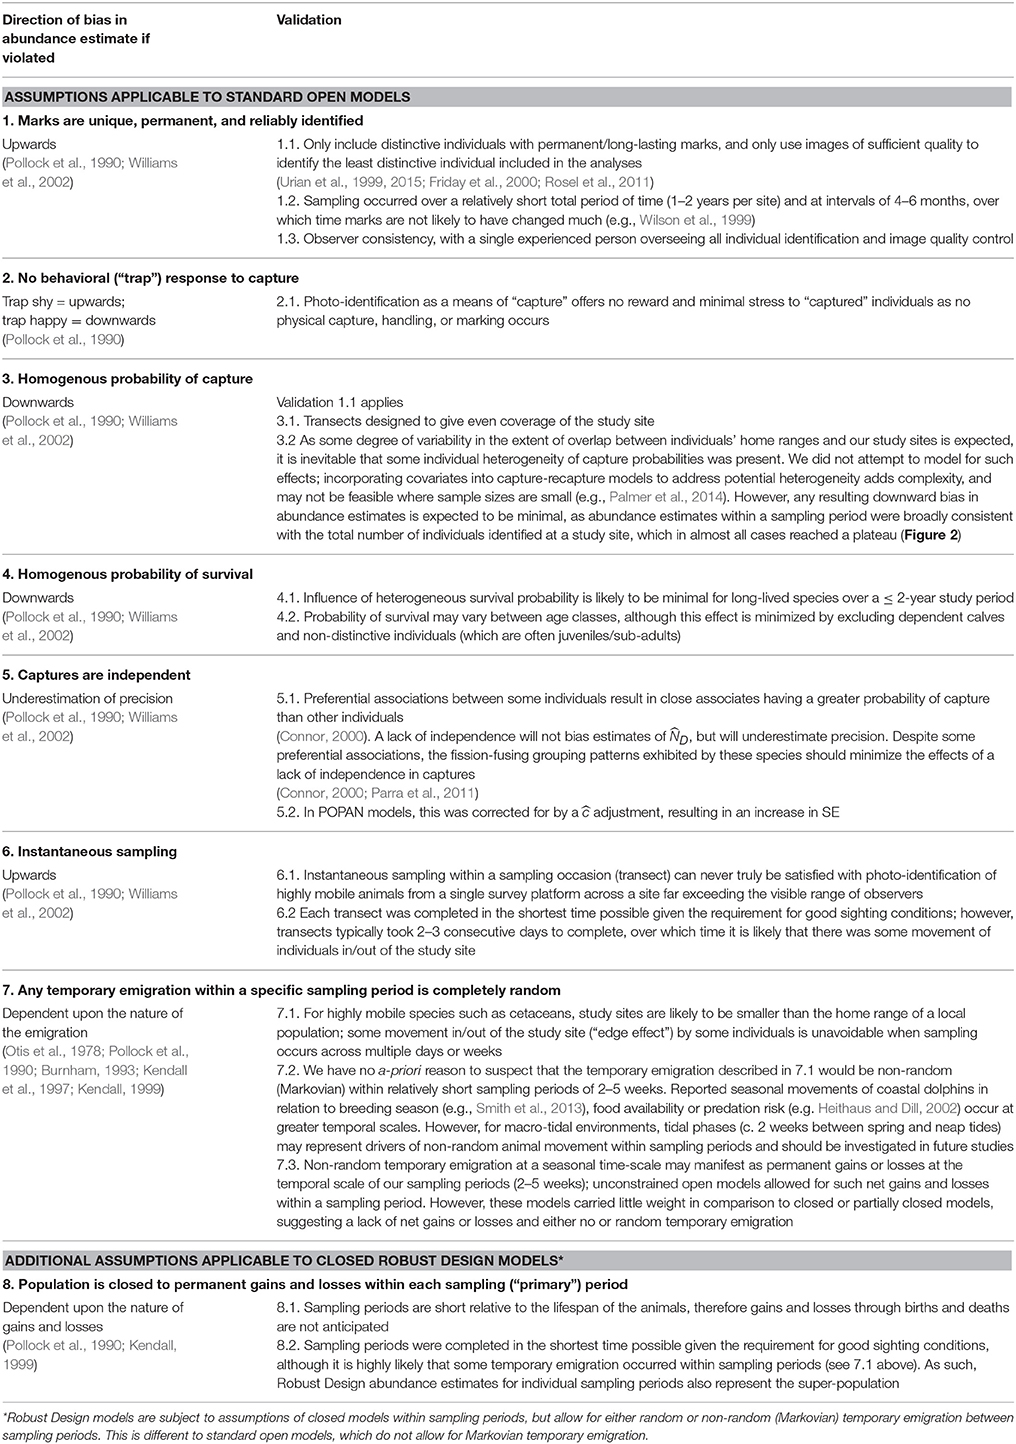
Table 2. Validation of assumptions for capture-recapture models fitted to the data.
Robust Design
Four sampling periods at Cygnet Bay permitted the use of Pollock's closed Robust Design (RD) (Pollock, 1982; Kendall et al., 1997), which has been increasingly applied to populations of coastal cetaceans (e.g., Silva et al., 2009; Cantor et al., 2012; Nicholson et al., 2012; Smith et al., 2013). This structured approach (which requires ≥ three sampling periods) facilitates the use of simpler and more precise closed models to estimate abundance within sampling periods, while also incorporating elements of open models to allow estimation of temporary emigration and apparent survival between sampling periods (Pollock et al., 1990; Kendall and Nichols, 1995; Kendall et al., 1995, 1997).
Estimated parameters within sampling periods included the distinctive population size () and capture probability (p). For p, the probability of initial capture was set equal to the probability of subsequent capture (p = c), as ‘capture’ by non-invasive photo-identification was not anticipated to elicit a ‘trap response’ (Wilson et al., 1999; Table 2). Between sampling periods, temporary emigration parameters (γ,″ γ′) were estimated, where γ″ is the probability of an individual being a temporary emigrant, given it was available for capture in the previous sampling period, whereas γ′ is the probability of an individual being a temporary emigrant, given it was unavailable (a temporary emigrant) in the previous sampling period. Parameter configurations include γ″ = γ′ = 0 (no temporary emigration); γ″ = γ′ (random temporary emigration); and, γ″ ≠ γ′ (non-random (Markovian) temporary emigration). We also estimated apparent survival (φ), defined as the probability of surviving and staying in the study area (the product of true survival and fidelity to the study area) and scaled on an annual basis. For each temporary emigration configuration, we fitted a series of models where parameters were either constant (.) or time varying (t). Three configurations of capture probability were included: time-varying within and between sampling periods, p(t); time-varying between, but not within, sampling periods p(s); and, constant within and between sampling periods p(.).
The Akaike's information criterion corrected for small sample size (AICc) was used as a measure of relative goodness-of-fit of each closed model. The model with the lowest AICc was selected as the best fitting, with consideration also given to models within two AICc units, where applicable (Burnham and Anderson, 2002). To account for model uncertainty, weighted model averaging was applied across all successfully run models to produce model-averaged estimates of . This technique is considered to produce more stable estimates than selecting a single “best” model from a number of closely-related models (Burnham and Anderson, 2002).
Open Models with Restrictions
Open models allow for demographic changes in the population over time, providing estimates for gains (births, immigration) and losses (deaths, emigration). Our sampling periods were short relative to the life history of the species, and therefore demographic closure can be assumed (Table 2). However, preliminary investigation of the capture histories and location of sightings within Roebuck and Beagle Bay sites suggested a lack of geographic closure; we observed highly variable captures per transect, a continuing rise in newly identified individuals throughout a sampling period (Figure 2), and numerous sightings at the periphery of study sites (Appendix S4 in Supplementary Material). Movement of animals in and out of a study site (temporary emigration) within a sampling period will not lead to biased estimates of abundance in either closed or open models if such movement is of a random nature (Kendall, 1999). However, estimates will be biased if temporary emigration is non-random (i.e., Markovian).
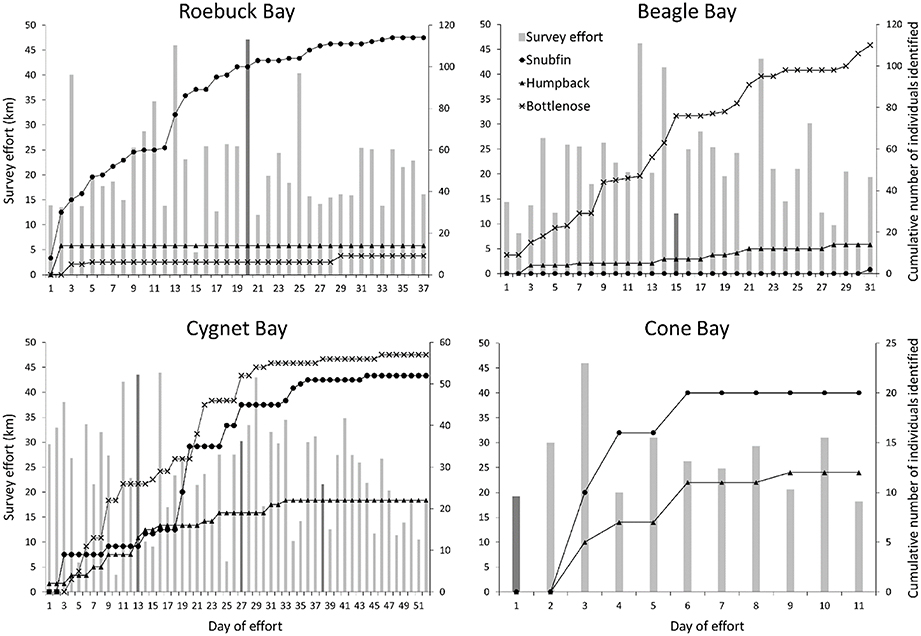
Figure 2. Daily survey effort and cumulative number of distinctive dolphin individuals identified at each site. Vertical bars illustrate daily survey effort (left y-axis); a darker bar indicates the first day of effort in each sampling period. Lines illustrate the cumulative number of snubfin (circles), humpback (triangles), and bottlenose (crosses) dolphin individuals photo-identified (right y-axis). No figure is provided for the Inner Cambridge Gulf, where only one distinctive humpback dolphin individual was identified on the penultimate day of effort.
To address suspected gains and losses within sampling periods at Roebuck and Beagle Bays, we implemented open models with various restrictions on losses and gains (see below) using the POPAN formulation of the classic Jolly-Seber open models (Schwarz and Arnason, 1996). This allowed us to fit both fully and partially closed model configurations to account for possible net gains and/or losses, along with the estimation of a ‘super-population’ parameter. The super-population, as introduced by Crosbie and Manly (1985) and Schwarz and Arnason (1996), is defined as the total number of animals that use the study site at any time during the course of the study. Furthermore, these models allow correction for animals that may enter and exit the study site rapidly between sampling events, therefore being unavailable for capture. Animals encountered during the sampling events (transects) represent components of the larger super-population, and a probability of entry of animals from the super-population into the sampled population between sampling events is estimated (Carroll et al., 2013; Tyne et al., 2014). For short duration studies of long-lived species, the super-population estimate is particularly useful where the absolute size of a population is of more interest than the abundance or density of animals within a specific area at any given time (Constantine et al., 2012; Carroll et al., 2013).
Models were fitted for each sampling period and across a data set of the two periods (separated by c. five months) combined. Estimated parameters included capture probability (p), apparent survival (φ), probability of entry (Pent), and the super-population size (). Models constrain Pent values to sum to 1 over the entire sampling period. Models were fitted with different combinations of either time-varying (t), constant (.) or varying with sampling period (s; combined periods only) apparent survival, capture probability and probability of entry. To investigate and address violation of the closure assumption, we also fitted fully closed and partially closed model configurations with φ fixed at 1 (closed to losses) and/or Pent fixed at 0 (closed to gains). For combined period models, we fitted configurations of φ and/or Pent fixed across all sampling events and/or fixed within sampling periods, but unconstrained between periods.
The program RELEASE was used in MARK to determine goodness-of-fit (Lebreton et al., 1992). Over-dispersion in the data was accounted for by estimating the over-dispersion measure using the chi-square statistic from RELEASE divided by its degrees of freedom. QAIC values were used for model selection, with the lowest QAIC value an indication of the most parsimonious model (Anderson et al., 1994). As for RD models, weighted model averaging was applied to produce model-averaged estimates of .
Estimating Total Population Size
Parameter estimates refer to the distinctive (marked) proportion of the population only (). To estimate the total population size (total), the size of the distinctive population () was divided by the proportion of distinctive animals (). The standard error of the total population size was derived using a modification of the delta method (Williams et al., 2002; Nicholson et al., 2012):
Log-normal 95% confidence intervals for total population size were calculated using the expression:
with a lower limit of total/C and upper limit of total × C (Burnham et al., 1987).
Power to Detect Trends in Abundance
We assessed the ability of a series of abundance estimates to detect population trends using Gerrodette's (1987) inequality model:
where r is the rate of change in abundance, n is the number of abundance estimates, CV is the coefficient of variation of the abundance estimate (total), Zα and Zβ are the normal deviates corresponding to the probability of making a Type I and Type II error, respectively. The one-tailed probability of making a Type I error (α) was set at 0.05, and the probability of making a Type II error was set at either 0.05 (i.e., high power = 1 – β = 0.95) and 0.20 (acceptable power = 0.80; Taylor et al., 2007). For each species and site, we calculated the mean CV of corresponding abundance estimates and used these values to inform our ability to detect trends. We excluded values of CV from estimates using two sampling periods combined, so that all CV values were representative of a single sampling period of effort. Using our estimates of CV, we predicted the number of abundance estimates required to detect 5, 10, and 20% rates of population change at annual sampling intervals.
Supplementary Material
Summary statistics were produced on the sea conditions (Beaufort sea state and wave height) during each sampling period (Appendix S1). Mean group sizes were compared between species using permutation tests (Appendix S2), and maps of sightings at each study site were plotted (Appendix S3). Capture-recapture model selection tables and parameter estimates are provided in Appendix S4.
Results
A total of 10 sampling periods were completed across the five study sites (Table 3). Individual transects varied in length from 45–69 km according to the state of the tide and specific study site, with a mean length of 60.1 ± 0.8 SE km across all study sites. The majority of survey effort occurred in sea states ≤ two and wave height ≤ 0.2 m (Appendix S1).
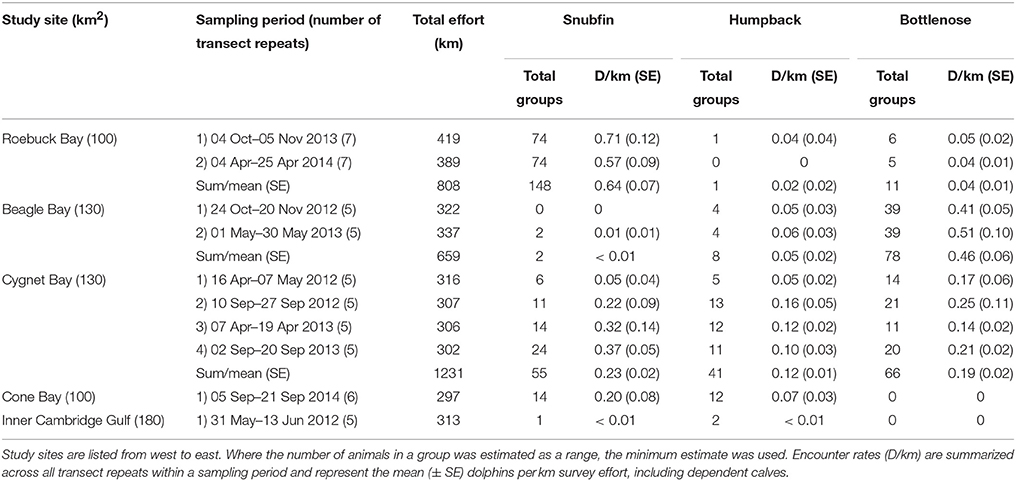
Table 3. Survey effort, and number of groups observed and encounter rate of snubfin, humpback, and bottlenose dolphins per site, species, and sampling period.
Snubfin and humpback dolphins were encountered at all study sites; bottlenose dolphins were only encountered at Roebuck, Beagle, and Cygnet Bays (Table 3). Encounter rates varied considerably between species and across study sites. Additionally, fluctuations in site-specific encounter rates between sampling periods were observed. Differences in site-specific encounter rates were most prominent for snubfin and humpback dolphins at Cygnet Bay, where very low encounter rates during the first sampling period were followed by higher values in subsequent periods. We note that the first sampling period at Cygnet Bay experienced poorer sea conditions, with greater wave heights compared to other sampling periods (Appendix S1).
Rate of New Identifications, Resights Between Sampling Periods, and Movements of Individuals Between Sites
The cumulative number of individuals identified over the course of the surveys plateaued for nearly all of the species present at each of the study sites, suggesting that the majority of animals using those sites were observed during our surveys (Figure 2). Bottlenose dolphins at Beagle Bay were an exception, however, with data showing a steady increase in the number of individuals identified over the two sampling periods. This suggests that not all individuals using the site had been identified during the study.
It is important to note that the number of sampling periods differed between sites. Given that plateaus were often only reached within the second or third sampling periods, the apparent plateaus at Cone Bay (surveyed only once) likely represent only a subset of individuals using that site; further sampling periods are likely to yield new individuals.
The proportion of individuals resighted across multiple sampling periods (separated by c. five months) varied by species and site (Figure 3). The greatest proportions of resights were of snubfin dolphins: 65% (n = 34) of individuals were sighted in ≥ three of the four sampling periods at Cygnet Bay, and 58% (n = 66) of individuals were sighted during both sampling periods at Roebuck Bay.
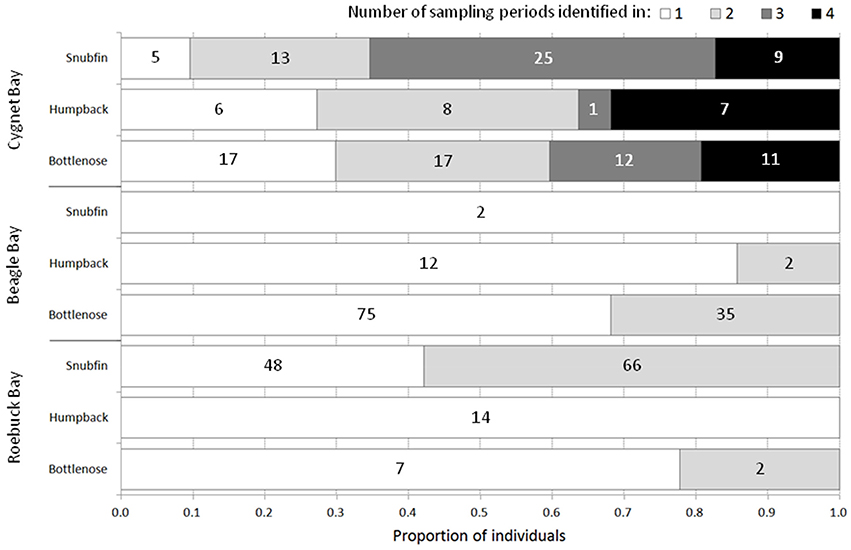
Figure 3. The proportion of individuals sighted in 1, 2, 3, or 4 sampling periods (where applicable) at each study site. The total number of sampling periods per site is 4 (Cygnet Bay) and 2 (Beagle Bay, Roebuck Bay). Numbers on bars represent the number of individuals per category.
Individuals resighted between different study sites included two bottlenose dolphins, which were sighted at both Cygnet Bay and Beagle Bay (approximately 120 km distant). The time lags between sightings were 39 and 159 days, respectively. No other individuals of any species were sighted at more than one study site.
Abundance Estimates
Sufficient data were obtained to estimate the proportion of distinctive individuals and produce capture-recapture estimates of absolute abundance for snubfin dolphins at Roebuck Bay, bottlenose dolphins at Beagle Bay, and all three species at Cygnet Bay (Table 4 and Appendix S4). For all other sites and species, the number of distinctive individuals photo-identified provided a minimum estimate of the number of identifiable animals using the site within the sampling period. Additionally, encounter rates provide an approximate measure of relative abundance for all sites and species.
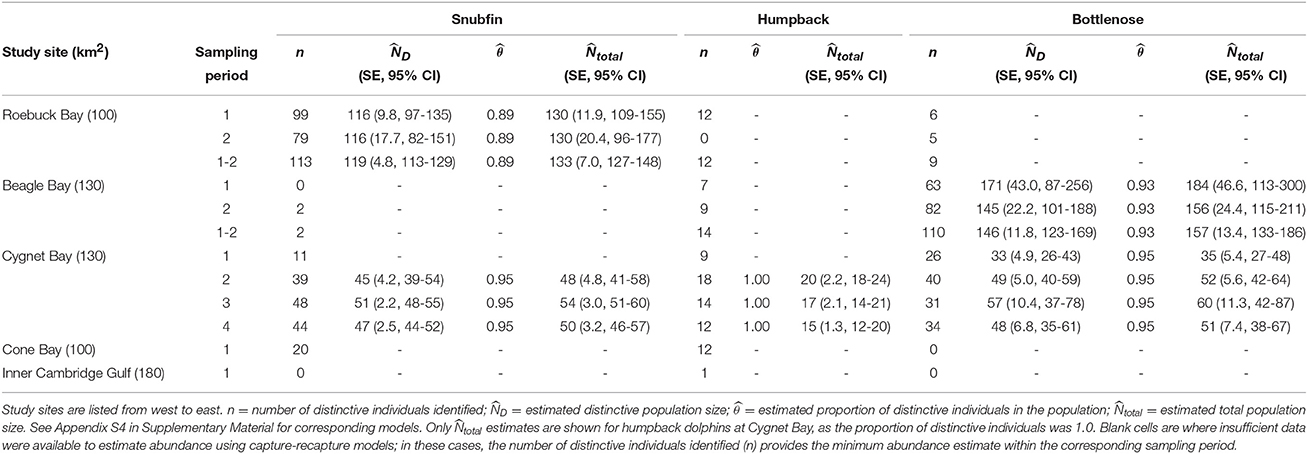
Table 4. Capture-recapture abundance estimates for snubfin, humpback, and bottlenose dolphins per site, species, and sampling period.
Abundance estimates for snubfin dolphins at both Cygnet and Roebuck Bays were stable across sampling periods at c. 50 and c. 130, respectively (Table 4). Abundance estimates of humpback dolphins at Cygnet Bay were also comparable across sampling periods, ranging from 15 to 20. For all other sites and sampling periods, ≤ 12 distinctive humpback dolphin individuals were observed in any one sampling period, and data were insufficient to run capture-recapture models (Table 4). We note that the first sampling period at Cygnet Bay was anomalous, in that insufficient captures precluded estimates of absolute abundance for either snubfin or humpback dolphins. As noted above, this was coincident with poor sea conditions, which are believed to have limited our ability to detect these species.
Abundance estimates of bottlenose dolphins at Beagle Bay were comparable across sampling periods, though the precision corresponding to those estimates was low, particularly for sampling period one. Combining the abundance across both sampling periods generated the most precise estimate of 157 (CI 133-186) bottlenose dolphins, which fell within the confidence intervals of the single period estimates and is, therefore, considered the most reliable estimate of population size for bottlenose dolphins at Beagle Bay. Abundance estimates of bottlenose dolphins at Cygnet Bay were fairly stable across sampling periods at c. 50–60 (Table 4).
Implementation of the Robust Design permitted the estimation of apparent survival (the probability of surviving and staying in the study area) and temporary emigration rates at Cygnet Bay (Appendix S4). For each species, the best-fitting model included constant apparent survival and no temporary emigration. Annual apparent survival (± SE) was 0.95 (± 0.05) for snubfin, 0.62 (± 0.12) for humpback, and 0.86 (± 0.09) for bottlenose dolphins.
For snubfin dolphins at Roebuck Bay, fully closed models with φ(.=1) and Pent(.=0) carried considerable weight in sampling period one, and also for the two sampling periods combined (Appendix S4). Sampling period two appeared more open to losses, although estimated apparent survival was still close to one (Appendix S4). For bottlenose dolphins at Beagle Bay, fully closed models and models closed to losses were dominant.
Capture probabilities, as estimated by capture-recapture models, varied considerably between sites, species and sampling occasions (Appendix S4), and are reflected in the precision of abundance estimates (Table 4). Overall, values were lowest for bottlenose dolphins at Beagle Bay, particularly during sampling period one at 0.09 (± 0.03 SE) during each transect (Tables S4–S9, Appendix S4). This sampling period corresponded with the poorest sea conditions experienced during the entire study (Appendix S1). Despite considerable variability between individuals transects, the highest estimated capture probabilities were for snubfin dolphins at Cygnet Bay, where they ranged from 0.04 to 0.79 (mean 0.38 ± 0.07 SE; Tables S4–S14, Appendix S4).
Power to Detect Trends in Abundance
As the rate of change in abundance increases, the time required to detect a change decreases (Figure 4). Accepting a lower statistical power of 80% (compared to 95% power) typically reduced the required time by approximately one year (Table 5). Based on our estimates of abundance for snubfin dolphins at Roebuck Bay (which were intermediate in terms of precision relative to other sites/species), it would take a further eight years to detect a modest annual change in abundance of 5% with acceptable (80%) statistical power (Table 5). After nine years of such a decline, the original abundance would have been reduced by a total of 34%. A higher rate of decline of 20% would be detected within just four years, although with a total 45% reduction in the original abundance.
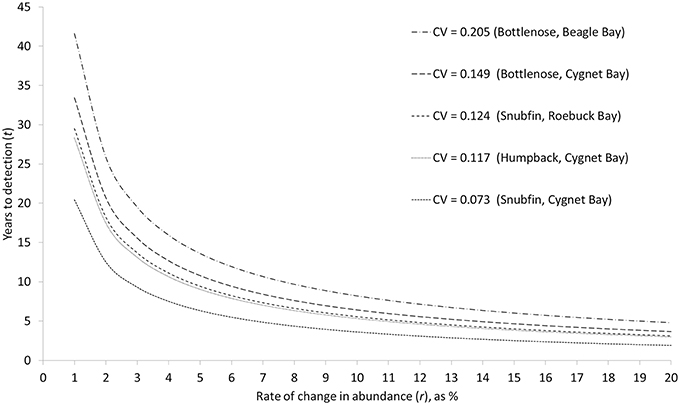
Figure 4. Relationship between different rates of change in abundance (r), and the time required to detect such a change (t) with a statistical power of 95%, given different levels of precision (CV) in annual abundance estimates. CVs are the mean CV of abundance estimates for single sampling periods.
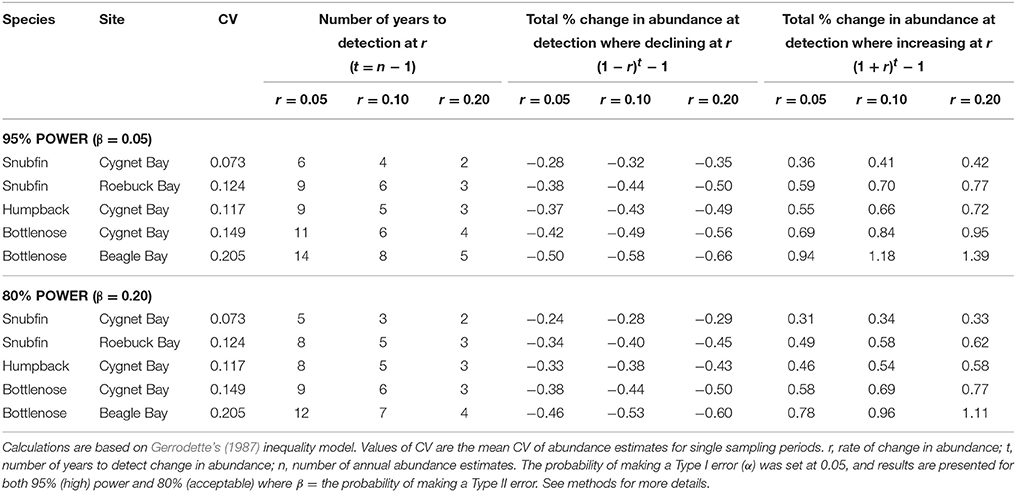
Table 5. Effects of different levels of precision (coefficient of variation, CV) of abundance estimates and statistical power on the number of years to detect different rates of change in abundance, and the corresponding total changes in abundance at the point of detecting changes.
Discussion
Abundance Estimates of Inshore Dolphins in the Kimberley Region
We applied a standardized survey design of short-duration, effort-intensive photo-identification surveys to obtain the first quantitative baseline data on the abundance and site fidelity of three inshore dolphin species in north-western Australia. Through our study design and selected analytical procedures, we consider the assumptions of the capture-recapture models used to estimate abundance to be largely met, and these estimates subject to minimal bias (Table 2).
Our estimates of snubfin dolphin abundance fell within the range of those reported elsewhere, despite our study sites being appreciably smaller (Table 1). Consistent abundance estimates across repeated sampling periods, along with a plateau in the rate of new individual identifications, suggests that the populations of c. 50 snubfin dolphins in Cygnet Bay and c. 130 in Roebuck Bay represent largely closed, local populations. Given the c. 100 km2 size of the area surveyed within Roebuck Bay, this site contains the highest density of snubfin dolphins reported from a capture-recapture study to date (see Table 1). While acknowledging that differences in approximate densities of animals between studies may also reflect differences in study design, it seems appropriate to conclude that Roebuck Bay represents particularly important habitat to snubfin dolphins.
Although observed at all study sites, infrequent observations of few humpback dolphin individuals precluded capture-recapture models at all sites except Cygnet Bay, which had an approximate density comparable to those observed in studies elsewhere (Table 1). It is likely that our relatively small study sites only overlapped with the home ranges of a small number of individuals, and the dolphins observed in these sites represent components of larger populations ranging across a wider area (Williams et al., 2002; Nicholson et al., 2012).
The abundance estimates of bottlenose dolphins at Cygnet Bay were similar to those reported for larger sites within the Northern Territory (Palmer et al., 2014; Brooks and Pollock, 2015). However, the abundance of 157 (CI 137-186) bottlenose dolphins at Beagle Bay is comparably large; this represents a density approximately comparable to those reported in high-productivity, sub-tropical embayments (e.g., Lukoschek and Chilvers, 2008; Nicholson et al., 2012), and suggests particularly favorable habitat to this species.
There were considerable differences in the relative proportions of species encountered among study sites. For example, across the c. 100 km distance between the Roebuck Bay and Beagle Bay study sites, the relative proportions of snubfin and bottlenose dolphins were reversed. All study sites were dominated by water depths (< 20 m) and distances to shore (< 5 km) characteristic of those favored by snubfin and humpback dolphins on the east coast of Australia (Parra, 2006; Parra et al., 2006b; Cagnazzi, 2011). However, sites were, to varying degrees, heterogeneous for several other environmental characteristics, including: bathymetric complexity, turbidity, the aspect and complexity of the coastline, and predominant shoreline habitats (Appendix S3). The highly turbid and estuarine waters of the Inner Cambridge Gulf (where very few individuals of any species were observed) showed the greatest disparity to other sites. It is beyond the scope of the current study to investigate the ecological driving factors behind the observed differences in species compositions. However, it is likely that differences in habitat and prey distribution, and species-specific preferences for both, are important influences on the distribution of coastal dolphins noted in this study (Parra, 2006; Parra and Jedensjö, 2014). Other potential influences include predation risk (Heithaus and Dill, 2002), social dynamics (Parra et al., 2011), and inter-specific competition (Parra, 2005).
Site Fidelity and Lack of Movement Between Sites
The inclusion of four sampling periods over two years at Cygnet Bay enabled investigation of site fidelity for the three dolphin species in this area. Apparent survival for snubfin dolphins was high (0.95), illustrating an almost complete lack of permanent emigration during the study and suggests residency of the local population. A well-defined plateau in the identification rate of new individuals (Figure 2) and stable abundance estimates across sampling periods provide support for this conclusion. There was also preliminary evidence of site fidelity within Roebuck Bay, where a majority of snubfin dolphin individuals were resighted between the two sampling periods, and very similar abundance estimates were obtained from either single or combined sampling periods. Humpback and bottlenose dolphins showed evidence of site fidelity at Cygnet Bay. However, apparent survival estimates of 0.62 for humpback and 0.85 for bottlenose dolphins are indicative of permanent emigration of individuals during the course of the study, suggesting both resident and more transient components within the sampled populations (cf. Silva et al., 2009; Palmer et al., 2014). The documented movement of two bottlenose dolphin individuals between Cygnet and Beagle Bays supports this conclusion.
Studies on snubfin and humpback dolphins on the east coast of Australia have reported either strong site fidelity within localized populations (Cagnazzi et al., 2011, 2013a), or a majority of individuals regularly occupying the same discrete area from year to year (Parra et al., 2006a). Previous studies of bottlenose dolphins have revealed variable levels of site fidelity among populations in inshore waters, although evidence of long-term residency among a proportion of the population is common (e.g., Fury and Harrison, 2008; Chabanne et al., 2012). Multiple re-sights of the same individuals of all three species have been recorded across four years of sampling in the Darwin region, Northern Territory, although considerable movement of individuals in and out of specific study sites, particularly for snubfins, also appeared to be a key feature within this region (Brooks and Pollock, 2015).
A lack of observed movement of snubfin or humpback dolphin individuals between sites separated by > 100 km of coastline suggests that movements over such distances are uncommon for these species within our study area. However, the short duration of our study is likely to have limited our ability to detect such movements. Nonetheless, genetic studies offer supporting evidence of limited connectivity between local populations for these species. Low levels of gene flow have been observed between local populations of snubfin and humpback dolphins separated by > 200 km, including snubfin dolphins at Roebuck and Cygnet Bays, to the extent that those local populations should be considered separate management units (Cagnazzi, 2011; Brown et al., 2014). Fine-scale population genetic structure appears to be common in coastal populations of bottlenose dolphins (e.g., Ansmann et al., 2012; Kopps et al., 2014) and, despite evidence of individual movement between the two sites, significant genetic differentiation has been reported between bottlenose dolphins at Cygnet Bay and Beagle Bay (Allen, 2015).
Implications for Conservation and Management
The considerable differences in the abundance of these species between surveyed sites highlight the need for site-specific baseline data collection and a better understanding of the distribution and habitat preferences of each species across their range. In the absence of appropriate baseline data, the assumption of similar relative abundance among these broadly sympatric species may grossly underestimate, or overestimate, the importance of a site to a single species. Multi-taxa aerial surveys to inform EIAs of port developments in north-western Australia to date have not been suitable for delineating between these similarly-sized, sympatric dolphin species and are therefore of limited value in assessing the characteristics of local populations (Bejder et al., 2012; Hanf et al., 2016). In order to quantitatively assess the potential impacts of coastal developments and other threatening activities on inshore dolphins, dedicated, well-designed survey methods which target shallow, near-shore waters using a survey platform and sea conditions favorable for detecting these often-cryptic species are required (e.g., Brooks et al., 2014; Brooks and Pollock, 2015; This study).
All local population sizes estimated in this study were < 160 individuals (excluding calves). While the level of connectivity between local populations of inshore dolphins in northern Australia is not well-understood, evidence of site fidelity, limited movement, and genetic differentiation suggest that they are somewhat isolated (Parra et al., 2006a; Cagnazzi, 2011; Cagnazzi et al., 2011, 2013a; Brown et al., 2014; Allen, 2015; this study). Small, largely isolated populations are at greater risk of local declines than large, stable populations due to limited resilience to mortality resulting from stochastic environmental perturbations and anthropogenic activities (Shaffer, 1981). For isolated populations of approximately 100 dolphins, the annual loss of a single individual above natural mortality is unsustainable (e.g., Slooten et al., 2006; Cagnazzi et al., 2013a). To ensure the longevity of these populations, sources of anthropogenic mortality need to be eliminated and anthropogenic stressors that impact survival require identification and mitigation.
Northern Australia's inshore dolphins are exposed to a variety of anthropogenic activities which can negatively impact the viability of local populations, although these are generally poorly understood (reviewed in Beasley et al., 2012; Woinarski et al., 2014; Parra and Cagnazzi, 2016). There are multiple avenues for both acute and chronic effects from the habitat loss and degradation caused by coastal development, which has been identified as a major threat (Jefferson et al., 2009; Allen et al., 2012; Beasley et al., 2012). Given their small population sizes and intrinsic vulnerabilities to localized decline, even single developments have the potential to result in population-level impacts if overlap with critical habitat is high (e.g., Cagnazzi et al., 2013a). This further highlights the need for the collection of appropriate pre-development data to assess and mitigate risks, along with empirical studies to better quantify impact levels. An additional, yet largely unquantified, threat to inshore dolphins in northern Australia is direct interactions with fisheries. Inshore gillnetting operations are of particular concern, and result in injury and mortality among many Orcaella, Sousa and Tursiops populations in the Indian Ocean region (Reeves et al., 2013). The current level of interactions with Australia's domestic inshore gillnet fisheries (e.g., Department of Fisheries, 2015) remains unknown. Nets are often set within habitats likely to be frequented by snubfin and humpback dolphins (e.g., creek mouths, estuaries, mangroves); therefore, some mortality is considered inevitable (Parra et al., 2006a). Quantifying the current level of direct interactions between inshore dolphins and northern Australian fisheries should be a research and management priority.
Extreme weather events (i.e., cyclones and floods) that occur in tropical northern Australia impact shallow, inshore marine habitats (e.g., seagrass loss, Preen et al., 1995). These have been linked to mortality and large-scale movements of the dugong (Dugong dugon; Preen and Marsh, 1995; Gales et al., 2004), and research on the east coast of Australia also suggests an association between flood events and elevated mortality of inshore dolphins (Cagnazzi, 2013; Meager and Limpus, 2014). It is reasonable to assume that inshore dolphin populations have adapted to persist through most such natural events, for example, through the use of refugia (see Keppel et al., 2012). However, their resilience to natural perturbations may be reduced through the cumulative effects of multiple anthropogenic stressors associated with habitat degradation, such as increased contaminant burdens or a reduction in prey availability (Cagnazzi et al., 2013b; Parra and Cagnazzi, 2016).
The value of long-term data to support conservation and adaptive management of wildlife populations is well-recognized (e.g., Clutton-Brock and Sheldon, 2010; Cheney et al., 2014), and recent expert-led prioritization exercises have emphasized the need for long-term studies of population dynamics of inshore dolphins in northern Australia (Department of the Environment, 2013a, 2015). They encourage multi-year, multi-disciplinary studies at appropriate reference sites (representing a range of levels of human impact), including data on abundance and habitat use, to facilitate: detecting trends in the abundance of local populations; the investigation of natural variability in characteristics of populations (e.g., abundance and habitat use) and their relationship to environmental stochastic events (e.g., cyclones); collecting life history data to inform assessments of population viability; and, developing a greater understanding of threatening processes and mitigation options (Department of the Environment, 2015). Such long-term studies will require considerable planning and investment, and existing data are of great value to inform the selection of suitable sites. To this end, our results provide an indication of the suitability of several candidate sites. Specifically, the abundance and accessibility of snubfin dolphins within Roebuck Bay present a scientifically suitable and relatively cost-effective candidate for long-term study (see recommendations). Roebuck Bay is subject to moderate levels of human activity, including: a growing adjacent township, port facilities, and considerable recreational vessel traffic in some areas (Department of Parks and Wildlife, 2015), presenting opportunities for the study of impacts from threatening activities. Furthermore, the imminent establishment of a 788 km2 multi-use Marine Protected Area (MPA) within Roebuck Bay, which aims to conserve a range of natural, cultural and recreational values, can provide the necessary management framework to facilitate such an ongoing study (Department of Parks and Wildlife, 2015).
While carefully designed, multi-year studies at appropriate sites will facilitate the detection of trends in the abundance of local populations, it is important to consider the challenges involved in detecting trends within populations of the sizes reported here. Even with our most precise abundance estimates, it would take a minimum of seven years to detect modest rates of change with high statistical power, by which time populations could be depleted to very low levels (Table 5). Furthermore, trends in the abundance of cetaceans can be complicated by natural variability, such as movements in or out of a study site (Forney, 2000; Parra et al., 2006a; Cheney et al., 2014). This reinforces the recommendation that implementing conservation measures should not be contingent upon statistically robust proof of a decline for small populations of cetaceans (Taylor and Gerrodette, 1993; Thompson et al., 2000; Taylor et al., 2007). Monitoring trends in abundance alone will not ensure the longevity of populations (e.g., Jaramillo-Legorreta et al., 2007; McDonald-Madden et al., 2010), and must fall within an adaptive management framework which seeks to mitigate threats and specifies precautionary trigger points for intervention (e.g., Wade, 1998; Thompson et al., 2000).
Considerations for Future Vessel-Based Studies of Inshore Dolphins
Photo-identification capture-recapture surveys and their associated data processing are often time-intensive (Lukoschek and Chilvers, 2008). However, due to their compatibility with small vessels, they remain one of the most cost-effective methods of obtaining relatively precise abundance etimates of small cetaceans, albeit at relatively small geographic scales (Dawson et al., 2008). Surveying larger sites with a single vessel in the same period of time would require a reduction in the intensity of effort, which may result in abundance estimates with poor precision (e.g., Palmer et al., 2014). Resources permitting, the use of multiple vessels simultaneously can allow larger sites to be surveyed within a short time period (e.g., Read et al., 2003) and, consequently, may facilitate the use of more robust and informative capture-recapture models (e.g., Brooks and Pollock, 2015). The cost increases of utilizing multiple vessels and additional personnel may be somewhat offset by the reduced duration of the study. Such an approach would also allow periods of favorable sea conditions to be capitalized upon (Palmer et al., 2014), and is strongly encouraged for future photo-identification surveys of inshore dolphins.
A key issue facing small vessel capture-recapture surveys for inshore dolphins in remote areas is the need for close proximity to a logistics base (i.e., accommodation, fuel, power, suitable boat launch/mooring). For the majority of the northern Australian coastline, such facilities are lacking, which presents a considerable logistical challenge to data collection. Accessibility was a key consideration in our selection of study sites; we utilized two townships and three remote aquaculture facilities. An important opportunity lies in collaborating with indigenous groups and their capacity as custodians of large areas of remote coastline throughout northern Australia3, many of which are managed as Indigenous Protected Areas4. Consequently, effective engagement of indigenous communities/ranger groups and their capacity (i.e., vessel, logistics base, personnel, knowledge of local area) can be critical to surveying these remote areas (Grech et al., 2014).
Recommendations
We make the following specific recommendations to support the conservation and management of inshore dolphins in northern Australia:
1. Dedicated, site-specific baseline data collection on inshore dolphins is an essential prerequisite to EIA of proposed coastal development and other potentially threatening activities. Species-specific abundance data are critical in order to assess the relative importance of sites to each species and the population-level significance of potential impacts. Data collection should include vessel-based surveys of comparable design to those presented here, with a minimum of two sampling periods to add confidence to results and provide preliminary evidence of site fidelity. It is critical that such surveys are conducted in appropriate sea conditions and extend into shallow, inshore habitats. For major development proposals, the development of longer-term, Before-After-Control-Impact monitoring studies are strongly recommended (e.g., Brooks and Pollock, 2015).
2. Design and implement a long-term study of the population dynamics of snubfin dolphins within Roebuck Bay to inform conservation and adaptive management. The study should represent a collaboration between indigenous land managers, wildlife management agencies and academic researchers, and be compatible with the management plan of the proposed Roebuck Bay MPA. The details of such a program, including the specific objectives and survey design, will require careful consideration (see Brooks et al., 2014), and are not discussed here. However, an inter-disciplinary approach is recommended, in order to answer a variety of pertinent questions, including trends in abundance and habitat use, the factors influencing these, and a greater understanding of the impacts of threatening activities.
3. Develop a greater understanding of the distribution and habitat preferences of tropical inshore dolphins. A compilation and spatial analysis of existing sightings data should be undertaken to investigate environmental factors influencing the distribution of each of the three species, and subsequently identify areas of likely occurrence. The results of such an exercise could inform the selection of sites for future data collection, which is of particular value to species which appear to be patchily distributed across a large, remote area.
4. Conduct studies to investigate the potential impacts of threatening activities to inshore dolphins, including a quantitative assessment of their interactions with gillnet fisheries across northern Australia. An independent observer program (see Allen et al., 2014) is urgently required to estimate the level of mortality resulting from incidental capture and develop appropriate management measures, particularly in areas of known inshore dolphin occurrence.
Author Contributions
Conceived and designed the experiments: SA, LB, KP, AB. Collected and analyzed the data: AB, with contributions to data collection from SA. Advised on the analysis: KP, Wrote the manuscript: AB, with contributions to drafting, critical review, and editorial input from SA, LB, KP.
Conflict of Interest Statement
The authors declare that the research was conducted in the absence of any commercial or financial relationships that could be construed as a potential conflict of interest.
The reviewer, Kathryn Asha Lee, and handling Editor, Rob Harcourt, declared their previous shared affiliation, and the handling Editor states that the process nevertheless met the standards of a fair and objective review. The reviewer, Alana Grech, and handling Editor, Rob Harcourt, declared their shared affiliation, and the handling Editor states that the process nevertheless met the standards of a fair and objective review.
Acknowledgments
The Australian Marine Mammal Centre (Project 11/23), WWF-Australia, and the Western Australian Marine Science Institution (Project 1.2.4) funded this research. AB was the recipient of a Murdoch University International Postgraduate Research Scholarship. The data collection would not have been possible without numerous research assistants who volunteered many weeks of hard work. Thanks go to Julian Tyne for assistance with the power analysis. We are grateful to the Kimberley Marine Research Station, Arrow Pearls, Clipper Pearls, Marine Produce Australia, Wyndham Caravan Park and Sean and Frances Archer for in-kind support at study sites. Data collection took place under permits from the WA Department of Agriculture and Food (U6/2012-2014), WA Department of Parks and Wildlife (SF009119, SF009734), with approval from Murdoch University Animal Ethics Committee (W2342/10, R2649/14), and following consultation with Yawuru, Bardi Jawi and Dambimangari indigenous representatives. Nyamba Buru Yawuru Country Managers (Roebuck Bay) and the Dambimangari Rangers (Cone Bay) assisted with data collection. We are grateful to Helene Marsh, Steve Dawson and Holly Raudino for constructive comments on an earlier version of this manuscript.
Supplementary Material
The Supplementary Material for this article can be found online at: https://www.frontiersin.org/article/10.3389/fmars.2016.00004
Footnotes
1 ^The IUCN Red List status assessment of “near threatened” for humpback dolphins in Australia was prior to the description of S. sahulensis (Jefferson and Rosenbaum, 2014) and, therefore, considered both S.sahulensis and S.chinensis as a single species (Reeves et al., 2008a). A recent evaluation of the status of S.sahulensis according to the Red List criteria concluded that a precautionary ‘vulnerable’ status was appropriate (Parra and Cagnazzi, 2016).
2 ^Based on the mean high water mark at 1:100,000 scale (Geoscience Australia, 2004) from Eighty Mile beach (western boundary) to the Western Australia/Northern Territory border (eastern boundary); excluding islands.
3 ^http://www.environment.gov.au/indigenous/workingoncountry/projects/pubs/woc-projects-map.pdf
4 ^http://www.environment.gov.au/indigenous/ipa/pubs/ipa-map-oct2014.pdf
References
Allen, S. J. (2015). Fishery-Impacted Bottlenose Dolphins of North-Western Australia: Bycatch Patterns, Genetic Status and Abundance. Ph.D. Murdoch University, Perth, WA.
Allen, S. J., Cagnazzi, D. D., Hodgson, A. J., Loneragan, N. R., and Bejder, L. (2012). Tropical inshore dolphins of north-western Australia: Unknown populations in a rapidly changing region. Pac. Conserv. Biol. 18, 56–63.
Allen, S. J., Tyne, J. A., Kobryn, H. T., Bejder, L., Pollock, K. H., and Loneragan, N. R. (2014). Patterns of dolphin bycatch in a North-Western Australian trawl fishery. PLoS ONE 9:e93178. doi: 10.1371/journal.pone.0093178
Anderson, D. R., Burnham, K. P., and White, G. C. (1994). AIC model selection in overdispersed capture-recapture data. Ecology 75, 1780–1793. doi: 10.2307/1939637
Ansmann, I. C., Parra, G. J., Lanyon, J. M., and Seddon, J. M. (2012). Fine-scale genetic population structure in a mobile marine mammal: inshore bottlenose dolphins in Moreton Bay, Australia. Mol. Ecol. 21, 4472–4485. doi: 10.1111/j.1365-294X.2012.05722.x
Bannister, J. L., Kemper, C. M., and Warneke, R. M. (1996). The Action Plan for Australian Cetaceans. Canberra, ACT: Australian Nature Conservation Agency.
Beasley, I., Allen, S. J., and Parra, G. J. (2012). Current Status of Inshore Dolphins in Northern Australia. Final Report to the Department of Sustainability, Environment, Water, Population and Communities. (Canberra, ACT).
Beasley, I., Jedensjö, M., Wijaya, G. D., Anamiato, J., Kahn, B., and Kreb, D. (2016). Observations on Australian humpback dolphins (Sousa sahulensis) in waters of the Pacific Islands and New Guinea. Adv. Mar. Biol. 73, 219–271. doi: 10.1016/bs.amb.2015.08.003
Beasley, I., Robertson, K. M., and Arnold, P. (2005). Description of a new dolphin, the Australian snubfin dolphin Orcaella heinsohni sp. N. (Cetacea, Delphinidae). Mar. Mamm. Sci. 21, 365–400. doi: 10.1111/j.1748-7692.2005.tb01239.x
Bejder, L., Hodgson, A., Loneragan, N., and Allen, S. (2012). Coastal dolphins in north-western Australia: the need for re-evaluation of species listings and short-comings in the environmental impact assessment process. Pac. Conserv. Biol. 18, 22–25.
Bräger, S. (1999). Association patterns in three populations of Hector's dolphin, Cephalorhynchus hectori. Can. J. Zool. 77, 13–18. doi: 10.1139/cjz-77-1-13
Brooks, L., and Pollock, K. (2015). The Darwin Dolphin Monitoring Program. Abundance, Apparent Survival, Movements and Habitat use of Humpback, Bottlenose and Snubfin Dolphins in the Darwin Area. Final report. Statplan Consulting Pty Ltd., 51.
Brooks, L., Carroll, E., and Pollock, K. H. (2014). Methods for Assessment of the Conservation Status of Australian Inshore Dolphins. Final report to the Department of the Environment. StatPlan Consulting Pty Ltd., 39.
Brown, A. M., Kopps, A. M., Allen, S. J., Bejder, L., Littleford-Colquhoun, B., Parra, G. J., et al. (2014). Population differentiation and hybridisation of Australian snubfin (Orcaella heinsohni) and Indo-Pacific humpback (Sousa chinensis) dolphins in north-western Australia. PLoS ONE 9:e101427. doi: 10.1371/journal.pone.0101427
Burnham, K. P. (1993). “A theory for combined analysis of ring recovery and recapture data,” in The Study of Bird Population Dynamics using Marked Individuals, eds J. D. Lebreton and P. M. North (Berlin: Birkhauser Verlag), 199–213.
Burnham, K. P., and Anderson, D. R. (2002). Model Selection and Multi-Model Inference: A Practical Information-Theoretic Approach, 2nd Edn. New York, NY: Springer-Verlag.
Burnham, K. P., Anderson, D. R., White, G. C., Brownie, C., and Pollock, K. H. (1987). Design and Analysis Methods for Fish Survival Experiments based on Release-Recapture. Bethesda, MD: American Fisheries Society.
Cagnazzi, D. (2011). Conservation Status of Australian Snubfin Dolphin, Orcaella heinsohni, and Indo-Pacific Humpback Dolphin, Sousa Chinensis, in the Capricorn Coast, Central Queensland, Australia. Ph.D., Southern Cross University, (Lismore, NSW).
Cagnazzi, D. (2013). Review of coastal dolphins in central Queensland, particularly Port Curtis and Port Alma regions. Report to Gladstone Port Corporation, 53.
Cagnazzi, D. D. B., Harrison, P. L., Ross, G. J. B., and Lynch, P. (2011). Abundance and site fidelity of indo-pacific humpback dolphins in the great sandy Strait, Queensland, Australia. Mar. Mamm. Sci. 27, 255–281. doi: 10.1111/j.1748-7692.2009.00296.x
Cagnazzi, D., Fossi, M. C., Parra, G. J., Harrison, P. L., Maltese, S., Coppola, D., et al. (2013b). Anthropogenic contaminants in Indo-Pacific humpback and Australian snubfin dolphins from the central and southern Great Barrier Reef. Environ. Pollut. 182, 490–494. doi: 10.1016/j.envpol.2013.08.008
Cagnazzi, D., Parra, G. J., Westley, S., and Harrison, P. L. (2013a). At the heart of the industrial boom: Australian snubfin dolphins in the capricorn coast, Queensland, need urgent conservation action. PLoS ONE 8:e56729. doi: 10.1371/journal.pone.0056729
Cantor, M., Wedekin, L. L., Daura-Jorge, F. G., Rossi-Santos, M. R., and Simões-Lopes, P. C. (2012). Assessing population parameters and trends of Guiana dolphins (Sotalia guianensis): an eight-year mark-recapture study. Mar. Mamm. Sci. 28, 63–83. doi: 10.1111/j.1748-7692.2010.00456.x
Carroll, E. L., Childerhouse, S. J., Fewster, R. M., Patenaude, N. J., Steel, D., Dunshea, G., et al. (2013). Accounting for female reproductive cycles in a superpopulation capture-recapture framework. Ecol. Appl. 23, 1677–1690. doi: 10.1890/12-1657.1
Chabanne, D., Finn, H., Salgado-Kent, C., and Bejder, L. (2012). Identification of a resident community of bottlenose dolphins (Tursiops aduncus) in the Swan Canning Riverpark, Western Australia, using behavioural information. Pac. Conserv. Biol. 18, 247–262.
Cheney, B., Corkrey, R., Durban, J. W., Grellier, K., Hammond, P. S., Islas-Villanueva, V., et al. (2014). Long-term trends in the use of a protected area by small cetaceans in relation to changes in population status. Glob. Ecol. Conserv. 2, 118–128. doi: 10.1016/j.gecco.2014.08.010
Chilvers, B. L., and Corkeron, P. J. (2003). Abundance of Indo-Pacific bottlenose dolphins, Tursiops aduncus, off Point Lookout, Queensland, Australia. Mar. Mamm. Sci. 19, 85–95. doi: 10.1111/j.1748-7692.2003.tb01094.x
Clutton-Brock, T., and Sheldon, B. C. (2010). Individuals and populations: the role of long-term, individual-based studies of animals in ecology and evolutionary biology. Trends Ecol. Evol. 25, 562–573. doi: 10.1016/j.tree.2010.08.002
Connor, R. C. (2000). “Group living in whales and dolphins,” in Cetacean Societies: Field Studies of Dolphins and Whales, eds J. Mann, R. C. Connor, P. L. Tyack, and H. Whitehead (Chicago, IL: The University of Chicago Press), 199–218.
Constantine, R., Jackson, J. A., Steel, D., Baker, C. S., Brooks, L., Burns, D., et al. (2012). Abundance of humpback whales in Oceania using photo-identification and microsatellite genotyping. Mar. Ecol. Prog. Ser. 453, 249–261. doi: 10.3354/meps09613
Corkeron, P. J., Morissette, N. M., Porter, L., and Marsh, H. (1997). Distribution and status of hump-backed dolphins, Sousa chinensis, in Australian waters. Asian Mar. Biol. 14, 49–59.
Cresswell, I. D., Bridgewater, P., and Semeniuk, V. (2011). The coastal habitats and vegetation of the Kimberley region. J. R. Soc. West. Aust. 94, 197–206.
Crosbie, S. F., and Manly, B. F. J. (1985). Parsimonious modelling of capture-mark-recapture studies. Biometrics 41, 385–398. doi: 10.2307/2530864
Dawson, S., Wade, P., Slooten, E., and Barlow, J. (2008). Design and field methods for sighting surveys of cetaceans in coastal and riverine habitats. Mamm. Rev. 38, 19–49. doi: 10.1111/j.1365-2907.2008.00119.x
Department of Fisheries (2015). Barramundi Commercial Fishing. Gov. West. Aust. Available online at: http://www.fish.wa.gov.au/Species/Barramundi/Pages/Barramundi-Commercial-Fishing.aspx (Accessed June 11, 2015).
Department of Parks Wildlife (2015). Proposed Yawuru Nagulagun/Roebuck Bay Marine Park: Indicative Joint Management Plan 2015. (Perth, WA; Department of Parks and Wildlife), 104.
Department of State Development (2010). Browse Liquefied Natural Gas Precinct: Strategic Assessment Report. Department of State Development, Government of Western Australia.
Department of the Environment (2013a). Coordinated Research Framework to Assess the National Conservation Status of Australian Snubfin Dolphins (Orcaella heinsohni) and other Tropical Inshore Dolphins. Canberra, ACT: Commonwealth Government of Australia, 21.
Department of the Environment (2013b). Matters of National Environmental Significance. Significant Impact Guidelines 1.1. Canberra, ACT: Australian Government, 35.
Department of the Environment (2015). A Coordinated National Research Framework to Inform the Conservation and Management of Australia's Tropical Inshore Dolphins. Canberra, ACT: Commonwealth Government of Australia, 48.
Forney, K. A. (2000). Environmental models of cetaceans abundance: reducing uncertainty in population trends. Conserv. Biol. 14, 1271–1286. doi: 10.1046/j.1523-1739.2000.99412.x
Friday, N., Smith, T. D., Stevick, P. T., and Allen, J. (2000). Measurement of photographic quality and individual distinctiveness for the photographic identification of humpback whales, Megaptera novaeangliae. Mar. Mamm. Sci. 16, 355–374. doi: 10.1111/j.1748-7692.2000.tb00930.x
Fury, C. A., and Harrison, P. L. (2008). Abundance, site fidelity and range patterns of Indo-Pacific bottlenose dolphins (Tursiops aduncus) in two Australian subtropical estuaries. Mar. Freshw. Res. 59, 1015–1027. doi: 10.1071/MF08109
Gales, N., McCauley, R. D., Lanyon, J., and Holley, D. (2004). Change in abundance of dugongs in Shark Bay, Ningaloo and Exmouth Gulf, Western Australia: evidence for large-scale migration. Wildl. Res. 31, 283–290. doi: 10.1071/WR02073
Gerrodette, T. (1987). A power analysis for detecting trends. Ecology 68, 1364–1372. doi: 10.2307/1939220
Grech, A., Parra, G. J., Beasley, I., Bradley, J., Johnson, S., Whiting, S., et al. (2014). Local assessments of marine mammals in cross-cultural environments. Biodivers. Conserv. 23, 3319–3338. doi: 10.1007/s10531-014-0783-6
Hammond, P., Bearzi, G., Bjørge, A., Forney, K., Karkzmarski, L., Kasuya, T., et al. (2012). Tursiops aduncus. IUCN Red List Threatened Species. 2012:e.T41714A17600466. doi: 10.2305/IUCN.UK.2012.RLTS.T41714A17600466. Available online at: http://dx.doi.org/10.2305/IUCN.UK.2012.RLTS.T41714A17600466.en
Hanf, D., Hunt, T., and Parra, G. J. (2016). Humpback dolphins of Western Australia: a review of current knowledge and recommendations for future management. Adv. Mar. Biol. 73, 193–218. doi: 10.1016/bs.amb.2015.07.004
Heithaus, M. R., and Dill, L. M. (2002). Food availability and tiger shark predation risk influence bottlenose dolphin habitat use. Ecology 83, 480–491. doi: 10.1890/0012-9658(2002)083[0480:FAATSP]2.0.CO;2
IUCN (2015). IUCN Red List of Threatened Species Version 2015.2. Available online at: http://www.iucnredlist.org/
Jaramillo-Legorreta, A., Rojas-Bracho, L., Brownell, R. L., Read, A. J., Reeves, R. R., Ralls, K., et al. (2007). Saving the vaquita: immediate action, not more data. Conserv. Biol. 21, 1653–1655. doi: 10.1111/j.1523-1739.2007.00825.x
Jefferson, T. A., and Rosenbaum, H. C. (2014). Taxonomic revision of the humpback dolphins (Sousa spp.), and description of a new species from Australia. Mar. Mamm. Sci. 30, 1494–1541. doi: 10.1111/mms.12152
Jefferson, T. A., Hung, S. K., and Würsig, B. (2009). Protecting small cetaceans from coastal development: impact assessment and mitigation experience in Hong Kong. Mar. Policy 33, 305–311. doi: 10.1016/j.marpol.2008.07.011
Kendall, W. L. (1999). Robustness of closed capture-recapture methods to violations of the closure assumption. Ecology 80, 2517–2525.
Kendall, W. L., and Nichols, J. D. (1995). On the use of secondary capture-recapture samples to estimate temporary emigration and breeding proportions. J. Appl. Stat. 22, 751–762. doi: 10.1080/02664769524595
Kendall, W. L., Nichols, J. D., and Hines, J. E. (1997). Estimating temporary emigration using capture-recapture data with Pollock's robust design. Ecology 78, 563–578.
Kendall, W. L., Pollock, K. H., and Brownie, C. (1995). A likelihood-based approach to capture-recapture estimation of demographic parameters under the robust design. Biometrics 51, 293–308. doi: 10.2307/2533335
Keppel, G., Van Niel, K. P., Wardell-Johnson, G. W., Yates, C. J., Byrne, M., Mucina, L., et al. (2012). Refugia: identifying and understanding safe havens for biodiversity under climate change. Glob. Ecol. Biogeogr. 21, 393–404. doi: 10.1111/j.1466-8238.2011.00686.x
Kopps, A. M., Ackermann, C., Sherwin, W. B., Allen, S. J., Bejder, L., and Krützen, M. (2014). Cultural transmission of tool use combined with habitat specialisations leads to fine-scale genetic structure in bottlenose dolphins. Proc. R. Soc. B 281, 20133245. doi: 10.1098/rspb.2013.3245
Krützen, M., and Allen, S. J. (2008). “The Indo-Pacific bottlenose dolphin Tursiops aduncus,” in The Mammals of Australia, eds S. Van Dyck and R. Strahan (Sydney, NSW: New Holland), 837–838.
Lebreton, J. D., Burnham, K. P., Clobert, J., and Anderson, D. R. (1992). Modeling survival and testing biological hypotheses using marked animals: a unified approach with case studies. Ecol. Monogr. 62, 67–118. doi: 10.2307/2937171
Lewison, R., Crowder, L., Read, A., and Freeman, S. (2004). Understanding impacts of fisheries bycatch on marine megafauna. Trends Ecol. Evol. 19, 598–604. doi: 10.1016/j.tree.2004.09.004
Lukoschek, V., and Chilvers, B. L. (2008). A robust baseline for bottlenose dolphin abundance in coastal Moreton Bay: a large carnivore living in a region of escalating anthropogenic impacts. Wildl. Res. 35, 593–605. doi: 10.1071/WR07021
McDonald-Madden, E., Baxter, P. W. J., Fuller, R. A., Martin, T. G., Game, E. T., Montambault, J., et al. (2010). Monitoring does not always count. Trends Ecol. Evol. 25, 547–550. doi: 10.1016/j.tree.2010.07.002
Meager, J. J., and Limpus, C. (2014). Mortality of inshore marine mammals in eastern Australia is predicted by freshwater discharge and air temperature. PLoS ONE 9:e94849. doi: 10.1371/journal.pone.0094849
Nicholson, K., Bejder, L., Allen, S. J., Krützen, M., and Pollock, K. H. (2012). Abundance, survival and temporary emigration of bottlenose dolphins (Tursiops sp.) off Useless Loop in the western gulf of Shark Bay, Western Australia. Mar. Freshw. Res. 63, 1059–1068. doi: 10.1071/MF12210
NRC (2005). Marine Mammal Populations and Ocean Noise: Determining When Noise Causes Biologically Significant Effects. Washington, DC: The National Academy Press; National Research Council.
Otis, D. L., Burnham, K. P., White, G. C., and Anderson, D. R. (1978). Statistical inference from capture data on closed animal populations. Wildl. Monogr. 62, 3–135.
Palmer, C., Brooks, L., Parra, G. J., Rogers, T., Glasgow, D., and Woinarski, J. C. Z. (2014). Estimates of abundance and apparent survival of coastal dolphins in Port Essington harbour, Northern Territory, Australia. Wildl. Res. 41, 35–45. doi: 10.1071/WR14031
Parra, G. J. (2005). Behavioural Ecology of Irrawaddy, Orcaella brevirostris (Owen in Gray, 1866), and Indo-Pacific Humpback Dolphins, Sousa Chinensis (Osbeck, 1765), in Northeast Queensland, Australia: A Comparative Study. Ph.D., James Cook University, Townsville, QLD.
Parra, G. J. (2006). Resource partitioning in sympatric delphinids: space use and habitat preferences of Australian snubfin and Indo-Pacific humpback dolphins. J. Anim. Ecol. 75, 862–874. doi: 10.1111/j.1365-2656.2006.01104.x
Parra, G. J., and Cagnazzi, D. (2016). Conservation status of the Australian humpback dolphin (Sousa sahulensis) using the IUCN Red List criteria. Adv. Mar. Biol. 73, 157–192. doi: 10.1016/bs.amb.2015.07.006
Parra, G. J., and Jedensjö, M. (2014). Stomach contents of Australian snubfin (Orcaella heinsohni) and Indo-Pacific humpback dolphins (Sousa chinensis). Mar. Mamm. Sci. 30, 1184–1198. doi: 10.1111/mms.12088
Parra, G. J., Azuma, C., Preen, A. R., Corkeron, P. J., and Marsh, H. (2002). Distribution of Irrawaddy dolphins, Orcaella brevirostris, in Australian waters. Raffles Bull. Zool. (Suppl. 10), 141–154.
Parra, G. J., Corkeron, P. J., and Arnold, P. (2011). Grouping and fission-fusion dynamics in Australian snubfin and Indo-Pacific humpback dolphins. Anim. Behav. 82, 1423–1433. doi: 10.1016/j.anbehav.2011.09.027
Parra, G. J., Corkeron, P. J., and Marsh, H. (2004). The Indo-Pacific Humpback Dolphin, Sousa chinensis (Osbeck, 1765), in Australian Waters: a summary of current knowledge. Aquat. Mamm. 30, 197–206. doi: 10.1578/AM.30.1.2004.197
Parra, G. J., Corkeron, P. J., and Marsh, H. (2006a). Population sizes, site fidelity and residence patterns of Australian snubfin and Indo-Pacific humpback dolphins: implications for conservation. Biol. Conserv. 129, 167–180. doi: 10.1016/j.biocon.2005.10.031
Parra, G. J., Schick, R., and Corkeron, P. J. (2006b). Spatial distribution and environmental correlates of Australian snubfin and Indo-Pacific humpback dolphins. Ecography (Cop.). 29, 396–406. doi: 10.1111/j.2006.0906-7590.04411.x
Peel, D., Bravington, M., Kelly, N., and Double, M. C. (2015). Designing an effective mark-recapture study of Antarctic blue whales. Ecol. Appl. 25, 1003–1015. doi: 10.1890/14-1169.1
Pollock, K. H. (1982). A capture-recapture design robust to unequal probability of capture. J. Wildl. Manage. 46, 752–757. doi: 10.2307/3808568
Pollock, K. H., Nichols, J. D., Brownie, C., and Hines, J. E. (1990). Statistical inference for capture-recapture experiments. Wildl. Monogr. 107, 3–97.
Preen, A. R., Lee Long, W. J., and Coles, R. G. (1995). Flood and cyclone related loss, and partial recovery, of more than 1000 km2 of seagrass in Hervey Bay, Queensland, Australia. Aquat. Bot. 52, 3–17. doi: 10.1016/0304-3770(95)00491-H
Preen, A. R., Marsh, H., Lawler, I. R., Prince, R. I. T., and Shepherd, R. (1997). Distribution and abundance of dugongs, turtles, dolphins and other megafauna in Shark Bay, Ningaloo Reef and Exmouth Gulf, Western Australia. Wildl. Res. 24, 185–208. doi: 10.1071/WR95078
Preen, A., and Marsh, H. (1995). Response of dugongs to large-scale loss of seagrass from Hervey Bay, Queensland, Australia. Wildl. Res. 22, 507–519. doi: 10.1071/WR9950507
Read, A. J., Urian, K. W., Wilson, B., and Waples, D. M. (2003). Abundance of bottlenose dolphins in the bays, sounds, and estuaries of North Carolina. Mar. Mamm. Sci. 19, 59–73. doi: 10.1111/j.1748-7692.2003.tb01092.x
Reeves, R. R., Dalebout, M. L., Jefferson, T. A., Karczmarski, L., Laidre, K., O'Corry-Crowe, G., et al. (2008a). Sousa chinensis. IUCN Red List Threatened Species. 2008:e.T20424A9197694. doi: 10.2305/IUCN.UK.2008.RLTS.T20424A9197694. Available online at: http://dx.doi.org/10.2305/IUCN.UK.2008.RLTS.T20424A9197694.en
Reeves, R. R., Jefferson, T. A., Karczmarski, L., Laidre, K., O'Corry-Crowe, G., Rojas-Bracho, L., et al. (2008b). Orcaella heinsohni. The IUCN Red List of Threatened Species. 2008:e.T136315A4273414. doi: 10.2305/IUCN.UK.2008.RLTS.T136315A4273414. Available online at: http://dx.doi.org/10.2305/IUCN.UK.2008.RLTS.T136315A4273414.en
Reeves, R. R., McClellan, K., and Werner, T. B. (2013). Marine mammal bycatch in gillnet and other entangling net fisheries, 1990 to 2011. Endanger. Species Res. 20, 71–97. doi: 10.3354/esr00481
Rojas-Bracho, L., Reeves, R. R., and Jaramillo-Legorreta, A. (2006). Conservation of the vaquita Phocoena sinus. Mamm. Rev. 36, 179–216. doi: 10.1111/j.1365-2907.2006.00088.x
Rosel, P. E., Mullin, K. D., Garrison, L., Schwacke, L., Adams, J., Balmer, B., et al. (2011). Photo-Identification Capture-Mark-Recapture Techniques for Estimating Abundance of Bay, Sound and Estuary Populations of Bottlenose Dolphins along the U.S. East Coast and Gulf of Mexico: A Workshop Report. NOAA Technical Memorandum, NMFS-SEFSC, 30.
Ross, G. J. B. (2006). Review of the Conservation Status of Australia's Smaller Whales and Dolphins. Canberra, ACT: Australian Government.
Schwarz, C. J., and Arnason, A. N. (1996). A general methodology for the analysis of capture-recapture experiments in open populations. Biometrics 52, 860–873. doi: 10.2307/2533048
Shaffer, M. L. (1981). Minimum population sizes for species conservation. Bioscience 31, 131–134. doi: 10.2307/1308256
Silva, M. A., Magalhães, S., Prieto, R., Santos, R. S., and Hammond, P. S. (2009). Estimating survival and abundance in a bottlenose dolphin population taking into account transience and temporary emigration. Mar. Ecol. Prog. Ser. 392, 263–276. doi: 10.3354/meps08233
Slooten, E., Dawson, S., Rayment, W., and Childerhouse, S. (2006). A new abundance estimate for Maui's dolphin: what does it mean for managing this critically endangered species? Biol. Conserv. 128, 576–581. doi: 10.1016/j.biocon.2005.10.013
Slooten, E., Wang, J. Y., Dungan, S. Z., Forney, K. A., Hung, S. K., Jefferson, T. A., et al. (2013). Impacts of fisheries on the critically endangered humpback dolphin sousa chinensis population in the eastern Taiwan Strait. Endanger. Species Res. 22, 99–114. doi: 10.3354/esr00518
Smith, H. C., Pollock, K., Waples, K., Bradley, S., and Bejder, L. (2013). Use of the robust design to estimate seasonal abundance and demographic parameters of a coastal bottlenose dolphin (Tursiops aduncus) population. PLoS ONE 8:e76574. doi: 10.1371/annotation/369119db-d9ca-4473-9390-89ee0c2a532f
Taylor, B. L. (2002). “Conservation biology,” in Encyclopedia of Marine Mammals, eds W. F. Perrin, B. Würsig, and J. G. M. Thewissen (San Diego, CA: Academic Press), 273–276.
Taylor, B. L., and Gerrodette, T. (1993). The uses of statistical power in conservation biology: the vaquita and northern spotted owl. Conserv. Biol. 7, 489–500. doi: 10.1046/j.1523-1739.1993.07030489.x
Taylor, B. L., Martinez, M., Gerrodette, T., Barlow, J., and Hrovat, Y. N. (2007). Lessons from monitoring trends in the abundance of marine mammals. Mar. Mamm. Sci. 23, 157–175. doi: 10.1111/j.1748-7692.2006.00092.x
Thiele, D. (2010). Collision Course: Snubfin Dolphin Injuries in Roebuck Bay. Report to WWF-Australia, 15.
Thompson, P. M., Wilson, B., Grellier, K., and Hammond, P. S. (2000). Combining power analysis and population viability analysis to compare traditional and precautionary approaches to conservation of coastal cetaceans. Conserv. Biol. 14, 1253–1263. doi: 10.1046/j.1523-1739.2000.00099-410.x
Tyne, J. A., Pollock, K. H., Johnston, D. W., and Bejder, L. (2014). Abundance and survival rates of the Hawai'i island associated spinner dolphin (Stenella longirostris) stock. PLoS ONE 9:e86132. doi: 10.1371/journal.pone.0086132
Urian, K. W., Hohn, A. A., and Hansen, L. J. (1999). Status of the Photo-Identification Catalog of Coastal Bottlenose Dolphins of the Western North Atlantic: Report of a Workshop of Catalog Contributors. NOAA Administrative Report NMFS-SEFSC-425. US Department of Commerce, 24.
Urian, K., Gorgone, A., Read, A., Balmer, B., Wells, R. S., Berggren, P., et al. (2015). Recommendations for photo-identification methods used in capture-recapture models with cetaceans. Mar. Mamm. Sci. 31, 298–321. doi: 10.1111/mms.12141
Wade, P. R. (1998). Calculating limits to the allowable human-caused mortality of cetaceans and pinnipeds. Mar. Mamm. Sci. 14, 1–37. doi: 10.1111/j.1748-7692.1998.tb00688.x
White, G. C., and Burnham, K. P. (1999). Program MARK: survival estimation from populations of marked animals. Bird Study 46, S120–S139. doi: 10.1080/00063659909477239
Williams, B. K., Nichols, J. D., and Conroy, M. J. (2002). Analysis and Management of Animal Populations. San Diego, CA: Academic Press.
Williams, R., and Thomas, L. (2009). Cost-effective abundance estimation of rare animals: testing performance of small-boat surveys for killer whales in British Columbia. Biol. Conserv. 142, 1542–1547. doi: 10.1016/j.biocon.2008.12.028
Wilson, B., Hammond, P. S., and Thompson, P. M. (1999). Estimating size and assessing trends in a coastal bottlenose dolphin population. Ecol. Appl. 9, 288–300. doi: 10.1890/1051-0761(1999)009[0288:ESAATI]2.0.CO;2
Keywords: baseline data, capture-recapture, abundance estimation, coastal delphinids, robust design, apparent survival, power analysis, trend detection
Citation: Brown AM, Bejder L, Pollock KH and Allen SJ (2016) Site-Specific Assessments of the Abundance of Three Inshore Dolphin Species to Inform Conservation and Management. Front. Mar. Sci. 3:4. doi: 10.3389/fmars.2016.00004
Received: 13 September 2015; Accepted: 11 January 2016;
Published: 09 February 2016.
Edited by:
Rob Harcourt, Macquarie University, AustraliaReviewed by:
Alana Grech, Macquarie University, AustraliaKathryn Asha Lee, New South Wales Fisheries, Australia
Copyright © 2016 Brown, Bejder, Pollock and Allen. This is an open-access article distributed under the terms of the Creative Commons Attribution License (CC BY). The use, distribution or reproduction in other forums is permitted, provided the original author(s) or licensor are credited and that the original publication in this journal is cited, in accordance with accepted academic practice. No use, distribution or reproduction is permitted which does not comply with these terms.
*Correspondence: Alexander M. Brown, alex.brown@murdoch.edu.au