Scaling Laws in Phytoplankton Nutrient Uptake Affinity
 Christian Lindemann
 Øyvind Fiksen
 Ken H. Andersen
 Dag L. Aksnes
- 1Department of Biology, University of Bergen and Hjort Centre for Marine Ecosystem Dynamics, Bergen, Norway
- 2VKR Centre for Ocean Life, National Institute for Aquatic Resources, Technical University of Denmark, Charlottenlund, Denmark
Nutrient uptake affinity affects the competitive ability of microbial organisms at low nutrient concentrations. From the theory of diffusion limitation it follows that uptake affinity scales linearly with the cell radius. This is in conflict with some observations suggesting that uptake affinity scales to a quantity that is closer to the square of the radius, i.e., to cell surface area. We show that this apparent conflict can be resolved by nutrient uptake theory. Pure diffusion limitation assumes that the cell is a perfect sink which means that it is able to absorb all encountered nutrients instantaneously. Here, we provide empirical evidence that the perfect sink strategy is not common in phytoplankton. Although, small cells are indeed favored by a large surface to volume ratio, we show that they are punished by higher relative investment cost in order to fully benefit from the larger surface to volume ratio. We show that there are two reasons for this. First, because the small cells need a higher transporter density (p) in order to maximize their affinity, and second because the relative cost of a transporter is higher for a small than for a large cell. We suggest, that this might explain why observed uptake affinities do not scale linearly with the cell radius.
Introduction
In a recent review of microbial nutrient uptake models (Fiksen et al., 2013) it was noted, that nutrient uptake affinity is a consistent and meaningful measure of competitive strength in microbes. This is because, at very limiting nutrient concentrations, the nutrient uptake rate is simply a product of the affinity and the nutrient concentration. This is particularly useful for the analyses of competitive relationships in oligotrophic conditions. Further, the scaling relationship between nutrient uptake affinity and organism size, often referred to as the master trait (Litchman and Klausmeier, 2008), is of considerable interest (e.g., Tambi et al., 2009; Edwards et al., 2012; Andersen et al., 2015). Encounters between microbial organisms and nutrient molecules are facilitated by molecular diffusion. The nutrient uptake rate (V) of a spherical cell of radius (r) can be expressed V = 4πDr(S − Sr) (Pasciak and Gavis, 1974), which suggests that the nutrient uptake rate is proportional to the radius rather than to cell surface. Here, D is the diffusion rate for the nutrient molecules in seawater (symbols and their units are summarized in Table 1). The nutrient concentration at the cell surface is Sr, and S is the concentration at infinite distance. In practice S can be taken as the bulk nutrient concentration of the seawater. Note that this simple uptake model has no explicit representation of internal cellular constraints such as nutrient handling. The biological constraints on uptake will here be reflected in elevated Sr concentrations. For derivation of uptake models with explicit representations of both physical and biological constraints we refer to Fiksen et al. (2013). Nevertheless, the term 4πDr of the above expression defines the maximal affinity (αmax with unit μm3 s−1 cell−1) of a spherical cell and this quantity is also present in uptake models with explicit representation of nutrient handling. It should be noted, however, that neither the maximal affinity nor the realized affinity coefficient is affected by handling time (see Section Methods). Another quantity, the specific affinity is obtained by dividing affinity by a proxy for the cellular biomass such as the carbon content or the cell volume. If the cell volume is used, the unit becomes s−1, i.e., the same as in growth rate. Specific affinity is often used as an index of competitive uptake ability for nutrients and therefore used in comparisons between species (e.g., Tambi et al., 2009). Unless otherwise stated, in the present study affinity refers to the quantity with unit μm3 s−1 cell−1.
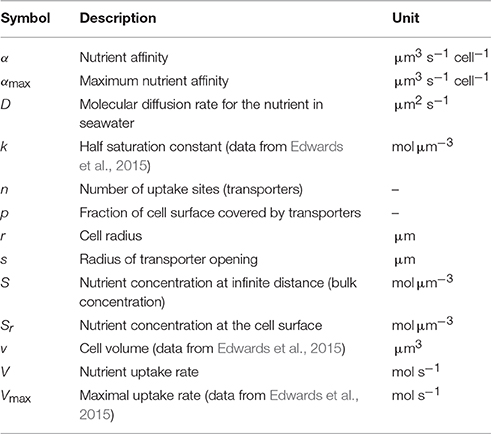
Table 1. Explanation to symbols used in the text.
A cell capable of immediate absorption of all nutrient molecules that collide with the cell surface is a perfect sink and implies Sr = 0. Two conditions must be met for this to happen. First, the entire cellular surface must be receptive for nutrient absorption. Second, the absorption of one nutrient molecule cannot be hampered by the handling of a previous collision (sensu Aksnes and Egge, 1991). Such handling constraints is not reflected in the affinity coefficient and is not further elaborated in the present study. In nature, absence of handling constraints is likely to occur only in the oligotrophic situations (i.e., S → 0) where the probability of two successive collisions at an uptake site is very low. In such oligotrophic situations, the nutrient uptake rate might correspond to that of a perfect sink and consequently be equal to αmaxS. But this also requires, that the entire surface is receptive for nutrient absorption. If not, the actual affinity (α) will be lower than αmax. Thus, although the affinity coefficient is not constrained by handling time it is indeed constrained by the amount of the cell surface that can absorb nutrient molecules (Aksnes and Cao, 2011), i.e., the number of transporters which is also termed uptake sites (see Equation 1).
Affinity is often said to be diffusion limited because it is assumed that only diffusive transport, and no organism traits (except cellular size, r), affect the uptake rate. For such organisms it might be expected that measured affinities scale linearly with r such as in the expression for a perfect sink: αmax = 4πDrS. However, linear scaling between observed affinity and cell size is not supported by the empirical studies summarized by Edwards et al. (2012). Their results suggest that nitrate and phosphate affinities rather scale with cell volume according to α ∝ (r3)b where b was 0.75 and 0.85, respectively. This corresponds to α ∝ rx where x is 2.25 and 2.55, respectively, and clearly deviates from the perfect sink model where x = 1. Here, we apply nutrient uptake theory (reviewed in Fiksen et al., 2013) and show why x > 1 scaling can be expected for nutrient uptake affinity.
Methods
Theoretical Model for the Uptake Affinity
Theoretical studies (Berg and Purcell, 1977; Zwanzig, 1990) suggest that the chance of capturing a nutrient molecule is a non-linear function of the number of uptake sites or transporters (n). This leads to a general expression for the nutrient uptake affinity (Aksnes and Cao, 2011):
where s is the radius of the effective catch area of an uptake site (Aksnes and Egge, 1991) which can be taken as the radius of the opening of a transporter (Parker and Newstead, 2014). The transporter density (p), is the total catch area of all uptake sites divided by the cell surface, i.e., p = nπs2∕(4πr2). Thus, this quantity is a non-dimensional number between 0 and 1. For p = 1, the entire surface is covered by transporters and, as noted in the introduction, the affinity is then at its maximum, i.e., α = αmax = 4πDr. If n in Equation (1) is eliminated (by insertion of n = 4pr2s−2) the uptake affinity can be expressed as a function of p and cell size, according to:
We will use this expression to obtain the scaling exponent, x in α ∝ rx, for different transporter densities. It should be noted that handling time is not part of the affinity expression and that the effects of handling limitations on nutrient uptake are not considered in the present study. A model combining the nutrient affinity expression in Equation (1) with nutrient handling is derived in Aksnes and Cao (2011) and discussed in Fiksen et al. (2013).
Experimental Studies and Estimation of Transporter Density
Edwards et al. (2015) published a data collection, which is larger than that reported in Edwards et al. (2012), of laboratory measurements of the maximum uptake rate (Vmax), the nutrient specific half-saturation constant (k), and the cell volume (v) of different phytoplankton species. We used 205 sets where 71 and 134 were for nitrate and phosphate uptake, respectively. Similarly to Edwards et al. (2012), we approximated the uptake affinity according to α ≈ Vmax∕k. From the cell volume we calculated the equivalent spherical radius (ERS), r = (3v∕(4π))1∕3.
p was estimated from affinity and cell radius according to:
This equation is a rearrangement of Equation (2) and values of 0.001 μm and 1000 μm2 s−1 were assumed for s and D, respectively (Aksnes and Cao, 2011). Out of the 205 affinity observations, 16 were higher (6 and 10 for nitrate and phosphate uptake, respectively) than the theoretical maximum (i.e., αmax = 4πDr) for spherical and non-motile cells. Violations of these assumptions, as well as inaccurate size and uptake measurements, might lead to values higher than the maximum. Since, our idealized model cannot account for affinity values above the theoretical maximum they are not included in the analysis below.
Estimation of Scaling Exponents
Allometry is commonly expressed as power functions. For our case, α = mrx, the scaling exponent (x) is often estimated as the slope in a linear regression analysis on the logarithmic form, i.e., ln α = xlogr + logm. Edwards et al. (2012) applied standardized major axis (SMA) regression rather than ordinary least square regression (OLS). The rationale for using SMA fitting is that this method allows errors in the independent as well as the dependent variable. For data on uptake affinity and organism size, SMA-fit typically provides larger scaling exponents than standard regression. The orthogonal fitting procedure in Statistica (StatSoft, Dell Software), which corresponds to SMA, provided an estimate of x = 2.22 while standard regression gave x = 1.55 for the data set of Edwards et al. (2015; see Figure 1). We have used OLS to fit power functions to predictions from Equation (2). Such theoretical predictions are not subject to errors in the independent variable (such as cell size) when these are assumed rather than measured.
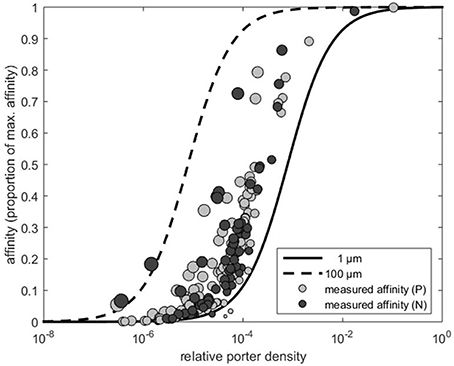
Figure 1. Affinity expressed as the proportion of the theoretical maximum (i.e., α∕αmax) as a function of estimated transporter density (obtained by Equation 3). The dashed and solid lines represent the affinity predicted by Equation (2) for cells with a radius of 1 and 100 μm, respectively. Light gray and dark gray circles indicate the affinity and the corresponding transporter estimates extracted from Edwards et al. (2015) for phosphate (P) and nitrate (N), respectively. Area of the circles indicate cell size.
Results
Small Cells Need Higher Transporter Investment than Large Cells in Order to Become a Perfect Sink
First, we consider some useful theoretical results. According to Equation (1) a p of p = 1 yields α = αmax, which is a requirement of a perfect sink. Affinity approaches this maximum at relatively low transporter densities. As pointed out by Berg and Purcell (1977) and Jumars et al. (1993) above a certain level, there is little gain to further increase the p (Figure 1). Another noteworthy result is, that the affinity of large cells satiates at a lower p than the affinity of small cells. To reach an affinity of 50% of maximal affinity, a small cell (r = 1 μm) needs a p two orders of magnitude higher than a cell with r = 100 μm (Figure 1). Generally, it is more costly for small cells to become perfect sinks.
We now use the ratio between the transporter biomass and the cellular biomass as a proxy for investment in p at the cell surface. If transporter biomass and cell biomass are approximated by their corresponding volumes, e.g., p4πr2s and , respectively, the specific transporter investment (I) can be expressed by the ratio of the two biomasses, i.e., I = 3psr−1. Here, we assume that s reflects the thickness of the layer occupied by transporters. Although, this layer is likely to be thicker than s, it does not affect the result that the investment cost for a given p decreases with increased cell size, i.e., I ∝ r−1. Thus, even though small cells are indeed favored by a large surface to volume ratio, this analysis suggests that they are punished by higher relative investment costs to take the full advantage of their higher surface to volume ratio. We have shown that there are two theoretical arguments for this. First, because the small cells need a higher p in order to approach αmax (Figure 1), and second because the relative cost of a transporter is higher for a small than for a large cell.
Scaling Exponents and Observations Extracted from Edwards et al. (2015)
The estimated scaling exponents, i.e., x in the relationship α ∝ rx for the nitrate and phosphate affinities are shown in Figure 2. OLS on the log-transformed data provided x = 1.55 (Figure 2A). A perfect sink corresponds to a p of p = 1 and the expected scaling coefficient for perfect sinks is x = 1 (see Figure 2A). At very low transporter densities (i.e., p → 0 in Equation 2) the cell becomes a minimal sink, where the scaling exponent approaches 2 (Figure 2A).
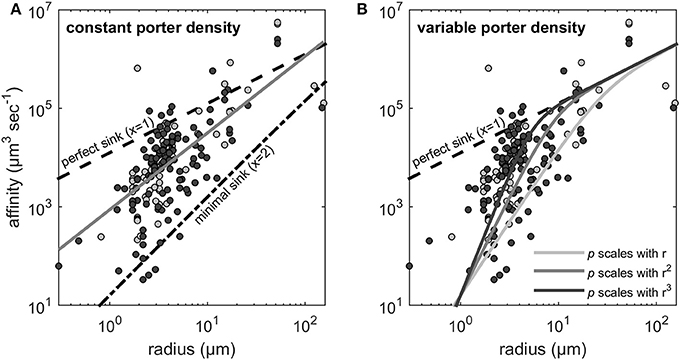
Figure 2. Scaling exponents (x) of the allometric relationship between uptake affinity and cell radius. Light gray and dark gray dots represent the affinity estimates that were extracted from Edwards et al. (2015) for nitrate (N) and phosphate (P), respectively. The dashed line indicates the theoretical maximum affinity, which corresponds to perfect sink (x = 1) obtained for p = 1 (Equation 2). (A) The gray line is the fit to the data from Edwards et al. (2015) using OLS regression which provides x = 1.55 (see Method). The dash-dotted line indicates the minimal sink (x = 2) obtained for p → 0. (B) Scaling exponents larger than 2 are expected if transporter density increases with cell size. The three solid lines illustrate the expected scaling when transporter density increases with r, r2, and r3, respectively. Equation (2) is fundamentally not a power function and therefore the indicated scaling exponents represent only the initial and steepest part of the lines.
As noted in the Methods Section, if orthogonal fitting (SMA regression) is applied instead of standard regression, we obtain a scaling exponent larger than 2 (x = 2.22 rather than 1.55 in Figure 2A). Scaling exponents larger than 2 are in accordance with theory for cases where p increases with cell size (Figure 2B). Given the result above, that relative transporter cost is lower for large than for small cells, increased porter density with cell size could be expected. A plot of the estimated p vs. cell radius, however, provides no evidence for such increasing trend. In fact, if the three experiments with cells larger than 100 μm (Figure 3) are included in a regression analysis there is a downward trend with size (not shown).
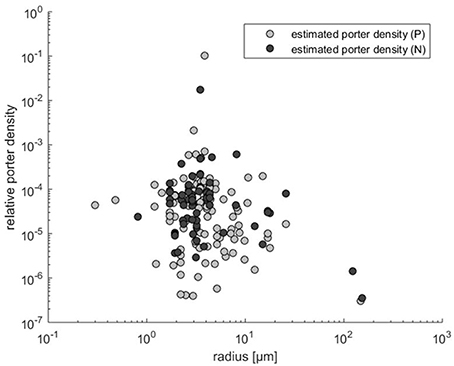
Figure 3. Transporter density estimates (obtained by Equation 3) vs. cell radius calculated from Edwards et al. (2015).
Discussion
Purely diffusion limited nutrient uptake implies that the cells are perfect sinks and that uptake affinity should scale linearly with cell radius. However, our results suggest that phytoplankton cells are imperfect sinks (Figure 1) and that this might explain why nutrient uptake affinity scales in proportion to a quantity that is closer to the cell surface area, i.e., α ∝ r2. Contrary to a perfect sink, an imperfect sink can increase its nutrient affinity by increasing the transporter number (Equation 1). But increased diffusion will also increase affinity, and the notion of either being diffusion limited or transporter limited appears inappropriate. Experimental support for simultaneous diffusion and transporter limitation is presented in the study of Tambi et al. (2009). Assuming diffusion limitation, they found relatively good agreement between experimentally measured and theoretically derived phosphate uptake affinities in bacteria and phytoplankton of different sizes. On the other hand, if a power function is fitted (by OLS) to their phytoplankton affinity measurements (Tambi et al., 2009, Table 2) vs. the ERS, a scaling exponent close to 2 is obtained (for the specific affinity, the exponent is −1). This suggests, that at least some the organisms in their study were imperfect sinks and that diffusion limitation is not a sole predictor for the observed uptake affinity. The observations of Tambi et al. (2009) therefore appear consistent with the results reported here and those reported by Edwards et al. (2012). There are likely large uncertainties in both the affinity and the cell size measurements in Figure 2. Presumably, these contribute to the relatively large scatter and uncertainties in estimating the scaling exponent. Our results suggest, however, that such large scatter might also reflect the lack of a common optimal transporter density, but rather represent diversity both within and across size classes.
Cells need different nutrients and several types of transporters have been identified (Tsay et al., 2007; Nussaume et al., 2011). In the estimation of the p, which is expressed as a fraction rather than a true density, we assumed a transporter opening (s) of 1 nm. This value appears to be close to the opening of a phosphate transporter (Huang et al., 2003; Pedersen et al., 2013), while a value closer to 10 nm was reported for a nitrate transporter (Parker and Newstead, 2014). We note, that the p estimates are affected by the actual choice of s. For example, the p estimates (x-axis in Figure 1) becomes 10 times higher if s is set equal to 10 instead of 1 nm. However, this does not affect α/αmax values (y-axis in Figure 1), nor the different scaling exponents shown in Figure 2.
The expectation of a linear scaling (x = 1) between affinity and cell radius arises as a result of diffusion limitation due to the boundary layer around the cell. This boundary layer may, however, be disturbed by fluid turbulence, leading to enhanced concentrations near the cell surface, and thus higher uptake (Guasto et al., 2012; Barton et al., 2014). This effect would be stronger the larger the cell. Theoretical arguments, however, imply that only cell larger than ~60–100 μm might be affected (Guasto et al., 2012). The sizes considered in the present study are generally smaller than 100 μm, indicating that the nutrient uptake of these organisms is not likely to benefit from increased turbulence. However, if the laboratory conditions of the uptake experiments involved strong stirring, we cannot exclude that mixing might have contributed to the observed x > 1 scalings. Such effects cannot be resolved here, but needs to be addressed in future experimental studies.
Our results indicate that the observed uptake affinities of large cells are closer to the theoretical maximum than the affinities of small cells (Figure 1). This is not surprising given the theoretical evidence that the cost of a transporter (relative to the cellular volume) is less for large than for small cells, and that large cells need lower p to realize their maximal affinity potential than small cells. But what is the optimal transporter investment? This question cannot be answered by our analysis as nutrient uptake is just one among many vital processes to be considered in trade-off conflicts. Phytoplankton cells require several nutrients, with their specific transporters having to share the cells surface area. Therefore, to optimize uptake, the required cellular nutrients ratio and the environmental nutrient concentrations have to be considered. Further, investment in more nutrient uptake transporters is not beneficial if carbon fixation (i.e., light) is a larger bottleneck for survival and reproduction. Under such circumstances investment should rather be directed toward chloroplasts. The nature of such co-limitations and associated trade-offs is likely to be size dependent (Andersen et al., 2015, 2016). Another kind of trade-off mechanism emerges if nutrient transporters are entry points for viral attacks (Menge and Weitz, 2009) which also affect optimal transporter density. Thus, future studies aiming to explain the large variation in observed nutrient uptake affinity (as seen in Figures 1–3) need to address, not only nutrient uptake, but a wide range of processes and associated trade-offs affecting growth, survival and reproduction.
Author Contributions
CL designed the study, performed analyses, made figures, and participated in writing the manuscript. OF contributed to the design and discussions of the study and edited the manuscript. KA contributed to the design and discussions of the study and edited the manuscript. DA designed the study, performed analyses, and wrote the manuscript.
Conflict of Interest Statement
The authors declare that the research was conducted in the absence of any commercial or financial relationships that could be construed as a potential conflict of interest.
Acknowledgments
KA was supported by the VKR center of Excellence: Ocean Life. We would like to thank the reviewers for valuable comments which improved the manuscript.
References
Aksnes, D. L., and Cao, F. (2011). Inherent and apparent traits in microbial nutrient uptake. Mar. Ecol. Prog. Ser. 440, 41–51. doi: 10.3354/meps09355
Aksnes, D. L., and Egge, J. (1991). A theoretcial model for nutrient uptake in phytoplankton. Mar. Ecol. Prog. Ser. 70, 65–72. doi: 10.3354/meps070065
Andersen, K. H., Aksnes, D. L., Berge, T., Fiksen, Ø., and Visser, A. (2015). Modelling emergent trophic strategies in plankton. J. Plankton Res. 37, 862–868. doi: 10.1093/plankt/fbv054
Andersen, K. H., Berge, T., Gonçalves, R. J., Hartvig, M., Heuschele, J., Hylander, S., et al. (2016). Characteristic sizes of life in the oceans, from bacteria to whales. Annu. Rev. Mar. Sci. 8, 217–241. doi: 10.1146/annurev-marine-122414-034144
Barton, A. D., Ward, B. A., Williams, R. G., and Follows, M. J. (2014). The impact of fine-scale turbulence on phytoplankton community structure. Limnol. Oceanogr. 4, 34–49. doi: 10.1215/21573689-2651533
Berg, H. C., and Purcell, E. M (1977). Physics of chemoreception. Biophys. J. 20, 193–219. doi: 10.1016/S0006-3495(77)85544-6
Edwards, K. F., Klausmeier, C. A., and Litchman, E. (2015). Nutrient utilization traits of phytoplankton: ecological archives E096-202. Ecology 96, 2311–2311. doi: 10.1890/14-2252.1
Edwards, K. F., Thomas, M. K., Klausmeier, C. A., and Litchman, E. (2012). Allometric scaling and taxonomic variation in nutrient utilization traits and maximum growth rate of phytoplankton. Limnol. Oceanogr. 57, 554–566. doi: 10.4319/lo.2012.57.2.0554
Fiksen, Ø., Follows, M., and Aksnes, D. L. (2013). Trait-based models of nutrient uptake in microbes extend the Michaelis-Menten framework. Limnol. Oceanogr. 58, 193–202. doi: 10.4319/lo.2013.58.1.0193
Guasto, J. S., Rusconi, R., and Stocker, R. (2012). Fluid mechanics of planktonic microorganisms. Annu. Rev. Fluid Mech. 44, 373–400. doi: 10.1146/annurev-fluid-120710-101156
Huang, Y., Lemieux, M. J., Song, J., Auer, M., and Wang, D. N. (2003). Structure and mechanism of the glycerol-3-phosphate transporter from Escherichia coli. Science 301, 616–620. doi: 10.1126/science.1087619
Jumars, P. A., Deming, J. W., Hill, P. S., Karb-Boss, L., Yager, P. L., and Dade, W. B. (1993). Physical constraints on marine osmotrophy in an optimal foraging context. Mar. Microb. Food Webs 7, 121–159.
Litchman, E., and Klausmeier, C. A. (2008). Trait-based community ecology of phytoplankton. Annu. Rev. Ecol. Evol. Syst. 39, 615–639. doi: 10.1146/annurev.ecolsys.39.110707.173549
Menge, D. N. L., and Weitz, J. S. (2009). Dangerous nutrients: evolution of phytoplankton resource uptake subject to virus attack. J. Theor. Biol. 257, 104–115. doi: 10.1016/j.jtbi.2008.10.032
Nussaume, L., Kanno, S., Javot, H., Marin, E., Pochon, N., Ayadi, A., et al. (2011). Phosphate import in plants: focus on the PHT1 transporters. Front. Plant Sci. 2:83. doi: 10.3389/fpls.2011.00083
Parker, J. L., and Newstead, S. (2014). Molecular basis of nitrate uptake by the plant nitrate transporter NRT1. 1. Nature 507, 68–72. doi: 10.1038/nature13116
Pasciak, W. J., and Gavis, J. (1974). Transport limitation of nutrient uptake in phytoplankton. Limnol. Oceanogr. 19, 881–898. doi: 10.4319/lo.1974.19.6.0881
Pedersen, B. P., Kumar, H., Waight, A. B., Risenmay, A. J., Roe-Zurz, Z., Chau, B. H., et al. (2013). Crystal structure of a eukaryotic phosphate transporter. Nature 496, 533–538. doi: 10.1038/nature12042
Tambi, H., Flaten, G. A. F., Egge, J. K., Bodtker, G., Jacobsen, A., and Thingstad, T. F. (2009). Relationship between phosphate affinities and cell size and shape in various bacteria and phytoplankton. Aquat. Microb. Ecol. 57, 311–320. doi: 10.3354/ame01369
Tsay, Y. F., Chiu, C. C., Tsai, C. B., Ho, C. H., and Hsu, P. K. (2007). Nitrate transporters and peptide transporters. FEBS Lett. 581, 2290–2300. doi: 10.1016/j.febslet.2007.04.047
Keywords: phytoplankton, nutrient uptake, allometric scaling, molecular diffusion, size
Citation: Lindemann C, Fiksen Ø, Andersen KH and Aksnes DL (2016) Scaling Laws in Phytoplankton Nutrient Uptake Affinity. Front. Mar. Sci. 3:26. doi: 10.3389/fmars.2016.00026
Received: 02 November 2015; Accepted: 26 February 2016;
Published: 11 March 2016.
Edited by:
Agostino Merico, Leibniz Center for Tropical Marine Ecology, GermanyReviewed by:
Dionysios E. Raitsos, Plymouth Marine Laboratory, UKSergio M. Vallina, Consejo Superior de Investigaciones Cientificas, Spain
Copyright © 2016 Lindemann, Fiksen, Andersen and Aksnes. This is an open-access article distributed under the terms of the Creative Commons Attribution License (CC BY). The use, distribution or reproduction in other forums is permitted, provided the original author(s) or licensor are credited and that the original publication in this journal is cited, in accordance with accepted academic practice. No use, distribution or reproduction is permitted which does not comply with these terms.
*Correspondence: Dag L. Aksnes, dag.aksnes@uib.no