Microbial Community Structure Affects Marine Dissolved Organic Matter Composition
 Elizabeth B. Kujawinski1*
  Krista Longnecker1
  Katie L. Barott1†
  Ralf J. M. Weber2
  Melissa C. Kido Soule1
- 1Department of Marine Chemistry and Geochemistry, Woods Hole Oceanographic Institution, Woods Hole, MA, USA
- 2School of Biosciences, University of Birmingham, Birmingham, UK
Marine microbes are critical players in the global carbon cycle, affecting both the reduction of inorganic carbon and the remineralization of reduced organic compounds back to carbon dioxide. Members of microbial consortia all depend on marine dissolved organic matter (DOM) and in turn, affect the molecules present in this heterogeneous pool. Our understanding of DOM produced by marine microbes is biased toward single species laboratory cultures or simplified field incubations, which exclude large phototrophs and protozoan grazers. Here we explore the interdependence of DOM composition and bacterial diversity in two mixed microbial consortia from coastal seawater: a whole water community and a < 1.0-μm community dominated by heterotrophic bacteria. Each consortium was incubated with isotopically-labeled glucose for 9 days. Using stable-isotope probing techniques and electrospray ionization Fourier-transform ion cyclotron resonance mass spectrometry, we show that the presence of organisms larger than 1.0-μm is the dominant factor affecting bacterial diversity and low-molecular-weight (< 1000 Da) DOM composition during this experiment. In the < 1.0-μm community, DOM composition was dominated by compounds with lipid and peptide character at all time points, confirmed by fragmentation spectra with peptide-containing neutral losses. In contrast, DOM composition in the whole water community was nearly identical to that in the initial coastal seawater. These differences in DOM composition persisted throughout the experiment despite shifts in bacterial diversity, underscoring an unappreciated role for larger microorganisms in constraining DOM composition in the marine environment.
Introduction
Dissolved organic carbon in the oceans constitutes a significant global reservoir of carbon, comparable to atmospheric carbon dioxide (700 GT; Hedges, 2002), and its cycling affects the flux of carbon between the oceans and the atmosphere. Consequently, the production of dissolved organic matter (DOM), its residence time inthe surface ocean, and its eventual remineralization to carbon dioxide, are of paramount importance in constraining the ocean-atmosphere carbon flux over long time periods. DOM is produced, in large part, by photosynthetic microbes in the surface ocean and is altered and/or remineralized by a consortium of archaea, bacteria, protozoa, viruses, and phytoplankton, collectively known as the microbial loop (Azam et al., 1983). Metabolic capabilities within microbial consortia are determined to some extent by DOM characteristics (Baña et al., 2014), and DOM composition is affected by the individual metabolic reactions catalyzed by microbes (Alonso-Sáez et al., 2012). These microbe-DOM interactions are therefore relevant to the global carbon cycle and crucial to modeling the flow of carbon through the dissolved pool.
DOM molecules occur along a spectrum of reactivity, from labile with residence times of hours to days, to refractory with residence times from tens to thousands of years. Marine bacteria have been implicated as a large source of both labile (Kawasaki and Benner, 2006) and refractory (Ogawa et al., 2001) DOM in laboratory and field incubations. The presence of long-lived material in these incubations has been interpreted as evidence of a bacterial source of the same refractory material present in the oceans. The role of bacteria in refractory DOM production has been highlighted in the concept of the “microbial carbon pump” (Jiao et al., 2010), where bacterial refractory DOM is trapped in the deep ocean and the associated carbon is effectively sequestered from the atmosphere. Bulk compositional analysis supports this contention (e.g., presence of bacterial-derived D-amino acids in deep ocean DOM; Kaiser and Benner, 2008) although recent molecular-level investigations suggest that bacterial-derived refractory material differs structurally from refractory organic matter in the oceans (Osterholz et al., 2015). In these studies, bacteria likely dominated the incubations due to dilution, filtration or removal of light. Consequently the impact of other microbes on DOM composition may have been underestimated, particularly phytoplankton who provide bacterial growth substrates (Amin et al., 2012) and grazers who prey on bacteria (Sherr and Sherr, 1994).
Phytoplankton production of DOM is a well-known source of growth substrates for marine bacteria. Phytoplankton exudates contain monomers such as sugars and amino acids (Sarmento et al., 2013) and complex polymers such as polysaccharides and peptides (reviewed by Carlson, 2002), as well as numerous unknown molecules (Becker et al., 2014; Longnecker et al., 2015b). Interestingly, the composition of these exudates is affected by the presence of other phytoplankton (Paul et al., 2009) or other bacteria (Durham et al., 2015). In some cases, specific interactions between phytoplankton and bacteria could be mediated through the DOM pool (Sher et al., 2011). Thus, interactions such as those between phytoplankton and bacteria, or between predatory protozoa and bacterial prey, structure microbial communities, and most likely affect DOM composition in the global ocean (Lima-Mendez et al., 2015).
Protozoa feed on bacteria, phytoplankton, and small detrital particles (Sherr and Sherr, 1994) and, in so doing, affect prey diversity, concentration, and metabolic function (Pernthaler, 2005; Alonso-Sáez et al., 2009). Through their fairly broad prey range, protozoa can respond quickly to a substrate-driven increase in prey populations (Pernthaler, 2005) and can affect the metabolic functions resident within the prey community by affecting prey diversity (Corno and Jürgens, 2008). By releasing nutrients and organic substrates (Andersson et al., 1985; Taylor et al., 1985), they stimulate the bacterial community to grow exponentially and/or to enhance their metabolic activity (Wang et al., 2009). During grazing, protozoa have a direct impact on bacterial biomass through feeding and an indirect impact on DOM composition through release of bacterial metabolites as a dissolved waste product (Taylor et al., 1985; Fouilland et al., 2014). Protozoa typically release 10–30% of ingested carbon as DOM, including dissolved amino acids and colloidal micelles of prey organic matter (reviewed by Nagata, 2000). An important facet of this release is that it is predicated on encounter rates and ecosystem parameters, rather than on metabolic capabilities encoded in the genome of either the predator or the prey. Thus, empirical studies are needed to determine the impact of protozoan grazing on the molecular-level composition of DOM released during feeding.
Here, we examine DOM composition and cycling in two mixed microbial consortia, akin to that ubiquitously present in coastal waters. In particular, we investigated the impact of removal of large (>1.0-μm) organisms on both bacterial diversity and molecular-level DOM composition. We established parallel seawater treatments with whole water consortia or with 1.0 μm-filtered water (hereafter referred to as < 1.0-μm), with additions of isotopically-labeled glucose. We used molecular biology techniques to explore microbial diversity and ultrahigh resolution mass spectrometry to assess DOM composition and to characterize the structure of selected compounds.
Methods
Experimental Setup
Surface seawater was collected on an incoming tide from Vineyard Sound, MA (hereafter: VSW) at the WHOI dock in April 2007 (T = 6°C). The water was transported back to the laboratory in polycarbonate carboys and half (~16L) was immediately filtered through a 1.0-μm bell filter (Whatman). The bell-filter was cleaned extensively with acidified and then neutral Milli-Q water prior to use. Sixteen parallel bottle incubations were established with 2 L each of either unfiltered VSW (“whole water”) or 1.0 μm-filtered VSW (“ < 1.0-μm”). Sterile control incubations were established with 0.2-μm-filtered VSW but were contaminated after 4–5 days and were not considered further. Each incubation bottle was amended with uniformly-labeled 13C-glucose (final added concentration: 1 μM) and ammonium (, final added concentration: 1 μM). The glucose amendment represents an ~5% increase in dissolved organic carbon over typical VSW concentrations while the ammonium amendment is 2–3X typical VSW concentrations. These bottles were placed within a temperature-controlled incubator at 15°C on a 12 h:12 h light: dark cycle for a total of 9 days. On days 1, 2, 5, and 9, two replicate bottles from each treatment were sacrificed for microbial diversity and DOM composition analyses. Initial seawater conditions were assessed for unfiltered VSW only. The impact of 1.0-μm filtration on DOM composition was examined with follow-up tests described below. Cells were captured on combusted 0.2 μm Anodisc filters (Whatman; combusted at 400°C for at least 4 h) and DOM was extracted from the resulting filtrate.
All reagents were Optima grade or better (Fisher Scientific). All glassware was combusted at 450°C for at least 4 h. All plasticware was soaked in 10% HCl (trace-metal grade) for 12–24 h, rinsed with Milli-Q water, and autoclaved prior to use.
Dissolved Organic Matter Analyses
Samples were collected for total and dissolved organic carbon (T/DOC) and for isotopic analysis of bulk organic carbon. However, these samples were lost due to analytical error during the isotopic analysis and thus are not available for comparison with the molecular-level analyses. Consequently, we focused our results and discussion on comparing DOM composition, rather than on estimating quantitative changes in specific compound classes over the experiment.
The 0.2-μm filtrate (~2 L) at each timepoint was collected in 2.5-L polycarbonate bottles, acidified to pH 3 with concentrated HCl and stored in the dark at 4°C until extraction. Solid-phase extraction disks (47 mm C18/SDB resin; 3M) were placed on combusted or solvent-rinsed glass frits, and pre-conditioned with acetone, methylene chloride, methanol and Milli-Q water, according to manufacturer's instructions. Without letting the disks become dry, sample was pulled through the disks by vacuum. After the entire sample went through a disk, each disk was rinsed with pH 3 Milli-Q water and allowed to dry for at least 15 min. DOM was eluted with 70% methanol. Extracts were blown down to near dryness, resuspended in a known volume of 70% methanol and stored in the refrigerator or freezer until analysis.
Due to excessive salt content, samples were purified using ZipTips (C18-embedded pipet tips; Millipore). Extracts were dried and then re-dissolved in an equivalent volume of 5% methanol and 95% Milli-Q water, adjusted to pH 3 with concentrated HCl. Ten 10-μL aliquots of sample were extracted onto the C18 resin in the ZipTip. The sample was washed with five 10-μL aliquots of pH 3 Milli-Q water and eluted with two 5-μL aliquots of methanol. The volume was adjusted to 100 μL with 70% methanol. Purification efficiencies could not be calculated for this process given the small sample volumes. However, all samples were treated identically.
All extracts were analyzed in positive ion mode at the WHOI FT-MS facility on a 7T hybrid linear ion-trap Fourier transform ion cyclotron resonance mass spectrometer (LTQ-FT-ICR MS, Thermo Scientific, Waltham MA). Samples were amended with 0.1% acetic acid to promote positive ion formation and were infused directly into the electrospray source (3–4 μL min−1). Sample dilutions and spray and instrument parameters were optimized for each sample for maximum spray stability (Kido Soule et al., 2010). Two hundred individual transients were collected and co-added for each sample. In general, the capillary voltage and temperature were 21.0 V and 260°C, respectively. The automatic gain control (AGC) target value was set at 1 × 10⁶ ions for all samples. External mass calibration was conducted weekly with a calibration mix from the manufacturer and the resulting mass accuracy was < 2 ppm for 198 < m/z < 2000. Relative peak height was calculated by normalization to the most abundant ion in the mass spectrum. The average resolving power was 400,000 at m/z 400 (where resolving power is defined as m/Δm50% where Δm50% is the width at half-height of peak m).
The transients were processed with MATLAB code provided by Southam et al. (2007) and modified as described previously (Kido Soule et al., 2010). Within each sample, only those transients whose total ion current (TIC) was >20% of the maximal TIC were co-added and then processed with Hanning apodisation and zero-filled once prior to fast Fourier transformation. We retained all m/z values with a signal-to-noise ratio above 5 (as calculated in Southam et al., 2007). All spectra were internally re-calibrated using a short list of m/z values present in all samples, chosen according to criteria previously described (Bhatia et al., 2010). After recalibration, mass accuracy was < 1 ppm for our mass range. We removed spectra from consideration if we saw evidence of contamination from the C18 resin (Bhatia et al., 2010). In some spectra, we observed the presence of overlapping features from multiply-charged ions, consistent with published spectra for intact proteins. These features were intermittently present in different samples and replicate filtrates of the same sample. We ascribe these features to whole-cell material that leaked through the combusted Anodisc filters and thus we discarded these spectra as not representative of dissolved organic material. All spectra that were free of contamination and that contained enough m/z values for good calibration (>5; Williams and Muddiman, 2007) were retained for further analysis.
The individual sample peak lists were then aligned and combined using MATLAB code provided by Mantini et al. (2007) with an error tolerance of 1 ppm. Elemental formulas were assigned to the aligned peaks (m/z values) using the Compound Identification Algorithm (CIA) (Kujawinski and Behn, 2006; Kujawinski et al., 2009) with the following parameters: (a) formula error was 1 ppm, (b) the relationship error was 20 ppm, and (c) the mass limit above which elemental formulas were assigned by functional group relationships only was 500 Da. For this study, elemental formulas were determined for m/z values below 500 Da with an in-house database of mathematically and chemically legitimate formulae within the 1 ppm error window. These elemental formulas were extended to m/z values above 500 Da through identification of functional group relationships with smaller m/z values. Isotopologs with one or more 13C atoms were annotated and elemental formulas were corrected to reflect 13C content. Elemental ratios and double bond equivalencies (DBE) were calculated as magnitude-averaged values (Sleighter and Hatcher, 2008) for m/z values with assigned elemental formulas. Number-averaged values are normalized to peak diversity and magnitude-averaged values are normalized to both peak diversity and relative peak abundance. Series of 13C-containing isotopologs were calculated using the algorithm described in Weber et al. (2013).
Fragmentation (MS/MS) spectra were generated for selected peaks in the < 1.0-μm samples. Target m/z values were isolated in the ion trap with a 1.0 Da window during direct infusion analysis. Fragmentation occurred in the linear ion trap via collision-induced dissociation (CID) with energies between 16 and 35 (unitless; optimized for each feature), and fragment ions were transferred to the ICR cell for m/z measurement. For all MS/MS spectra, 100 scans at 100,000 resolving power were co-added and processed as described above for the full spectra. Neutral losses were calculated for each spectrum between each pair of fragments and compared to a list of common neutral losses (Rasche et al., 2011). Fragmentation spectra were also manually compared to entries in MassBank (Horai et al., 2010) and masses of neutral ions and fragments were manually compared to data within METLIN (Tautenhahn et al., 2012). In some cases, initial activation of the precursor ion yielded a secondary ion with twice the original molecular weight, implying that the precursor had been doubly-charged. In these cases, we collected additional fragmentation spectra (MS3) to examine the structure.
We assessed the possibility that our DOM composition results were biased by material leaching from the 1.0-μm bell filter with a follow-up experiment in January 2013. Freshly collected Vineyard Sound seawater was passed through a 1.0-μm filter that had not been cleaned extensively (as described above), and then filtered again through a 0.2-μm Anodisc. DOM was extracted and compared to DOM from a seawater control that was not passed through the 1.0-μm filter. Overlap between 1.0 μm-filtered and non-filtered seawater samples was ~13%, suggesting that the 1.0-μm filter produces significant contamination if not cleaned properly. Approximately 10–20 peaks from the contaminated spectra were observed at moderate abundance in the biological incubations, representing < 1% of the peaks observed in the treatments. The lack of common peaks between this test and our experiment also indicates that the compounds observed in the < 1.0-μm spectra were not associated with a stress response to filtration.
Microbial Parameters
We used flow cytometry and epifluorescence microscopy to quantify the abundances of bacteria and protozoa, respectively. For flow cytometry, paraformaldehyde (0.2% final concentration) was added to 1 mL aliquots and the samples were stored at −80°C until analysis using a Becton-Dickinson FACSCalibur. Autofluorescing cells were quantified against 2.5 μm beads (Molecular Probes). After quantification of autofluorescing cells, SYBR Green I was added to each sample and non-autofluorescing cells were quantified (against 1.0 μm beads—Fluoresbrite plain YG 1.0 μm microspheres). When needed, samples were diluted with ultrapure water prior to analysis. For microscopy, samples (10 mL) were preserved with 1% glutaraldehyde and stored at 4°C for 1–5 days. Cells were then stained with acridine orange and filtered onto 0.2-μm black polycarbonate filters (Hobbie et al., 1977). Protozoa were enumerated by epifluorescence microscopy in at least 75 fields for each filter. The average coefficient of variation for protozoan cell counts was 40%.
Microbial cells were collected at each time point on 0.2 μm Anodisc filters. For each bottle, approximately half the incubation volume (~1L) was filtered at a time and the two resulting filters were used as bottle replicates. All filters were stored at −80°C until DNA extraction. Cells were prepared for digestion through the addition of 500 μL extraction buffer (50 mM Tris-HCl, pH = 8, 40 mM EDTA, 0.75 M sucrose). Lysozyme (0.5 mg) was added and the mixture was incubated at 37°C for 30 min. Proteins were digested with 83 μg proteinase K and 1% SDS. The mixture was incubated at 65°C for 30 min. DNA was extracted with one volume of phenol and one volume of 25:24:1 phenol: chloroform: isoamyl alcohol. RNA was degraded with RNase cocktail (Ambion) at 37°C for 30 min. DNA was precipitated with 0.1 X volume of 2M LiCl and 2X volume of 100% ethanol. After centrifugation, the DNA pellet was washed twice with cold 70% ethanol and resuspended in 50 μL ultrapure water. DNA concentrations were measured with a Nanodrop spectrophotometer (range: 32–275 ng μL−1, all blanks < 1 ng μL−1). All extracts were stored at −80°C.
The DNA extracts were separated into 13C- and 12C-rich fractions with ultracentrifugation (Longnecker et al., 2009). DNA extracts and TE buffer (10 mM Tris-HCl, pH = 7.5, 1 mM EDTA) were combined to give a total volume of 800 μL and a total DNA content of 1.5 μg. This mixture was then mixed with 4.2 mL of cesium chloride (CsCl) at a density of 1.856 g/mL (refractive index = 1.4143). All tubes were sealed and centrifuged in an ultracentrifuge (Beckman Coulter, Optima L-80 XP) at 200,000 × g for 65 h at 20°C. After centrifugation, 500-μL aliquots were carefully removed from the top of the tube to the bottom (10 aliquots total) and the refractive index was measured. DNA was then precipitated with polyethylene glycol (30% PEG in 1.6M NaCl) and incubated overnight at 4°C. After centrifugation at 20,000 × g, the DNA pellet was washed three times with cold 70% ethanol, dried, and resuspended in 10 μL of 10 mM Tris. For bacterial rDNA, the quantitative PCR mix consisted of Absolute qPCR mix (ThermoFisherScientific), 200 nM 27F (5′-AGA GTT TGA TCC TGG CTC AG-3′) and 200 nM 519R-RT (5′-GWA TTA CCG CGG CKG CTG-3′), ultrapure water and 2 μL of CsCl extract. Amplification proceeded along the following program: hold at 95°C for 15 min; 40 times of hold at 95°C for 15 s, 55°C for 30 s, 72°C for 30 s; hold at 95°C for 15 s; 55°C for 15 s; ramp to 95°C for 30 min; end at 95°C for 15 s. All ultracentrifugation runs contained four sample tubes and two standard tubes. The standards were a 50:50 mixture of 12C-DNA and 13C-DNA extracted from Halomonas halodurans grown on uniformly 12C-labeled or 13C-labeled glucose (Barbeau et al., 2001). Based on our previous work with blanks and standard DNA runs (Longnecker et al., 2009), we used a CsCl density of 1.7258 g ml−1 as a cut-off between 12C-rich and 13C-rich DNA.
SSU gene copies within CsCl extracts were quantified with quantitative-PCR against a five-point standard curve with H. halodurans DNA. For bacterial cells, the DNA extract was amplified with FAM-labeled 27F and 519R primers. The reaction mix was comprised of GoTaq colorless master mix (50% dilution), 200 nM of each primer, bovine serine albumin to increase PCR reaction yield (BSA – 0.25 mg ml−1) and enough ultrapure water to have a total volume of 50 μL per reaction. 16S rDNA PCR amplification used the following program: an initial denaturation (95°C for 5 min) followed by 35 cycles of denaturation (95°C, 30 s), annealing (46°C, 30 s), extension (72°C, 90 s), and a final extension cycle of 72°C for 5 min. All parameters of the 18S reaction mix remained the same except the primers were EukA (5′-AAC CTG GTT GAT CCT GCC AGT-3′) and Euk570R (5′-GCT ATT GGA GCT GGA ATT AC-3′). The 18S rRNA gene was amplified according to the program: an initial denaturation (95°C for 2 min) followed by 40 cycles of denaturation (95°C, 30 s), annealing (50°C, 30 s), extension (72°C, 150 s), and a final extension cycle of 72°C for 7 min. Recoveries of added DNA ranged from 1 to 15%.
The changes in microbial diversity in bulk samples and ultracentrifugation fractions were examined with terminal restriction fragment (TRFs) length polymorphism (TRFLP) analysis of PCR-amplified small subunit ribosomal RNA genes as previously described (Longnecker et al., 2009). Each product was digested with two enzymes, Hin6I and BsuRI at 37°C for 2 h. After the enzymatic digest, DNA was precipitated from the PCR product mix with 2M LiCl and 100% ethanol. After centrifugation, the pellet was washed twice with cold 70% ethanol, dried and resuspended in HiDi formamide. The lengths of the TRFs were measured with an Applied Biosystems 3730 XL capillary sequencer, relative to a MegaBACE ET900-R size standard. Chromatograms were analyzed with the DAx Data Acquisition and Analysis software and results were exported into MATLAB.
We generated 16S rRNA gene clone libraries for Days 0, 1, 2, and 5 and 18S rRNA gene clone libraries for Days 0, 2, and 5. rRNA genes were cloned using the pCR4-TOPO vector (TOPO-TA, Invitrogen) according to the manufacturer's directions. One 96-well plate of colonies was picked for each gene at each experimental time-point. DNA from the colonies was extracted and sequence data obtained with 27F or EukA. Chimeras were checked with Belleropheron v3. Phylogenetic assignments were conducted with STAP (Wu et al., 2008). Sequences were deposited in GenBank and can be accessed with numbers KC336488-KC337027. Sequence prefixes and corresponding samples are: “SEQ7” = Whole Day 0 16S rDNA; “Seq_16” = Whole Day 0 18S rDNA; “p01” = < 1.0-μm Day 1 16S rDNA; “Seq_08” = Whole Day 1 16S rDNA; “p02” = < 1.0-μm Day 2 16S rDNA; “Seq-09” = Whole Day 2 16S rDNA; “Seq13” = Whole Day 2 18S rDNA; “Seq_11” = < 1.0-μm Day 5 16S rDNA; “Seq10” = Whole Day 5 16S rDNA; “Seq_16” = Whole Day 5 18S rDNA.
Statistical Analyses
We considered two data transformations for full spectra and for fragmentation spectra. First, we transformed relative mass spectral peak heights to presence (peak height = 1) or absence (peak height = 0) to assess sample differences based on peak diversity. Second, we considered the original peak heights (no data transformation). For both transformations, a distance matrix was calculated between all the samples using the Bray-Curtis distance measure (MATLAB code by David Jones, personal communication, as part of the Fathom toolbox), and hierarchical cluster analysis was performed using Ward's linkage method.
For all datasets except the fragmentation spectra, non-metric multidimensional scaling (NMS) analyses were conducted with the statistics toolbox in MATLAB. We chose two dimensions based on Monte Carlo analysis. The proportion of variation represented by each axis was assessed with a Mantel test that calculates the coefficient of determination (r2) between distances in the ordination space and in the original space. One-way analysis of similarity (ANOSIM) was used to assess if groups visualized by NMS were statistically significant. MATLAB code for ANOSIM was also from the Fathom toolbox. The Bray-Curtis distance matrix calculated for the NMS was used for ANOSIM, and the distances were converted to ranked distances prior to ANOSIM calculations. The significance of each group was tested by 1000 randomizations of the dataset, and p-values were calculated to determine the probability of no difference between groups.
For the full mass spectra, we identified specific m/z values characteristic of the observed cluster groupings with Indicator Species Analysis (ISA). The separation of samples into ISA groups and the curation of indicator m/z values was conducted according to previously described criteria (Kujawinski et al., 2009). Our samples were separated into two groups: Group 1 = whole water incubations; Group 2 =< 1.0-μm incubations. ISA combines the relative abundance and relative frequency of a peak within a pre-defined group of samples to assign an indicator value (IV) to each peak (McCune and Grace, 2002). A perfect IV (equal to 100) of a particular group would constitute an m/z value that was present exclusively in the samples comprising that group (McCune and Grace, 2002), however an IV threshold of 50 was used to assign groups (Kujawinski et al., 2009). Statistical significance of IVs is calculated by comparison with Monte-Carlo simulations of randomized data (p < 0.05).
Results
General Overview
Bacterial abundance increased in the < 1.0-μm incubations after the addition of isotopically-labeled glucose but remained constant in the whole-water incubations (Figure 1). In the whole-water treatments, we quantified protozoa and auto-fluorescing cells. The number of auto-fluorescent (phytoplankton) cells was negligible at all time points. In these treatments, protozoa peaked in abundance on day 5, and were never detected microscopically in the < 1.0-μm incubations (Figure 1).
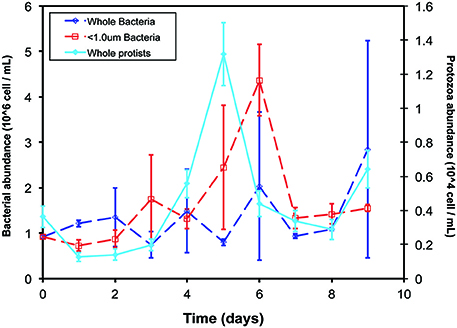
Figure 1. Cell abundances over time of experiment. Bacteria (open symbols, dotted lines, left y-axis) were enumerated with flow cytometry and protozoa (closed symbols, solid line, right y-axis) were enumerated with epifluorescence microscopy in the < 1.0-μm (red) and whole-water (blue) incubations. No protozoa were detected by microscopy in the < 1.0-μm incubations. Data presented are the mean and standard deviation of replicate counts in two experimental replicate bottles (n = 6).
Stable Isotope Incorporation
We assessed the degree of stable isotope incorporation in both the DOM and microbial analyses. In the DNA measurements, isotopic incorporation was sufficiently large to allow separation of isotopically-labeled DNA from bulk DNA by ultracentrifugation (see below). In contrast, little incorporation was observed in the DOM fraction. Using algorithms from Weber et al. (2013), we identified series of peaks containing more than one 13C atom only in the < 1.0-μm spectra (Table S1). No such series were found in the whole water incubations. According to Weber et al. (2013), the longer series could indicate increased 13C incorporation. However, this conclusion must be confirmed by elemental formula calculations. Using the formula from Koch et al. (2007), the carbon number predicted from the relative intensities of these peaks was approximately the same as that predicted from the exact mass of the primary ion. Thus, no enhanced incorporation could be assumed and we must conclude that the increased series lengths are due instead to the large intensities of the parent ions. Indeed, the ions annotated as the start of the longer series are among the most abundant ions in the < 1.0-μm spectra. We conclude that isotopic incorporation of 13C from glucose could not be clearly discerned in the DOM in this experiment, and further discussion focuses on glucose as a carbon source, rather than on 13C as a tag for recent biological synthesis.
Dom Composition
The visual difference between ultrahigh resolution mass spectra from the < 1.0-μm and the whole water incubations is striking (Figure 2). The < 1.0-μm spectra are not contaminated with bleed from the filter, based on blank tests conducted after this experiment. Thus, we conclude that the unique peaks in these spectra are due to biological activity within this treatment. In contrast, the mass spectra from the initial seawater and the whole water incubations are consistent with previous spectra of coastal DOM (Sleighter and Hatcher, 2008), both in terms of formula composition and magnitude-averaged bulk parameters (Table 1). Elemental formulas were assigned to the majority of peaks in all spectra (range: 79–99%; Table 2). Formulas with CHO were the most numerous formula class in all DOM samples but minor contributions from heteroatoms such as N and S were also observed (Tables 1, 2). The high-abundance peaks in the < 1.0-μm spectra have a unique composition relative to the initial DOM and occur throughout the spectrum (Figure 3). These peaks shift the bulk parameters toward higher contributions of N and S and lower aromaticities as quantified by DBE values (Table 1).
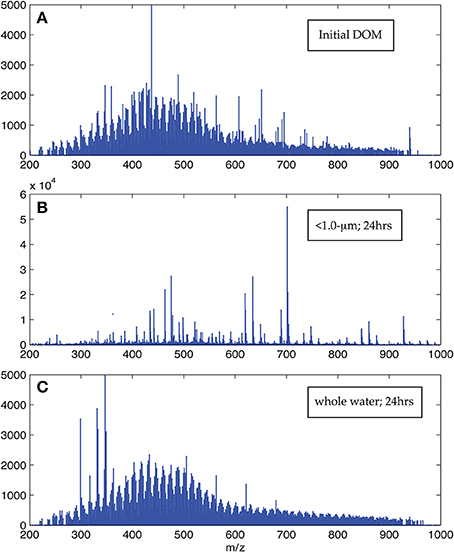
Figure 2. Representative ESI FT-ICR positive ion mode mass spectra. Panel (A) is the initial DOM prior to the start of the incubation, Panel (B) is the < 1.0-μm spectrum, and Panel (C) is the whole water spectrum after 24 h. The visual difference evident here was present in all pairs of spectra collected at the same time point in the experiment, although spectra within each category did not change appreciably with time.
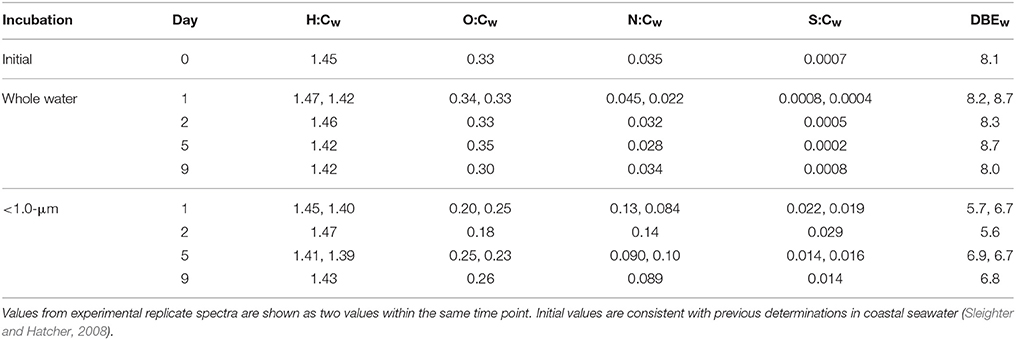
Table 1. Elemental ratios for all samples, calculated as magnitude-averaged values (Sleighter and Hatcher, 2008) for m/z values with assigned elemental formulas.
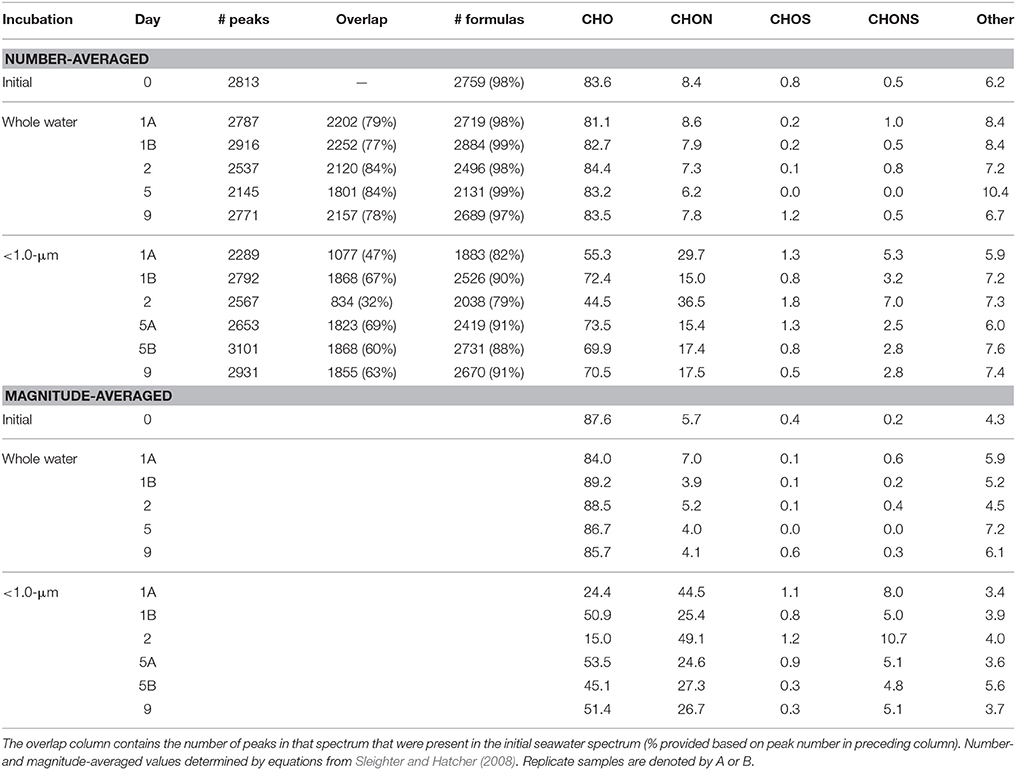
Table 2. Formula classes for each mass spectrum.
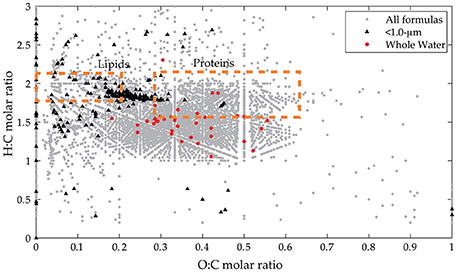
Figure 3. Van Krevelen diagram for assigned formulas in all samples. Broad compositional classes are shown in boxes with all assigned formulas in all spectra (gray circles). Indicator peaks derived from presence/absence data are also shown (< 1.0-μm indicators in black triangles, whole water indicators in red circles).
Cluster analysis (Figure 4A) and NMS (Figure 4B) of the full-scan MS data confirm the visual difference between whole water and < 1.0-μm incubations. The primary separation in both statistical analyses is size fractionation, presumably due to removal of larger organisms by the 1.0-μm filter. The DOM from whole water incubations occurs in a tight group with the initial coastal DOM in both the cluster analysis and the NMS ordination, reflecting minor variability in peak diversity among these samples. The DOM samples from < 1.0-μm treatments are more variable between biological replicates and exhibit greater distances in the dendrogram (Figure 4A) and more scatter in the NMS ordination (Figure 4B). The separation between the whole-water and < 1.0-μm incubations is statistically significant (ANOSIM: R = 0.5926, p = 0.001). There does not appear to be a significant impact of incubation time on DOM composition, although we may not have sufficient data to fully constrain this effect.
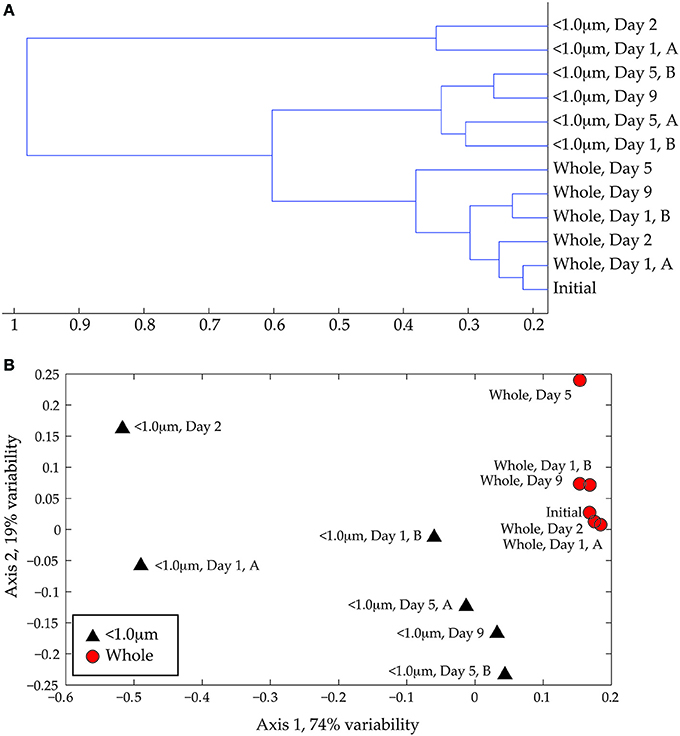
Figure 4. (A) Cluster analysis of ESI FT-ICR positive-ion mode mass spectra. Similarities among spectra were assessed using the Bray-Curtis distance matrix calculated with presence/absence data. (B) Non-metric multidimensional scaling (NMS) ordination of same data. The < 1.0-μm and the whole water data are shown with black triangles and red circles, respectively. The degree of variability represented by each axis was calculated using a Mantel test (see text) and is shown in the axis label. The stress for this ordination is 0.029 and the r2 is 0.94.
The indicator MS peaks for the two pre-assigned groups (whole water and < 1.0-μm) have distinct compositional signatures (Figure 3; Table S1). The whole water indicators occur in the region characteristic of marine refractory DOM (e.g., Sleighter and Hatcher, 2008; Kujawinski et al., 2009) that contains aromatic or alicyclic oxidized moieties. This material is considered to be the product of extensive reworking and humification reactions (Hertkorn et al., 2006) and thus is unlikely to represent recently-synthesized biomass. We hypothesize that these indicator values represent refractory DOM molecules whose ionization is suppressed in the < 1.0-μm samples. In contrast, the bacterial indicators have high H:C and low-to-moderate O:C ratios, similar to the lipid-like and protein-like regions of the van Krevelen diagram. In addition, they have elevated N and S content and appear to be more aliphatic with lower DBE values. We hypothesize that the < 1.0-μm indicators represent compounds produced by bacterial metabolism, even though they are not isotopically-enriched.
The ultrahigh mass resolution of the FT-ICR MS used here allowed us to resolve individual molecules produced in the < 1.0-μm treatments and to probe their structural composition with MS/MS. This ability is unusual in DOM compositional studies because, in most cases, >10 peaks share a nominal mass and they cannot be adequately separated for MS/MS fragmentation. However, the < 1.0-μm indicator molecules often dominated their nominal mass windows and sufficiently high abundances of an individual feature could be isolated within the ion-trap for fragmentation. Twenty-two indicator m/z values were selected based on relative abundance in all < 1.0-μm samples (Table S1). None of the fragmentation spectra yielded matches within error to Web-based databases so putative identifications were not possible.
All fragmentation spectra contain two categories of information about the precursor molecule. First, the peaks, or fragments, represent pieces of the precursor molecule that retain a charge (positive in this case) and can be detected in the mass spectrometer. Second, the mass differences between the precursor molecule and individual fragments or between two fragments, called “neutral losses,” represent pieces of the molecule that did not retain a charge and thus cannot be detected in the mass spectrometer. Both fragments and neutral losses can be used to infer structural characteristics in the precursor molecule. We determined common fragments and neutral losses across the different spectra and annotated a group of neutral losses in addition to those commonly observed in metabolite mass spectra (Rasche et al., 2011). We assigned elemental formulas and tentative molecular structures to these neutral losses through comparison to the METLIN database (Tautenhahn et al., 2012). For example, two neutral losses (Δm = 127.0637 and Δm = 226.1690; Figure 5) were compared to fragmentation spectra in METLIN, using the Neutral Loss search. In the first case, the few hits with putative structure were annotated as peptides. In the second case, however, many hits were observed with putative structures and almost all of them (11 of 12 within 5 ppm error) were peptides containing leucine or isoleucine. These hits were interpreted as evidence that the neutral losses represented peptidic moieties.
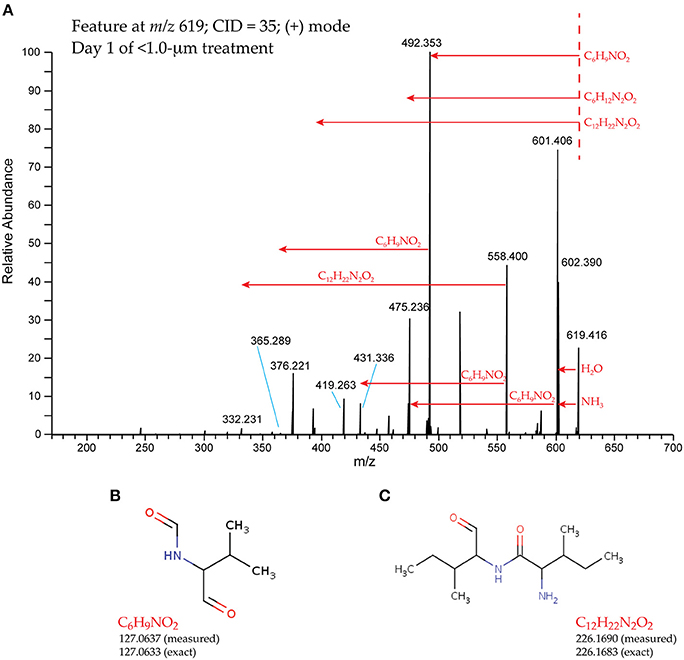
Figure 5. Representative fragmentation (MS/MS) spectrum and two neutral losses. The spectrum (A) was collected from ion m/z 619.4163, isolated in the Day 1, < 1.0-μm treatment. Dashed red line indicates position of the precursor ion; red arrows indicate neutral losses. Elemental formulas were assigned and putative structures were proposed for C6H9NO2 (B) and C12H22N2O2 (C), based on comparison to METLIN (Tautenhahn et al., 2012).
Fragmentation spectra fell into three general categories: (1) >10 fragments with a high prevalence of N-containing neutral losses (Figure 5); (2) >10 fragments with high prevalence of O-containing neutral losses (Figure S1) and (3) < 10 fragments. To show the similarity and differences among these spectra concisely, we applied hierarchical cluster analysis to the spectra based on fragments (Figure S2) and neutral losses (Figure S3). This approach is similar to network analysis comparisons based on fragmentation spectra in order to infer common structural components (Watrous et al., 2012). Many fragments were shared among the chosen ions, indicating common structural moieties among these molecules. For example, fragment m/z 492.3526 was present in 13 of 22 spectra (e.g., Figure 5). None of the common fragments could be putatively identified through matches to databases, so we also considered commonalities associated with neutral losses (Figure S3). The largest group of common spectra exhibited high numbers of N-containing neutral losses, including the putative peptide moieties (Figure 5 and Figure S3). Since the precursor molecules do not match any peptides in METLIN, it is unlikely that these molecules are peptides themselves but they may have peptide side chains or other peptidic functional groups. Another group of spectra exhibited high numbers of O-containing neutral losses (Figures S1, S3). These functionalities are common in biomolecules and thus do not provide sufficient information to propose compound structure or biological function. Future annotation or identification of these molecules may be possible as mass spectral databases of microbial metabolites are further populated.
Microbial Diversity
The primary treatment in this experiment was the removal of organisms >1.0 μm in diameter, i.e., eukaryotic phytoplankton, protozoan grazers, and particle-associated bacteria. We examined microbial diversity microscopically and using TRFLP and clone libraries. Microscopic investigations showed a minimal contribution of auto-fluorescing cells to the whole water incubations while protozoan abundances increased. Thus, we attribute the bulk of our biological and chemical signals to protozoan grazing activity.
We observed similar results between the TRFLP data generated by the two enzymes (Hin6I and BsuRI) and, for brevity, we present only the data from the Hin6I enzyme cleavage. NMS ordination of this data shows that the bacterial diversity in the < 1.0-μm and the whole-water incubations is distinct in the bulk DNA extracts (Figure 6; ANOSIM: R = 0.6366, p = 0.001). The clone library data suggests that this difference is due to the prevalence of Bacteroidetes and γ-proteobacteria in the < 1.0-μm treatments relative to α-proteobacteria in the whole water incubations (Table S2 and Figure 7). Rarefaction analysis of our clone library data suggests that we did not fully capture the diversity of bacteria in our incubations.
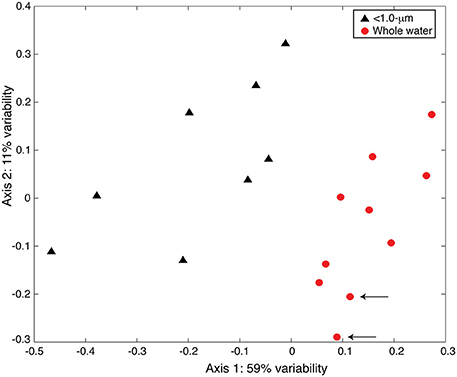
Figure 6. NMS ordination of 16S rDNA TRFLP samples (Hin6I). The < 1.0-μm (black triangles) and the whole water (red circles) incubations are presented. The stress for this ordination is 0.124 and the r2 between the original distance matrix and this NMS ordination is 0.90. The degree of variability represented by each axis was calculated using a Mantel test (see text) and is shown in the axis label. Arrows indicate samples from the original seawater.
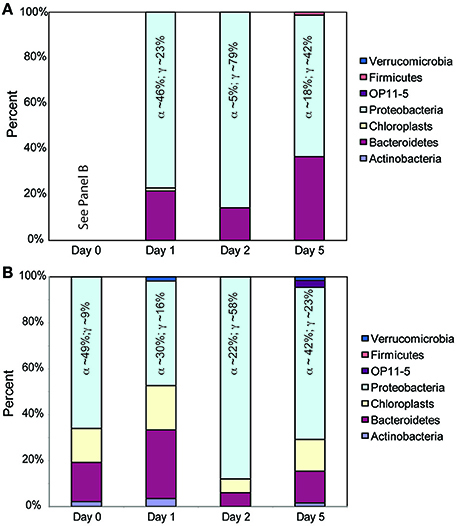
Figure 7. Relative contributions of different bacterial phyla in 16S rDNA clone libraries. Panel (A) represents the clones from the < 1.0-μm treatments and Panel (B) represents the clones from the whole water incubations. Colors in the bars follow the sequence provided in the legend. The Day 0 bar in Panel (B) represents the initial seawater prior to 1.0-μm filtration and is applicable to both Panels (A,B). Within the Proteobacteria, the contributions of the two primary classes are given (α-proteobacteria and γ-proteobacteria).
The TRFLP data from the CsCl fractions confirmed the large influence of >1.0-μm organisms on bacterial diversity (Figure 8A; ANOSIM: R = 0.3592, p = 0.001). We also examined the diversity in 13C-rich fractions (i.e., “metabolically active”) relative to 13C-poor fractions (i.e., “metabolically inactive”) to assess the impact of added substrate on bacterial diversity in both treatments. The active and inactive TRFs separate along the second axis (Figure 8B; ANOSIM: R = 0.1894, p = 0.001). The distinction is statistically significant even though the variability explained along the second axis is lower (12% on Axis 2 vs. 70% on Axis 1) and the ANOSIM results are less definitive. It should be noted that the separation is driven primarily by data from the early time points and comparatively fewer TRFs were found in the “metabolically active” region on Day 9. This is likely due to increasing remineralization of the added glucose to carbon dioxide and overall decrease in isotopic content in the incubations. Samples to confirm this hypothesis were lost during analysis.
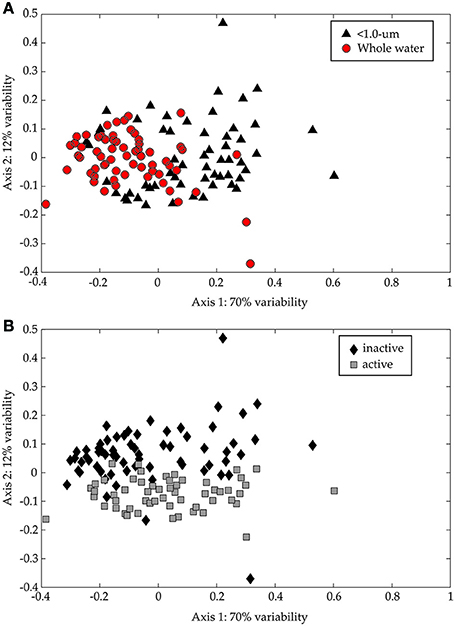
Figure 8. NMS ordination of 16S rDNA CsCl TRFLP samples (Hin6I). The same data is presented in both panels. In (A), the < 1.0-μm (black triangles) and the whole water (red circles) incubations are presented, while in (B), the 13C-enriched (“active”; gray squares) and the non-enriched (“inactive”; black diamonds) regions of the CsCl gradient are presented. The stress for this ordination is 0.169 and the r2 between the original distance matrix and this NMS ordination is 0.86. The degree of variability represented by each axis was calculated using a Mantel test (see text) and is shown in the axis label.
No cells larger than 1.0-μm were detected by microscopy in the < 1.0-μm incubations; therefore, we restricted the following 18S rDNA diversity analyses to the whole water incubations. The NMS ordination of 18S rDNA from the CsCl fractions shows no statistically significant difference between “metabolically active” and “metabolically inactive” TRFLP samples (Figure 9; ANOSIM: R = 0.0589, p = 0.1060). However, there are “metabolically active” TRFs in the NMS ordination that may reflect grazing of labeled bacteria, or the uptake of isotopically-labeled DOM (outside our analytical window). Although we did not determine the identity of these TRFs, the presence of “metabolically active” TRFs and our microscopy results, which show an increase in nanoflagellate abundance over the time course of our experiment, support the notion that grazing of prey occurred in our experiments. The sequences collected in our bulk 18S rDNA clone libraries (Table S3) confirm the presence of common protozoan bacterivores (ciliates, dinoflagellates, and stramenopiles; Jürgens and Massana, 2008).
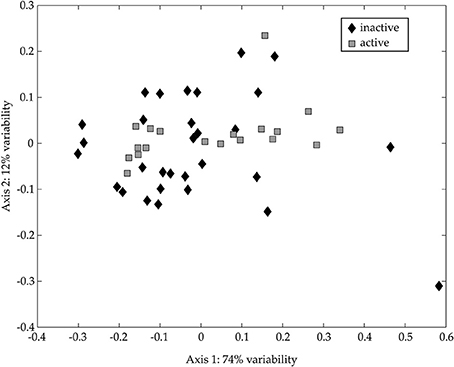
Figure 9. NMS ordination of 18S rDNA CsCl TRFLP samples. NMS ordinations were calculated as described in the text based on TRFLP patterns for appropriate samples. The TRFs occurring in the 13C-enriched (“active”; gray squares) and the non-enriched (“inactive”; black diamonds) regions of the CsCl gradient are presented. The stress for this ordination is 0.159 and the r2 between the original distance matrix and this NMS ordination is 0.85. The degree of variability represented by each axis was calculated using a Mantel test (see text) and is presented in the axis label.
Discussion
This study provides an opportunity to simultaneously evaluate bacterial diversity and DOM composition as a function of the presence or absence of larger organisms, including protozoan grazers. Although the role of bacterial diversity in DOM composition has been investigated in numerous studies (reviewed in Kujawinski, 2011), experiments have only recently been able to include molecular-level details on DOM composition using ultrahigh resolution mass spectrometry (e.g., Arrieta et al., 2015; Lechtenfeld et al., 2015; Pedler Sherwood et al., 2015). In addition, these investigations commonly exclude large phytoplankton and protozoan grazers by dilution or filtration. The purpose of our study was to combine assessments of biological and chemical diversity to understand the relative impacts of multiple trophic levels on both bacterial community structure and DOM composition.
In the initial seawater, the bacterial community is consistent with prior assessments of coastal bacterial diversity (Mou et al., 2008) and the relative contributions of Bacteroidetes, α-proteobacteria, and γ-proteobacteria clones increase after glucose addition (Figure 7). This shift in diversity is consistent with previous reports of glucose utilization among coastal bacteria (Allers et al., 2007; Alonso-Sáez et al., 2009), bacterial response to organic matter pulses from phytoplankton blooms (Eiler and Bertilsson, 2007) and enclosure experiments with elevated nutrients (Fouilland et al., 2014; Baltar et al., 2016). The γ-proteobacteria, in particular, grow rapidly when glucose is added and are highly susceptible to grazing by heterotrophic nanoflagellates (Alonso-Sáez et al., 2009). The enhanced presence of Bacteroidetes clones in the < 1.0-μm incubations may be due to this clade's ability to degrade complex organic matter (Cottrell and Kirchman, 2000) and/or to predate on other bacteria (Banning et al., 2010). Nevertheless, bacterial diversity and DOM composition were not correlated (Mantel test, p > 0.05). Thus, we cannot assign specific DOM exudates to bacterial groups identified in the clone libraries, possibly reflecting the “generalist” behavior of coastal bacteria to pulse nutrient additions (Mou et al., 2008). Instead, the presence of larger organisms, including protozoa, appears to overwhelm the impacts of substrate addition on community diversity.
DOM composition in the two treatments was visually and statistically distinct. The < 1.0-μm incubations had DOM with a unique composition from the unfiltered, whole water, incubations, and we posit that these differences are due to increased bacterial abundance and altered bacterial physiology in the absence of grazing. Together these differences might correspond to shifts in the composition of bacterial-derived DOM or exudates. Although the composition of bacterial-derived DOM is not well-constrained across different bacterial clades (Carlson, 2002), it has been shown to contain membrane and cell wall components, including peptidoglycan (Stoderegger and Herndl, 1998), and it may be refractory on short- to medium-time scales (days to months; Ogawa et al., 2001; Kawasaki and Benner, 2006). The elemental composition of material in our incubations is consistent with lipid-like and protein-like compounds and fragmentation spectra indicate the presence of numerous peptide moieties. Thus, the overall characteristics of the features in our < 1.0-μm dataset are consistent with those assumed for bacterial-derived DOM. To test the hypothesis that the compounds observed in the < 1.0-μm incubations were derived from bacterial cell walls, we compared our data to published peptidoglycan structures (Schleifer and Kandler, 1972). Although we found no matches between our data and published structures, the structure of the peptide bridge in peptidoglycan is quite variable (Schleifer and Kandler, 1972) and amino acids are present in a variety of other bacterial exudate molecules (Kaiser and Benner, 2008). Nevertheless, the fact that these molecules were not detected in the whole water incubations suggests that they are produced as a response to high bacterial densities or to a release from grazing pressure. The MS/MS spectra, together with the exact masses, provide the basis for future development of quantitative MS methods that could probe the roles and dynamics of these compounds within bacteria-rich microenvironments such as biofilms.
This lipid-/peptide-like material may have been produced solely by a subset of bacteria in the < 1.0-μm incubations. This could include opportunistic γ-proteobacteria dominant in the early time points. It is also possible that bacteria in the < 1.0-μm incubations were limited by nutrients (e.g., phosphorus) and increased or altered their exudate compositions. However, these hypotheses are unlikely to be correct because the lipid-/peptide-like material was never observed in the whole water DOM and γ-proteobacteria clones were prevalent in the early time-points of both incubations. Furthermore, this material was present uniformly across all time points in the < 1.0-μm incubation, rather than as a result of increasing nutrient limitation. An alternative explanation is that the organisms in the whole water incubations (larger than 1.0-μm) consumed the lipid-/peptide-like material directly. This hypothesis is not realistic because the protozoa or phytoplankton would have had to consume this material entirely without leaving any trace for ionization. This seems unlikely given the amount of material evident in the < 1.0-μm incubations and its apparently high ionization efficiency. This hypothesis is also inconsistent with previous findings (Gruber et al., 2006) where protozoa did not consume the DOM produced by bacteria. For all of these hypotheses, the lack of this material in the first time point (24 h) of the whole water incubations suggests that it was simply not produced in this incubation. The most likely explanation is that the physiology of bacteria was altered in the < 1.0-μm incubations, relative to the whole water incubations, enhancing the production of distinct DOM molecules. Bacteria are known to produce extracellular material that can be surface-associated (Stoderegger and Herndl, 1998) and/or enriched in carbohydrate moieties (extracellular polysaccharides; Passow, 2002). Further, surface properties of bacteria can change as a function of grazing pressure (Matz and Jürgens, 2003), which could lead to compositional or dynamic shifts in released DOM.
In the whole water incubations, we looked for signatures of molecules that could be assigned to the organisms removed by the 1.0-μm filter, such as large phytoplankton and nanoflagellate protozoan grazers. Phytoplankton exudates are not well constrained, although they have been shown to contain numerous compounds, including amino acids and polysaccharides, none of which were observed in our spectra. However, as noted above, we observed few auto-fluorescent cells on our microscopy filters and the 18S rDNA clone libraries contain representatives of common protozoan grazing clades observed in coastal seawater. Thus, we infer that the primary active organisms in this size class were protozoa, grazing on bacterial prey. Previous work suggests that protozoa can have a large, indirect, impact on bulk DOM concentrations (Nagata and Kirchman, 1992; Strom et al., 1997). Some authors have proposed that protozoan grazing may be the primary source of DOM in oligotrophic regions (Jumars et al., 1989; Nagata, 2000). Past studies of protozoan egesta have observed small molecules such as amino acids or urea (Andersson et al., 1985; Nagata and Kirchman, 1991) or colloidal material (Taylor et al., 1985; Nagata, 2000). Both of these compound classes fall outside our analytical window (200 < m/z < 1000); individual amino acids (and urea) are too small and colloidal materials (1–10 kDa) are too large. Therefore, we cannot clearly distinguish these putative grazing products in the whole-water DOM, consistent with the other two mass spectrometry-based investigations of protozoan-derived DOM (Kujawinski et al., 2004; Gruber et al., 2006) and past observations by Taylor et al. (1985) of limited impact of grazing on the 500–1000 Da size fraction. Recent experiments observed production of labile (Fouilland et al., 2014) or humic-/ protein-like material (Baña et al., 2014) during protozoan grazing. Our results would be consistent with these previous studies if the material produced is colloidal and contains protein-like moieties. However, the nature of this material could be very different structurally and further experiments are needed to constrain the size and molecular composition of colloidal protozoan egesta.
We also compared the m/z features in the whole water incubations to the compound data in KEGG in order to test whether cellular components were present in these incubations. We found no significant overlap, suggesting the lack of common cytoplasm components in this DOM, or the rapid consumption of these molecules leading to exceedingly low concentrations. These data do not definitively prove that no cellular DOM was present, but instead suggest that these components are difficult to discern against the background DOM. Emerging tools in metabolomics that separate individual molecules or classes from background DOM hold great potential for isolating new proxies of phytoplankton exudates and grazing in complex mixtures (Kido Soule et al., 2015; Longnecker et al., 2015a). Application of these tools to the questions posed here will be an important step forward in identifying compounds that could serve as markers in the field for trophic interactions.
The striking difference between DOM composition in our two treatments highlights the potential artifacts that can arise when a microbial community is modified for detailed experimentation. The bottle incubations in this study altered the microbial communities relative to the initial seawater but the DOM composition data suggests that the presence of organisms >1.0-μm mitigated this impact. We posit that the refractory DOM produced in past studies could reflect the absence of some community members, such as grazers, rather than a ubiquitous capability of heterotrophic bacterial metabolism. Indeed the difference in DOM composition between the two treatments suggests that the net metabolism of a community differs fundamentally from the metabolism of individual fractions. Thus, incomplete, or possibly inaccurate, assessments of organism traits and metabolic capabilities could develop when studies exclude common co-occurring microbes, such as protozoan predators. Similar concerns arise in incubations that exclude slow-growing archaea (Santoro and Casciotti, 2011) or low-abundance zooplankton such as copepods (Steinberg et al., 2004). The impacts of many of these organisms on the marine carbon cycle may be under-appreciated due to their incompatibility with standard, tractable, laboratory, and field experiments. Using tools such as those described here would enable the identification of a chemical footprint of these organisms and subsequent assessment of their quantitative contribution to marine DOM. In general, additional work is needed to fully characterize the material produced in marine ecosystems, with a focus on labile molecules that fuel carbon turnover. The sensitivities of microbial consortia to anticipated climate changes are poorly constrained and thus remain an open question for biogeochemical modeling efforts for future ocean scenarios. In particular, identification and quantification of proxies for grazing and other mortality processes, as well as estimates of their remineralization rates, could prove important to disentangling the relative impact of carbon release from organisms in larger size classes and/or higher trophic levels.
Author Contributions
EK designed the study, analyzed the data, and wrote the paper; KL, RW, and MK contributed new analytical tools; KL and KB completed the lab work; all authors edited the paper.
Conflict of Interest Statement
The authors declare that the research was conducted in the absence of any commercial or financial relationships that could be construed as a potential conflict of interest.
Acknowledgments
Funding for the work was provided by the National Science Foundation (CAREER-OCE-0529101 and OCE-0928424 to EK). The mass spectral data was collected at the WHOI FT-MS Facility which was funded by the National Science Foundation (OCE-0619608) and the Gordon and Betty Moore Foundation. The authors are grateful to Louisa Morrison for early technical assistance, to Benjamin Van Mooy for the use of the DAx software, to Rebecca Gast and Mark Dennett for assistance with the flow cytometer, to Gretchen Swarr for assistance in the lab, and to past and present members of the Kujawinski group for critical comments on the manuscript.
Supplementary Material
The Supplementary Material for this article can be found online at: https://www.frontiersin.org/article/10.3389/fmars.2016.00045
References
Allers, E., Gómez-Consarnau, L., Pinhassi, J., Gasol, J. M., Šimek, K., and Pernthaler, J. (2007). Response of Alteromonadaceae and Rhodobacteriaceae to glucose and phosphorus manipulation in marine mesocosms. Environ. Microbiol. 9, 2417–2429. doi: 10.1111/j.1462-2920.2007.01360.x
Alonso-Sáez, L., Sánchez, O., and Gasol, J. M. (2012). Bacterial uptake of low molecular weight organics in the subtropical Atlantic: are major phylogenetic groups functionally different? Limnol. Oceanogr. 57, 798–808. doi: 10.4319/lo.2012.57.3.0798
Alonso-Sáez, L., Unanue, M. A., Latatu, A., Azua, I., Ayo, B., Artolozaga, I., et al. (2009). Changes in marine prokaryotic community induced by varying types of dissolved organic matter and subsequent grazing pressure. J. Plankton Res. 31, 1373–1383. doi: 10.1093/plankt/fbp081
Amin, S. A., Parker, M. S., and Armbrust, E. V. (2012). Interactions between diatoms and bacteria. Microbiol. Mol. Biol. Rev. 76, 667–684. doi: 10.1128/MMBR.00007-12
Andersson, A., Lee, C., Azam, F., and Hagstrom, A. (1985). Release of amino acids and inorganic nutrients by heterotrophic marine microflagellates. Mar. Ecol. Prog. Ser. 23, 99–106. doi: 10.3354/meps023099
Arrieta, J. M., Mayol, E., Hansman, R. L., Herndl, G. J., Dittmar, T., and Duarte, C. M. (2015). Dilution limits dissolved organic carbon utilization in the deep ocean. Science 348, 331–333. doi: 10.1126/science.1258955
Azam, F., Fenchel, T., Field, J. G., Gray, J. S., Meyer-Reil, L. A., and Thingstad, F. (1983). The ecological role of water-column microbes in the sea. Mar. Ecol. Prog. Ser. 10, 257–263. doi: 10.3354/meps010257
Baltar, F., Palovaara, J., Unrein, F., Catala, P., Horňák, K., Šimek, K., et al. (2016). Marine bacterial community structure resilience to changes in protist predation under phytoplankton bloom conditions. ISME J. 10, 568–581. doi: 10.1038/ismej.2015.135
Baña, Z., Ayo, B., Marrasé, C., Gasol, J. M., and Iriberri, J. (2014). Changes in bacterial metabolism as a response to dissolved organic matter modification during protozoan grazing in coastal Canabrian and Mediterranean waters. Environ. Microbiol. 16, 498–511. doi: 10.1111/1462-2920.12274
Banning, E. C., Casciotti, K. L., and Kujawinski, E. B. (2010). Novel strains isolated from a coastal aquifer suggest a predatory role for Flavobacteria. FEMS Microbiol. Ecol. 73, 254–270. doi: 10.1111/j.1574-6941.2010.00897.x
Barbeau, K. A., Kujawinski, E. B., and Moffett, J. W. (2001). Remineralization and recycling of iron, thorium and organic carbon by heterotrophic marine protists in culture. Aquat. Microb. Ecol. 24, 69–81. doi: 10.3354/ame024069
Becker, J. W., Berube, P. M., Follett, C. L., Waterbury, J. B., Chisholm, S. W., DeLong, E. F., et al. (2014). Closely related phytoplankton species produce similar suites of dissolved organic matter. Front. Microbiol. 5:111. doi: 10.3389/fmicb.2014.00111
Bhatia, M. P., Das, S. B., Charette, M. A., Longnecker, K., and Kujawinski, E. B. (2010). Molecular characterization of dissolved organic matter associated with the Greenland ice sheet. Geochim. Cosmochim. Acta 74, 3768–3784. doi: 10.1016/j.gca.2010.03.035
Carlson, C. A. (2002). “Production and removal processes,” in Biogeochemistry of Marine Dissolved Organic Matter, eds D. A. Hansell and C. A. Carlson (San Diego, CA: Elsevier Science), 91–152.
Corno, G., and Jürgens, K. (2008). Structural and functional patterns of bacterial communities in response to protist predation along an experimental productivity gradient. Environ. Microbiol. 10, 2857–2871. doi: 10.1111/j.1462-2920.2008.01713.x
Cottrell, M. T., and Kirchman, D. L. (2000). Natural assemblages of marine proteobacteria and members of the Cytophaga-Flavobacter cluster consuming low- and high-molecular-weight dissolved organic matter. Appl. Environ. Microbiol. 66, 1692–1697. doi: 10.1128/AEM.66.4.1692-1697.2000
Durham, B. P., Sharma, S., Luo, H., Smith, C. B., Amin, S. A., Bender, S. J., et al. (2015). Cryptic carbon and sulfur cycling between surface ocean plankton. Proc. Natl. Acad. Sci. U.S.A. 112, 453–457. doi: 10.1073/pnas.1413137112
Eiler, A., and Bertilsson, S. (2007). Flavobacteria blooms in four eutrophic lakes: Linking population dynamics of freshwater bacterioplankton to resource availability. Appl. Environ. Microbiol. 73, 3511–3518. doi: 10.1128/AEM.02534-06
Fouilland, E., Tolosa, I., Bonnet, D., Bouvier, C., Bouvier, T., Bouvy, M., et al. (2014). Bacterial carbon dependence on freshly produced phytoplankton exudates under different nutrient availability and grazing pressure conditions in coastal marine waters. FEMS Microbiol. Ecol. 87, 757–769. doi: 10.1111/1574-6941.12262
Gruber, D. F., Simjouw, J.-P., Seitzinger, S. P., and Taghon, G. L. (2006). Dynamics and characterization of refractory dissolved organic matter produced by a pure bacterial culture in an experimental predator-prey system. Appl. Environ. Microbiol. 72, 4184–4191. doi: 10.1128/AEM.02882-05
Hedges, J. I. (2002). “Why dissolved organics matter,” in Biogeochemistry of Marine Dissolved Organic Matter, eds D. A. Hansell and C. A. Carlson (San Diego, CA: Elsevier Science), 1–34.
Hertkorn, N., Benner, R., Frommberger, M., Schmitt-Kopplin, P., Witt, M., Kaiser, K., et al. (2006). Characterization of a major refractory component of marine dissolved organic matter. Geochim. Cosmochim. Acta 70, 2990–3010. doi: 10.1016/j.gca.2006.03.021
Hobbie, J. E., Daley, R. J., and Jasper, S. (1977). Use of Nuclepore filters for counting bacteria by fluorescence microscopy. Appl. Environ. Microbiol. 33, 1225–1228.
Horai, H., Arita, M., Kanaya, S., Nihei, Y., Ikeda, T., Suwa, K., et al. (2010). MassBank: a public repository for sharing mass spectral data for life sciences. J. Mass Spectrom. 45, 703–714. doi: 10.1002/jms.1777
Jiao, N., Herndl, G. J., Hansell, D. A., Benner, R., Kattner, G., Wilhelm, S. W., et al. (2010). Microbial production of recalcitrant dissolved organic matter: long-term carbon storage in the global ocean. Nat. Rev. Microbiol. 8, 593–599. doi: 10.1038/nrmicro2386
Jumars, P. A., Penry, D. L., Baross, J. A., Perry, M. J., and Frost, B. W. (1989). Closing the microbial loop: dissolved carbon pathway to heterotrophic bacteria from incomplete ingestion, digestion and absorption in animals. Deep Sea Res. 36, 483–495. doi: 10.1016/0198-0149(89)90001-0
Jürgens, K., and Massana, R. (2008). “Protistan grazing on marine bacterioplankton,” in Microbial Ecology of the Oceans, ed D. L. Kirchman (New York, NY: Wiley), 383–441.
Kaiser, K., and Benner, R. (2008). Major bacterial contribution to the ocean reservoir of detrital organic carbon and nitrogen. Limnol. Oceanogr. 53, 99–112. doi: 10.4319/lo.2008.53.1.0099
Kawasaki, N., and Benner, R. (2006). Bacterial release of dissolved organic matter during cell growth and decline: Molecular origin and composition. Limnol. Oceanogr. 51, 2170–2180. doi: 10.4319/lo.2006.51.5.2170
Kido Soule, M. C., Longnecker, K., Giovannoni, S. J., and Kujawinski, E. B. (2010). Impact of instrument and experimental parameters on the repeatability and reproducibility of peaks in ultrahigh resolution ESI FT-ICR mass spectra of natural organic matter. Org. Geochem. 41, 725–733. doi: 10.1016/j.orggeochem.2010.05.017
Kido Soule, M. C., Longnecker, K., Johnson, W. M., and Kujawinski, E. B. (2015). Environmental metabolomics: analytical strategies. Mar. Chem. 177, 374–387. doi: 10.1016/j.marchem.2015.06.029
Koch, B. P., Dittmar, T., Witt, M., and Kattner, G. (2007). Fundamentals of molecular formula assignment to ultrahigh resolution mass data of natural organic matter. Anal. Chem. 79, 1758–1763. doi: 10.1021/ac061949s
Kujawinski, E. B. (2011). The impact of microbial metabolism on marine dissolved organic matter. Ann. Rev. Mar. Sci. 3, 567–599. doi: 10.1146/annurev-marine-120308-081003
Kujawinski, E. B., and Behn, M. D. (2006). Automated analysis of electrospray ionization Fourier transform ion cyclotron resonance mass spectra of natural organic matter. Anal. Chem. 78, 4363–4373. doi: 10.1021/ac0600306
Kujawinski, E. B., Del Vecchio, R., Blough, N. V., Klein, G. C., and Marshall, A. G. (2004). Probing molecular-level transformations of dissolved organic matter: insights from electrospray ionization Fourier-transform ion cyclotron resonance mass spectrometry. Mar. Chem. 92, 23–37. doi: 10.1016/j.marchem.2004.06.038
Kujawinski, E. B., Longnecker, K., Blough, N. V., Del Vecchio, R., Finlay, L., Kitner, J. B., et al. (2009). Identification of possible source markers in marine dissolved organic matter using ultrahigh resolution electrospray ionization Fourier-transform ion cyclotron resonance mass spectrometry. Geochim. Cosmochim. Acta 73, 4384–4399. doi: 10.1016/j.gca.2009.04.033
Lechtenfeld, O. J., Hertkorn, N., Shen, Y., Witt, M., and Benner, R. (2015). Marine sequestration of carbon in bacterial metabolites. Nat. Commun. 6, 6711. doi: 10.1038/ncomms7711
Lima-Mendez, G., Faust, K., Henry, N., Decelle, J., Colin, S., Carcillo, F., et al. (2015). Determinants of community structure in the global plankton interactome. Science 348, 1262073. doi: 10.1126/science.1262073
Longnecker, K., Da Costa, A., Bhatia, M., and Kujawinski, E. B. (2009). Effect of carbon addition and predation on acetate-assimilating bacterial cells in groundwater. FEMS Microbiol. Ecol. 70, 456–470. doi: 10.1111/j.1574-6941.2009.00767.x
Longnecker, K., Futrelle, J., Coburn, E., Kido Soule, M. C., and Kujawinski, E. B. (2015a). Environmental metabolomics: databases and tools for data analysis. Mar. Chem. 177, 366–373. doi: 10.1016/j.marchem.2015.06.012
Longnecker, K., Kido Soule, M. C., and Kujawinski, E. B. (2015b). Dissolved organic matter produced by Thalassiosira pseudonana. Mar. Chem. 168, 114–123. doi: 10.1016/j.marchem.2014.11.003
Mantini, D., Petrucci, F., Pieragostino, D., Del Boccio, P., Di Nicola, M., Di Ilio, C., et al. (2007). LIMPIC: a computational method for the separation of protein MALDI-TOF-MS signals from noise. BMC Bioinformatics 8:101. doi: 10.1186/1471-2105-8-101
Matz, C., and Jürgens, K. (2003). Interaction of nutrient limitation and protozoan grazing determines the phenotypic structure of a bacterial community. Microb. Ecol. 45, 384–398. doi: 10.1007/s00248-003-2000-0
McCune, B., and Grace, J. (2002). Analysis of Ecological Communities. Gleneden Beach, OR: MjM Software Design.
Mou, X. Z., Sun, S. L., Edwards, R. A., Hodson, R. E., and Moran, M. A. (2008). Bacterial carbon processing by generalist species in the coastal ocean. Nature 451, 708–U704. doi: 10.1038/nature06513
Nagata, T. (2000). “Production mechanisms of dissolved organic matter,” in Microbial Ecology of the Oceans, 1st Edn., ed D. L. Kirchman (New York, NY: Wiley-Liss, Inc.), 121–152.
Nagata, T., and Kirchman, D. L. (1991). Release of dissolved free and combined amino acids by bacterivorous marine flagellates. Limnol. Oceanogr. 36, 433–443. doi: 10.4319/lo.1991.36.3.0433
Nagata, T., and Kirchman, D. L. (1992). Release of macromolecular organic complexes by heterotrophic marine flagellates. Mar. Ecol. Prog. Ser. 83, 233–240. doi: 10.3354/meps083233
Ogawa, H., Amagai, Y., Koike, I., Kaiser, K., and Benner, R. (2001). Production of refractory dissolved organic matter by bacteria. Science 292, 917–920. doi: 10.1126/science.1057627
Osterholz, H., Niggemann, J., Giebel, H. A., Simon, M., and Dittmar, T. (2015). Inefficient microbial production of refractory dissolved organic matter in the ocean. Nat. Commun. 6, 7422. doi: 10.1038/ncomms8422
Passow, U. (2002). Production of transparent exopolymer particles (TEP) by phyto- and bacterioplankton. Mar. Ecol. Prog. Ser. 236, 1–12. doi: 10.3354/meps236001
Paul, C., Barofsky, A., Vidoudez, C., and Pohnert, G. (2009). Diatom exudates influence metabolism and cell growth of co-cultured diatom species. Mar. Ecol. Prog. Ser. 389, 61–79. doi: 10.3354/meps08162
Pedler Sherwood, B., Shaffer, E. A., Reyes, K., Longnecker, K., Aluwihare, L. I., and Azam, F. (2015). Metabolic characterization of a model heterotrophic bacterium capable of significant chemical alteration of marine dissolved organic matter. Mar. Chem. 177, 357–365. doi: 10.1016/j.marchem.2015.06.027
Pernthaler, J. (2005). Predation on prokaryotes in the water column and its ecological implications. Nat. Rev. Microbiol. 3, 537–546. doi: 10.1038/nrmicro1180
Rasche, F., Svatoš, A., Maddula, R. K., Böttcher, C., and Böcker, S. (2011). Computing fragmentation trees from tandem mass spectrometry data. Anal. Chem. 83, 1243–1251. doi: 10.1021/ac101825k
Santoro, A. E., and Casciotti, K. L. (2011). Enrichment and characterization of ammonia-oxidizing archaea from the open ocean: phylogeny, physiology and stable isotope fractionation. ISME J. 5, 1796–1808. doi: 10.1038/ismej.2011.58
Sarmento, H., Romera-Castillo, C., Lindh, M., Pinhassi, J., Sala, M. M., Gasol, J. M., et al. (2013). Phytoplankton species-specific release of dissolved free amino acids and their selective consumption by bacteria. Limnol. Oceanogr. 58, 1123–1135. doi: 10.4319/lo.2013.58.3.1123
Schleifer, K.-H., and Kandler, O. (1972). Peptidoglycan types of bacterial cell walls and their taxonomic implications. Bacteriol. Rev. 36, 407–477.
Sher, D., Thompson, J. W., Kashtan, N., Croal, L., and Chisholm, S. W. (2011). Response of Prochlorococcus ecotypes to co-culture with diverse marine bacteria. ISME J. 5, 1125–1132. doi: 10.1038/ismej.2011.1
Sherr, E. B., and Sherr, B. F. (1994). Bacterivory and herbivory: key roles of phagotrophic protists in pelagic food webs. Microb. Ecol. 28, 223–235. doi: 10.1007/BF00166812
Sleighter, R. L., and Hatcher, P. G. (2008). Molecular characterization of dissolved organic matter (DOM) along a river to ocean transect of the lower Chesapeake Bay by ultrahigh resolution electrospray ionization Fourier transform ion cyclotron resonance mass spectrometry. Mar. Chem. 110, 140–152. doi: 10.1016/j.marchem.2008.04.008
Southam, A. D., Payne, T. G., Cooper, H. J., Arvanitis, T. N., and Viant, M. R. (2007). Dynamic range and mass accuracy of wide-scan direct infusion nanoelectrospray Fourier transform ion cyclotron resonance mass spectrometry-based metabolomics increased by the spectral stitching method. Anal. Chem. 79, 4595–4602. doi: 10.1021/ac062446p
Steinberg, D. K., Nelson, N. B., Carlson, C. A., and Prusak, A. C. (2004). Production of chromophoric dissolved organic matter (CDOM) in the open ocean by zooplankton and the colonial cyanobacterium Trichodesmium. Mar. Ecol. Prog. Ser. 267, 45–56. doi: 10.3354/meps267045
Stoderegger, K., and Herndl, G. J. (1998). Production and release of bacterial capsular material and its subsequent utilization by marine bacterioplankton. Limnol. Oceanogr. 43, 877–884. doi: 10.4319/lo.1998.43.5.0877
Strom, S. L., Benner, R., Ziegler, S., and Dagg, M. J. (1997). Planktonic grazers are a potentially important source of marine dissolved organic carbon. Limnol. Oceanogr. 42, 1364–1374. doi: 10.4319/lo.1997.42.6.1364
Tautenhahn, R., Cho, K., Uritboonthai, W., Zhu, Z., Patti, G. J., and Siuzdak, G. (2012). An accelerated workflow for untargeted metabolomics using the METLIN database. Nat. Biotechnol. 30, 826–828. doi: 10.1038/nbt.2348
Taylor, G., Iturriaga, R., and Sullivan, C. W. (1985). Interactions of bactivorous grazers and heterotrophic bacteria with dissolved organic matter. Mar. Ecol. Prog. Ser. 23, 129–141. doi: 10.3354/meps023129
Wang, H., Jiang, L., and Weitz, J. S. (2009). Bacterivorous grazers facilitate organic matter decomposition: a stoichiometric modeling approach. FEMS Microbiol. Ecol. 69, 170–179. doi: 10.1111/j.1574-6941.2009.00699.x
Watrous, J., Roach, P., Alexandrov, T., Heath, B. S., Yang, J. Y., Kersten, R. D., et al. (2012). Mass spectral molecular networking of living microbial colonies. Proc. Natl. Acad. Sci. U.S.A. 26, E1743–E1752. doi: 10.1073/pnas.1203689109
Weber, R. J. M., Selander, E., Sommer, U., and Viant, M. R. (2013). A stable-isotope mass spectrometry-based metabolic footprinting approach to analyze exudates from phytoplankton. Mar. Drugs 11, 4158–4175. doi: 10.3390/md11114158
Williams, D. K., and Muddiman, D. C. (2007). Parts-per-billion mass measurement accuracy achieved through the combination of multiple linear regression and automatic gain control in a Fourier transform ion cyclotron resonance mass spectrometer. Anal. Chem. 79, 5058–5063. doi: 10.1021/ac0704210
Keywords: DOM, bacteria, protozoa, microbial ecology, peptides
Citation: Kujawinski EB, Longnecker K, Barott KL, Weber RJM and Kido Soule MC (2016) Microbial Community Structure Affects Marine Dissolved Organic Matter Composition. Front. Mar. Sci. 3:45. doi: 10.3389/fmars.2016.00045
Received: 01 December 2015; Accepted: 21 March 2016;
Published: 05 April 2016.
Edited by:
Michael William Lomas, Bigelow Laboratory for Ocean Sciences, USAReviewed by:
Gordon T. Taylor, Stony Brook University, USAJason Michel Smith, Monterey Bay Aquarium Research Institute, USA
Copyright © 2016 Kujawinski, Longnecker, Barott, Weber and Kido Soule. This is an open-access article distributed under the terms of the Creative Commons Attribution License (CC BY). The use, distribution or reproduction in other forums is permitted, provided the original author(s) or licensor are credited and that the original publication in this journal is cited, in accordance with accepted academic practice. No use, distribution or reproduction is permitted which does not comply with these terms.
*Correspondence: Elizabeth B. Kujawinski, ekujawinski@whoi.edu
†Present Address: Katie L. Barott, Hawaii Institute of Marine Biology, University of Hawaii - Manoa, Kaneohe, HI, USA