An Ecosystem Services Perspective for the Oceanic Eastern Tropical Pacific: Commercial Fisheries, Carbon Storage, Recreational Fishing, and Biodiversity
 Summer L. Martin
 Lisa T. Ballance
 Theodore Groves
- 1Center for Marine Biodiversity and Conservation, Scripps Institution of Oceanography, University of California, San Diego, La Jolla, CA, USA
- 2Southwest Fisheries Science Center, NOAA Fisheries, La Jolla, CA, USA
- 3National Research Council, National Academy of Sciences, Washington, DC, USA
- 4Pacific Islands Fisheries Science Center, NOAA Fisheries, Honolulu, HI, USA
- 5Center for Environmental Economics, University of California, San Diego, La Jolla, CA, USA
- 6Economic and Policy Analysis, Theodore Groves Consulting, La Jolla, CA, USA
The ocean provides ecosystem services (ES) that support humanity. Traditional single-issue management largely failed to protect the full suite of ES. Ecosystem-based management (EBM) promotes resilient social-ecological systems that provide ES. To implement EBM, an ES approach is useful: (1) characterize major ES provided (magnitude, geographic extent, monetary value, trends, and stakeholders), (2) identify trade-offs, (3) determine desired outcomes, and (4) manage anthropogenic activities accordingly. Here we apply the ES approach (steps 1–2) to an open ocean ecosystem, the eastern tropical Pacific (ETP), an area of 21 million km2 that includes waters of 12 nations and the oceanic commons, using 35 years (1975–2010) of fisheries and economic data, and 20 years (1986–2006) of ship-based survey data. We examined commercial fisheries, carbon storage, recreational fishing, and biodiversity as the major provisioning, regulating, cultural, and supporting ES, respectively. Average catch value (using U.S. import prices for fish) for the 10 most commercially fished species was $2.7 billion yr−1. The value of carbon export to the deep ocean was $12.9 billion yr−1 (using average European carbon market prices). For two fisheries-depleted dolphin populations, the potential value of rebuilding carbon stores was $1.6 million (cumulative); for exploited fish stocks it was also $1.6 million (an estimated reduction of 544,000 mt). Sport fishing expenditures totaled $1.2 billion yr−1, from studies of three popular destinations. These initial, conservative estimates do not represent a complete summary of ETP ES values. We produced species richness maps for cetaceans, seabirds, and ichthyoplankton, and a sightings density map for marine turtles. Over 1/3 of cetacean, seabird, and marine turtle species occur in the ETP, and diversity (or density) hotspots are widespread. This study fills several gaps in the assessment of marine and coastal ES by focusing on an oceanic habitat, utilizing long-term datasets, mapping the spatial distribution of ecological components, and concentrating on an area beyond Europe and the USA. Our results improve our understanding of ETP ES, highlight their variety, and offer a new perspective for a fisheries-dominated system. This study sets the stage for further analyses of trade-offs, which can inform decisions about resource management and biodiversity conservation.
Introduction
The ocean provides ecosystem services (ES) that are critical to the survival and well-being of humanity (Ehrlich and Ehrlich, 1981; Costanza et al., 1997; Daily et al., 1997; Costanza, 1999). Defined as material and non-material benefits (i.e., goods and services) that people derive from the planet's ecological processes (Ehrlich and Ehrlich, 1981; Costanza et al., 1997; Daily et al., 1997; Fisher et al., 2009), ES vary in nature and scale, and are commonly categorized into four groups: (1) provisioning (e.g., production of food, fuel, or water), (2) regulating (e.g., regulation of climate, floods, or disease), (3) supporting (e.g., nutrient cycling, oxygen production, or habitat creation), and (4) cultural (e.g., recreational, spiritual, or aesthetic uses) (Millenium Ecosystem Assessment, 2003). Key examples from the ocean highlight the magnitude and importance of its ES. First, it provisions a major food source—nearly 4.3 billion people obtain 15% of their animal protein from fish, two-thirds of which comes from the ocean (105 million metric tons (mt) annually) (UNFAO, 2014). Second, the ocean regulates climate by serving as a major carbon sink—it has absorbed 41% of all anthropogenic carbon emissions (Sabine and Tanhua, 2010), thereby dampening the warming of the terrestrial biosphere. Third, marine organisms, most notably phytoplankton, account for nearly 50% of global primary production (Field et al., 1998)—this supports marine ecosystems by generating oxygen and particulate organic carbon (POC) for animals to consume. This process also initiates the biological pump, which transports a fraction of POC from the surface to the deep ocean, where it is sequestered on timescales of thousands to millions of years (Ducklow et al., 2001; Henson et al., 2012). Finally, the ocean provides a multitude of cultural services, including recreational opportunities (e.g., boating, diving, fishing, and surfing) and spiritual, artistic, historical, and educational information (de Groot et al., 2002)—these have been important throughout human history and in recent decades have made marine tourism the fastest growing tourism sector in the world (Hall, 2001). Globally, the economic value of all marine ES is estimated at $50 trillion (USD) yr−1 (Costanza et al., 2014).
There are trade-offs among competing uses of ocean resources, making it important to measure the value of ES accurately so that trade-offs can be made explicit (i.e., the resources can be managed to maximize the total economic value of these services). Because these trade-offs historically have been (and are often still) ignored, some resources have been over-exploited by human activities, leading to a reduction in the total economic value provided by all ocean resources. For example, impacts from overfishing, habitat destruction, pollution, and anthropogenic climate change (Jackson et al., 2001; Dulvy et al., 2003; Pandolfi et al., 2003; Worm et al., 2005, 2006; Lotze et al., 2006; Halpern et al., 2008) have resulted from decisions to exploit valuable resources (e.g., fish or crude oil) without considering negative externalities (e.g., loss of biodiversity or global warming). For extractive commodities that are either common resources or public goods without property rights, ignoring trade-offs has sometimes led to exploitative races resulting in the “tragedy of the commons” (Hardin, 1968). In many cases, the cumulative effects of ignoring ES trade-offs have degraded ecosystems, decreased biodiversity, and diminished the capacity of marine ecosystems to support increasing human populations (Worm et al., 2006).
The predominant twentieth century approach to marine resource management failed to adequately protect living resources from human impacts, resulting in widespread calls for a new management paradigm at the turn of the century (Pikitch et al., 2004; McLeod et al., 2005; Arkema et al., 2006). The traditional focus on single sectors, species, and activities did not account for the complex interaction of ecological, social, economic, and political factors impacting natural resources. Reliance on single disciplines of expertise resulted in a piece-meal understanding of marine ecosystems. Ecosystem-based management (EBM) was proposed as an alternative, holistic approach which considers the entire system, rather than single sectors or species, and explicitly factors humans into the equation (Pikitch et al., 2004; McLeod et al., 2005; Arkema et al., 2006). At its core is the goal of maintaining healthy, productive, and resilient ecosystems that will provide the services that humans want and need into the future (Pikitch et al., 2004; McLeod et al., 2005). To accomplish this goal, an ES approach can be employed in four broad steps: (1) characterize key ES provided by the system that are valuable to society in some way, (2) identify and understand the trade-offs associated with each service, (3) determine the desired outcomes for the system in terms of the level of each service to maintain, and (4) manage anthropogenic activities to achieve the desired outcomes.
The ES approach requires an understanding of the social-ecological system of interest, and is critical to implementation of EBM; however, its application in the marine environment has been largely limited to coastal systems, particularly mangroves, wetlands, and coral reefs (see Liquete et al., 2013 for a review of marine and coastal ES studies). This is apparent in the number of monetary value estimates that exist for coastal systems: of 275 estimates, 95% were relevant to coastal marine systems and only 5% pertained to the open ocean (de Groot et al., 2012). There has been much less emphasis on the open ocean because it is remote, and significantly more difficult to study and manage. However, as the management paradigm for open ocean ecosystems moves toward more holistic approaches, efforts to assess their ES will need to progress.
The goal of this paper is to apply the ES approach to an open ocean system (i.e., an ecosystem seaward of the continental shelf, which we will refer to as “oceanic”). Using long-term fisheries, economic, and ship-based research survey datasets, we tackle the first two steps listed above by (1) characterizing the major ES in terms of their magnitude, geographic extent, monetary value (where appropriate), trends in quantities and values, and stakeholders, and (2) identifying potential trade-offs among those ES. We use the eastern tropical Pacific (ETP) as a case study and target (1) commercial fisheries as a provisioning service, (2) carbon storage as a regulating service, (3) recreational (sport) fishing as a cultural service, and (4) biodiversity as a supporting service. While the benefits of commercial and recreational fishing are direct (e.g., food and recreation) and familiar to most, the benefits of carbon storage and biodiversity warrant further introduction.
Carbon storage is important due to its role in mitigating anthropogenic climate change (Sabine and Tanhua, 2010). The uptake of CO2 at the ocean surface is primarily influenced by physical and chemical processes (Sabine and Tanhua, 2010). Some regions of the ocean are sources of atmospheric CO2, while others are sinks (Takahashi et al., 2009; Khatiwala et al., 2013). For the ETP, one study of global sea-air CO2 flux dynamics concluded it was a source (Takahashi et al., 2009), while another study using global repeat hydrography to estimate CO2 storage rates concluded that it was a sink (Khatiwala et al., 2013). However, regardless of whether the ETP is a source or sink of atmospheric CO2, there are biological processes beneath the surface that influence the production, distribution, and storage of organic carbon. The biological pump moves POC from the surface to deep ocean sediments through passive (e.g., sinking fecal pellets and ballasts) and active (e.g., vertical migrations by fish and zooplankton) transport (Eppley and Peterson, 1979; Ducklow et al., 2001; Henson et al., 2012; Davison et al., 2013). Additionally, carbon is stored in populations of large, long-lived vertebrates (e.g., apex predators), such as cetaceans and large fish; this is comparable to carbon being stored in large trees (Pershing et al., 2010). These important regulating services can be impacted by the use of provisioning services, particularly fisheries, which have the capacity to reduce populations of large consumer species and alter food web structure (Dayton et al., 1995; Jackson et al., 2001; Pauly et al., 2002). Such changes may decrease the amount of carbon stored in megafauna populations and alter the magnitude and efficiency of the biological pump, which is strongly influenced by food web structure (Ducklow et al., 2001; Pershing et al., 2010).
Biodiversity is important because of its link to ecosystem resilience, “the extent to which ecosystems can absorb recurrent natural and human perturbations and continue to regenerate without slowly degrading or unexpectedly flipping into alternate states” (Hughes et al., 2005). The role of biodiversity in ecosystem resilience has been a long-standing theme in ecology (Holling, 1973; Levin and Lubchenco, 2008). Theoretically, resilience is enhanced when functional groups comprise ecologically redundant species, each of which responds differently to environmental changes (Walker, 1995). If one species is depleted, another will assume the same functional role. Thus a higher number of species insures against ecosystem collapse in the face of environmental fluctuation (Yachi and Loreau, 1999; Loreau et al., 2001). Indeed, marine ecosystems with fewer species are often functionally compromised, and those with more species are more likely to have functional redundancy (Steneck et al., 2002, 2004; Bellwood et al., 2004; Hughes et al., 2005). For example, studies showed that species-rich kelp forests off the west coast of North America are more resilient than naturally species-poor kelp forests off the east coast (Steneck et al., 2002, 2004). However, a higher number of species would not confer resilience if the species had similar responses to external pressures, such as overfishing and pollution (Chapin et al., 1997; Folke et al., 2004; Hughes et al., 2005). Thus, diversity of functional groups, diversity of species in functional groups, and diversity within species and populations all appear to be critical for the production and resilience of ES (Chapin et al., 1997; Luck et al., 2003; Folke et al., 2004).
This case study provides an initial, conservative assessment of key ES provided by the ETP. It is limited in scope by the availability of data and therefore does not represent a complete summary of all ETP ES and their values. This study fills several gaps in the assessment of marine and coastal ES (Liquete et al., 2013) by focusing on an oceanic habitat, utilizing long-term datasets to produce an assessment, mapping the spatial distribution of ecological components, and concentrating on an area beyond Europe and North America (particularly the USA). Our results highlight the variety of ES provided by the ETP and offer a new perspective for a socio-ecological system that historically has had commercial tuna fisheries at its core. By improving our understanding of ETP ES, this study sets the stage for further analyses of trade-offs, which can inform decisions about resource management and biodiversity conservation.
Methods
Study Area
We define the oceanic ETP as the area seaward of the continental shelf, from the Americas west to approximately 150° longitude, and from the U.S.-Mexico border south to central Peru (Figure 1). It has an area of 21 million km2, includes waters of 12 nations and the oceanic commons, and roughly corresponds to the area managed by two regional fishery management bodies: the Inter-American Tropical Tuna Commission (IATTC) and the Agreement on the International Dolphin Conservation Program. The ETP has been among the world's most productive fishing grounds for yellowfin, bigeye, and skipjack tuna (Thunnus albacares, T. obesus, and Katsuwanus pelamis, respectively) for more than 50 years. The commercial tuna purse-seine fishery has a long history of negative incidental impacts on pantropical spotted and spinner dolphins (Stenella attenuata and S. longirostris, respectively; Wade et al., 2007); the western boundary of the ETP study area (Figure 1) is the western range limit for the impacted stocks of these species. Because of the magnitude of the commercial fishery and the historical impacts on dolphin populations, the ETP has been well-studied (Figure 1) and is relatively data rich compared to most other oceanic systems (Ballance et al., 2006 and references therein; Wade et al., 2007; Gerrodette et al., 2012).
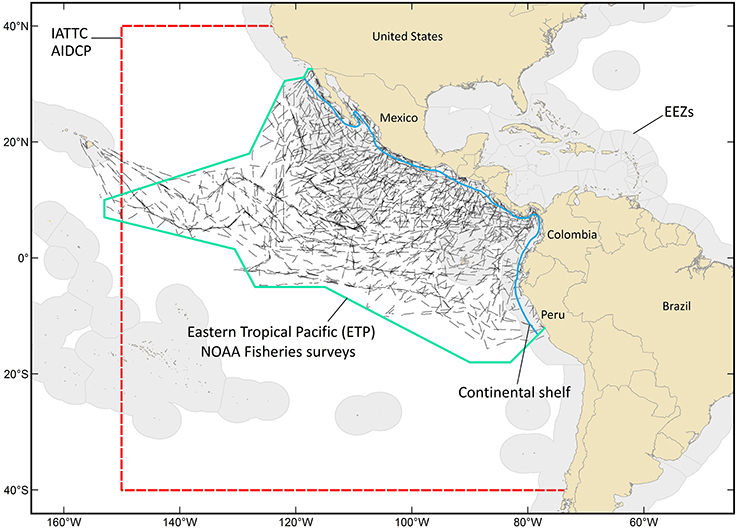
Figure 1. The oceanic eastern tropical Pacific (ETP) is defined as the area seaward of the continental shelf, from the Americas west to approximately 150° longitude, and from the U.S.-Mexico border south to central Peru. This area is roughly 21 million km2, includes waters of 12 nations (Exclusive Economic Zones (EEZs) are shaded light gray) and the oceanic commons, and roughly corresponds to the area managed by two regional fishery management bodies: the Inter-American Tropical Tuna Commission (IATTC) and the Agreement on the International Dolphin Conservation Program (AIDCP). The area managed by the IATTC is outlined with a red hashed line; this is also the relevant area for AIDCP. The black segmented lines are ship tracklines from NOAA Fisheries surveys (1986–1990, 1998–2000, 2003, 2006). These surveys were conducted to assess populations of dolphins historically impacted by the tuna purse-seine fishery.
Provisioning Services: Commercial Fisheries
The IATTC maintains an online source of publicly available data on commercial fisheries (defined here to exclude local, coastal fisheries) catches in the IATTC Convention area (Figure 1). These data are compiled from vessel logbooks, observer data, and a variety of other sources, and are considered the best scientific estimates of annual catch. Time series data range from 1918 through 2011, with data beginning in different years for different species groups. Retained catches (in mt, excludes discards for consistency) are aggregated by year, species group, vessel flag (country), and gear type. There are seven different gear types: purse-seine, longline, pole-and-line, troll, harpoon, gillnet, and hook-and-line. Using these data, we calculated: (1) annual catch by species group (listed below), with all gear types and vessel flags combined, (2) annual catch by vessel flag, with all species groups and gear types combined, and (3) percentage of total catch for each gear type, across all years, species groups, and vessel flags. We will refer to the fished species using their common names; Latin names are provided in Table 1.
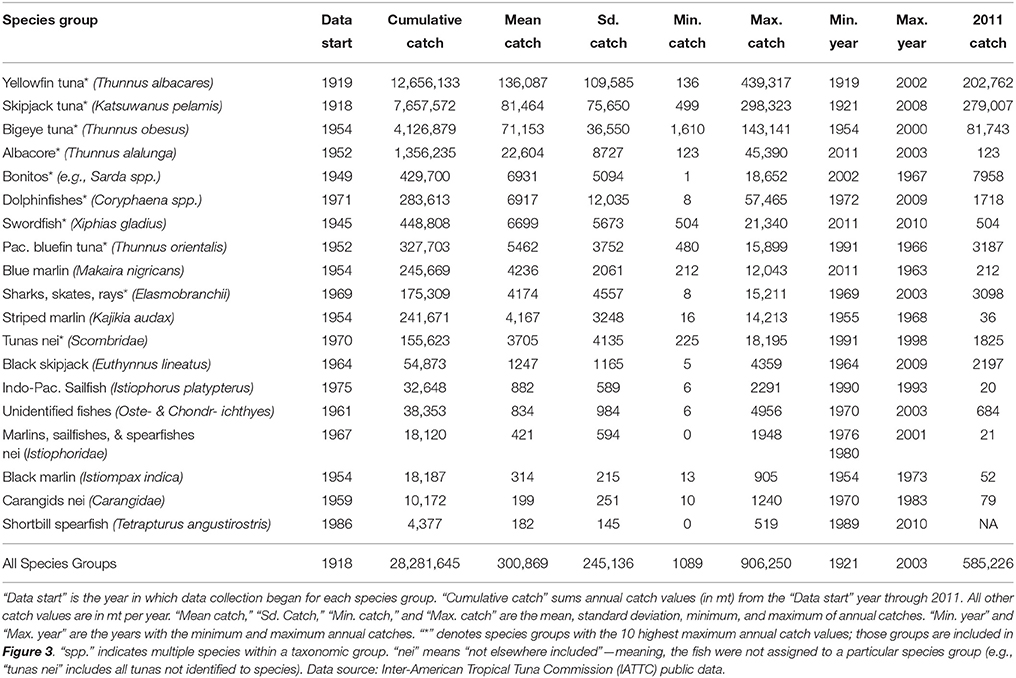
Table 1. Summary of commercial fisheries catches in the eastern tropical Pacific (ETP).
The Office of Science and Technology of NOAA Fisheries maintains an online database of foreign trade fisheries statistics. For fish imported to the U.S., data on total weight imported (in kilograms) and price paid (USD) are aggregated by year, taxon (species group), product type, and export country. Data were available for 1975–2010 on U.S. imports from IATTC member countries (Colombia, Costa Rica, Ecuador, El Salvador, France, Guatemala, Japan, Mexico, Nicaragua, Panama, Peru, South Korea, Spain, Vanuatu, and Venezuela). We excluded countries located outside Latin America (France, Japan, South Korea, Spain, and Vanuatu) because the data include all fish imported from each country, regardless of where the fish were caught, and we wanted to focus exclusively on fish caught in the ETP (Figure 1). For Latin American countries belonging to both the IATTC and the International Commission for the Conservation of Atlantic Tunas (Mexico, Guatemala, Nicaragua, Panama, and Venezuela), we examined fishery profiles from the Food and Agriculture Organization of the United Nations to confirm that the large majority of fish are caught in the Pacific rather than the Atlantic (roughly 78–100% of each country's tuna purse-seiners operated in the Pacific). Thus, in order to use the U.S. imports data to calculate prices, we made the simplifying assumption that all fish imported from those countries were caught in the ETP; this assumption is benign if the U.S. import price for a product is the same regardless of whether the fish were caught in the Atlantic or the Pacific. We focused on the top 10 species groups in terms of maximum annual catch (from the IATTC dataset, Table 1). Those species groups were as follows, with a breakdown of product types by total weight imported for each: (1) yellowfin tuna—83% whole fresh/frozen, 14% fresh, 3% eviscerated/prepared fresh/frozen, (2) skipjack tuna—100% fresh/frozen, (3) bigeye tuna—99% fresh, 1% frozen, (4) albacore tuna—69% canned, 31% fresh/frozen, (5) bonitos—100% canned, (6) dolphinfish—89% frozen filets, 11% fresh, (7) swordfish—94% fresh/frozen, 6% prepared fresh/frozen meats, (8) Pacific bluefin tuna—100% fresh/frozen, (9) sharks/rays—91% fresh/frozen, 9% dried/oil, and (10) tunas other—62% canned, 38% other prepared/frozen meats.
For each species group, we calculated an average price per mt for each year (1975–2010). Though ex-vessel fish prices (i.e., prices paid to vessels for landings) would be the ideal prices to use, because these were not available, we used the U.S. import prices, which add value to ex-vessel prices to the extent the fish are processed and transported. This approach provided a U.S.-centric view; however, such time series data are unique and to our knowledge, these were the best available data for this system (see Discussion for further caveats). Applying the calculated average prices to total annual catches, we estimated the total U.S. import price value (“catch value”) for each species group for all years. Total catch values were adjusted for inflation using the online U.S. Inflation Calculator, which is based on U.S. government consumer price index data. All values are presented in 2010 USD, allowing for comparisons across years. For each species group, and for all 10 species groups combined, we summarized annual catch and catch value, and investigated trends using linear regressions and LOESS smoothed regressions (Cleveland and Devlin, 1988). We examined trends in catch value pre- and post-1990. This break corresponds to the introduction of the U.S. “dolphin-safe” label, which was created in response to historically high mortality of dolphins in the ETP purse-seine fishery (Wade et al., 2007). The mortality was caused by the common method of chasing and encircling dolphins in order to capture large tunas swimming below them (Wade et al., 2007). The “dolphin-safe” label signals to consumers that dolphins were not set upon during the fishing trip that produced the tuna (Wade et al., 2007).
Focusing on the purse-seine fishery for yellowfin tuna (the gear type and species, respectively, with the highest cumulative catch for 1918–2011), we mapped in a spatially-explicit way cumulative effort and catch for a 20 year period (1986–2006). Effort was measured as the number of purse-seine sets on 3 different targets (dolphin schools, floating objects, and schools of tuna unassociated with objects or dolphins); catch was measured as mt of fish retained. These data were provided by IATTC through a special agreement. The spatial resolution was 2° latitude by 2° longitude for most of the data. When effort in a grid cell represented fewer than 3 vessels or was solely within one country's Exclusive Economic Zone (EEZ), the data were provided at a resolution of 5° to maintain confidentiality. For 5° by 5° cells, we divided catch and effort by 6.25 (the number of 2° by 2° cells in one 5° by 5° cell) to standardize values to the 2° by 2° cells. We binned the catch and effort data into 5 quantitative categories for mapping purposes.
Data on the port-specific geographical distribution of purse-seine fishery landings in 2010–2011 were provided by IATTC for this study. Species groups included yellowfin, skipjack, bigeye, albacore, black skipjack, bullet, frigate, and Pacific bluefin tunas, eastern Pacific bonito, striped bonito, dolphinfishes, and tunas not elsewhere included (i.e., tunas that were not assigned to the above species groups). We mapped the 2010–2011 mean annual percent of total landings for each port. For each country, the data also included the percentage of landings brought to shore by vessels carrying the flag of that country. From this, we determined the proportion of landings in each country that was supplied by foreign vessels.
Regulating Services: Carbon Storage
This service, in principle, involves three main processes: (i) the geophysical transport of atmospheric CO2 into the ocean (a flow, in economic terms), (ii) the biological transport of carbon (C) from the surface layer to deep ocean sediments (also a flow), and (iii) the storage of C in populations of marine animals (multiple stocks). Our approach to investigating these processes and their associated values was as follows. First, we ignored geophysical transport because it is not directly affected by human activities in the ocean (i.e., there are no trade-offs between alternative management policies) and focused instead on the latter two, which can be affected by human uses of ocean resources (e.g., commercial fishing). Second, for biological transport, we estimated the quantity and value of the flow for the entire ETP; however, because the impacts of humans on this service are complex and poorly understood, we did not attempt to estimate any changes in C associated with human activities. It is worth noting that if human activities have decreased the amount of carbon exported annually, our calculations here likely underestimate the true potential value of the biological pump. Third, to provide examples of carbon values that are impacted by human uses in a more identifiable way, we investigated: (i) the reduction in the stock of C in fish populations exploited by the ETP purse-seine fishery and (ii) the reduction in the stock of C in dolphin populations as a result of historical bycatch in the same fishery. For any population, the best estimate of a fisheries-induced reduction in standing stock biomass is the difference between the biological carrying capacity (the equilibrium biomass that would be achieved without fishing) and the standing stock biomass at the current harvest level (with the assumption that the harvest level would continue in perpetuity). While we had data to calculate this difference for the dolphin populations, we did not have data to do so for the multiple targeted fish species. Therefore, we examined annual fishery biomass removals (a flow) as a first-order approximation of the reduction in the biomass of the fish stocks as a result of fishing. Management policies to rebuild fisheries-depleted stocks of dolphins or fish would include additional benefits of increasing carbon storage and its value by the amounts estimated here.
We estimated the amount of C biologically exported annually from the surface to the deep ocean in the ETP, and the potential market value of this carbon. Emerson et al. (1997) estimated that 24 g of C m−2 yr−1 are exported from the surface to the deep ocean in an oligotrophic (nutrient poor) area in the Pacific Ocean. Portions of the ETP, notably, the Equatorial Cold Tongue and the Costa Rica Dome, are characterized by high nutrient concentrations relative to oligotrophic waters (Fiedler and Talley, 2006), suggesting export is higher in the ETP. Indeed, mean export for the region has been modeled as 38 g C m−2 yr−1 (Schlitzer, 2004). However, we used 24 g C m−2 yr−1 as a conservative estimate for our calculations. We multiplied this value by 2.1 × 10¹³ m2 (the estimated surface of the ETP study area) to estimate the amount of C exported annually. We converted this value to number of CO2 trading units (1 trading unit = 1 mt of CO2 = 0.2729 mt of C + 0.7271 mt of O2). To estimate the potential market value of this C, we used a range of prices from the European Union Allowances Emissions Trading System, the largest carbon market in the world in 2014 (World Bank, 2014). We used an average 2013 price of $7 mt−1 (with $5 and $9 as lower and upper limits) to estimate potential value for that year (USIWG, 2013; World Bank, 2014). For a potential future scenario, we used $35 mt−1, an estimate of the price required to achieve climate stabilization goals and pay for climate-change related damages (USIWG, 2013; World Bank, 2014). This price was also observed in 2008 before the major economic downturn (Capoor and Ambrosi, 2009; Newell et al., 2013, 2014).
The tuna purse-seine fishery has impacted the amount of carbon stored in populations of large vertebrates, specifically populations of fish that are targeted directly or indirectly affected through bycatch (Gerrodette et al., 2012) and populations of dolphins that were historically depleted through incidental mortality (Wade et al., 2007). For the fish populations, we estimated the amount of C that is removed annually by applying a total body carbon content of 11.5% (Czamanski et al., 2011) to the annual purse-seine fishery biomass removals of 543,533 mt (Gerrodette et al., 2012). As noted above, we used the annual biomass removals here to provide an order-of-magnitude estimate of the reduction in standing stock biomass for the fished populations, as we do not know the true extent to which fishing has reduced the various fish stocks. After converting from mt of C to equivalent CO2 trading units, we applied the same range of market prices as above. For the depleted dolphin populations, we calculated the difference between the estimated pre-exploitation population size for 1958 (Wade et al., 2007) and the most recent population estimate for 2006 (Gerrodette et al., 2008). Between 1958 and 2006, the population of northeastern offshore spotted dolphins decreased by 76% from 3.6 million individuals (Wade et al., 2007) to 857,884 individuals (Gerrodette et al., 2008). The eastern spinner dolphin population decreased by 41% from 1.8 million individuals (Wade et al., 2007) to 1,062,879 individuals (Gerrodette et al., 2008). To calculate lost standing stock biomass (mt), we multiplied those differences in population size by a mean body mass of 65.4 kg and 52.5 kg for northeastern offshore spotted and eastern spinner dolphins, respectively (Trites and Pauly, 1998; Perrin et al., 2005). We applied a total body carbon content of 25% (based on an estimate for humans by Wang and Pierson, 2010 as a mammalian approximation) to that biomass, converted it to equivalent CO2 trading units, and applied a market price of CO2 to estimate the potential market value of the lost carbon.
Cultural Services: Recreational Fishing
The Billfish Foundation (TBF) exists to promote the conservation of billfish (marlins, sailfish, and swordfish) and associated species (e.g., tunas), healthy oceans, and a sustainable recreational fishing industry that targets these species. TBF lobbies for conservation-based management of both commercial fisheries and recreational fisheries as part of its strategy. Recently, TBF released a series of sport fishing socio-economic studies for three locations in Latin America: Los Cabos (Baja California Sur, Mexico), Costa Rica, and Panama (Southwick et al., 2008, 2013; Jimenez et al., 2010). The purpose of those studies was to demonstrate the economic value of sport fishing to local economies. This effort, which included surveys of tourists at airports, anglers, hotels, restaurants, and local businesses, appears to be the first major attempt to quantify the economic impact of sport fishing in Latin America. The reports also aim to understand the factors appealing to international anglers traveling to those locations (mostly from the U.S.). We believe these reports, with their focus on highly migratory pelagic species, contain uniquely relevant information for understanding different uses of ETP ES. We assume they represent areas with high (if not the highest) levels of sport fishing in the ETP. We note that the sequence of the studies (Los Cabos, Costa Rica, Panama) may mimic the progression of development in the industry from north to south. Focusing solely on fishing trip expenditures as direct economic impacts (e.g., retail sales including charter boats, lodging, food, transportation, tackle, etc.) and excluding indirect or induced economic impacts (e.g., jobs, taxes, multipliers, etc.), we summarized the important findings across the three reports as an example of key cultural services provided by this region. Due to the limited geographic scope of these data, the summarized expenditures provide only a minimum estimate (an underestimate) of total expenditures in the region. We did not attempt to scale these numbers up or apply them to other sport fishing locations in the region, as we lacked sufficient data (e.g., number of charter vessels, trips, visitors, hotels, etc.) to do so.
Supporting Services: Biodiversity/Density
The Southwest Fisheries Science Center (NOAA Fisheries) conducted extensive vessel-based surveys of the ETP between July and December in 1986–1990, 1998–2000, 2003, and 2006. Most effort occurred between August and November. Trained biologists collected data on cetaceans (whales, dolphins, and porpoises), seabirds, marine turtles, and ichthyoplankton (includes larval fishes, squids, and octopuses), including the species, number of individuals, and location of all observed or collected animals. Cetacean data were collected using standard visual line-transect survey methods (Gerrodette and Forcada, 2005) in all 10 survey years. Ichthyoplankton samples were collected daily using manta net tows (Vilchis et al., 2009) from 1987 onward. Seabird data were collected using standard visual strip-transect survey methods (Ballance, 2007) starting in 1988. Marine turtle data were collected during the cetacean line-transect surveys from 1998 onward.
To investigate biodiversity patterns for cetaceans, seabirds, and ichthyoplankton, we calculated species richness (the total number of species observed during all years combined) using a spatial resolution of 2° by 2°. Sightings or specimens identified to order, family, or genus only counted toward the species tally if a species within that higher taxon had not already been observed in that cell. We used the same spatial grid for turtles, but we calculated sightings density rather than species richness because nearly all sightings were of a single species, olive ridley (Lepidochelys olivacea). Survey effort (the number of search hours for cetaceans, seabirds, and turtles, and total volume of water filtered by net tows for ichthyoplankton) was also calculated per grid cell. Our calculations were limited to the four taxa for which we had spatially explicit long-term survey data, making them conservative (minimum) estimates for the entire ETP ecosystem. To provide conservation context for cetaceans, seabirds, and marine turtles, we compared the total number of species that occur in the ETP to the global number of species for each taxon, and we determined the conservation status for those species using the Red List of Threatened Species of the International Union for the Conservation of Nature (IUCN, 2012). For marine turtles, the number of species was derived from IUCN distribution maps.
Results
Commercial Fisheries
Commercial fisheries operating in the ETP from 1918 to 2011 caught an estimated total of 28,281,645 mt (Table 1). Of this cumulative catch, 65% was captured using purse-seines, 18% by longlines, 9% with pole-and-line methods, and the remaining 8% with trolls, harpoons, gillnets, and hook-and-line methods. In 2011, purse-seines accounted for 95% of total catch. Annual catch ranged from 1089 to 906,250 mt (mean = 300,869 mt, CV = 82%) across all years, with an increasing trend over time and high values in recent years that are often double the mean (e.g., 585,226 mt in 2011; Table 1, Figures 2, 3). For 1975–1990, mean annual catch was 433,811 mt (range: 268,796–524,849 mt, CV = 17%); for 1991–2010 it was 632,596 mt (range: 459,078–891,019 mt, CV = 19%); and for 1975-2010 it was 544,247 mt (range: 268,796–891,019 mt, CV = 27%). Yellowfin tuna was by far the top species in terms of cumulative catch over time, mean annual catch, and maximum annual catch (Table 1). It also had the largest range of annual catch amounts, with a minimum of 136 mt in 1919 and a maximum of 439,317 mt in 2002. Skipjack tuna had the next highest cumulative catch and mean annual catch, both of which were roughly 60% of those amounts for yellowfin tuna. In 2011, the skipjack catch exceeded that of all other species. Bigeye tuna was the third most important species, with cumulative and mean annual catches 33 and 52% of the yellowfin tuna amounts. Catch data for skipjack and yellowfin tuna date to 1918–1919, while data for bigeye tuna only date back to 1954. Together, these 3 species comprise 86% of the cumulative catch.
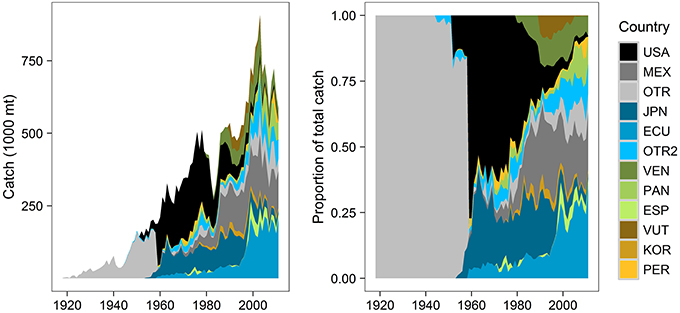
Figure 2. Distribution of annual commercial fisheries catch (mt) by vessel flags (countries), for all species groups and gear types combined (1918–2011). Catch by country data are more detailed after the late 1950s, when the purse-seine fishery began and total fishing effort increased. The top 10 vessel flags by cumulative catch are shown (USA, United States; MEX, Mexico; JPN, Japan; ECU, Ecuador; VEN, Venezuela; PAN, Panama; ESP, Spain; VUT, Vanuatu; KOR, Korea; PER, Peru). OTR pools data from various countries to protect the identity of individual vessels or companies (different groupings each year, aggregated by the IATTC). OTR2 groups 17 countries not included in the top 10 list (Colombia, Taiwan, Chile, Canada, Costa Rica, Nicaragua, French Polynesia, China, Netherlands, Belize, Bermuda, El Salvador, Honduras, Guatemala, Cayman Islands, Senegal, Portugal). Data source: IATTC public data.
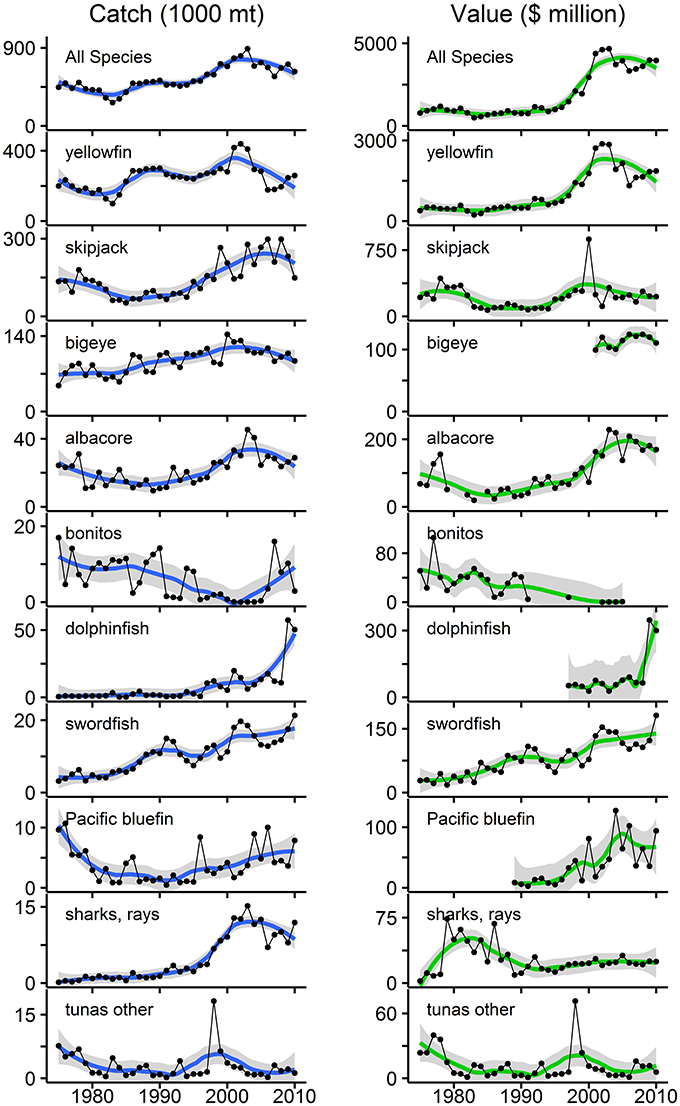
Figure 3. Annual catch and estimated catch value (using U.S. import prices) for the top 10 commercially fished species groups in the eastern tropical Pacific (ETP) for 1975–2010. These 10 groups rank highest in terms of maximum annual catch (Table 1). “Tunas other” corresponds to “tunas nei” from Table 1 and represents all tunas not assigned to individual species groups. All gear types and fishing nations are represented. Left panels are annual catch in mt; right panels are estimated catch value in millions of 2010 U.S. dollars (adjusted for inflation). Note: the scales for catch and value vary by species group. Data points are connected with lines for sequential years; breaks appear where no data were available. LOESS smoothed trend lines are displayed with shaded 95% confidence intervals. The top panel is the sum of the 10 species groups. Over 35 years, cumulative catch and catch value were 19.6 million mt and $67.4 billion, respectively. Mean annual catch was 544,247 mt (range: 268,796–891,019 mt; sd: 144,698 mt). Mean annual catch value was $1.9 billion (range: $487 million–$4.7 billion; sd: $1.4 billion) for the entire period. Data sources: IATTC public data and NOAA Fisheries public data.
Understanding stakeholders (who they are and their degree of investment) is an important component of EBM. Twenty-seven countries fished (legally, based on IATTC data) in the ETP from 1918 to 2011, each with a unique trend in annual catch (Figure 2). Countries with the highest percentage of cumulative catch across all years included the U.S. (23%), Mexico (14%), Japan (13%), Ecuador (13%), Venezuela (6%), and Panama (4%). U.S. catch increased notably from the 1950s (Figure 2A), peaked in the late 1970s when the U.S. captured 60% of the total catch (Figure 2B), and tapered to nearly zero in 2011. Mexico's catch gradually increased from the 1960s to the 1980s and remained relatively stable thereafter (Figure 2A); it was 22% of total catch in 2011 (Figure 2B). Japan's catch was fairly consistent from the late 1950s through the early 1990s (Figure 2A), but decreased in the 2000s and only represented 2% of the total in 2011 (Figure 2B). Ecuador's catch slowly increased from the 1960s onward (Figure 2A); in 2011, it captured the largest portion of total catch (37%) (Figure 2B). Venezuela began fishing in the early 1980s, increased its catch into the 1990s (Figure 2A), and acquired an 8% share of total catch in 2011 (Figure 2B). Panama's relatively small fleet appeared in the 1970s, grew in the 2000s (Figure 2A), and claimed 10% of total catch in 2011 (Figure 2B). Colombia is represented in the “Other” categories in Figure 2 because it only caught 1% of the cumulative catch; however, in 2011, its portion of total catch was 8%. Spain, Vanuatu, Korea, Peru, Taiwan, and Chile each caught 1–2% of the cumulative total. Spain, Korea, Nicaragua, and Taiwan each caught 1–2% of the 2011 total.
Increases (p < 0.01) occurred in both annual catch and catch value from 1975 to 2010 for yellowfin, albacore, dolphinfish, swordfish, and the “all species” group (Figure 3). Increases in catch and catch value were notably disproportionate for yellowfin tuna (only a 30% increase in mean annual catch, but a 239% increase in mean annual catch value after 1990), and for “all species” (46% increase in catch and 226% increase in catch value after 1990). There was a significant increase (p < 0.001) in the mean annual price for yellowfin tuna over time, which was $2222 mt−1 for 1975–1990 and $5492 mt−1 for 1991–2010. For “all species,” mean annual price was $3111 mt−1 across all years (range: $1431–$6339 mt−1, CV = 53%), but increased from $1932 mt−1 for 1975–1990 to $4055 mt−1 for 1991–2010. Mean annual catch value increased from $830 million for 1975–1990 to $2.7 billion for 1991–2010, and was $1.9 billion for the entire period (range: $487 million–$4.7 billion, CV = 76%). Trends for “all species” largely reflect trends for yellowfin tuna, as it comprises 46% of the cumulative catch in this period (Figure 3).
Trends in annual catch and catch value for the remaining species groups varied. Bonitos were the only group with significant decreases (p < 0.01) in both annual catch and catch value (Figure 3). There was no significant trend in catch for bluefin tuna, but value significantly increased (p < 0.001) (Figure 3) due to an increase (p < 0.10) in the price (mean of $5424 mt−1 for 1989–1990 and $10,853 mt−1 for 1991–2010). For skipjack, bigeye, and elasmobranchs, annual catch increased significantly (p < 0.001), but there was no significant trend in value (Figure 3), due to significant decreases (p < 0.01) in the price for skipjack tuna (mean of $1836 mt−1 for 1975–1990 and $1355 mt−1 for 1991–2010) and elasmobranchs (mean of $33,026 mt−1 for 1975–1990 and $3820 mt−1 for 1991–2010). The price for bigeye tuna did significantly increase (p < 0.01), but a decreasing trend in catch over the years for which we had price data (2001–2010) probably canceled this effect, leading to the absence of significant change in the total catch value. There were no significant trends for the “tunas—other” group.
Analysis of catch and price trends indicated ordinary demand-supply dynamics, with various scenarios apparent across the species groups. Note that the following results may only reflect the U.S. market for imports and not necessarily markets in Latin America or Europe. First, an increasing supply of fish was accompanied by: (i) a decreasing price for skipjack and elasmobranchs, indicating that supply was increasing at a higher rate than demand, (ii) an increasing price for yellowfin, bigeye, albacore, and dolphinfish, indicating that demand was increasing at a higher rate than supply, and (iii) no change in price for swordfish and all species combined, suggesting that either (a) demand was increasing at the same rate as supply, maintaining a constant equilibrium price, or (b) long-run demand was perfectly elastic and thus equilibrium price was unaffected by changes in supply. Second, a decreasing supply of fish only occurred for bonitos, and was associated with no change in price, indicating either (a) demand was decreasing at the same rate as supply, or (b) long-run demand was perfectly elastic. Finally, an unchanging supply of fish was associated with: (i) an increasing price for bluefin, suggesting an increasing demand, and (ii) no change in price for “tunas—other,” indicating no change in demand.
Spatial patterns for purse-seine fishery effort and yellowfin tuna catch were slightly different (Figure 4). The highest concentrations of catch occurred between the southern tip of Baja California and Mazatlan, near the Costa Rica Dome (near 90°W, 9°N), and along thermocline ridge. Concentrations of effort were also highest in those regions but had a broader geographic extent and a clearer gradient of high values in the east and low values in the west.
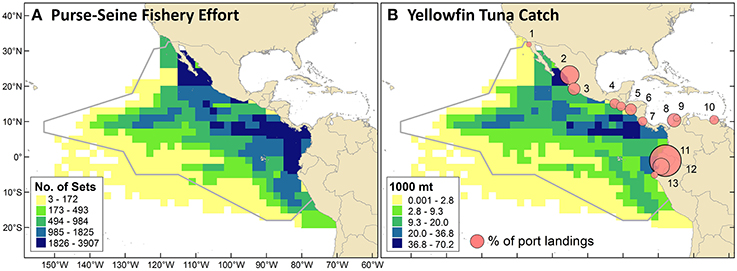
Figure 4. (A) Commercial purse-seine fishery effort as the cumulative number of sets from 1986 through 2006. (B) Yellowfin tuna catch (cumulative mt) in the purse-seine fishery over the same period. Proportional circles depict the percentage of annual purse-seine landings (all species) brought to different ports in 2010–2011. Landings were distributed as follows, with numbers corresponding to map locations: (1) Ensenada, Mexico (1%); (2) Mazatlan, Mexico (14%); (3) Manzanillo, Mexico (6%); (4) Puerto Chiapas, Mexico (4%); (5) Puerto Quetzal, Guatemala (3%); (6) La Union, El Salvador (5%); (7) Puntarenas, Costa Rica (3%); (8) Cartagena, Colombia (7%); (9) Barranquilla, Colombia (2%); (10) Puerto Sucre, Venezuela (3%); (11) Manta, Ecuador (40%); (12) Posorja, Ecuador (11%); (13) Paita, Peru (2%).
ETP purse-seine fishery landings in 2010–2011 were distributed across ports in the following countries (Figure 4B): Ecuador (51%), Mexico (25%), Colombia (9%), El Salvador (5%), Guatemala (3%), Costa Rica (3%), Venezuela (3%), and Peru (2%). Differences between 2010 and 2011 percentages were 0–2% for all port locations except Manta, Ecuador, where the percentage of total landings increased from 36 to 44%. The 2010-2011 mean percentages of landings that were brought to shore by vessels with the port's national flag were: Venezuela (100%), U.S. (100%), Mexico (96%), Colombia (75%), El Salvador (68%), Ecuador (62%), Guatemala (6%), Costa Rica (0%), and Peru (0%). In reverse order, this ranked list indicates the importance of foreign vessels in landing fish in these ports (i.e., landings in Peru were all from foreign vessels, whereas landings in Venezuela were all from domestic vessels). These percentages for each country varied 0–6% between years, with the exception of a 14% decrease for Ecuador (i.e., a higher percentage of landings by foreign vessels in 2011). For the U.S., there were only data for 2011.
Carbon Storage
Our conservative estimate for the amount of C exported from the surface to the deep ocean in the ETP was 5.0 × 10¹⁴ g or 5.0 × 10⁸ mt of C yr−1. This was equivalent to 1.8 × 10⁹ trading units of CO2, which had a total carbon value of $12.9 billion yr−1 (range: $9.2–$16.6 billion yr−1). At the highest carbon price of $35 mt−1, the ETP's export service would be worth $64.7 billion yr−1.
The 2.74 million northeastern offshore spotted dolphins lost from the population represented a total biomass of 179,334 mt, of which roughly 44,834 mt was C. This C amount was equivalent to 164,286 mt of CO2 trading units, with a cumulative (not annual) total value of $1,398,161 (range: $998,687–$1,797,636). Spreading this value across the 2.74 million dolphins yields a potential carbon storage value per dolphin of $0.42 (range: $0.30–$0.54). At a carbon price of $35 mt−1, the value of the lost portion of the population would be $5,750,003, or $2.10 per dolphin.
The reduction of the eastern spinner dolphin population by 737,121 individuals represented a loss of 38,699 mt total and 9675 mt of C from the system. This was equivalent to 35,451 mt of CO2 trading units worth a cumulative total of $248,160 (range: $177,257–$319,063) or $0.34 per dolphin (range: $0.24–$0.43). The value would be $1,240,802, or $1.68 per dolphin, if the carbon price were $35 mt−1.
Total purse-seine fishery removals of 543,533 mt yr−1 contained 62,506 mt yr−1 of C. This was equivalent to 229,045 mt of CO2 trading units with a potential value of $1,603,313 (range: $1,145,223–$2,061,402)—these numbers were derived from annual estimates but represent order-of-magnitude estimates for the total reduction in fish standing stock biomass caused by the fishery. Spreading this value across the 543,533 mt of fish caught yields a value of $2.95 mt−1 of fish (range: $2.11–$3.79). At $35 mt−1 for CO2, the potential carbon value for the fishery removals would be $8,016,564, or $14.75 mt−1 of fish.
Recreational Fishing
Expenditures of $1.2 billion yr−1 for three popular locations (Table 2) suggest total expenditures for all ETP locations may be similar to the commercial fisheries catch value of $2.7 billion yr−1. In Los Cabos, visitors who fished were estimated to provide 24.1% of the total dollars injected into the local economy by tourism (Table 2). The surveys identified the ETP as an important area for stakeholders in the sport fishing community. Given the choice of four locations in the Atlantic (Bahamas and South Florida) and Pacific (Cabo San Lucas in Mexico and Golfo de Papagayo in Costa Rica), 46% of anglers stated a preference for fishing in the Pacific locations if given the choice (35% preferred the Atlantic locations and 19% had no preference). Anglers who had fished in Los Cabos revealed their perception that commercial fishing is detrimental to the quality of their experience. A large majority (88%) said they would be less likely to return to Los Cabos if commercial fishing for billfish increased, and more likely to return if commercial restrictions or bans were implemented.
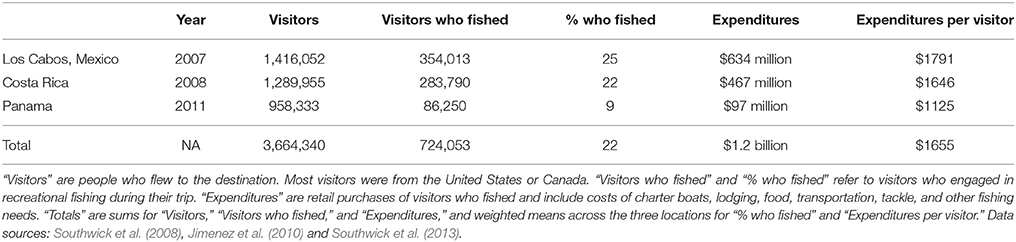
Table 2. Summary data from economic studies of sport fishing in three popular Latin American fishing destinations.
Biodiversity/Density
Thirty of the world's 89 cetacean species (Jefferson et al., 2015) occur in the ETP, and 17% of those are threatened with extinction to some degree (Table 3). Cetacean survey effort ranged from 0.2 to 109.2 h (0–9 survey days) per grid cell (mean = 31.7, CV = 69%), with (by design) the highest levels of effort in the core of the ETP and the lowest levels near the western perimeter (Figure 5A). Species richness ranged from 1 to 16 species per 2° by 2° grid cell (mean = 6.6, CV = 49%), excluding cells with no cetacean sightings (Figure 5B). Regions of high richness (12–16 species per cell) occurred off the southern of the tip of Baja California (near 109°W, 23°N), around the Costa Rica Dome (near 90°W, 9°N), and in the Panama Bight (near 81°W, 8°N). Intermediate richness (4–11 species per cell) was observed in the majority of remaining cells throughout the ETP (Figure 5B). Qualitatively, patterns of richness did not simply reflect patterns of effort (Figures 5A,B).
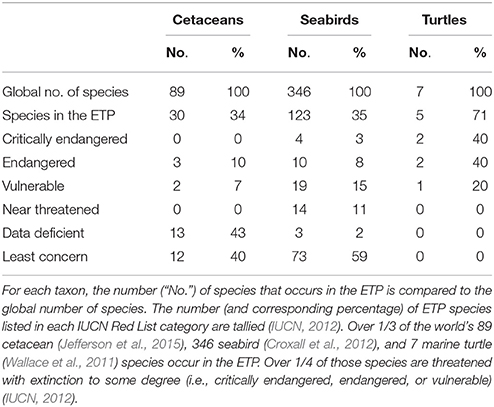
Table 3. Summary of cetacean, seabird, and marine turtle species and conservation status for the eastern tropical Pacific (ETP).
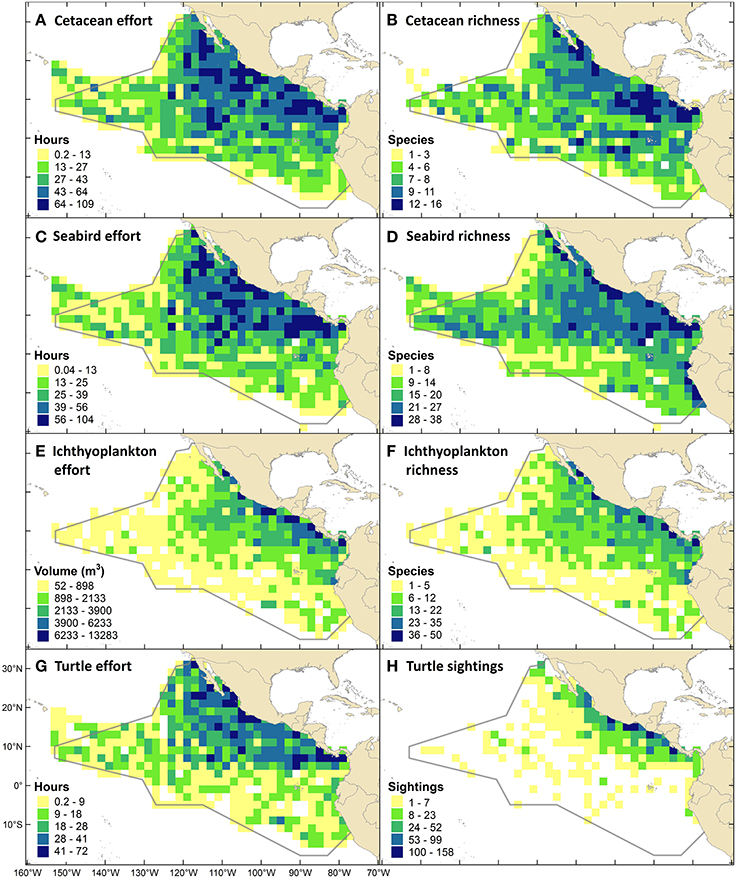
Figure 5. Survey effort, species richness, and sightings density maps using data from Southwest Fisheries Science Center (NOAA Fisheries) ship-based surveys conducted from August through November in 1986-1990, 1998-2000, 2003, 2006. (A) Cetacean line-transect survey effort (all 10 survey years). (B) Cetacean species richness. (C) Seabird strip-transect survey effort (8 years, from 1988). (D) Seabird species richness. (E) Sampling effort for ichthyoplankton: larval fishes, squids and octopuses (9 years, from 1987). (F) Ichthyoplankton species richness. (G) Marine turtle line-transect effort (5 years, from 1998). (H) Sightings density for marine turtles, which were almost exclusively olive ridleys.
Of the world's 346 seabird species (Croxall et al., 2012), 35% occur in the ETP, and 26% of those are threatened with extinction to some degree (Table 3). Seabird survey effort ranged from 0.04 to 103.5 h (0–8.6 survey days) per grid cell (mean = 27.5, CV = 71%), with patterns nearly identical to those for cetacean effort (Figure 5C). Species richness ranged from 1 to 38 species per grid cell (mean = 15.8, CV = 48%), excluding cells with no seabird sightings (Figure 5D). Richness was generally highest within the EEZs of the bordering countries (i.e., within 200 nm, or within 2 cells, from the shoreline), and along the 10°N thermocline ridge (Figure 5D).
Ichthyoplankton sampling effort ranged from 52 to 13,283 m3 per grid cell (mean = 1449, CV = 124%), and followed an east-west gradient with higher effort near the coasts (Figure 5E). Species richness ranged from 1 to 50 species per grid cell (mean = 8.5, CV = 94%), excluding cells with no specimens collected (Figure 5F).
Five of the world's seven marine turtle species occur in the ETP, and all are threatened with extinction to some degree (Table 3). Marine turtle survey effort ranged from 0.2 to 72.2 h (0–6.0 survey days) per grid cell (mean = 16.6, CV = 81%), with similar patterns to those for cetacean and seabird effort but with fewer areas of high and intermediate effort due to fewer years of data (Figure 5G). Sightings density (mostly olive ridleys) ranged from 1 to 158 sightings per grid cell (mean = 14.6, CV = 189%), excluding cells with no turtle sightings (Figure 5H). The highest density of sightings occurred in EEZ waters off southern Mexico (Guerrero and Oaxaca), Guatemala, and Costa Rica (Figure 5H).
Discussion
A New Perspective for an Old System
Our study provides a different perspective—one that is central to EBM—for an oceanic ecosystem with historically productive commercial fisheries (Figure 6). Our analysis of long-term datasets and our theoretical examples provide valuable insights into ETP ES. First, commercial fisheries are a widely recognized, important provisioning service that is geographically extensive, heavily utilized, and data-rich; both total catch and catch value increased over the last few decades. Fisheries stakeholders have changed over time, but most recently, the majority of fish were caught by and landed in Latin American countries bordering the ETP. Second, carbon storage is a major regulating service that has received little attention but may rival commercial fisheries catch in potential market value. Our value estimate for the annual flow of carbon to the deep ocean (a loose minimum) was higher than our value estimate for the annual commercial fisheries catch flow, though the two had the same order of magnitude (billions of USD). The stock of carbon lost from just two fishery-depleted dolphin populations was worth millions of USD (as was the estimated reduction in carbon stored in harvested fish populations), suggesting examination of other depleted populations (e.g., large whales, fish, sharks, or turtles) may be worthwhile. Third, recreational fishing is a cultural service that attracts nearly a million foreign visitors annually (at least) to popular destinations to target oceanic species. The minimum estimate of local trip expenditures for these visitors had the same order of magnitude as the commercial fisheries catch value (billions of USD). These two measures are inherently different (i.e., they capture different proportions of total economic value and were valued in different currencies) and thus are not directly comparable; however, these results warrant further investigation for a proper comparison. Fourth, the ETP contains high levels of biodiversity, an important but chronically undervalued supporting service. Over one-third of the world's cetacean, seabird, and marine turtle species occur in the ETP. Our maps of species richness for cetaceans, seabirds, and ichthyoplankton (and sightings density for turtles) show the geographic extent of these taxa and highlight areas with the highest diversity or use. Finally, a geographic comparison of our results reveals overlap in areas with the highest levels of commercial fisheries catch, biodiversity, and recreational fishing. There are potential trade-offs among alternative uses of these major ES, and a necessity to better understand them.
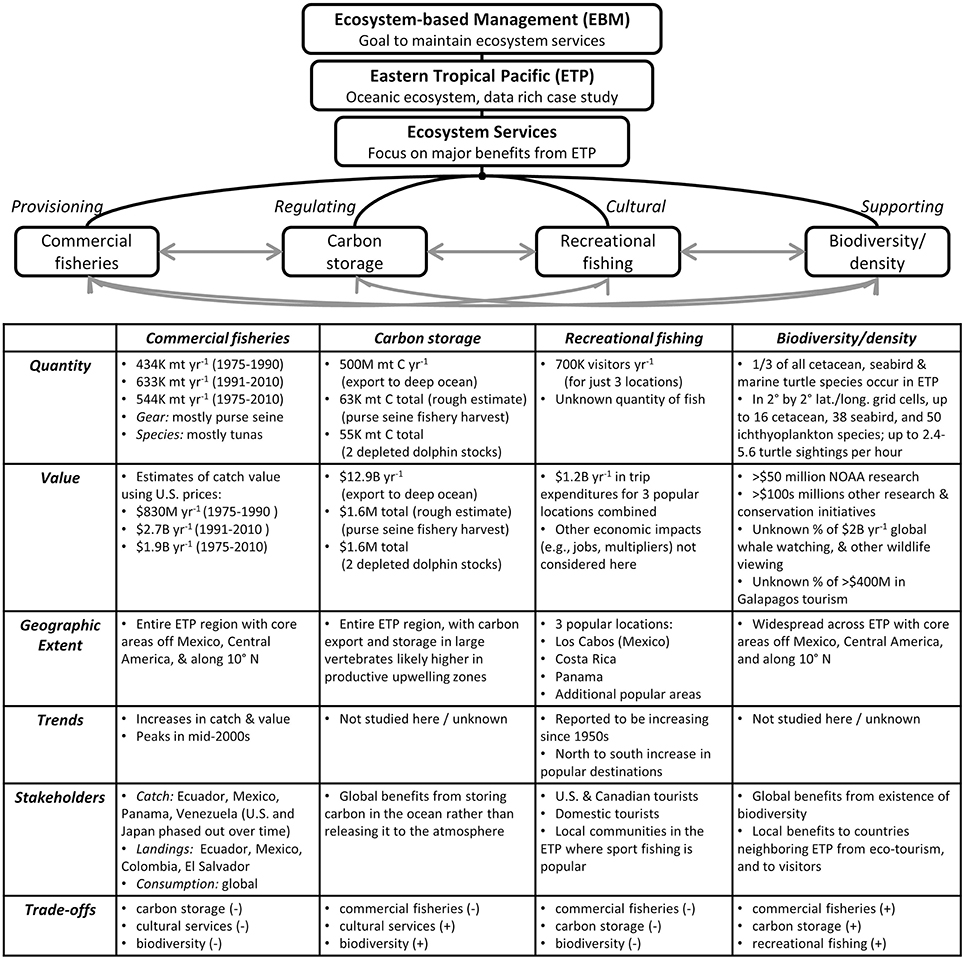
Figure 6. Overview of research and summary of key findings, which provide an ecosystem services perspective for the oceanic eastern tropical Pacific (ETP). Characterization of four major ecosystem services included investigations into six characteristics of each service. The degree of insight gained for each characteristic depended on the amount of data available for analysis. For quantities and monetary values, K, thousand; M, million; B, billion. Hypothesized trade-offs between services are indicated as positive (+, increases in one service would lead to increases in another service), or negative (−, increases in one service would lead to decreases in another service).
Commercial Fisheries
On a global scale, the contribution of ETP commercial fisheries is not all that significant. Total catch from ETP commercial fisheries (2007–2011 mean: 641,000 mt yr−1) represents < 1% of global marine capture fisheries (2007–2011 mean: 80 million mt yr−1) (UNFAO, 2014). In 2011, the catch of tunas (yellowfin, skipjack, bigeye, albacore, and bluefin) in the ETP (566,822 mt) comprised only 13% of the global total for those species (4.5 million mt) (UNFAO, 2014). Total ETP catch in 2011 (585,226 mt) paled in comparison to the world's largest fisheries – the Peruvian anchovy catch (8.3 million mt) being 14 times greater and the Alaskan pollock catch (3.2 million mt) being 5 times greater (UNFAO, 2014).
Commercial fisheries comprise the largest provisioning service (de Groot et al., 2012)—and perhaps the largest direct human perturbation (Pauly et al., 2002; Myers and Worm, 2005)—in oceanic ecosystems; therefore, understanding them is critical to EBM. Quantifying commercial fisheries catch and catch value, as we did in this study, provides a benchmark for comparisons with other services. Long-term datasets maintained by fisheries management bodies (e.g., IATTC) and price data collected by governments make this task possible. It is relatively straightforward to describe the magnitude, geographic extent, monetary value, trends, and stakeholders for commercial fisheries when such datasets exist. In fact, because of their economic importance and the availability of data, fisheries are the most analyzed marine ecosystem service (Liquete et al., 2013).
Carbon Storage
Our estimated unit price for harvested fish was $4055 mt−1 (mean for all species, 1991–2010), while our estimated unit price for fish as carbon stores was only $2.95 mt−1 (using a CO2 price of $7 mt−1). The latter increased to $14.75 mt−1 when we used the estimated social cost of carbon (CO2 price of $35 mt−1), but this is still quite low. The market price of CO2 would need to increase dramatically for leaving the fish in the water to be economically efficient. However, this comparison only considers carbon storage benefits; reduced harvests would also generate fisheries benefits in the form of larger steady-state stocks and eventually larger harvests for stocks that have been overfished below their maximum sustainable yield levels. The idea of payments for preserving carbon services in the ETP may still be worth exploring, then, given the above and our findings that (i) the estimated market value for carbon export to the deep ocean (a flow worth billions of USD) was higher than the estimated value of the commercial fisheries catch (a flow also worth billions of USD), and (ii) rebuilding carbon stores in populations of dolphins, fish, and other depleted animals is worth millions of USD at a minimum.
Payment schemes already exist for reducing emissions from deforestation and degradation (REDD programs) in tropical rainforests and for “blue carbon” stored in mangroves (Siikamäki et al., 2012). Such schemes are incentive-based and require an understanding of marginal values. For example, in the case of commercial fisheries, we would need to estimate how much (in mt) a particular level of fishing (in mt) would reduce the standing stock biomass from its equilibrium carrying capacity [i.e., Change in Carbon Storage of Fish Population = Net Change in Fish Stock Biomass = Total Harvest − Net Growth (Births − Natural Deaths)], and then apply a C price to that associated loss of C storage. Similarly, we would need to know how much (in mt) one unit of commercial fishing reduces the amount of C exported through the biological pump to the deep sea. Importantly, there would also be opportunity costs to consider if the harvest were reduced, as other sources of food protein (e.g., terrestrial livestock or aquaculture products) may be substituted for the ETP fish, and they may have a carbon footprint that could negate the benefits gained. [Note: Fish harvesting may serve as a carbon sequestration technology to some extent—we did not explore this concept here but it may be worth further investigation. As fish grow in the ocean they remove CO2 from the atmosphere, their harvest removes carbon from the ocean and allows more fish to grow, and some portion of the fish is buried in landfills. The extent of a potential carbon storage benefit depends on the amount of time it takes for the fish to decompose and release carbon back to the atmosphere].
Characterizing carbon storage as an ecosystem service was not as straightforward as it was for commercial fisheries, but the exercise was useful for exploring ideas related to the value of carbon. Our estimates of C quantities and market values relied on data from carbon markets, scientific studies of the biological pump, research surveys of dolphin populations, and commercial fisheries. These data did not support analysis of trends or spatial patterns, and identification of stakeholders was unnecessary, as carbon storage is a global service that benefits people worldwide.
Recreational Fishing
Our treatment of recreational fishing focused on existing economic analyses of three major locations, from which we obtained some insights about the magnitude, monetary value, geographic extent, trends, and stakeholders of sport fishing in the ETP. However, due to data limitations, these insights were much less in-depth than those we gained for commercial fisheries. Regardless, the estimated value of sport fishing (expenditures) in those three locations ($1.2 billion yr−1) was nearly half the catch value of commercial fish ($2.7 billion yr−1: mean for 1991–2010), and it did not include all known fishing locations. In Mexico, for example, there are other hotspots of sport fishing for billfish and tunas, including La Paz, Mazatlan, Puerto Vallarta, Manzanillo, and Acapulco. Opportunities also exist and may be growing in Ecuador (in Manta and the Galapagos). While we did not have sufficient data on those locations to scale up the estimate from the three studied locations, we have provided a minimum estimate and drawn attention to the need for further investigation. Cultural services arising from oceanic systems may be less apparent than those tied to coastlines; however, sport fishing for billfish and tuna is a widely-recognized, growing service in the ETP that should be quantified and valued in further detail.
Biodiversity/Density
Our use of long-term scientific data allowed us to characterize the magnitude and geographic extent of biodiversity (or density) for several taxa (mostly large marine vertebrate species) with high resolution. Analysis of trends was outside the scope of this study. The data did not provide information about stakeholders and we did not estimate a monetary value for biodiversity, but we discuss those two ideas here. Stakeholders of biodiversity include all who benefit from a resilient ecosystem that provides fisheries, carbon storage, opportunities to enjoy wildlife, and other services—this includes people in countries bordering the ETP, and others worldwide. Examples include countries with fishing fleets, ports, and processing plants, countries that consume ETP fish, and any entity (country, NGO, government, or individual) that seeks to conserve, protect, or enjoy biodiversity.
One type of value associated with ETP species is passive use (e.g., viewing and photographing) value. Ecotourism involving viewing and photographing of charismatic megafauna, such as whales, turtles, and seabirds is growing in the region. On a global scale, whale watching is already estimated to be worth over $2 billion yr−1 and is expected to grow as an industry (Cisneros-Montemayor et al., 2010). An example of a hotspot for ecotourism involving ETP species is the Galapagos Islands, which brings more than 145,000 people and generates over $418 million yr−1 (Epler, 2007; Watkins and Cruz, 2007). Given that over 1/3 of the world's cetacean, seabird, and marine turtle species occur in the ETP, we can speculate that the value of ecotourism opportunities alone might be on the order of $1 billion yr−1 in the near future.
A second type of value applicable to ETP biodiversity is non-use (existence, option, and bequest) value. Endangered and threatened species have been shown to hold significant value through different economic surveys (Richardson and Loomis, 2009 and references therein), but these are not specific to the ETP. In general, the fewer individuals there are of a species, the higher the existence value. There are several conservation organizations (e.g., Conservation International, World Wildlife Fund, United Nations Environment Programme, MarViva, Migramar, and the Galapagos Conservancy) and governments focused specifically on the protection of biodiversity and vulnerable megafauna in the ETP. These organizations have invested considerable sums of money (on the order of $100s of millions) to support protected areas containing high diversity of species. NOAA Fisheries invested roughly $50 million to monitor fishery-impacted dolphin populations. The amount of money spent by such organizations for conservation and preservation is a loose lower bound on the value of these species/habitats to society.
Limitations and Future Directions
Our estimates are quite general due to a number of caveats associated with our methods and assumptions for each service.
(1) The use of U.S. import prices to estimate commercial fisheries catch values has several caveats and implications, including: (i) small sample size problems—the U.S. imported only 15% of total ETP commercial catch (1975–2010), and much lower percentages of individual species that are primarily consumed locally (e.g., bonitos) or exported to Europe (e.g., skipjack landed in Ecuador), (ii) assumes U.S. prices can be applied elsewhere—although prices should theoretically equalize in an international or global market, prices paid in other countries may vary, (iii) differences in product types within species—for example, the U.S. price for yellowfin tuna dramatically increased (147%) after 1990, when the product became dolphin-safe, but this would likely be an overestimate of the price of non-dolphin-safe yellowfin tuna consumed in other countries; similarly, elasmobranch products imported into the U.S. may be specialty products that differ from those consumed elsewhere, (iv) value added issues—import prices contain value added for processing, transportation, etc., as they are further down the supply chain than ex-vessel prices, (v) exchange rate issues—some imports come from countries with distorted exchange rates that may not fully measure the economic value of the fish (e.g., 8% of U.S. imports of ETP fish came from Venezuela, where a weak local currency empowers U.S. dollars to buy relatively inexpensive fish), (iv) limited scope of economic value—the estimates only represent the gross value of fish, not other economic benefits (e.g., jobs) or costs (e.g., production costs). To get closer to true values, our estimates could be reduced by the operational costs of harvest (if data were available) and the lost carbon storage value of any reduction in the standing stock of fish resulting from fishing. Further, economic costs associated with ecological impacts of commercial fishing in the ETP (see Gerrodette et al., 2012)—which are greater than our analysis indicates, as the catch data exclude discards—could be investigated.
(2) Our carbon storage calculations were strictly intended to demonstrate a concept. We only considered a static system; complex ecosystem dynamics were beyond the scope of this study. For fishery removals, we only examined the annual biomass removed by the purse-seine fishery to provide perspective on the quantity and value of that amount of C as an approximation of the overall reduction in fish stocks due to fishing; quantifying and valuing actual reductions in standing stock biomass of the top 10 commercially fished species would be a useful exercise, if the data exist to support it. For carbon export, we used a single estimate, which we selected from an oligotrophic region to be conservative. The point estimates for dolphin population abundances, the average for annual fishery biomass removals, and published estimates for carbon content all have uncertainty that we did not capture. We applied a range of prices from the carbon market, but those change over time and currently do not reflect the full social cost of carbon. Future studies could apply this concept to additional populations of large vertebrates (e.g., large whales).
(3) We focused on sport fishing as a major cultural service, but there are others that deserve detailed investigation in future studies (e.g., small-scale Latin American pelagic fisheries whose products generally do not enter into export markets or the datasets used here). We only considered three locations—those for which economic studies existed. Other popular destinations, including those on the rise (e.g., Ecuador), should be studied and considered. It is worth noting that expenditure data reveal consumer preferences, but may not fully capture willingness to pay or the economic value of sport fishing; this is worth further investigation. Additionally, we did not attempt to directly compare the economic values of recreational and commercial fisheries; there is a body of literature on this topic (Plummer et al., 2012 and references therein) which could be applied to future studies in the ETP. Further, the sport fishing expenditures were valued in local currency in the country of activity, whereas the commercial catches were valued using U.S. import prices that include some supply chain activities. As mentioned above for commercial fisheries, distorted foreign exchange rates (e.g., where the USD holds high purchasing power) could mean that expenditures may underestimate true value. Finally, future studies could incorporate the loss of carbon storage value of harvested fish.
(4) For biodiversity, we only focused on four taxa (cetaceans, seabirds, marine turtles, and larval fishes) for which we had reliable long-term scientific survey data. Given the breadth of this study, we only used one metric of diversity (species richness). Our compilation of conservation status was limited to the non-fish species, which have life histories that make them vulnerable to anthropogenic threats. Adding sharks to these analyses would be important, but we are not aware of a comparable dataset for the oceanic realm. We did not attempt to estimate monetary values for biodiversity, as this is a complex and sometimes controversial undertaking (Beaumont et al., 2008) and we did not have the data to support such a task (nor did we wish to rely on estimates from other regions). Future studies could employ contingent valuation methods to investigate the value of biodiversity changes (e.g., multiple species losses) in the ETP (Richardson and Loomis, 2009; Ressurreição et al., 2011).
Trade-Offs among Ecosystem Services
Commercial fishing (exclusive of local, coastal fishing in this study), has a long history in the ETP—it is the dominant industry and its stakeholders have been important in making decisions about ETP resources. However, commercial fisheries production is not the only ecosystem service in the ETP. Carbon storage, recreational fishing, and biodiversity are also major services that have significant monetary values associated with them. And there are additional services that we did not address here; illegal, unreported, and unregulated (IUU) fishing, for example, provides value in terms of feeding people, but is costly in terms of overfishing. Deep sea mining, wind energy, shipping, aquaculture, military use, and other services should also be assessed and considered in a holistic management approach for this region.
As noted above, ETP fisheries production is small in a global sense—thus, we may lose little by scaling back commercial fisheries effort in the ETP in favor of more carbon storage, biodiversity preservation, and recreational opportunities. Of course, this idea assumes that: (i) a reduction of fishing effort would increase those ES, and (ii) the corresponding increases in value would exceed the value lost by commercial fisheries. While studies have shown that reduced fishing pressure can lead to increases in biodiversity (Worm et al., 2006), carbon storage (Pershing et al., 2010), and the quality of recreational fishing (Hughes et al., 2005), these changes and their associated monetary values would require further study for the ETP prior to implementation of any policy based on this idea. Additionally, viewing the trade-off in this way does not consider society-specific impacts of scaling back (e.g., economic impacts to Latin American fishers), which is a topic worth investigation.
The sustainability of each service depends on effective management of all of them, as the use of one potentially threatens the others. As a fisheries management body, the IATTC is essential for maintaining sustainable fisheries harvests and preventing overfishing, but also for mitigating impacts to biodiversity, carbon storage, and recreational fishing. Likewise, under an EBM approach, policies to protect biodiversity, carbon storage, or recreational fishing would consider impacts to commercial fisheries. All of these ES also face threats associated with climate change, whereby physical, chemical, and biological changes in the ocean may impact fisheries yields, carbon sequestration, and biodiversity (Doney et al., 2012). Consideration of these threats and the potential synergies among them is critical to the sustainability of ETP ES.
This study provides a baseline understanding of the major ETP ES, and represents an initial step toward answering important questions about trade-offs. Future studies should aim to quantify linkages among the services and understand how a change in one service impacts the others. For example, if commercial fisheries production decreased by one unit (e.g., 1 mt), how would this impact carbon storage, recreational fishing, or biodiversity? What would be the magnitude and direction of change in those other services? Would the changes be linear or non-linear? How much value would be lost or gained for those services? And if commercial fishing is not threatening the existence value of biodiversity, then does it matter what policy is chosen for fishing? Answering these questions will require further investigation of marginal values for each service.
Our efforts to characterize major ES provided by the oceanic ETP contribute to a movement toward true EBM, in which all ES, human activities, and stakeholders are considered. Our results can be used to inform policy and management decisions related to biodiversity conservation and sustainable fisheries in the region.
Author Contributions
SM, LB, and TG designed the study. SM and LB collected the data. SM analyzed the data, prepared figures, and wrote the manuscript. LB and TG provided guidance and critical feedback on project ideas and manuscript writing.
Funding
This research was primarily conducted while SM was a doctoral candidate at Scripps Institution of Oceanography. Funding for SM included a contract from the Southwest Fisheries Science Center (NOAA Fisheries) via Ocean Associates, Inc. and stipend support from the Center for Marine Biodiversity and Conservation at Scripps via a NSF IGERT grant and private donor funds.
Conflict of Interest Statement
The authors declare that the research was conducted in the absence of any commercial or financial relationships that could be construed as a potential conflict of interest.
Acknowledgments
We thank Guillermo Compeán, Nick Vogel, and Bob Olson of the Inter-American Tropical Tuna Commission for facilitating access to the tuna purse-seine fishery data for this project. Special thanks to Nick for preparing the data and discussing the project. We thank all the chief scientists and sea-going observers of the NOAA Fisheries cetacean surveys for collecting invaluable data. Ichthyoplankton identifications were conducted by William Watson and the larval fish program at SWFSC. Noelle Bowlin provided larval fish expertise during our data analysis phase. Early discussions with Robert Pitman and George Watters helped shape the direction of this research. Jessica Redfern, T.J. Moore, and Al Jackson provided NOAA Fisheries data for the biodiversity analysis. Paul Dayton, Stuart Sandin, and Lynne Talley provided constructive comments on earlier versions of this manuscript. Dale Squires and Jeff Polovina provided valuable reviews of the current version. SM thanks Tim Gerrodette for introducing her to the ETP, and the Center for Marine Biodiversity and Conservation at Scripps for encouraging and supporting interdisciplinary research.
References
Arkema, K. K., Abramson, S. C., and Dewsbury, B. M. (2006). Marine ecosystem-based management: from characterization to implementation. Front. Ecol. Environ. 4, 525–532. doi: 10.1890/1540-9295(2006)4[525:MEMFCT]2.0.CO;2
Ballance, L. T. (2007). Understanding seabirds at sea: why and how? Mar. Ornithol. 35, 127–135. Available online at: http://www.marineornithology.org/PDF/35_2/35_2_127-135.pdf
Ballance, L. T., Pitman, R. L., and Fiedler, P. C. (2006). Oceanographic influences on seabirds and cetaceans of the eastern tropical Pacific: a review. Prog. Oceanogr. 69, 360–390. doi: 10.1016/j.pocean.2006.03.013
Beaumont, N. J., Austen, M. C., Mangi, S. C., and Townsend, M. (2008). Economic valuation for the conservation of marine biodiversity. Mar. Pollut. Bull. 56, 386–396. doi: 10.1016/j.marpolbul.2007.11.013
Bellwood, D. R., Hughes, T. P., Folke, C., and Nyström, M. (2004). Confronting the coral reef crisis. Nature 429, 827–833. doi: 10.1038/nature02691
Capoor, K., and Ambrosi, P. (2009). State and Trends of the Carbon Market 2009. Washington, DC: World Bank.
Chapin, F. S., Walker, B. H., Hobbs, R. J., Hooper, D. U., Lawton, J. H., Sala, O. E., et al. (1997). Biotic control over the functioning of ecosystems. Science 277, 500–504. doi: 10.1126/science.277.5325.500
Cisneros-Montemayor, A. M., Sumaila, U. R., Kaschner, K., and Pauly, D. (2010). The global potential for whale watching. Mar. Policy 34, 1273–1278. doi: 10.1016/j.marpol.2010.05.005
Cleveland, W. S., and Devlin, S. J. (1988). Locally weighted regression: an approach to regression analysis by local fitting. J. Am. Stat. Assoc. 83, 596–610. doi: 10.1080/01621459.1988.10478639
Costanza, R. (1999). The ecological, economic, and social importance of the oceans. Ecol. Econ. 31, 199–213. doi: 10.1016/S0921-8009(99)00079-8
Costanza, R., de Groot, R., Sutton, P., van der Ploeg, S., Anderson, S. J., Kubiszewski, I., et al. (2014). Changes in the global value of ecosystem services. Glob. Environ. Change-Hum. Policy Dimens. 26, 152–158. doi: 10.1016/j.gloenvcha.2014.04.002
Costanza, R., dArge, R., deGroot, R., Farber, S., Grasso, M., Hannon, B., et al. (1997). The value of the world's ecosystem services and natural capital. Nature 387, 253–260. doi: 10.1038/387253a0
Croxall, J. P., Butchart, S. H. M., Lascelles, B., Stattersfield, A. J., Sullivan, B., Symes, A., et al. (2012). Seabird conservation status, threats and priority actions: a global assessment. Bird Conserv. Intern. 22, 1–34. doi: 10.1017/S0959270912000020
Czamanski, M., Nugraha, A., Pondaven, P., Lasbleiz, M., Masson, A., Caroff, N., et al. (2011). Carbon, nitrogen and phosphorus elemental stoichiometry in aquacultured and wild-caught fish and consequences for pelagic nutrient dynamics. Mar. Biol. 158, 2847–2862. doi: 10.1007/s00227-011-1783-7
Daily, G. C., Alexander, S., Ehrlich, P. R., Goulder, L., Lubchenco, J., Matson, P. A., et al. (1997). Ecosystem services: benefits supplied to human societies by natural ecosystems. Iss. Ecol. 2, 1–16.
Davison, P., Checkley, D., Koslow, J., and Barlow, J. (2013). Carbon export mediated by mesopelagic fishes in the northeast Pacific Ocean. Progr. Oceanogr. 116, 14–30. doi: 10.1016/j.pocean.2013.05.013
Dayton, P. K., Thrush, S. F., Agardy, M. T., and Hofman, R. J. (1995). Environmental effects of marine fishing. Aq. Conserv. 5, 205–232. doi: 10.1002/aqc.3270050305
de Groot, R., Brander, L., van der Ploeg, S., Costanza, R., Bernard, F., Braat, L., et al. (2012). Global estimates of the value of ecosystems and their services in monetary units. Ecosyst. Serv. 1, 50–61. doi: 10.1016/j.ecoser.2012.07.005
de Groot, R. S., Wilson, M. A., and Boumans, R. M. J. (2002). A typology for the classification, description and valuation of ecosystem functions, goods and services. Ecol. Econ. 41, 393–408. doi: 10.1016/S0921-8009(02)00089-7
Doney, S. C., Ruckelshaus, M., Duffy, J. E., Barry, J. P., Chan, F., English, C. A. et al. (2012). Climate change impacts on marine ecosystems. Mar. Sci. 4, 11–37. doi: 10.1146/annurev-marine-041911-111611
Ducklow, H. W., Steinberg, D. K., and Buesseler, K. O. (2001). Upper ocean carbon export and the biological pump. Oceanography 14:50. doi: 10.5670/oceanog.2001.06
Dulvy, N. K., Sadovy, Y., and Reynolds, J. D. (2003). Extinction vulnerability in marine populations. Fish and Fisheries 4, 25–64. doi: 10.1046/j.1467-2979.2003.00105.x
Ehrlich, P., and Ehrlich, A. (1981). Extinction: The Causes and Consequences of the Disappearance of Species. New York, NY: Random House.
Emerson, S., Quay, P., Karl, D., Winn, C., Tupas, L., and Landry, M. (1997). Experimental determination of the organic carbon flux from open-ocean surface waters. Nature 389, 951–954. doi: 10.1038/40111
Epler, B. (2007). Tourism, the Economy, Population Growth, and Conservation in Galapagos. Puerto Ayora: Charles Darwin Foundation.
Eppley, R. W., and Peterson, B. J. (1979). Particulate organic-matter flux and planktonic new production in the deep ocean. Nature 282, 677–680. doi: 10.1038/282677a0
Fiedler, P. C., and Talley, L. D. (2006). Hydrography of the eastern tropical Pacific: a review. Progr. Oceanogr. 69, 143–180. doi: 10.1016/j.pocean.2006.03.008
Field, C. B., Behrenfeld, M. J., Randerson, J. T., and Falkowski, P. (1998). Primary production of the biosphere: integrating terrestrial and oceanic components. Science 281, 237–240. doi: 10.1126/science.281.5374.237
Fisher, B., Turner, R. K., and Morling, P. (2009). Defining and classifying ecosystem services for decision making. Ecol. Econ. 68, 643–653. doi: 10.1016/j.ecolecon.2008.09.014
Folke, C., Carpenter, S., Walker, B., Scheffer, M., Elmqvist, T., Gunderson, L. S., et al. (2004). Regime shifts, resilience, and biodiversity in ecosystem management. Ann. Rev. Ecol. Evol. Syst. 35, 557–581. doi: 10.1146/annurev.ecolsys.35.021103.105711
Gerrodette, T., and Forcada, J. (2005). Non-recovery of two spotted and spinner dolphin populations in the eastern tropical Pacific Ocean. Mar. Ecol. Progr. Ser. 291, 1–21. doi: 10.3354/meps291001
Gerrodette, T., Olson, R., Reilly, S., Watters, G., and Perrin, W. (2012). Ecological metrics of biomass removed by three methods of purse-seine fishing for tunas in the eastern tropical Pacific Ocean. Conserv. Biol. 26, 248–256. doi: 10.1111/j.1523-1739.2011.01817.x
Gerrodette, T., Watters, G., Perryman, W., and Ballance, L. T. (2008). Estimates of 2006 Dolphin Abundance in the Eastern Tropical Pacific, with Revised Estimates from 1986-2003. La Jolla, CA: NOAA National Marine Fisheries Service.
Hall, C. M. (2001). Trends in ocean and coastal tourism: the end of the last frontier? Ocean Coastal Managem. 44, 601–618. doi: 10.1016/S0964-5691(01)00071-0
Halpern, B. S., Walbridge, S., Selkoe, K. A., Kappel, C. V., Micheli, F., D'Agrosa, C., et al. (2008). A global map of human impact on marine ecosystems. Science 319, 948–952. doi: 10.1126/science.1149345
Hardin, G. (1968). The tragedy of the commons. Science 162, 1243–1248. doi: 10.1126/science.162.3859.1243
Henson, S. A., Sanders, R., and Madsen, E. (2012). Global patterns in efficiency of particulate organic carbon export and transfer to the deep ocean. Glob. Biogeochem. Cycles 26, 1–14. doi: 10.1029/2011GB004099
Holling, C. S. (1973). Resilience and stability of ecological systems. Annual review of ecology and systematics. 4, 1–23. doi: 10.1146/annurev.es.04.110173.000245
Hughes, T. P., Bellwood, D. R., Folke, C., Steneck, R. S., and Wilson, J. (2005). New paradigms for supporting the resilience of marine ecosystems. Trends Ecol. Evolut. 20, 380–386. doi: 10.1016/j.tree.2005.03.022
IUCN. (2012). The IUCN Red List of Threatened Species. Version 2012.2. Available online at: http://www.iucnredlist.org
Jackson, J. B. C., Kirby, M. X., Berger, W. H., Bjorndal, K. A., Botsford, L. W., Bourque, B. J., et al. (2001). Historical overfishing and the recent collapse of coastal ecosystems. Science 293, 629–638. doi: 10.1126/science.1059199
Jefferson, T. A., Webber, M. A., and Pitman, R. L. (2015). Marine Mammals of the World, 2nd Edn. San Diego, CA: Academic Press.
Jimenez, M. A. S., Chacon, M. Y., Garcia, C. F., Bolanos, R. L., Rojas, F., and Gonzalez, G. (2010). Analysis of the Economic Contribution of Recreational and Commercial Fisheries to the Costa Rican Economy. Fort Lauderdale, FL: The Billfish Foundation.
Khatiwala, S., Tanhua, T., Fletcher, S. M., Gerber, M., Doney, S., et al. (2013). Global ocean storage of anthropogenic carbon. Biogeosciences 10, 2169–2191. doi: 10.5194/bg-10-2169-2013
Levin, S. A., and Lubchenco, J. (2008). Resilience, robustness, and marine ecosystem-based management. Bioscience 58, 27–32. doi: 10.1641/B580107
Liquete, C., Piroddi, C., Drakou, E. G., Gurney, L., Katsanevakis, S., Charef, A., et al. (2013). Current status and future prospects for the assessment of marine and coastal ecosystem services: a systematic review. PLoS ONE 8:e67737. doi: 10.1371/journal.pone.0067737
Loreau, M., Naeem, S., Inchausti, P., Bengtsson, J., Grime, J. P., Hector, A., et al. (2001). Biodiversity and ecosystem functioning: current knowledge and future challenges. Science 294, 804–808. doi: 10.1126/science.1064088
Lotze, H. K., Lenihan, H. S., Bourque, B. J., Bradbury, R. H., Cooke, R. G., Kay, M. C., et al. (2006). Depletion, degradation, and recovery potential of estuaries and coastal seas. Science 312, 1806–1809. doi: 10.1126/science.1128035
Luck, G. W., Daily, G. C., and Ehrlich, P. R. (2003). Population diversity and ecosystem services. Trends Ecol. Evol. 18, 331–336. doi: 10.1016/S0169-5347(03)00100-9
McLeod, K. L., Lubchenco, J., Palumbi, S. R., and Rosenberg, A. A. (2005). Scientific Consensus Statement on Marine Ecosystem-Based Management. Signed by 217 Academic Scientists and Policy Experts with Relevant Expertise and Published by the Communication Partnership for Science and the Sea. Communication Partnership for Science and the Sea (COMPASS). (Corvallis).
Millenium Ecosystem Assessment. (2003). Ecosystems and Human Well-Being: A Framework for Assessment. Washington, DC: Island Press.
Myers, R. A., and Worm, B. (2005). Extinction, survival or recovery of large predatory fishes. Philo. Trans. R. Soc. B 360, 13–20. doi: 10.1098/rstb.2004.1573
Newell, R. G., Pizer, W. A., and Raimi, D. (2013). Carbon markets 15 years after kyoto: lessons learned, new challenges. J. Econ. Perspect. 27, 123–146. doi: 10.1257/jep.27.1.123
Newell, R. G., Pizer, W. A., and Raimi, D. (2014). Carbon market lessons and global policy outlook. Science 343, 1316–1317. doi: 10.1126/science.1246907
Pandolfi, J. M., Bradbury, R. H., Sala, E., Hughes, T. P., Bjorndal, K. A., Cooke, R. G., et al. (2003). Global trajectories of the long-term decline of coral reef ecosystems. Science 301, 955–958. doi: 10.1126/science.1085706
Pauly, D., Christensen, V., Guénette, S., Pitcher, T. J., Sumaila, U. R., Walters, C. J. et al. (2002). Towards sustainability in world fisheries. Nature 418, 689–695. doi: 10.1038/nature01017
Perrin, W. F., Dolar, M. L. L., Chan, C. M., and Chivers, S. J. (2005). Length-weight relationships in the spinner dolphin (Stenella longirostris). Mar. Mammal Sci. 21, 765–778. doi: 10.1111/j.1748-7692.2005.tb01264.x
Pershing, A. J., Christensen, L. B., Record, N. R., Sherwood, G. D., and Stetson, P. B. (2010). The impact of whaling on the ocean carbon cycle: why bigger was better. PLoS ONE 5:e12444. doi: 10.1371/journal.pone.0012444
Pikitch, E. K., Santora, C., Babcock, E. A., Bakun, A., Bonfil, R., Conover, D. O., et al. (2004). Ecosystem-based fishery management. Science 305, 346–347. doi: 10.1126/science.1098222
Plummer, M. L., Morrison, W., and Steiner, E. M. (2012). “Allocation of fishery harvests under the Magnuson-Stevens Fishery Conservation and Management Act: principles and practice,” in Technical Memorandum NMFS-NWFSC-115. (Seattle: US Department of Commerce, National Oceanic and Atmospheric Administration, National Marine Fisheries Service), 84.
Ressurreição, A., Gibbons, J., Dentinho, T. P., Kaiser, M., Santos, R. S., and Edwards-Jones, G. (2011). Economic valuation of species loss in the open sea. Ecol. Econ. 70, 729–739. doi: 10.1016/j.ecolecon.2010.11.009
Richardson, L., and Loomis, J. (2009). The total economic value of threatened, endangered and rare species: an updated meta-analysis. Ecol. Econ. 68, 1535–1548. doi: 10.1016/j.ecolecon.2008.10.016
Sabine, C. L., and Tanhua, T. (2010). Estimation of Anthropogenic CO2 Inventories in the Ocean. Ann. Rev. Mar. Sci. 2, 175–198. doi: 10.1146/annurev-marine-120308-080947
Schlitzer, R. (2004). Export production in the equatorial and North Pacific derived from dissolved oxygen, nutrient and carbon data. J. Oceanogr. 60, 53–62. doi: 10.1023/B:JOCE.0000038318.38916.e6
Siikamäki, J., Sanchirico, J. N., and Jardine, S. L. (2012). Global economic potential for reducing carbon dioxide emissions from mangrove loss. Proc. Natl. Acad. Sci. U.S.A. 109, 14369–14374. doi: 10.1073/pnas.1200519109
Southwick, R., Nelson, R., and Lachman, R. (2013). Sportfishing in Panama: Size, Economic Impacts and Market Potential. Fort Lauderdale, FL: The Billfish Foundation.
Southwick, R., Nelson, R., and Martinez, J. A. A. (2008). The Economic Contributions of Anglers to the Los Cabos Economy. Fort Lauderdale, FL: The Billfish Foundation.
Steneck, R. S., Graham, M. H., Bourque, B. J., Corbett, D., Erlandson, J. M., Estes, J. A., et al. (2002). Kelp forest ecosystems: biodiversity, stability, resilience and future. Environ. Conserv. 29, 436–459. doi: 10.1017/S0376892902000322
Steneck, R. S., Vavrinec, J., and Leland, A. V. (2004). Accelerating trophic-level dysfunction in kelp forest ecosystems of the western North Atlantic. Ecosystems 7, 323–332. doi: 10.1007/s10021-004-0240-6
Takahashi, T., Sutherland, S. C., Wanninkhof, R., Sweeney, C., Feely, R. A., Chipman, D. W., et al. (2009). Climatological mean and decadal change in surface ocean pCO2, and net sea–air CO2 flux over the global oceans. Deep Sea Res. Part II 56, 554–577. doi: 10.1016/j.dsr2.2008.12.009
Trites, A. W., and Pauly, D. (1998). Estimating mean body masses of marine mammals from maximum body lengths. Can. J. Zool. 76, 886–896. doi: 10.1139/z97-252
UNFAO (2014). The State of World Fisheries and Aquaculture: Opportunities and Challenges. Rome: United Nations Food and Agriculture Organization (UNFAO).
US Government Interagency Working Group on Social Cost of Carbon (2013). Technical Support Document: Technical Update of the Social Cost of Carbon for Regulatory Impact Analysis—Under Executive Order 12866.in Interagency Working Group on Social Cost of Carbon. Washington, DC: United States Government.
Vilchis, L. I., Ballance, L. T., and Watson, W. (2009). Temporal variability of neustonic ichthyoplankton assemblages of the eastern Pacific warm pool: can community structure be linked to climate variability? Deep-Sea Res. Part I Oceanogr. Res. Pap. 56, 125–140. doi: 10.1016/j.dsr.2008.08.004
Wade, P. R., Watters, G. M., Gerrodette, T., and Reilly, S. B. (2007). Depletion of spotted and spinner dolphins in the eastern tropical Pacific: modeling hypotheses for their lack of recovery. Mar. Ecol. Progr. Ser. 343, 1–14. doi: 10.3354/meps07069
Walker, B. (1995). Conserving Biological Diversity through Ecosystem Resilience La conservación de la diversidad biológica a través de la resiliencia de los ecosistemas. Conserv. Biol. 9, 747–752. doi: 10.1046/j.1523-1739.1995.09040747.x
Wallace, B. P., DiMatteo, A. D., Bolten, A. B., Chaloupka, M. Y., Hutchinson, B. J., Abreu-Grobois, F. A., et al. (2011). Global conservation priorities for marine turtles. PLoS ONE 6:e24510. doi: 10.1371/journal.pone.0024510
Wang, Z. M., and Pierson, R. N. Jr. (2010). Total body carbon and oxygen masses: evaluation of dual-energy x-ray absorptiometry estimation by in vivo neutron activation analysis. Phys. Med. Biol. 55, 5953–5963. doi: 10.1088/0031-9155/55/19/021
Watkins, G., and Cruz, F. (2007). Galapagos at Risk: A Socioeconomic Analysis. Puerto Ayora: Charles Darwin Foundation.
Worm, B., Barbier, E. B., Beaumont, N., Duffy, J. E., Folke, C., Halpern, B. S., et al. (2006). Impacts of biodiversity loss on ocean ecosystem services. Science 314, 787–790. doi: 10.1126/science.1132294
Worm, B., Sandow, M., Oschlies, A., Lotze, H. K., and Myers, R. A. (2005). Global patterns of predator diversity in the open oceans. Science 309, 1365–1369. doi: 10.1126/science.1113399
Keywords: marine ecosystem services, ecosystem-based management, open ocean, cetaceans, seabirds, tuna fisheries, carbon markets, Latin America
Citation: Martin SL, Ballance LT and Groves T (2016) An Ecosystem Services Perspective for the Oceanic Eastern Tropical Pacific: Commercial Fisheries, Carbon Storage, Recreational Fishing, and Biodiversity. Front. Mar. Sci. 3:50. doi: 10.3389/fmars.2016.00050
Received: 14 January 2016; Accepted: 31 March 2016;
Published: 27 April 2016.
Edited by:
Sara M. Maxwell, Old Dominion University, USAReviewed by:
Rochelle Diane Seitz, Virginia Institute of Marine Science, USAChris J. Kennedy, George Mason University, USA
Copyright © 2016 Martin, Ballance and Groves. This is an open-access article distributed under the terms of the Creative Commons Attribution License (CC BY). The use, distribution or reproduction in other forums is permitted, provided the original author(s) or licensor are credited and that the original publication in this journal is cited, in accordance with accepted academic practice. No use, distribution or reproduction is permitted which does not comply with these terms.
*Correspondence: Summer L. Martin, summer.martin@noaa.gov