An Objective Framework to Test the Quality of Candidate Indicators of Good Environmental Status
 Ana M. Queirós1*
  James A. Strong2
  Krysia Mazik2 Jacob Carstensen3
  John Bruun1
  Paul J. Somerfield1 Annette Bruhn4
  Stefano Ciavatta1,5
  Eva Flo6
  Nihayet Bizsel7 Murat Özaydinli7 Romualda Chuševė8 Iñigo Muxika9 Henrik Nygård10
  Nadia Papadopoulou11
  Maria Pantazi12
  Dorte Krause-Jensen4
- 1Plymouth Marine Laboratory, Plymouth, UK
- 2University of Hull, Hull, UK
- 3Department of Bioscience, Aarhus University, Roskilde, Denmark
- 4Department of Bioscience, Aarhus University, Silkeborg, Denmark
- 5Plymouth Marine Laboratory, National Centre for Earth Observation, Plymouth, UK
- 6Institut de Ciències del Mar, Consejo Superior de Investigaciones Científicas, Barcelona, Spain
- 7Institute of Marine Science and Technology, DokuzEylul University, Inciralti-Izmir, Turkey
- 8Marine Science and Technology Center, Klaipėda University, Klaipėda, Lithuania
- 9AZTI, Gipuzkoa, Spain
- 10Marine Research Centre, Finnish Environment Institute, Helsinki, Finland
- 11Institute of Marine Biological Resources and Inland Waters, Hellenic Centre for Marine Research, Crete, Greece
- 12Institute of Marine Biological Resources and Inland Waters, Hellenic Centre for Marine Research, Athens, Greece
Large efforts are on-going within the EU to prepare the Marine Strategy Framework Directive's (MSFD) assessment of the environmental status of the European seas. This assessment will only be as good as the indicators chosen to monitor the 11 descriptors of good environmental status (GEnS). An objective and transparent framework to determine whether chosen indicators actually support the aims of this policy is, however, not yet in place. Such frameworks are needed to ensure that the limited resources available to this assessment optimize the likelihood of achieving GEnS within collaborating states. Here, we developed a hypothesis-based protocol to evaluate whether candidate indicators meet quality criteria explicit to the MSFD, which the assessment community aspires to. Eight quality criteria are distilled from existing initiatives, and a testing and scoring protocol for each of them is presented. We exemplify its application in three worked examples, covering indicators for three GEnS descriptors (1, 5, and 6), various habitat components (seaweeds, seagrasses, benthic macrofauna, and plankton), and assessment regions (Danish, Lithuanian, and UK waters). We argue that this framework provides a necessary, transparent and standardized structure to support the comparison of candidate indicators, and the decision-making process leading to indicator selection. Its application could help identify potential limitations in currently available candidate metrics and, in such cases, help focus the development of more adequate indicators. Use of such standardized approaches will facilitate the sharing of knowledge gained across the MSFD parties despite context-specificity across assessment regions, and support the evidence-based management of European seas.
Introduction
The current paradigm of marine management in Europe determines that decisions should be weighed on their impacts on whole ecosystems rather than on individual ecosystem components (United Nations, 1992; MEA, 2005). This “ecosystem approach” is enshrined in the EU Marine Strategy Framework Directive (the MSFD, EC, 2008; EU, 2014) and associated Maritime Spatial Planning Directive (EU, 2014). Component parts to this approach are the aims to attain and preserve “good environmental status” in EU waters (“GEnS,” EC, 2008), the definition of which has been summarized across 11 descriptors. Various initiatives have consequently proposed metrics that could serve as indicators for these descriptors to support their monitoring (hereafter “indicators,” e.g., Rice et al., 2012; Borja et al., 2013), and efforts are being made to review a wealth of available and new metrics (hereafter, “candidate” indicators, or “candidate” metrics, Borja et al., 2014; Teixeira et al., 2014). As the assessment of GEnS is the fundamental aim of the MSFD, the credibility of this policy depends on the choice of adequate GEnS indicators for its descriptors. Various indicator quality criteria have since been suggested as the desirable characteristics of GEnS indicators that are fit for purpose, and discussions regarding their assessment are being undertaken (Borja et al., 2013; ICES, 2013b, 2015; Rossberg et al., 2013; Hummel et al., 2015). Additionally, scoring systems for the assessment of candidate indicators have been proposed by ICES (2013b, 2015) using a set of 16 quality criteria. However, a stringent framework for assessing whether these candidate indicators actually meet this or other sets of desired quality criteria, that is both comprehensive and applicable across the 11 descriptors of GEnS, has not been described. Though the desirable traits of a GEnS indicator may be intuitive, it is difficult to define objectively whether a candidate metric actually possesses such traits. Judgments or values thus need to be objectively laid out to enable the comparison of candidate metrics, so that an informed selection can be made across descriptors, and a smaller list of indicators ultimately suggested for implementation of the MSFD. This study aimed to provide a standardized procedure to evaluate the quality of candidate indicators across the descriptors, through objective analysis and testing. This framework lays out a transparent and repeatable methodology to test the fulfillment of quality criteria that can be used to define indicator quality, and to rank candidate indicators to facilitate indicator selection within the MSFD assessment.
From a wide range of published alternatives (Table 1, adapted from Krause-Jensen et al., 2015) the ICES quality criteria for selecting MSFD GEnS indicators for the North Sea (ICES, 2013a,b, 2015) were chosen as a basis for the present study because this list already resulted from previous exercises to synthesize published efforts, reflecting common aspirations within the community. This ICES quality criteria list has already been applied for selecting common OSPAR (the Convention for the Protection of the Marine Environment of the North-East Atlantic) indicators for the MSFD (ICES, 2015). The list describes 16 quality criteria which were here further distilled to eight Indicator Quality criteria [henceforth, “IQ(s),” Figure 1 and Table S1]. This simplification was deemed necessary to facilitate the operationalization of indicators by reducing perceived overlap within that list and keeping the focus on state indicators and key performance criteria for these (Table S1 for justification, from Krause-Jensen et al., 2015). Based on these eight IQs, a framework for the analysis of candidate GEnS indicators is presented here which: (1) formulates objective, transparent and repeatable tests of indicator quality; (2) constructs a ranking system to enable the comparison of alternative candidate indicators and thus facilitate indicator selection; and (3) quantitatively displays indicator strengths and weaknesses, and hence the potential need for additional indicator development. Within a wide range of available candidate metrics, four falling within the remit of expertise of the authors, were chosen to investigate and demonstrate the application of this framework as worked examples.
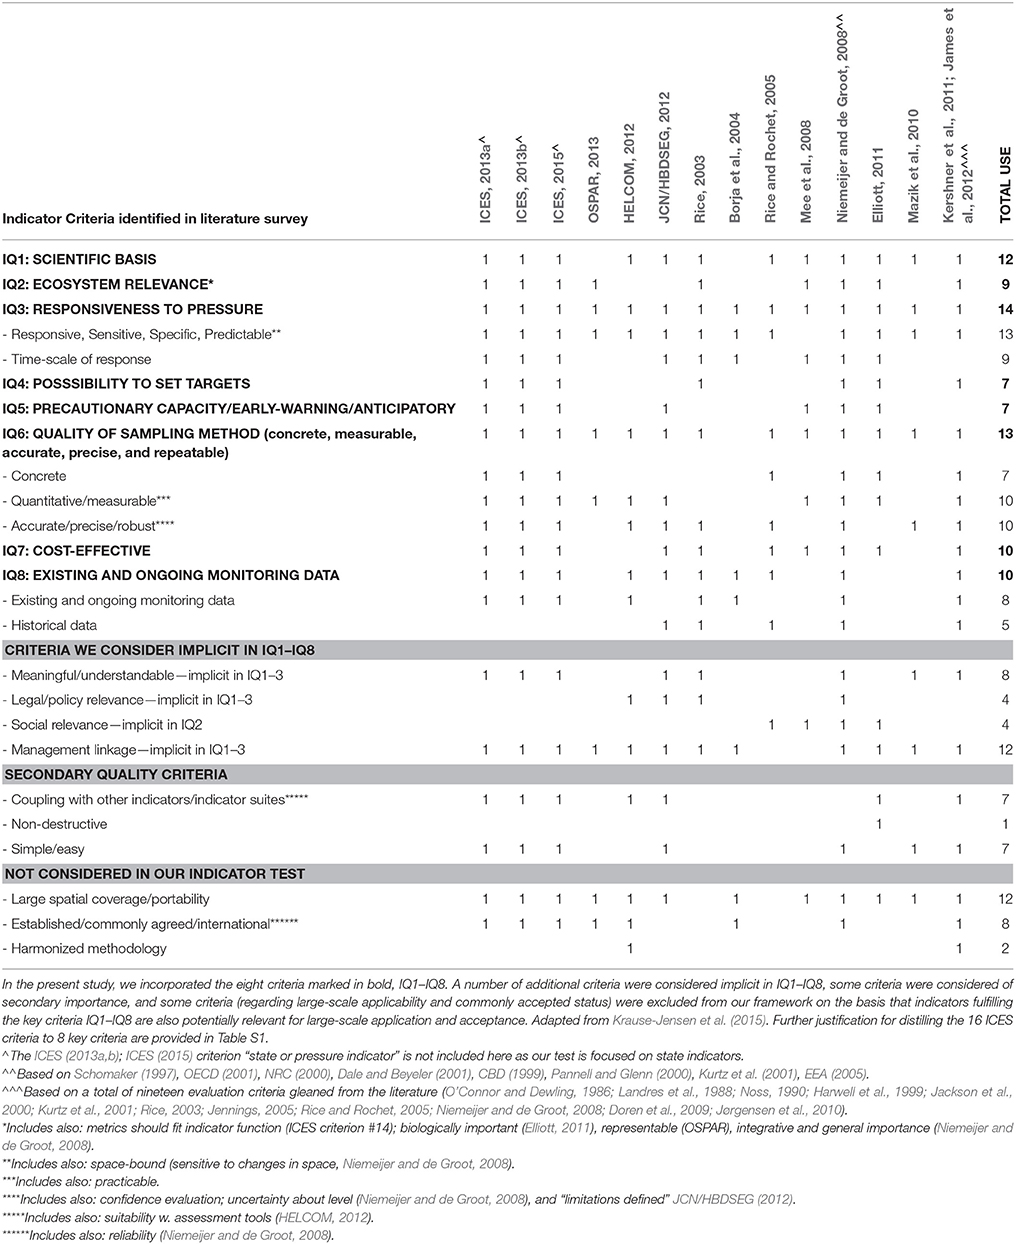
Table 1. Literature survey of the use of indicator quality criteria (IQ).
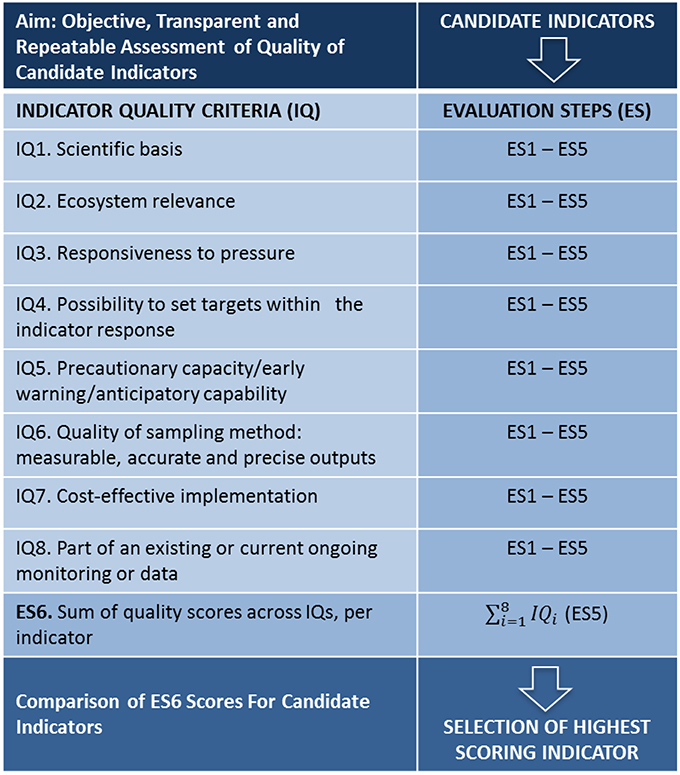
Figure 1. Overview of the elements in the IQ-ES framework for candidate indicator selection. Candidate indicators are tested on the basis of eight indicator quality criteria (IQ1–IQ8), each of which are evaluated and scored through five sequential steps (ES1–ES5). The final score for each candidate indicator is calculated across IQ1–IQ8 in evaluation step 6 (ES6). The comparison of the total quality score of candidate indicators is intended to provide an objective and transparent basis to inform indicator selection.
Materials and Methods
The proposed indicator quality testing framework is detailed below, followed by three worked examples detailing its application to four candidate metrics. These metrics currently exist at different stages of operationalization as candidate indicators for the MSFD. Presentation of these worked examples was thus not primarily aimed to serve as actual tests of their quality as actual indicators for the MSFD (although this text could potentially come to support that aim). Rather, they are detailed here with the specific aims of investigating and demonstrating the application of the proposed testing framework across a variety of GEnS descriptors, indicator and ecosystem types, to help build the case for, and support, its further uses by the community. Specifically: the quality of presence of keystone kelp species and the depth limit of eelgrass as candidate metrics for descriptors 1 (biodiversity) and 5 (eutrophication) in the Danish coast is evaluated in worked example I; the quality of the temporal trend of N:P in coastal waters as a potential indicator for the occurrence of harmful algal blooms under descriptor 5 (eutrophication) in the UK is evaluated in worked example II; and the quality of the Benthic Quality Index (BQI, Fleischer et al., 2007) as a potential indicator for descriptors 1 (biodiversity) and 6 (seafloor integrity) in the Lithuanian coast is evaluated in worked example III. With regard to their current status of operationalization: seagrass depth limits are already considered in Denmark and other European countries as indicators for ecological status under the Water Framework Directive (“WFD”), and are being considered within the MSFD (Marbà et al., 2013); presence of kelps is being considered by ICES and specific European countries as a potential indicator for descriptor 1 of the MSFD, though not yet in Denmark (Burrows et al., 2014; Hummel et al., 2015); the trend of N:P is not yet being considered by the MSFD, although the data required for its estimation is collected routinely as part of WFD monitoring efforts around Europe; the BQI is already extensively in use by Baltic countries to assess ecological status for the WFD, including by the Lithuanian Environment Ministry (Šiaulys et al., 2011), and it is under consideration for the MSFD; it is already being implemented in Sweden under this directive.
Quality Testing: The IQ-ES Framework
The indicator evaluation framework is detailed in the next section. For a given candidate indicator (A) or a pair of candidate indicators (A and B) of the same descriptor of GEnS being compared, a sequence of five Evaluation Steps (henceforth “ES”) was defined for each of eight IQs to determine whether each is met (Figure 1). In summary, ES1 states the null hypothesis associated with the IQ tested; ES2 defines which assessment approach should be employed to test the hypothesis, i.e., qualitative or quantitative, and is conditional to its nature; ES3 states the type of evidence required to undertake the assessment; ES4 defines the methodology (e.g., type of statistical analysis or otherwise) undertaken to test the hypothesis considered and its outcome; ES5 states the quality score for the particular IQ tested given ES4. If the test is successful (within the assessment of each of the eight IQs), the indicator scores 1 in the final step (Figure 1, ES5) and 0 otherwise. Once IQs 1–8 have been assessed through these steps individually, all scores are summed in a final step (Figure 1, ES6) and a total quality score for the candidate indicator is calculated, which can be compared to that of other candidate indicators for the same descriptor.
At the core of this assessment structure is the expression of each IQ into a testable null hypothesis (ES1). In keeping with a statistical testing background, the hypothesis is stated as a negative that is rejected if the indicator meets the IQ tested for, and accepted otherwise (ES5). Without this first step, there is no clarity about what attribute of quality is being assessed. For example, in IQ1 (Figure 1, “scientific basis”) ES1 (the null hypothesis) states that “there is no scientific basis for the indicator.” Based on the review of associated literature, an informed judgment can be made: the analysis that tests this hypothesis is therefore qualitative and the outcome is categorical (yes or no). Examples of qualitative approaches may therefore include expert judgment, by which e.g., a review of literature may be sufficient to establish whether the indicator satisfies a particular criterion of quality. Conversely, in IQ3 (Figure 1, “responsiveness to pressure”), ES1 is only truly testable under a quantitative approach, requiring that a minimum pressure change of interest induces a measureable and consistent indicator response, for the system analyzed. Quantitative approaches could include statistical analyses, graphical exploration of data, or any type of numerical modeling to define a quantitative relationship. The nature of the hypothesis defined by ES1 therefore dictates which type of approach should be preferred in ES2 (qualitative c.f. quantitative). The preferred type of approach (Figure 1, ES2) in turn helps identify which type of evidence, resources (Figure 1, ES3), and analyses (Figure 1, ES4) need to be considered for the assessment of each specific IQ, for each indicator and context (i.e., descriptor, area).
Whilst the analysis method used in ES4 may be substantially different between candidate metric types, the comparison of metrics to enable selection requires that the quality assessment is standardized across these metrics within descriptors. We suggest that this quality scoring system provides this comparative basis. Various weighted and non-weighted scoring systems are possible in ES5. However, given that the key aims of this framework are the objective, transparent and repeatable evaluation and ranking of indicators according to quality criteria, we suggest that the use of a binary system (0,1) provides the most unambiguous statement of the assessment outcome: that the indicator does (1) or does not (0) meet the quality criterion tested. However, here, we compare this approach with that suggested by ICES (2013a,b, 2015), which includes an additional possible score (0.5) in IQs 2 and 4–8, expressing that a given quality criterion is partially fulfilled (three-way scoring system).
We suggest that once ES1–6 have been undertaken for a pair of candidate indicators (e.g., A and B) for a given descriptor, their total quality score (ES6) should provide a sufficient basis for a pair-wise comparison and selection, with preference given to the indicator with the highest score. This is a fundamental step toward an objective sorting and selection of candidate indicators, ensuring consistency, comparability, transparency and repeatability of the selection approach regardless of the indicator, descriptor, pressure, habitat, or biological component assessed. Overall, this general framework thus converts aspirational attributes (Table S1) associated with the definition of indicators into a series of defined, analytical steps to establish GEnS candidate indicator quality. IQ1 and IQ3 are seen as essential quality criteria in the assessment, such that failure to meet either of these criteria should render exclusion. In other words, IQ1 and IQ3 are “one-out-all-out” criteria. Overall score ties between candidate indicators (ES6) compared using this framework require expert judgment for selection (see also Table S1). Here too, the standardized format of the IQ-ES assessment could set a good basis to inform this decision because the quality assessment is broken down into its component criteria.
The GEnS Indicator Quality Evaluation Steps
IQ 1: Scientific basis (one-out-all-out criterion)
IQ1–ES1: there is no scientific basis for the indicator.
IQ1–ES2: expert judgment/qualitative approach are adequate.
IQ1–ES3: publications evidencing the conceptual basis for using the indicator, stressing the existence of a general causal link between the indicator and a given pressure, highlighting an effect on the relevant descriptor. Peer-reviewed publications are preferred but, in some instances, reports from governmental institutes or international institutions (e.g., ICES) may be more appropriate.
IQ1–ES4: the indicator must be reproducible, i.e., the conceptual basis and causality relationship have been published (preferentially in peer-reviewed literature) using multiple data sets, and this can be seen as a proxy for its wide acceptance within the relevant scientific community.
IQ1–ES5: the indicator scores 1 if the above can be verified. If the indicator scores 0 in IQ1, it is seen as failing in the quality assessment as this is a one-out-all-out quality criterion. Because of this, we consider that the three-way scoring system is not applicable to IQ1.
IQ 2: Ecosystem relevance
IQ2–ES1: there is no evidence linking the indicator to (a) ecosystem level processes and function (the non-anthropocentric perspective; e.g., indicators of processes undertaken by keystone species could be particularly relevant); and/or (b) ecosystem services (the anthropocentric perspective, i.e., societal relevance).
IQ2–ES2: expert judgment/qualitative approach are adequate.
IQ2–ES3: scientific, peer-reviewed evidence for the non-anthropocentric criterion and/or for the anthropocentric criterion. IQ2–ES4: a literature review is a recommended approach to test IQ2. Evidence for the ecosystem relevance of the indicator should have been published in peer-reviewed literature. Within the anthropocentric perspective, the indicator must be explicitly listed within recognized ecosystem function/service typologies, or they have been linked directly to a monetary valuation. For instance, indicators listed under the Common International Classification of Ecosystem Services (Haines-Young and Potschin, 2013) or another equally widely applied typology are preferred.
IQ2–ES5: the indicator scores 1 if the above (IQ2–ES4) can be verified and 0 otherwise. The three-way scoring system could be applied to IQ2.
IQ 3: Responsiveness to pressure (one-out-all-out criterion)
IQ3–ES1: the indicator does not exhibit consistent and significant change as a result of a change in pressure, as listed within the recognized MSFD pressure list (EC, 2008), in the system of interest.
IQ3–ES2: a quantitative approach is adequate.
IQ3–ES3: the data used for testing should include some information about the natural baseline of the system, including information about its natural variability because this may confound the ability to detect a pressure driven effect. The drivers of the natural variability baseline of the indicator are known and understood. In case data for the area in question is not sufficiently comprehensive to allow proper pressure-response analyses, pressure-response analyses conducted for the same candidate indicator in comparable ecosystem(s) could be considered.
IQ3–ES4: the method of analysis must consider the impact/influence of natural variability (if any) on the response of the indicator (identify, estimate, and diagnose). The analysis must be appropriate for the complexity of the data to hand.
IQ3–ES5: the indicator scores 1 if a consistent and significant change is measured in response to the pressure (IQ3–ES4), and 0 if: (i) there is no change in response to pressure; or (ii) the change in the indicator in response to pressure is not consistent (across areas, scales); or (iii) the measured change in the indicator in response to the pressure is not statistically significant. If the indicator scores 0 in IQ3, it is seen as failing in the quality assessment as this is a one-out-all-out quality criterion. Because of this, the three-way scoring system is not applicable to IQ3.
IQ 4: Possibility to set targets
IQ4–ES1: a clear and unambiguous target cannot be defined for the indicator within a range with defined units of measurement.
IQ4–ES2: both expert judgment/qualitative approach and a quantitative approach can be adequate, depending on the indicator.
IQ4–ES3: information about the range of natural variability of the system is required, against which the target level is defined.
IQ4–ES4: the method of analysis must consider the impact/influence of natural variability (if any) on the response of the indicator (identify, estimate, and diagnose). The analysis must be appropriate for the type of data at hand (qualitative c.f. quantitative).
IQ4–ES5: the indicator scores 1 if a clear and unambiguous target can be defined with clear units of measurement, and 0 if: (i) a clear and unambiguous target cannot be defined; or (ii) there is not sufficient background information to define the range of the natural variability of the system (i.e., habitat and scale) within which the indicator is to be implemented. The three-way scoring system could be applied to IQ4.
IQ 5: Precautionary capacity/early-warning/anticipatory
IQ5–ES1: there is no immediate and measurable change in the indicator associated with a change in the pressure that anticipates ecosystem-level change in the system (see IQ2).
IQ5–ES2: a quantitative approach is adequate.
IQ5–ES3: data that enables a quantification to be made about the time lag between pressure level and indicator response, and that between pressure change and ecosystem-level relevant change. Information must exist about a clear link between pressure level and ecosystem state. The indicator must be responsive to pressure (IQ3). These data are particularly important in instances where system collapse may occur. The rate of change in the indicator during impact and recovery phases may be distinct.
IQ5–ES4: any quantitative method of analysis that measures the lag time between pressure and indicator response, and the lag between pressure change and ecosystem-level change. The indicator analysis method must be reproducible (IQ6).
IQ5–ES5: the indicator scores 1 if the lag time between pressure change and the detection of a measurable change in the indicator level is small and suitable to enable mitigation action to take place to prevent ecosystem-level change. The indicator scores 0 if the time lag between pressure change and indicator response is not sufficiently small to support action taking place within the system to prevent further ecosystem scale deterioration. The three-way scoring system could be applied to IQ5.
IQ 6: Quality of sampling method: Concrete/measurable, accurate, precise and repeatable
IQ6–ES1: the indicator is not concrete/measurable, accurate, precise or repeatable. Concreteness/measurability refers to whether the indicator can be quantitatively assessed. Accuracy refers to the closeness of an estimate of an indicator to the true value of the indicator. Precision refers to the degree of concordance among a number of estimates for the same population and repeatability to the degree of concordance among estimates obtained by different observers (Sokal and Rohlf, 1969).
IQ6–ES2: a quantitative approach is adequate.
IQ6–ES3: identification of whether an indicator is concrete/measurable requires availability of well-defined quantitative data. Testing for accuracy requires quantitative data to address the possibility of measurement bias. Testing for precision requires data covering spatial and temporal scales of variability and is necessary for quantifying how much sampling effort is required to identify an effect size of a defined level in the indicator in the context of the spatial- and temporal variability of the system being assessed. Testing for repeatability requires data allowing comparability of estimates obtained by two or more different observers.
IQ6–ES4: For the analysis of concreteness/measurability, any method that enables well-defined quantitative information on the indicator can be used. For testing accuracy and precision and repeatability, analyses of variability are suitable and these can be supplemented with power analysis and species area curves to evaluate the necessary sampling effort.
IQ6–ES5: the indicator scores 1 only in the case in which all analyses in IQ6–ES4 lead to the rejection of the null hypothesis set out by IQ6–ES1. The indicator scores 0 if the hypothesis cannot be rejected for one or more of the attributes (i.e., if the indicator cannot be positively identified as being simultaneously concrete, accurate, precise, and repeatable). In the case of score ties, indicators for which the most attributes in IQ6 could be validated are preferred. The three-way scoring system could be applied to IQ6.
IQ 7: Cost-effective
IQ7–ES1: the indicator is not cost effective.
IQ7–ES2: a quantitative approach is adequate.
IQ7–ES3: requires information about the levels of precision and accuracy required (IQ6), against which the costs of the necessary method of implementation of the indicator are calculated.
IQ7–ES4: any analysis that enables the establishment of the change in cost associated with an improvement in the criteria of accuracy and precision of the indicator.
IQ7–ES5: the indicator scores 1 if the cost associated with the desired level of precision and accuracy is manageable and 0 otherwise. The three-way scoring system could be applied to IQ7.
IQ 8: Existing and ongoing monitoring data
IQ8–ES1: the indicator is not currently used in ongoing monitoring program(s).
IQ8–ES2: a quantitative approach is adequate.
IQ8–ES3: requires information about the length of time during which the indicator has been in use within a monitoring program, and of the redundancy the indicator in relation others (if any) also in use within the scale of analysis of interest.
IQ8–ES4: any method that quantifies the above (IQ8–ES3).
IQ8–ES5: the indicator scores 1 if is already in use in at least one monitoring program, and 0 otherwise. In a score tie, indicators with the longest use of application, exhibiting potential for application in the widest areas of interest, are preferred. The three-way scoring system could be applied to IQ8.
ES6 sum of quality scores
The scores given in ES5 in IQ1–8 are summed, ranging between 0 and 8.
Worked Examples
We exemplify the application of this framework in three case-studies, assessing potential candidate indicators of marine ecosystem components ranging from nutrients and benthic vegetation to soft sediment faunal communities (Table 2). For practical reasons, we provide only one worked example in the main body of the text, analyzing two candidate indicators; two other worked examples are explored in the same level of detail in the Supplementary Materials Section.
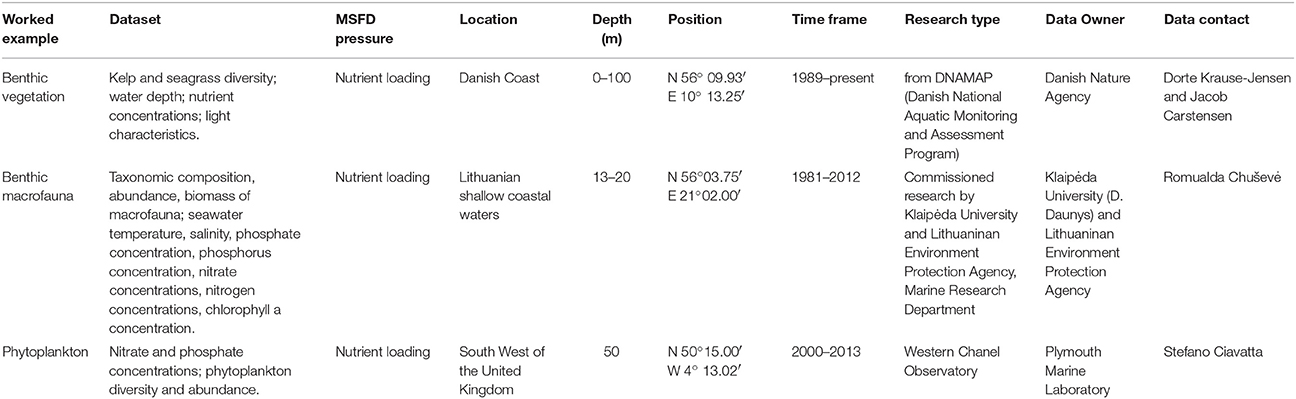
Table 2. Datasets used in worked examples of the application of the IQ-ES framework for quality testing and selection of GEnS indicators.
Results
Worked Example I. Candidate Indicators for Descriptors 1 (Biodiversity) and 5 (Eutrophication): Presence of Keystone Kelp Species and Eelgrass Depth Limit
In this example, we comparatively evaluate the quality of two candidate indicators which could be used to monitor both descriptor 1 (Biodiversity) and descriptor 5 (Eutrophication), within Danish waters. Specifically, we compare the quality of: the presence of keystone kelp species (seaweeds) and the depth limit for eelgrass (a seagrass). This evaluation is summarized in Table 3.
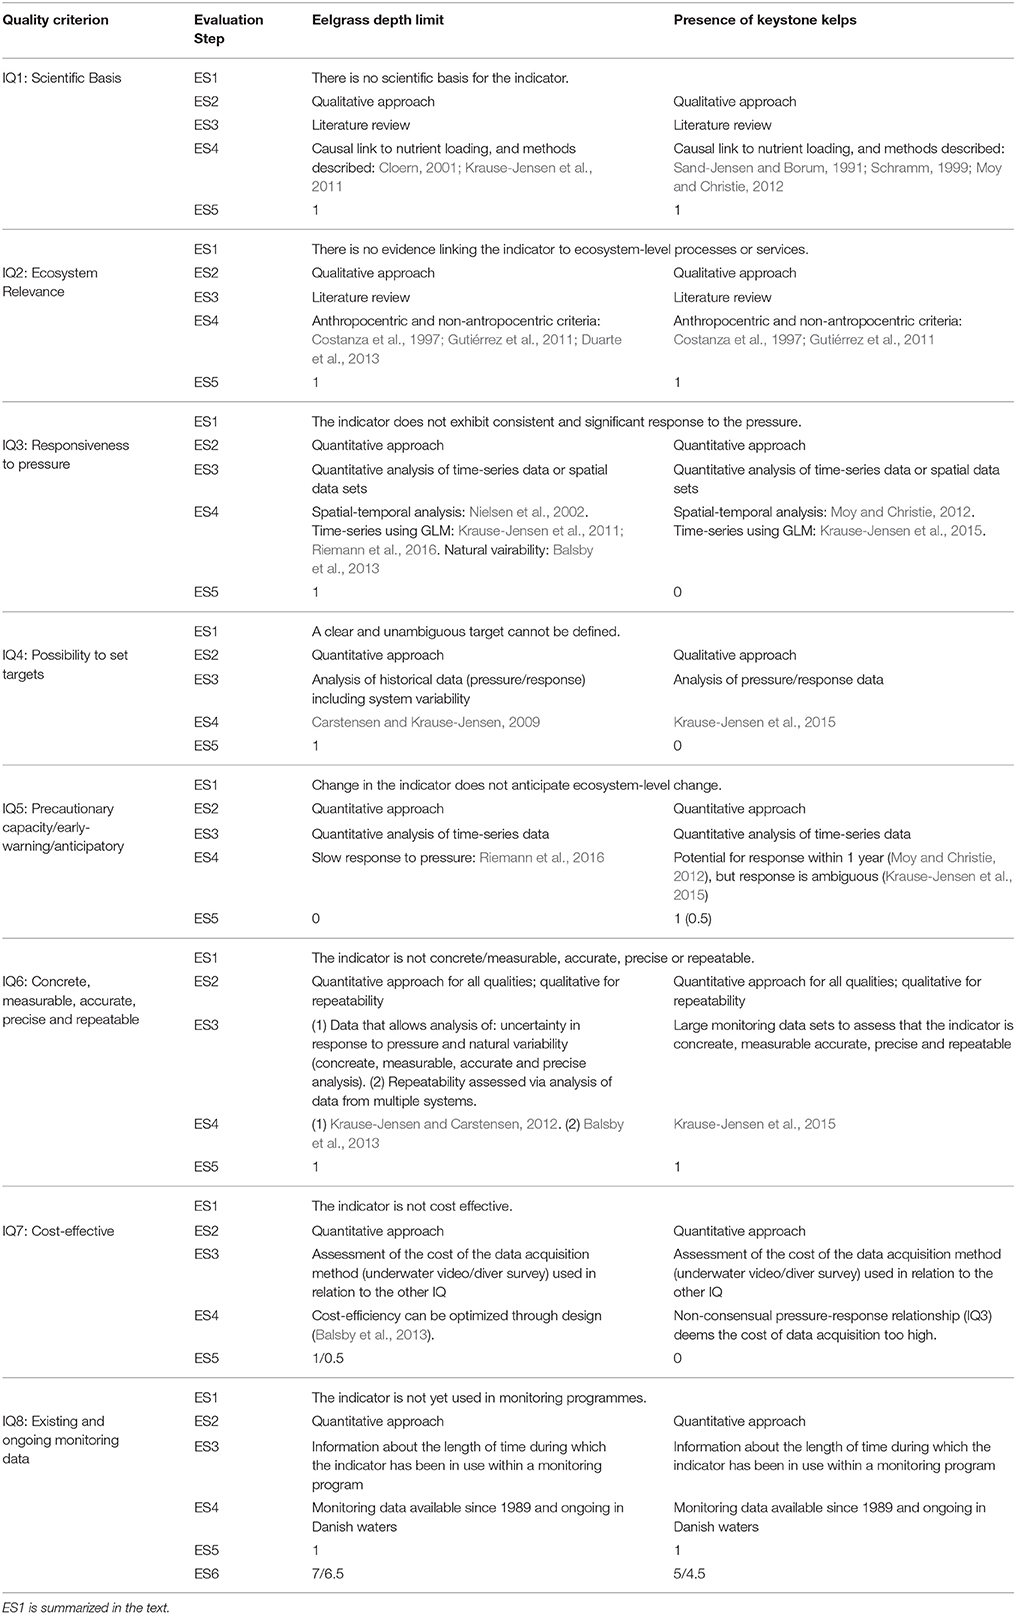
Table 3. Summary of quality assessment of the candidate benthic vegetation indicators “Presence of keystone kelp species” and “Eelgrass depth limit,” both relating to the MSFD indicator category “Distributional pattern (1.4.2), in association with the GEnS descriptors 1 and 5.
IQ 1. Scientific Basis
Both candidate indicators and their general responses to human driven nutrient loading pressure (causing eutrophication) are conceptually well founded in the scientific literature. More specifically, Duarte (1991) and Duarte et al. (2007) demonstrated a global trend that deeper seagrass meadows occur in clearer waters. This relationship is supported by studies in Danish coastal waters, where the depth limit of eelgrass is largest in the clearest waters with lowest nutrient concentrations (Nielsen et al., 2002; Greve and Krause-Jensen, 2005; Krause-Jensen et al., 2011). Markedly deeper meadows than those found at present were found during past periods of lower nutrient inputs (Boström et al., 2014). Similarly, spatio-temporal data from Norway's coast indicate declines in kelp forests in response to nutrient loading causing eutrophication (Moy and Christie, 2012). Therefore, literature exists that has linked both of these candidate indicators to eutrophication, which is listed by the MSFD as reflecting poor GEnS (descriptor 5). In addition, kelp forests and seagrass meadows constitute habitat for a vast diversity of species (Gutiérrez et al., 2011; Boström et al., 2014). Therefore, both indicators are also linked to the descriptor 1 (Biodiversity). Both candidate indicators therefore scored 1 in IQ1 (Table 3).
IQ 2. Ecosystem Relevance
Kelp forests and seagrass meadows are so-called keystone species and ecosystem engineers, providing a whole range of additional ecosystem functions and services including coastal protection, seafloor stabilization, carbon and nutrient retention, and promotion of water clarity (Costanza et al., 1997; Gutiérrez et al., 2011; Duarte et al., 2013). Both candidate indicators therefore scored 1 for IQ2 (for both descriptors), fulfilling the criterion of ecosystem relevance, from both anthropocentric and non-anthropocentric perspectives.
IQ 3. Responsiveness to Pressure
The trend of deeper seagrass meadows in clearer and less nutrient-rich waters has been demonstrated in the case-study system (Danish waters, Nielsen et al., 2002; Greve and Krause-Jensen, 2005; Krause-Jensen et al., 2011; Riemann et al., 2016) and globally (Duarte et al., 2007). It is, however, important to note that while response to increased nutrient pressure may be quick, the recovery of this vegetation following reduced nutrient inputs may require long time frames (Krause-Jensen et al., 2012; Duarte et al., 2015; Riemann et al., 2016). Hence, eelgrass depth limits have been found to exhibit no signs of improvement after 15 years of nutrient input reductions in a shallow German bay (Munkes, 2005) while in Danish coastal waters, recovery has been observed more than 2 decades after nutrient input reductions (Hansen, 2013; Riemann et al., 2016). Several sources of variability have been tested for eelgrass depth limits (a requirement to meet this IQ in the present framework), the most important being spatial variability, which must be carefully addressed in the planning of monitoring programs (Balsby et al., 2013). Hence, with respect to the responsiveness criterion, eelgrass depth limits scored 1 in IQ3.
With respect to the presence of kelps, spatio-temporal data from Norway's coast indicate declines in kelp forests in response to nutrient loading (and warming) causing eutrophication (Moy and Christie, 2012). By contrast, a recent Danish study showed no response of the presence of kelps to varying nutrient concentrations (Krause-Jensen et al., 2015) indicating that this candidate indicator is not sufficiently sensitive near the geographical distribution limit, where low salinity and high summer temperatures constrain growth (Nielsen et al., 2014). Kelp presence scored 0 in the binary scoring system. As this is one of the most important quality criteria (i.e., one of the two “one-out-all-out” criteria), the presence of kelps as indicators for descriptor 1 (and 5) of GEnS would be rejected under the current assessment framework.
IQ 4. Possibility to Set Targets
Historical information on eelgrass depth limits from a period with limited nutrient input can form a suitable basis for establishing targets for eelgrass depth extension in Danish coastal waters, and pressure-response relationships can also be used for target-setting (e.g., Carstensen and Krause-Jensen, 2009) whilst considering the natural variability of this candidate indicator. Conversely, no clear pressure-response relationship between presence of even the most common kelps in the area [Saccharina latissima (Linnaeus) and Laminaria digitata (Hudson)] and nutrient pressure can be established at present to support target setting for this candidate indicator. Therefore, seagrass depth scored 1 in IQ4, whilst keystone kelp presence scored 0 in this particular example. Targets for both species should always be identified for the particular areas of interest.
IQ 5. Precautionary Capacity/Early-Warning/Anticipatory
The early warning capacity of both candidate indicators assessed is limited. Eelgrass depth limits scored 0 on this criterion because of the slow response to nutrient input reduction as that recorded in Danish coastal waters (Riemann et al., 2016). This likely reflects a slow recovery of light conditions and general environmental conditions including sediment quality, suggesting feed-back mechanisms of the degraded ecosystem in play that maintain a degraded state (e.g., van der Heide et al., 2011; Duarte et al., 2015; Riemann et al., 2016). Kelps are relatively long-lived and have complex life cycles. However, there are examples from Skagerrak of disappearance as well as of recovery of S. latissima stands within 1 year (Moy and Christie, 2012). Therefore, the presence of kelps are scored higher than eelgrass depth limit in IQ5: 1 in the binary system and for S. latissima in this particular example; or 0.5 if in the three level system (ICES, 2013a), because the re-colonization potential depends on distance from source populations. Eelgrass depth limit is scored 0.
IQ 6. Quality of Sampling Method: Concrete/Measurable, Accurate, Precise, and Repeatable
Both candidate indicators are concrete/measurable and repeatable. The actual measurement methods involved in the quantifications of the candidate indicators rely solely on adequately measuring depth of seagrass meadows in one case, and identifying kelp species in the other. Both approaches are common enough in the scientific community that IQ6 should be met. Precision in the identification of response to pressure (a requirement defined for this IQ in the present framework) requires addressing factors contributing to the variability in the estimates. Several sources of variability have been tested for eelgrass depth limits, the most important being spatial variability which must be carefully addressed in the planning of monitoring programs (Balsby et al., 2013). As mentioned above, for kelp forest, the factors associated with variability are particularly relevant at the edge of their geographical distributions and this should be considered in any assessment. Given this analysis, both indicators are scored 1 in IQ6.
IQ 7. Cost-Effective
Both candidate indicators can be monitored either by diving or by the use of under-water video surveys, the latter speeding up the assessments and, in themselves, serving as documentation for the assessment. The design of monitoring programs can be optimized by combining information on sources of variability and cost assessments, as has been exemplified for eelgrass depth limits (Balsby et al., 2013). Video surveys could be preferred to diver-based surveys, because of the lowering cost of good quality imaging technologies. However, specialized operators are still required to identify the presence of seagrass species, and the acquisition of general habitat information. The presence of kelp is assigned a 0 score in IQ7 because the required effort to acquire data is seen as being too high given the context dependence of pressure-response relationships (see IQ3). Eelgrass depth limits are assigned a score of 1 in the binary system, and 0.5 in the three-way scoring system (ICES, 2013a), because responsiveness to pressure is good but the cost associated with data acquisition is still relatively high.
IQ8. Existing and Ongoing Monitoring Data
Data on both candidate indicators have been collected continuously since 1989 as part of the Danish National Aquatic Monitoring and Assessment Programme (DNAMAP) and regional monitoring activities. Therefore, both candidate indicators scored 1 in IQ8.
ES6. Sum of Quality Scores
Overall, eelgrass depth limit scored 7, and presence of keystone kelp scored 5 in the binary system. The corresponding scores were 6.5 and 4.5 in the three-way scoring system (Table 3). This quality analysis indicates that eelgrass depth limits is the preferable of the two candidate indicators for descriptors 1 and 5 (Table 3) responding to nutrient pressure in this case-study area. This results from a better pressure-response relationship and possibilities for target setting for eelgrass depth limits, although the presence of keystone kelps may potentially have better capacity as indicator of system recovery under these descriptors.
Discussion
The worked examples (Section Results and Supplementary Information) demonstrate the application of the proposed quality assessment framework for distinct types of candidate indicators and separate descriptors of GEnS. Despite these differences, the application of the framework was possible, and the worked examples are expected to provide guidance in future uses of this tool by highlighting the types of data sought, and how the evaluation steps should work. The structure of the quality assessment is particularly clear in tabular form (Table 3, and Tables S2, S3). The joint use of this format in support of the narrative form for reporting of the quality assessment is therefore recommended, because the former enables a quick and objective overview of the assessment process while detail is provided in the latter. This is seen as being particularly useful in the comparison of the quality of candidate indicators for the same descriptor within a region. In these cases, higher quality scoring is preferable because higher scoring within compared candidate indicators highlights which metric meets the MSFD assessment aims more closely.
However, implementation of the highest scoring candidate metric locally may not always be the preferred choice against, for instance, an overall aim to produce a standardized assessment across the MSFD participating parties. Specifically, it is likely that the quality score of individual metrics will vary between countries (and regions) given regional differences in data availability, skill set, costs, and resources available for data collection and analysis, among other constrains. Therefore, this testing framework would best support the decision making process, and indicator selection, if the approach was applied to candidate metrics at least at the country level, and ideally at sub-assessment region level. In this way, it could support a standardized indicator selection process through the determination of which specific candidate metrics score the highest across participating parties for each given descriptor. The clear representation of this quality assessment provides a consistent and objective structure to inform about what desired quality attributes each candidate indicator does or does not meet in each case, and the potential need for specific development in each case. A standardized format for the assessment table could be implemented to facilitate the application of the IQ-ES protocol within the MSFD assessment across the participating parties.
The structure imposed by the IQ-ES framework requires that the quality assessor maintains focus on what each IQ represents, and the provision of information about each assessment in a transparent manner, easily understandable by a third party. These characteristics are seen as being particularly useful in the implementation of the MSFD, in which at least some cross-border use of the same indicators will no doubt be necessary to ensure consistency within a standardized assessment. For instance, this quality assessment protocol (and particularly the tabular reporting of the IQ-ES assessment) is well placed to support the call of the Intersessional Correspondence Group on the Coordination of Biodiversity Assessment and Monitoring of the OSPAR Convention for the Protection of the Marine Environment of the North-East Atlantic, to ensure consistency in the testing of all common indicators. Indeed, the format for testing of candidate biodiversity indicators developed by that group fits well with the assessment structure presented here. In this study, as a starting point, we have applied this testing protocol successfully for three distinct descriptors (1, 5, and 6). Further testing could support its applicability to the other eight descriptors.
Scoring allows for similar indicators to be separated based on an objective analysis of their overall performance with regard to the aims of the MSFD assessment. This would allow MSFD parties considering candidate metrics available to them within their assessment region to determine their readiness to assess each descriptor of GEnS. To ensure continuity of the assessment between involved parties, the scoring system used for the quality assessment should exclude as much as possible user subjectivity, and the binary system used here could be seen as its simplest form. We compared this system with the three-way scoring system (ICES, 2013a,b) within the worked examples. For instance, the two benthic vegetation candidate indicators compared exhibited similar spread using both scoring systems (worked example I). It therefore seems that, despite the relatively higher complexity and subjectivity of the three-way scoring system compared to the binary system, the ability to discriminate quality between candidate metrics did not increase. Further testing could be used to determine the relative merit of the two systems within a wider basis of ecosystem components, descriptors and pressures considered by the MSFD, but our overall assessment is that the binary system would be preferred if the aim is to reduce user subjectivity in the quality evaluation.
Although a standardized approach is seen as being necessary to objectively assess the quality of GEnS indicators in support of the MSFD, additional weight associated with IQs 1 and 3 is acknowledged here (“scientific basis” and “responsiveness to pressure,” the one-out-all-out criteria). I.e., failing these IQs is seen here to preclude a failure to meet essential quality standards required for MSFD implementation. We recommend that even when IQs 1 and 3 are fulfilled, an indicator meeting only half or less of the IQs should, however, probably not be considered for implementation, unless no better alternatives exist. Overall, one of the main benefits of using quality scoring is that a minimum score could potentially be defined as the minimum quality standard below which the evaluated metric is not a suitable route to support the MSFD assessment. We suggest that this threshold could be 4 because a candidate indicator with a lower score only meets less than half of the components of quality desired within the assessment community. However, we stress that the use of this framework is not intended to define what is or is not an adequate GEnS indicator or to determine the outcome of the selection procedure, which will be constrained by a number of additional parameters and aims. What the IQ-ES framework provides is a transparent, standardized structure to enable comparison of the quality of candidate indicators and in this way support the decision making process leading to indicator selection.
The objective quality testing protocol suggested here, and the standardized format for the reporting of this assessment we propose, could guide parties seeking better indicators for a given descriptor toward solutions in indicators scoring high in quality in other regions, and further support consistency of the assessment across parties. Through its structure, the use of the IQ-ES framework could help to inform about what types of additional information or method development are lacking within the assessment of individual parties, once local-specific constrains have been identified.
We identify IQs 3 and 4 (“responsiveness to pressure” and “possibility to set targets”) as potential stumbling blocks in the quality assessment, and thus the comparison and selection of indicators. The outcomes of the evaluations of these two criteria may be more dependent upon the choice and adequacy of the analytical approaches employed, than on the indicator and data used in those assessments. Issues such as comparability of datasets between systems, the identification of effect sizes that account for natural variability, non-linear pressure-response relationships, uncertainty and spatial and temporal autocorrelation may require the use of robust quantitative data analysis methods. Generalized additive modeling (Hastie and Tibshirani, 1990), generalized linear models (Dobson, 2001), mixed effects modeling (Pinheiro and Bates, 2000), Meta-analysis statistics (Borenstein et al., 2011), mechanistic modeling and data assimilation (Hyder et al., 2015) and many other methods are therefore likely to be needed in many instances. In addition, high frequency data (e.g., those based on remote sensing) may require the application of suitable techniques such as spectral methods, to identify harmonic structures (Bloomfield, 2004). Whether the analysis technique used is adequate to the complexity of data at hand, the IQ tested for, the scale covered by the analysis (e.g., local c.f. regional), and the resources and expertise available in each case are therefore seen as essential components of the quality assessment of indicators with regard to these two criteria.
Finally, despite its timeliness and contribution toward objectivity within the MSFD indicator selection process, this study is not sufficiently comprehensive to cover the diversity of data, indicator, pressure, and habitat types associated with the 11 GEnS descriptors. However, it highlights important aspects requiring consideration within the assessment, which will only be as good as the indicators chosen and the strategies employed to monitor GEnS. Overall, standardized approaches such as this will be required to ensure consistency, and facilitate cross-border development and the sharing of knowledge during the MSFD implementation.
Author Contributions
AQ, DK, JS, KM, PS, JB, and JC conceptualized the manuscript. DK, AB, JC, RC, HN, SC, and AQ provided the worked examples. All authors contributed to the text.
Conflict of Interest Statement
The authors declare that the research was conducted in the absence of any commercial or financial relationships that could be construed as a potential conflict of interest.
The handling Editor declares that, despite being affiliated to the same institution as authors NP and MP, the review process was handled objectively.
Acknowledgments
This study was conceptualized and undertaken through the DEVOTES (Development of innovative Tools for understanding marine biodiversity and assessing good Environmental Status) project, funded by the European Union under the 7th Framework Programme, “The Ocean of Tomorrow” Theme (grant agreement no. 308392), www.devotes-project.eu. AQ and PS further acknowledge funding support from the Marine Ecosystems Research Programme (jointly funded by the UK Natural Environment Research Council and the UK Department for Environment, Food and Rural Affairs, contract agreement NE/L003279/1).
Supplementary Material
The Supplementary Material for this article can be found online at: https://www.frontiersin.org/article/10.3389/fmars.2016.00073
References
Anderson, D. M., Glibert, P. M., and Burkholder, J. M. (2002). Harmful algal blooms and eutrophication: nutrient sources, composition, and consequences. Estuaries 25, 704–726. doi: 10.1007/BF02804901
Balsby, T. J., Carstensen, J., and Krause-Jensen, D. (2013). Sources of uncertainty in estimation of eelgrass depth limits. Hydrobiologia 704, 311–323. doi: 10.1007/s10750-012-1374-8
Bloomfield, P. (2004). Fourier Analysis of Time Series: An Introduction. New York, NY: John Wiley & Sons.
Borenstein, M., Hedges, L. V., Higgins, J. P., and Rothstein, H. R. (2011). Introduction to Meta-Analysis. West Sussex, UK: John Wiley & Sons.
Borja, A., Elliott, M., Andersen, J. H., Cardoso, A. C., Carstensen, J., Ferreira, J. G., et al. (2013). Good Environmental Status of marine ecosystems: What is it and how do we know when we have attained it? Mar. Pollut. Bull. 76, 16–27. doi: 10.1016/j.marpolbul.2013.08.042
Borja, A., Galparsoro, I., and Franco, J. (2004). Observatorio de la Biodiversidad del Medio Marino de la Costa Vasca: Indicadores Medioambientales Marinos. Informe de la Fundaci3n AZTI para la Dirección de Biodiversidad del Departamento de Ordenación del Territorio y Medio Ambiente, del Gobierno Vasco, p. 115
Borja, A., Prins, T. C., Simboura, N., Andersen, J. H., Berg, T., Marques, J.-C., et al. (2014). Tales from a thousand and one ways to integrate marine ecosystem components when assessing the environmental status. Front. Mar. Sci. 1:72. doi: 10.3389/fmars.2014.00072
Boström, C., Baden, S., Bockelmann, A. C., Dromph, K., Fredriksen, S., Gustafsson, C., et al. (2014). Distribution, structure and function of Nordic eelgrass (Zostera marina) ecosystems: implications for coastal management and conservation. Aquat. Conserv. 24, 410–434. doi: 10.1002/aqc.2424
Bubinas, A., and Vaitonis, G. (2003). The analysis of the structure, productivity, and distribution of zoobenthocenoses in the Lithuanian economic zone of the Baltic Sea and the importance of some benthos species to fish diet. Acta Zool. Litu. 13, 114–124. doi: 10.1080/13921657.2003.10512555
Burrows, M. T., Smale, D., O'Connor, N., Rein, H. V., and Moore, P. (2014). Marine Strategy Framework Directive Indicators for UK Kelp Habitats Part 1: Developing Proposals for Potential Indicators. SAMS/MBA/QUB/UAber for JNCC Peterborough.
Carstensen, J., and Krause-Jensen, D. (2009). Fastlœggelse af Miljømål og Indsatsbehov ud fra Ålegrœs i de Indre Danske Farvende. Arbejdsrapport fra DMU nr. 256, Danmarks Miljøundersøgelser, Aarhus Universitet.
Carstensen, J., Conley, D. J., Andersen, J. H., and Ærtebjerg, G. (2006). Coastal eutrophication and trend reversal: A Danish case study. Limnol. Oceanogr. 51, 398–408. doi: 10.4319/lo.2006.51.1_part_2.0398
CBD (1999). Development of Indicators of Biological Diversity. Nairobi: Convention on Biological Diversity, subsidiary Body on Scientific, Technical and Technological Advice.
Chuševė, R., Nygård, H., Vaičiūė, D., Daunys, D., and Zaiko, A. (2016). Application of signal detection theory approach for setting thresholds in benthic quality assessments. Ecol. Indic. 60, 420–427. doi: 10.1016/j.ecolind.2015.07.018
Ciavatta, S., and Pastres, R. (2011). Exploring the long-term and interannual variability of biogeochemical variables in coastal areas by means of a data assimilation approach. Estuar. Coast. Shelf Sci. 91, 411–422. doi: 10.1016/j.ecss.2010.11.006
Cloern, J. E. (2001). Our evolving conceptual model of the coastal eutrophication problem. Mar. Ecol. Prog. Ser. 210, 223–253. doi: 10.3354/meps210223
Costanza, R., d'Arge, R., de Groot, R., Farber, S., Grasso, M., Hannon, B., et al. (1997). The value of the world's ecosystem services and natural capital. Nature 387, 253–260. doi: 10.1038/387253a0
Dale, V. H., and Beyeler, S. C. (2001). Challenges in the development and use of ecological indicators. Ecol. Indic. 1, 3–10. doi: 10.1016/S1470-160X(01)00003-6
Dixon, L., Kirkpatrick, G., Hall, E., and Nissanka, A. (2014). Nitrogen, phosphorus and silica on the West Florida Shelf: Patterns and relationships with Karenia spp. occurrence. Harmful Algae 38, 8–19. doi: 10.1016/j.hal.2014.07.001
Doren, R. F., Trexler, J. C., Gottlieb, A. D., and Harwell, M. C. (2009). Ecological indicators for system-wide assessment of the greater everglades ecosystem restoration program. Ecol. Indic. 9, S2–S16. doi: 10.1016/j.ecolind.2008.08.009
Duarte, C. M. (1991). Seagrass depth limits. Aquat. Bot. 40, 363–377. doi: 10.1016/0304-3770(91)90081-F
Duarte, C. M., Borja, A., Carstensen, J., Elliot, M., Krause-Jensen, D., and Marba, N. (2015). Paradigms in the recovery of estuarine and coastal ecosystems. Estuaries and Coasts 38, 1202–1212. doi: 10.1007/s12237-013-9750-9
Duarte, C. M., Losada, I. J., Hendriks, I. E., Mazarrasa, I., and Marbà, N. (2013). The role of coastal plant communities for climate change mitigation and adaptation. Nat. Clim. Chang. 3, 961–968. doi: 10.1038/nclimate1970
Duarte, C. M., Marbà, N., Krause-Jensen, D., and Sánchez-Camacho, M. (2007). Testing the predictive power of seagrass depth limit models. Estuar. Coasts 30, 652–656. doi: 10.1007/BF02841962
EC (2008). Marine Strategy Framework Directive. 2008/56/EC. Official Journal of the European Union, 19–40 in EU.
Elliott, M. (2011). Marine science and management means tackling exogenic unmanaged pressures and endogenic managed pressures–a numbered guide. Mar. Pollut. Bull. 62, 651–655. doi: 10.1016/j.marpolbul.2010.11.033
EU (2014). Establishing a Framework for Maritime Spatial Planning. 2014/89/EU. Brussels: Official Journal of the European Union.
Fleischer, D., Grémare, A., Labrune, C., Rumohr, H., Berghe, E. V., and Zettler, M. L. (2007). Performance comparison of two biotic indices measuring the ecological status of water bodies in the Southern Baltic and Gulf of Lions. Mar. Pollut. Bull. 54, 1598–1606. doi: 10.1016/j.marpolbul.2007.06.011
Fleischer, D., and Zettler, M. L. (2009). An adjustment of benthic ecological quality assessment to effects of salinity. Mar. Pollut. Bull. 58, 351–357. doi: 10.1016/j.marpolbul.2008.10.016
Graneli, E., Weberg, M., and Salomon, P. S. (2008). Harmful algal blooms of allelopathic microalgal species: the role of eutrophication. Harmful Algae 8, 94–102. doi: 10.1016/j.hal.2008.08.011
Greve, T., and Krause-Jensen, D. (2005). Predictive modelling of eelgrass (Zostera marina) depth limits. Mar. Biol. 146, 849–858. doi: 10.1007/s00227-004-1498-0
Gutiérrez, J. L., Jones, C. G., Byers, J. E., Arkema, K. K., Berkenbusch, K., Commito, J. A., et al. (2011). Physical ecosystem engineers and the functioning of estuaries and coasts, in Treatise on Estuarine and Coastal Science, Vol. 7, eds E. Wolanski and D. S. McLusky (Waltham, MA: Academic Press), 53–81.
Haines-Young, R., and Potschin, M. (2013). Common International Classification of Ecosystem Services (CICES): Consultation on Version 4, August–December 2012 (EEA Framework Contract No EEA/IEA/09/003).
Hale, S. S., and Heltshe, J. F. (2008). Signals from the benthos: development and evaluation of a benthic index for the nearshore Gulf of Maine. Ecol. Indic. 8, 338–350. doi: 10.1016/j.ecolind.2007.04.004
Halliday, S., Skeffington, R., Wade, A., Neal, C., Reynolds, B., Norris, D., et al. (2013). Upland streamwater nitrate dynamics across decadal to sub-daily timescales: a case study of Plynlimon, Wales. Biogeosciences 10, 8013–8038. doi: 10.5194/bg-10-8013-2013
Hansen, J. (2013). Marine områder (2012). NOVANA. Videnskabelig rapport fra DCE-Nationalt Center for Miljø og Energi, Aarhus Universitet, DCE–Nationalt Center for Miljø og Energi, 162 s.
Harwell, M. A., Myers, V., Young, T., Bartuska, A., Gassman, N., Gentile, J. H., et al. (1999). A framework for an ecosystem integrity report card. Bioscience 49, 543–556. doi: 10.2307/1313475
Hastie, T. J., and Tibshirani, R. J. (1990). Generalized Additive Models. London: Chapman and Hall/CRC.
HELCOM (2012). Development of a set of core indicators: interim report of the HELCOM CORESET project. Part A. Description of the selection process, in Baltic Sea Environment Proceedings. No. 129A.
Hoagland, P., and Scatasta, S. (2006). Ecology of harmful algae, in The Economic Effects of Harmful Algal Blooms, eds E. Granéli and J. T. Turner (Springer), 391–402.
Hummel, H., Frost, M., Juanes, J. A., Kochmann, J., Bolde, C. F. C. P., Aneiros, F., et al. (2015). A comparison of the degree of implementation of marine biodiversity indicators by European countries in relation to the Marine Strategy Framework Directive (MSFD). J. Mar. Biol. Assoc. U.K. 95, 1519–1531. doi: 10.1017/S0025315415000235
Hyder, K., Rossberg, A. G., Allen, J. I., Austen, M. C., Barciela, R. M., Bannister, H. J., et al. (2015). Making modelling count-increasing the contribution of shelf-seas community and ecosystem models to policy development and management. Mar. Policy 61, 291–302. doi: 10.1016/j.marpol.2015.07.015
ICES (2013a). OSPAR Special Request on Review of the Technical Specification and Application of Common Indicators under D1, D2, D4, and D6. Report of the ICES Advisory Committee (2013). ICESAdvice, (2013). International Council for the Exploration of the Sea, Denmark.
ICES (2013b). Report of the Working Group on the Ecosystem Effects of Fishing Activities (WGECO). Headquarters, Copenhagen.
ICES (2015). Report of the Working Group on Biodiversity Science (WGBIODIV), ICES Headquarters, Copenhagen.
James, C. A., Kershner, J., Samhouri, J., O'Neill, S., and Levin, P. S. (2012). A methodology for evaluating and ranking water quantity indicators in support of ecosystem-based management. Environ. Manage. 49, 703–719. doi: 10.1007/s00267-012-9808-7
Jackson, L. E., Kurtz, J., and Fisher, W. S. (2000). Evaluation Guidelines for Ecological Indicators. Durham, NC: Environmental Protection Agency, Office of Research and Development.
JCN/HBDSEG (2012). Final Project Report C2343: Environmental Indicators: A Structured Approach to the Evaluation of Impacts Arising from Human Activities at Sea (by CEFAS and IECS, funded by Defra). Available online at: http://sciencesearch.defra.gov.uk/Default.aspx?Menu=Menu&Module=More&Location=None&Completed=0&ProjectID=13013
Jennings, S. (2005). Indicators to support an ecosystem approach to fisheries. Fish Fish. 6, 212–232. doi: 10.1111/j.1467-2979.2005.00189.x
Jørgensen, S. E., Xu, L., and Costanza, R. (2010). Handbook of Ecological Indicators for Assessment of Ecosystem Health. Boca Ratan, FL: CRC press.
Kendall, M., and Widdicombe, S. (1999). Small scale patterns in the structure of macrofaunal assemblages of shallow soft sediments. J. Exp. Mar. Biol. Ecol. 237, 127–140. doi: 10.1016/S0022-0981(98)00224-X
Kershner, J., Samhouri, J. F., James, C. A., and Levin, P. S. (2011). Selecting indicator portfolios for marine species and food webs: a Puget Sound case study. PLoS One 6:e25248. doi: 10.1371/journal.pone.0025248
Krause-Jensen, D., Bruhn, A., Queiros, A., Bruun, J., Somerfield, P., Mazik, K., et al. (2015). Report on the Criteria for Good Indicators Selection. Deliverable 3.2. DEVOTES, EU. Available online at: http://www.devotes-project.eu
Krause-Jensen, D., and Carstensen, J. (2012). Udvikling i ålegræssets dybdeudbredelse i udvalgte områder, Chap. 12, in Marine områder 2011. NOVANA, ed J. W. Hansen (Aarhus Universitet, DCE - Danish Centre for Environment and Energi), 154. Scientific Report from DCE no. 34 (Danish with English summary). Available online at: http://www.dmu.dk/Pub/SR34.pdf
Krause-Jensen, D., Carstensen, J., Nielsen, S. L., Dalsgaard, T., Christensen, P. B., Fossing, H., et al. (2011). Sea bottom characteristics affect depth limits of eelgrass Zostera marina. Mar. Ecol. Prog. Ser. 425, 91–102. doi: 10.3354/meps09026
Krause-Jensen, D., Markager, S., and Dalsgaard, T. (2012). Benthic and pelagic primary production in different nutrient regimes. Estuar. Coasts 35, 527–545. doi: 10.1007/s12237-011-9443-1
Kurtz, J. C., Jackson, L. E., and Fisher, W. S. (2001). Strategies for evaluating indicators based on guidelines from the Environmental Protection Agency's Office of Research and Development Ecological Indicators. Ecol. Indic. 1, 49–60. doi: 10.1016/S1470-160X(01)00004-8
Landres, P. B., Verner, J., and Thomas, J. W. (1988). Ecological uses of vertebrate indicator species: a critique. Conserv. Biol. 2, 316–328. doi: 10.1111/j.1523-1739.1988.tb00195.x
Leonardsson, K., Blomqvist, M., Magnusson, M., Wikström, A., and Rosenberg, R. (2015). Calculation of species sensitivity values and their precision in marine benthic faunal quality indices. Mar. Pollut. Bull. 93, 94–102. doi: 10.1016/j.marpolbul.2015.02.010
Leonardsson, K., Blomqvist, M., and Rosenberg, R. (2009). Theoretical and practical aspects on benthic quality assessment according to the EU-Water Framework Directive–examples from Swedish waters. Mar. Pollut. Bull. 58, 1286–1296. doi: 10.1016/j.marpolbul.2009.05.007
Marbà, N., Krause-Jensen, D., Alcoverro, T., Birk, S., Pedersen, A., Neto, J. M., et al. (2013). Diversity of European seagrass indicators: patterns within and across regions. Hydrobiologia 704, 265–278. doi: 10.1007/s10750-012-1403-7
Mazik, K., Boyes, S., McManus, E., Ducrotoy, J.-P., Rogers, S., and Elliott, M. (2010). Healthy and Biologically Diverse Seas Evidence Group: Evaluation and Gap Analysis of Current and Potential Indicators for Sediment Habitats. Technical Report Series, United Kingdom Marine Monitoring and Assessment Strategy (UKMMAS), JNCC, Peterborough, 47.
MEA (2005). Ecosystems and Human Well-Being: Our Human Planet: Summary for Decision Makers. Washington, DC: Island Press.
Mee, D., Efferson, R., Affoley, D. A., and Elliott, M. (2008). Review: how good is good? Human values and Europe's proposed Marine Strategy Directive. Mar. Pollut. Bull. 56, 187–204.
Moy, F. E., and Christie, H. (2012). Large-scale shift from sugar kelp (Saccharina latissima) to ephemeral algae along the south and west coast of Norway. Mar. Biol. Res. 8, 309–321. doi: 10.1080/17451000.2011.637561
Munkes, B. (2005). Eutrophication, phase shift, the delay and the potential return in the Greifswalder Bodden, Baltic Sea. Aquat. Sci. 67, 372–381. doi: 10.1007/s00027-005-0761-x
Murtaugh, P. A. (1996). The statistical evaluation of ecological indicators. Ecol. Appl. 6, 132–139. doi: 10.2307/2269559
Nielsen, M. M., Krause-Jensen, D., Olesen, B., Thinggaard, R., Christensen, P. B., and Bruhn, A. (2014). Biomass and growth dynamics of Saccharina latissima (Laminariales, Phaeophyceae) in a temperate embayment and along the species distribution range. Mar. Biol. 161, 2011–2022.
Nielsen, S. L., Sand-Jensen, K., Borum, J., and Geertz-Hansen, O. (2002). Depth colonization of eelgrass (Zostera marina) and macroalgae as determined by water transparency in Danish coastal waters. Estuaries 25, 1025–1032. doi: 10.1007/BF02691349
Niemeijer, D., and de Groot, R. S. (2008). A conceptual framework for selecting environmental indicator sets. Ecol. Indic. 8, 14–25. doi: 10.1016/j.ecolind.2006.11.012
Noss, R. F. (1990). Indicators for monitoring biodiversity: a hierarchical approach. Conserv. Biol. 4, 355–364. doi: 10.1111/j.1523-1739.1990.tb00309.x
O'Connor, J. S., and Dewling, R. T. (1986). Indices of marine degradation: their utility. Environ. Manage. 10, 335–343. doi: 10.1007/BF01867257
OECD (2001). OECD Environmental Indicators: Towards Sustainable Development. Paris: Organisation for Economic Co- operation and Development.
Olenin, S., and Daunys, D. (2004). Coastal typology based on benthic biotope and community data: the Lithuanian case study, in Baltic Sea Typology Coastline Reports, Vol. 4, eds G. Schernewski and M. Wielgat (Leiden: EUCC-The Coastal Union), 65–84.
Olenin, S., Daunys, D., and Labanauskas, V. (1996). Classification principles of the Lithuanian coastal biotopes. Ann. Geogr. 29, 218–231.
OSPAR (2013). Report by ICG-COBAM on the Development of an OSPAR Common Set of Biodiversity Indicators. BDC 13/4/2-E. Prepared by the OSPAR Intersessional Correspondence Group on the Coordination of Biodiversity Assessment and Monitoring (ICG-COBAM).
Pannell, D. J., and Glenn, N. A. (2000). A framework for the economic evaluation and selection of sustainability indicators in agriculture. Ecol. Econ. 33, 135–149. doi: 10.1016/S0921-8009(99)00134-2
Pastres, R., Ciavatta, S., Cossarini, G., and Solidoro, C. (2003). Sensitivity analysis as a tool for the implementation of a water quality regulation based on the maximum permissible loads policy. Reliab. Eng. Syst. Saf. 79, 239–244. doi: 10.1016/S0951-8320(02)00235-1
Pearson, T. H., and Rosenberg, R. (1978). Macrobenthic succession in relation to organic enrichment and pollution of the marine environment. Oceanogr. Mar. Biol. Annu. Rev. 16, 229–311.
Pinheiro, J. C., and Bates, D. M. (2000). Mixed-Effects Models in S and S-Plus. New York, NY: Springer-Verlag.
Queirós, A. M., Stephens, N., Cook, R., Ravaglioli, C., Nunes, J., Dashfield, S., et al. (2015). Can benthic community structure be used to predict the process of bioturbation in real ecosystems? Prog. Oceanogr. 137, 559–569. doi: 10.1016/j.pocean.2015.04.027
Rice, J. (2003). Environmental health indicators. Ocean Coast. Manag. 46, 235–259. doi: 10.1016/S0964-5691(03)00006-1
Rice, J., Arvanitidis, C., Borja, A., Frid, C., Hiddink, J. G., Krause, J., et al. (2012). Indicators for sea-floor integrity under the European marine strategy framework directive. Ecol. Indic. 12, 174–184. doi: 10.1016/j.ecolind.2011.03.021
Rice, J. C., and Rochet, M.-J. (2005). A framework for selecting a suite of indicators for fisheries management. ICES J. Mar. Sci. 62, 516–527. doi: 10.1016/j.icesjms.2005.01.003
Riemann, B., Carstensen, J., Dahl, K., Fossing, H., Hansen, J. W., Jakobsen, H. H., et al. (2016). Recovery of Danish coastal ecosystems after reductions in nutrient loading: a holistic ecosystem approach. Est. Coasts 39, 82–97. doi: 10.1007/s12237-015-9980-0
Rosenberg, R., Blomqvist, M. C., Nilsson, H., Cederwall, H., and Dimming, A. (2004). Marine quality assessment by use of benthic species-abundance distributions: a proposed new protocol within the European Union Water Framework Directive. Mar. Pollut. Bull. 49, 728–739. doi: 10.1016/j.marpolbul.2004.05.013
Rossberg, A. G., Uusitalo, L., Berg, T., Zaiko, A., Chenuil-Maurel, A., Uyarra, M. C., et al. (2013). Choosing Indicators and Their Target Ranges to Assess Sustainable Use of Marine Ecosystems. Milestone Report 13 of DEVOTES Project, 4–30.
Sand-Jensen, K., and Borum, J. (1991). Interactions among phytoplankton, periphyton and macrophytes in temperate freshwaters and estuaries. Aquat. Bot. 41, 137–175. doi: 10.1016/0304-3770(91)90042-4
Schomaker, M. (1997). Development of Environmental Indicators in UNEP. Rome: FAO Land and Water Bulletin (FAO)
Schramm, W. (1999). Factors influencing seaweed responses to eutrophication: some results from EU-project EUMAC. J. Appl. Phycol. 11, 69–78. doi: 10.1023/A:1008076026792
Schwarz, G. (1978). Estimating the dimension of a model. Ann. Stat. 6, 461–464. doi: 10.1214/aos/1176344136
Šiaulys A Zaiko A Daunys D. (2011). Assessment of Benthic Quality Status in the Lithuanian Coastal Waters Based on the Benthic Quality Index (BQI). Technical Report: Norwegian Financial Mechanism/Project: A system for the sustainable management of Lithuanian marine resources using novel surveillance, modeling tools and ecosystem approach, Klaipeda, 13.
Soetaert, K., Middelburg, J. J., Heip, C., Meire, P., Van Damme, S., and Maris, T. (2006). Long-term change in dissolved inorganic nutrients in the heterotrophic Scheldt estuary (Belgium, the Netherlands). Limnol. Oceanogr. 51, 409–423. doi: 10.4319/lo.2006.51.1_part_2.0409
Sokal, R. R., and Rohlf, F. J. (1969). The Principles and Practice of Statistics in Biological Research. San Francisco, CA: WH Freeman and company.
Teixeira, H., Berg, T., Fürhaupter, K., Uusitalo, L., Papadopoulou, N., Bizsel, K. C., et al. (2014). Existing Biodiversity, Non-Indigenous Species, Food-Web and Seafloor Integrity GEnS Indicators (DEVOTES Deliverable 3.1) DEVOTES FP7 Project. 198. Available online at: http://www.devotes-project.eu
van der Heide, T., van Nes, E. H., van Katwijk, M. M., Olff, H., and Smolders, A. J. (2011). Positive feedbacks in seagrass ecosystems–evidence from large-scale empirical data. PLoS ONE 6:e16504. doi: 10.1371/journal.pone.0016504
Van Hoey, G., Permuy, D. C., Vandendriessche, S., Vincx, M., and Hostens, K. (2013). An ecological quality status assessment procedure for soft-sediment benthic habitats: Weighing alternative approaches. Ecol. Indic. 25, 266–278. doi: 10.1016/j.ecolind.2012.09.024
Whitlatch, R. B., Lohrer, A. M., Thrush, S. F., Pridmore, R. D., Hewitt, J. E., Cummings, V. J., et al. (1998). Scale-dependent benthic recolonization dynamics: life stage-based dispersal and demographic consequences. Hydrobiologia 375, 217–226. doi: 10.1023/A:1017084217011
Widdicombe, S., McNeill, C. L., Stahlb, H., Taylorb, P., Queir3sa, A. M., Nunesa, J., et al. (2015). Impact of sub-seabed CO2 leakage on macrobenthic community structure and diversity. Int. J. Greenhouse Gas Control 38, 182–192. doi: 10.1016/j.ijggc.2015.01.003
Young, P. C., Pedregal, D. J., and Tych, W. (1999). Dynamic harmonic regression. J. Forecast. 18, 369–394. doi: 10.1002/(SICI)1099-131X(199911)18:6<369::AID-FOR748>3.0.CO;2-K
Keywords: ecosystems, European union, good environmental status, indicator, marine strategy framework directive, pressure, water framework directive (WFD)
Citation: Queirós AM, Strong JA, Mazik K, Carstensen J, Bruun J, Somerfield PJ, Bruhn A, Ciavatta S, Flo E, Bizsel N, Özaydinli M, Chuševė R, Muxika I, Nygard H, Papadopoulou N, Pantazi M and Krause-Jensen D (2016) An Objective Framework to Test the Quality of Candidate Indicators of Good Environmental Status. Front. Mar. Sci. 3:73. doi: 10.3389/fmars.2016.00073
Received: 12 February 2016; Accepted: 28 April 2016;
Published: 26 May 2016.
Edited by:
Christos Dimitrios Arvanitidis, Hellenic Centre for Marine Research, GreeceReviewed by:
Melih Ertan Çinar, Ege University, TurkeyMatt Terence Frost, Marine Biological Association, UK
Copyright © 2016 Queirós, Strong, Mazik, Carstensen, Bruun, Somerfield, Bruhn, Ciavatta, Flo, Bizsel, Özaydinli, Chuševė, Muxika, Nygård, Papadopoulou, Pantazi and Krause-Jensen. This is an open-access article distributed under the terms of the Creative Commons Attribution License (CC BY). The use, distribution or reproduction in other forums is permitted, provided the original author(s) or licensor are credited and that the original publication in this journal is cited, in accordance with accepted academic practice. No use, distribution or reproduction is permitted which does not comply with these terms.
*Correspondence: Ana M. Queirós, anqu@pml.ac.uk