Using 67Cu to Study the Biogeochemical Cycling of Copper in the Northeast Subarctic Pacific Ocean
 David M. Semeniuk1*†
  Randelle M. Bundy2†
  Anna M. Posacka1 Marie Robert3
  Katherine A. Barbeau2 Maria T. Maldonado1
- 1Department of Earth, Ocean, and Atmospheric Sciences, University of British Columbia, Vancouver, BC, Canada
- 2Scripps Institution of Oceanography, University of California San Diego, La Jolla, CA, USA
- 3Institute of Ocean Sciences, Fisheries and Oceans Canada, Sidney, BC, Canada
Microbial copper (Cu) nutrition and dissolved Cu speciation were surveyed along Line P, a coastal to open ocean transect that extends from the coast of British Columbia, Canada, to the high-nutrient-low-chlorophyll (HNLC) zone of the northeast subarctic Pacific Ocean. Steady-state size fractionated Cu uptake rates and Cu:C assimilation ratios were determined at in situ Cu concentrations and speciation using a 67Cu tracer method. The cellular Cu:C ratios that we measured (~30 μmol Cu mol C−1) are similar to recent estimates using synchrotron x-ray fluorescence (SXRF), suggesting that the 67Cu method can determine in situ metabolic Cu demands. We examined how environmental changes along the Line P transect influenced Cu metabolism in the sub-microplankton community. Cellular Cu:C assimilation ratios and uptake rates were compared with net primary productivity, bacterial abundance and productivity, total dissolved Cu, Cu speciation, and a suite of other chemical and biological parameters. Total dissolved Cu concentrations ([Cu]d) were within a narrow range (1.5–2.8 nM), and Cu was bound to a ~5-fold excess of strong ligands with conditional stability constants (KCuL,Cu2+cond) of ~1014. Free Cu2+ concentrations were low (pCu 14.4–15.1), and total and size fractionated net primary productivity (NPPV; μg C L−1 d−1) were negatively correlated with inorganic Cu concentrations ([Cu′]). We suggest this is due to greater Cu′ drawdown by faster growing phytoplankton populations. Using the relationship between [Cu′] drawdown and NPPV, we calculated a regional photosynthetic Cu:C drawdown export ratio between 1.5 and 15 μmol Cu mol C−1, and a mixed layer residence time (2.5–8 years) that is similar to other independent estimates (2–12 years). Total particulate Cu uptake rates were between 22 and 125 times faster than estimates of Cu export; this is possibly mediated by rapid cellular Cu uptake and efflux by phytoplankton and bacteria or the effects of grazers and bacterial remineralization on dissolved Cu. These results provide a more detailed understanding of the interactions between Cu speciation and microorganisms in seawater, and suggest that marine phytoplankton modify Cu speciation in the open ocean.
Introduction
While it is well established that iron (Fe) availability limits primary productivity in up to 40% of the global surface oceans (Moore et al., 2004; Boyd et al., 2007), other trace elements may exert influence over phytoplankton community composition and growth. Copper (Cu) is unique because it is a required micronutrient (e.g., Palenik and Morel, 1991; Chadd et al., 1996; Maldonado et al., 2006; Peers and Price, 2006), but it can also be toxic to marine phytoplankton at relatively low concentrations (Sunda and Huntsman, 1983; Brand et al., 1986; Moffett et al., 1997; Mann et al., 2002; Levy et al., 2007). Indeed, limited field evidence suggests that Cu may be causing toxicity to coastal phytoplankton communities (Moffett et al., 1997; Jordi et al., 2012). Despite the potential nutritional and toxic effects of Cu in marine phytoplankton, little is known about how Cu is influencing planktonic rate processes in unpolluted, open ocean environments.
Both the concentration and speciation of a metal will determine whether it is limiting or toxic to marine phytoplankton (Hudson, 1998; Sunda, 2012). Copper is bound to a suite of strong and weak organic ligands in seawater, resulting in >99.9% of the dissolved Cu being complexed, and free Cu2+ concentrations of 10−13.5 to 10−16.3 M (van den Berg, 1984; Coale and Bruland, 1988; Moffett and Dupont, 2007; Buck et al., 2010; Bundy et al., 2013; Jacquot et al., 2013; Thompson et al., 2014; Heller and Croot, 2015; Jacquot and Moffett, 2015). Free Cu2+ makes up ~4% of the total inorganic Cu (Cu′) pool, with the remainder dominated by CuCO3 and CuOH− (Turner et al., 1981). Early physiological work proposed that Cu′, but not organically complexed Cu, was the substrate for transporters in marine phytoplankton when [Cu′] was high (Sunda and Guillard, 1976; Anderson and Morel, 1978; Sunda and Huntsman, 1995). The total dissolved Cu concentration in the surface ocean (0.2–3 nM) is similar to [Cu′] that causes toxicity in many phytoplankton species (>0.1 nM; Brand et al., 1986). Thus, it was proposed that the Cu-binding ligands found in seawater are produced by Cu-sensitive prokaryotes to complex Cu′, thereby detoxifying it (Moffett and Brand, 1996; Moffett et al., 1997; Croot et al., 2000; Gordon et al., 2000; Mann et al., 2002; Wiramanaden et al., 2008). However, some organically complexed Cu appears to be bioavailable to eukaryotic marine phytoplankton (Hudson, 1998; Quigg et al., 2006; Guo et al., 2010; Semeniuk et al., 2015; Walsh et al., 2015). Thus, organic ligands may play a variety of roles in mediating Cu availability to different marine plankton groups.
The buffering of low [Cu′] by strong organic ligands may have negative effects on eukaryotic marine phytoplankton growth. Indeed, some Fe-limited phytoplankton have higher metabolic dependencies on Cu (Peers et al., 2005; Annett et al., 2008; Semeniuk et al., 2009; Guo et al., 2012; Biswas et al., 2013). This may be due to upregulation of the Cu-containing photosynthetic electron shuttle plastocyanin and the multiple-Cu containing oxidase component of a high affinity Fe transport system in diatoms (Maldonado et al., 2006; Peers and Price, 2006; Kustka et al., 2007). Recent surveys of Cu speciation in surface waters (e.g., Moffett and Dupont, 2007; Buck et al., 2010; Bundy et al., 2013; Jacquot et al., 2013; Thompson et al., 2014; Jacquot and Moffett, 2015) have reported [Cu′] low enough (< 10−14 M) to co-limit the growth of Fe-limited phytoplankton communities (Peers et al., 2005; Annett et al., 2008; Guo et al., 2012). Only a handful of large volume incubation process studies have examined the influence of Cu on Fe-limited phytoplankton, and conflicting evidence for and against Fe-Cu co-limitation has emerged (Coale, 1991; Peers et al., 2005; Wells et al., 2005; Kustka et al., 2015; Semeniuk et al., 2016). Additional work evaluating in situ metal bioavailability and the link between metabolic Cu and Fe requirements of natural phytoplankton assemblages is warranted.
There has been a recent surge of metal speciation data in seawater in concert with the international GEOTRACES program. However, few studies have examined how in situ trace metal speciation influences either metal bioavailability to marine phytoplankton and bacteria, or planktonic rate processes in surface oceans. Few tools are available to examine in situ cellular metal concentrations and accumulation rates, and each has unique advantages and disadvantages. Measurements of total bulk particulate metals provide precise particulate metal concentration data, but these include unknown lithogenic contributions that must be corrected (reviewed by Lam et al., 2015). Metal quotas of single cells have been reported using synchrotron X-ray fluorescence, but this method is resource and technically intensive and is currently undertaken by only one group (e.g., Twining et al., 2003). Commercially available radioisotopes and enriched stable isotopes can be used to track cellular metal assimilation (e.g., Maldonado and Price, 1999; Dupont et al., 2010; Cox et al., 2014). Although small isotope additions are made, they are often higher than in situ concentrations in order to overcome instrumental detection limits. Thus, what controls in situ rates of trace metal uptake by plankton inhabiting oceanic waters remains largely unknown.
Using the carrier free short-lived gamma emitting radioisotope 67Cu (t1∕2 = 2.58 days), we made the first measurements of Cu assimilation in natural phytoplankton assemblages without significantly altering in situ Cu chemistry (Semeniuk et al., 2009, 2015). This is enabled by the relatively high concentration of dissolved Cu in surface seawater compared to other trace mineral nutrients (e.g., iron, < 0.1 nM), and the high specific activity of 67Cu. In the present study, we expand on our early work by measuring Cu assimilation at many stations and depths, which allows us to assess how well the 67Cu tracer assays compare with previous laboratory and field studies. We use the tracer to determine how prokaryotic and eukaryotic Cu assimilation co-varies with Cu concentration, speciation, and a suite of biological and chemical parameters along Line P, a coastal-open ocean transect that extends from the British Columbia coast to the low-Fe surface waters in the northeast subarctic Pacific Ocean. In addition to contributing measurements of total dissolved Cu and Cu speciation for surface waters in this region, this dataset provides an opportunity to examine possible relationships between Cu chemistry and planktonic rate processes across high and low Fe-containing surface waters across a large geographical region.
Materials and Methods
Plastic Cleaning
All plastics were rigorously cleaned in Class 100 conditions before the cruise. The polycarbonate bottles used for the Cu uptake assays, Cu:C assimilation ratios, and primary productivity measurements were cleaned for 1 week each with 3% Extran, 6 M HCl, and 1 M HNO3 and were rinsed thoroughly with ultra-pure water (18 MΩ cm resistivity; Millipore) between each cleaning step. Sample bottles for dissolved metals (250 mL low-density polyethylene; LDPE) and Cu ligands (500 mL LDPE) were cleaned according to GEOTRACES protocols (Cutter et al., 2010).
Experimental Design and Execution
Net primary productivity, phytoplankton biomass, total dissolved Cu concentrations, Cu speciation, Cu:C assimilation ratios, Cu uptake rates, and a suite of other variables were surveyed at multiple depths along the Line P transect (Tables 1–3; Figure 1). The depths sampled were in the mixed layer and subsurface chlorophyll maximum at each station, with light intensities spanning an order of magnitude (Table 2; Figure 2). The depths and stations sampled represent waters that may be influenced by coastal processes (P3), macronutrient limited coastal (P4) and oceanic (P12) waters, as well as Fe-limited oceanic waters (P16 and P26) (Boyd and Harrison, 1999; Whitney and Freeland, 1999; Peña and Varela, 2007). The diverse light and nutrient regimes in surface waters along Line P provide a range of physical and chemical variation that may influence Cu nutrition in marine phytoplankton and bacteria.
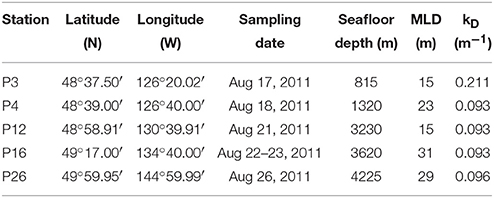
Table 1. Locations, sampling dates, seafloor depths, mixed layer depths, and kD of the stations sampled along Line P in August, 2011.
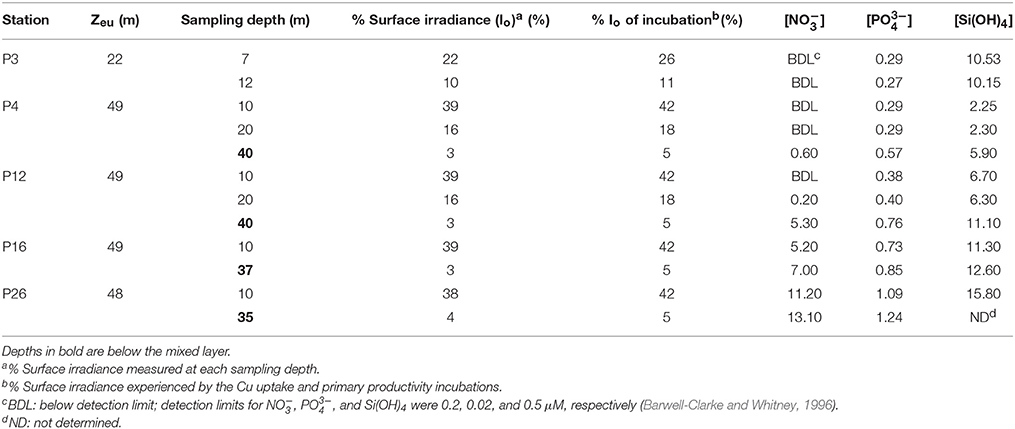
Table 2. Light intensities, euphotic zone depth (Zeu), and macronutrient concentrations (μM) at each sampling depth along Line P.
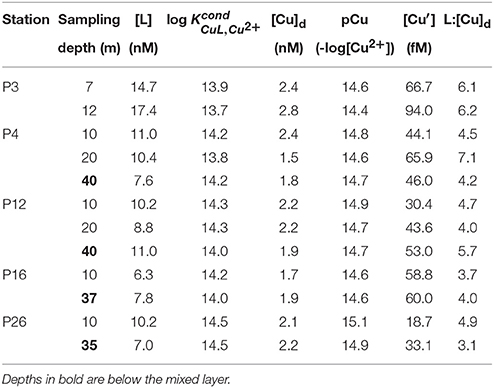
Table 3. Total dissolved Cu, ligand concentrations, conditional stability constants, inorganic Cu concentration, and the dissolved [L]:[Cu]d ratio at each sampling depth along Line P.
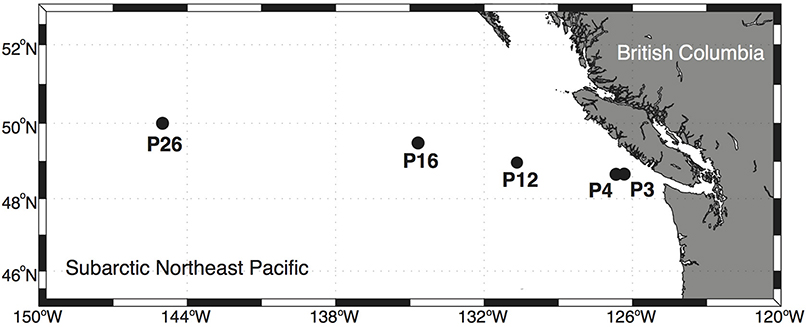
Figure 1. Stations sampled along the Line P transect in the northeast subarctic Pacific Ocean.
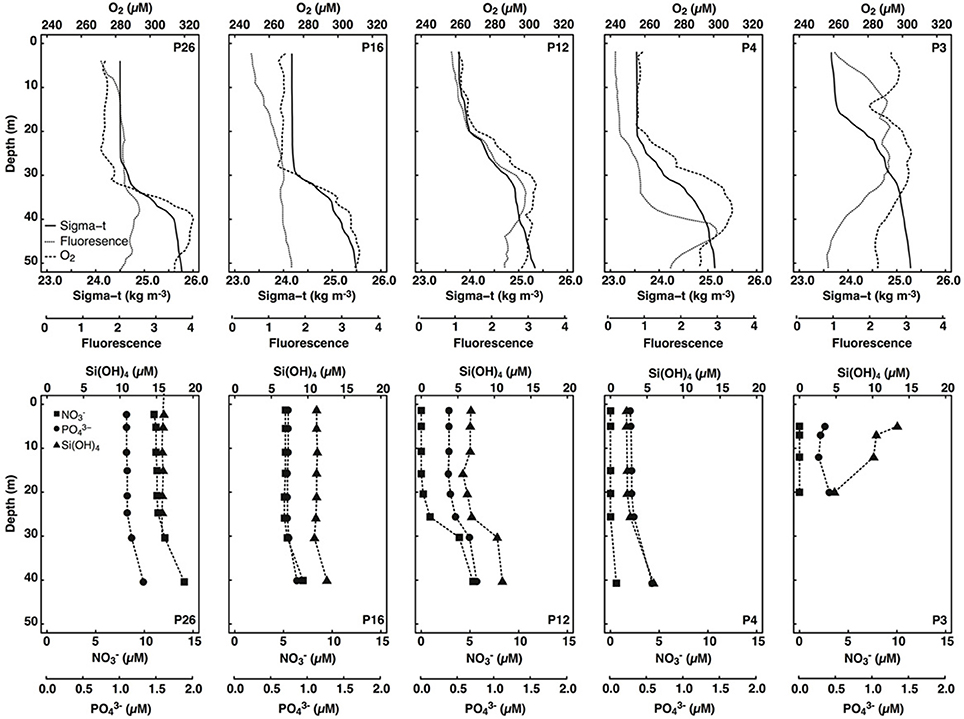
Figure 2. Depth profiles of sigma-t (kg m−3), fluorescence (unitless), dissolved oxygen (μM), dissolved nitrate (μM), phosphate (μM), and silicic acid (μM) in surface waters (< 50 m) of stations sampled along the Line P transect. Only data collected during the same cast were plotted.
Water Collection and Station Parameterization along Line P
Between August 17 and 26, 2011, surface waters were sampled on board the C.C.G.S. John P. Tully (Cruise, 2011-27) at five stations along the Line P transect (Figure 1). Low nitrate concentrations at stations P3, P4, and P12, and high nitrate concentrations at P16 and P26 confirmed that the first three stations were nitrate-limited, while the latter two stations were likely in the HNLC region (Table 2). A few hours before dawn on each sampling day, water was pumped from between 7 and 40 m depth using a trace metal clean (TMC) Teflon® diaphragm pump and Teflon® lined tubing attached to a Kevlar® wire (Johnson et al., 2005). Water was pumped directly into a Class 100 laminar flow hood where it was sampled. Around noon on each sampling day, profile data were collected at each station as previously described (Semeniuk et al., 2016).
Samples collected for Cu uptake rates, Cu:C assimilation ratios, and net primary productivity were immediately placed in on-deck incubators supplied with water continuously pumped from 5 m depth until radiotracer additions could be made (< 3 h). The sampled depths were inside and below the mixed layer, and spanned a range of light intensities from 3 to 39% of Io (Table 2). The in situ light intensities for each depth were maintained (± 4%) using neutral density screening.
Biological and Chemical Sampling and Analysis
Samples for total and size fractionated chl a concentrations, macronutrient concentrations, maximum variable fluorescence yield (Fv/Fm; using fluorescence induction/relaxation; FIRe Satlantic), and total bacterial abundance (determined by flow cytometry; Becton-Dickinson FACSCalibur) were collected and analyzed as previously described (Semeniuk et al., 2016). Cyanobacteria and picoeukaryotes were sampled and enumerated by flow cytometry according to Taylor et al. (2013).
Dissolved Cu Concentrations and Speciation
Total dissolved Cu ([Cu]d) samples were collected and analyzed by flow injection analysis and chemiluminescence using UV-oxidized samples (as described by Semeniuk et al., 2016). Dissolved Cu speciation samples were collected using the same procedure as for total dissolved Cu samples, but the sample bottles were not acidified, and instead they were immediately frozen and stored at −20°C until further analysis. The Cu speciation measurements—conditional stability constant (), ligand concentration, and free Cu2+ concentration—were determined via competitive ligand exchange-adsorptive cathodic stripping voltammetry. Due to restrictions on sample volume, a single analytical window was employed in triplicate using 5 μM of the competing ligand, salicylaldoxime (SA), which represents an average of strong and some weaker Cu-binding ligands (L). This moderate analytical window was chosen in order to detect both strong and weaker Cu-binding ligands to ensure an accurate determination of Cu2+. This window however, may have missed much of the weaker ligand pool (e.g., Heller and Croot, 2015), but weaker ligands are expected to have a small effect on the Cu2+ concentrations in the open ocean and in general, Cu2+ is relatively insensitive to the analytical window employed (Bruland et al., 2000), especially in the low [Cu]d of unpolluted environments (where [L] > [Cu]). Moreover, more recent analysis of samples collected along Line P using multiple analytical windows revealed relatively low weak ligand concentrations (1–5 nM; < 11) (Bundy, unpub.). The titrations performed here were completed using 12 titration points and up to 40 nM added Cu in order to fully titrate the ligands within the detection window. A detailed description of the theory and methodology is provided in Bundy et al. (2013) and Semeniuk et al. (2015).
Cu Uptake Rates, Cu:C Assimilation Ratios, and Net Primary Productivity
Copper uptake rates and Cu:C assimilation ratios were measured using the gamma emitting radioisotope 67Cu (half-life = 62 h; provided by TRIUMF, Vancouver BC) and H14 (Perkin Elmer). The 37 MBq 67Cu “mother” stock was kept in 0.005 M HCl, and diluted at least 2500-fold in the 250 mL assay bottles to prevent significant pH changes. Approximately 10 mL of seawater from each assay bottle were filtered through acid-cleaned 0.22 μm porosity Acrodisc filters (Pall) using an acid-cleaned rubberless syringe. The filtrate was collected in a TMC 15 mL falcon tube. Approximately 5 kBq of 67Cu from the primary stock was added to 10 mL filtrate, and allowed to complex with the excess strong Cu ligands for at least 2 h before being added to the assay bottles. The Cu concentration was not measured in the 67Cu mother stock that we took to sea. However, the background Cu contamination in isotope stocks received by our laboratory is routinely monitored via quadrapole ICP-MS, and the Cu concentration of the mother stock is always < 50 nM. At most, 100 μL of the 67Cu mother stock (pre-equilibrated with 10 mL of filtered seawater) was added to 250 mL of collected seawater, resulting in at most a 0.02 nM Cu addition. This corresponds to a maximum possible increase in dissolved Cu of 1.4% in our assays. Given that the excess of Cu ligands along the transect were between 6.3 and 17.4 nM, there would have been sufficient excess Cu ligands to complex the 0.02 nM 67Cu addition. Since the 67Cu tracer would have been completely complexed by the excess in situ Cu ligands, and the total dissolved Cu concentration changed negligibly, the Cu uptake rates and Cu:C assimilation ratios are likely representative of in situ values.
A 2 h reaction time is commonly used for titrating Cu ligands with CuSO4 for speciation analysis by electrochemical techniques (Moffett and Dupont, 2007; Buck et al., 2010; Bundy et al., 2013; Jacquot et al., 2013; Jacquot and Moffett, 2015), and so there should have been adequate time for the excess strong ligands to complex the tracer in our assays. However, we can also estimate whether the excess concentration of Cu-binding ligands present along Line P would have complexed the added 67Cu tracer in that time. The forward reaction rate for complexation of trace metals by organic ligands is described as kf = KOSk−w, where KOS is the stability constant for formation of the outer electron-sphere (M−1), and k−w is the rate constant for loss of the first water molecule from the inner metal hydration sphere (s−1; Morel et al., 1991; Hudson, 1998). The KOS value can vary between 0.3 and 8 M−1 in seawater, depending on the charges of the reacting metal and ligand species (Morel et al., 1991), and so would have a negligible effect on the overall rate constant. Instead, metal chelation is often rate-limited by loss of the first water molecule from the outer hydration sphere (Hudson, 1998). The water loss rate constant for Cu2+ (~109 s−1; Hudson, 1998) is high, and so complex formation would be very rapid. In support of this, the forward reaction rate constant measured for Cu2+ complexation by unprotonated ethylenediamine tetraacetic acid (EDTA4−) in 0.1 M NaCl is also very fast (~2 × 10⁹ M−1 s−1; Hering and Morel, 1988). In seawater, the high concentration of Ca2+ competes with Cu2+ for chelation, reducing both the strength of the Cu-ligand complex and kf (Hering and Morel, 1988). The kf decreases as dissociation of the Ca2+-ligand complex, and not k−w, becomes the rate limiting step. This is particularly important for weaker metal-binding ligands that are primarily complexed to Ca2+ in seawater. For example, the stability constant for Cu2+ EDTA decreases from 17.9 to ~10.5 in seawater (Coale and Bruland, 1988; Zamzow et al., 1998; Croot et al., 1999). Similarly, the forward reaction half-life for complexation of Cu2+ by EDTA decreases from nearly instantaneous to 2 h in seawater (Hering and Morel, 1988).
Using multiple analytical windows, both strong and weak Cu-binding ligands have recently been detected in seawater (Buck et al., 2010; Bundy et al., 2013; Heller and Croot, 2015). While we are unaware of kinetic data for Cu complexation by strong model organic ligands in seawater, forward reaction rates for Fe complexation by strong organic ligands (0.1 to 2 × 10⁶ M−1 s−1) are similar to k−w (8 × 10⁶ s−1) (Hudson et al., 1992; Witter et al., 2000). This is likely due to a much smaller proportion of the stronger ligand pool being complexed to Ca2+. Assuming the same applies for complexation of inorganic Cu by the in situ strong organic ligands, then the 67Cu tracer addition would have been complexed immediately by the in situ strong ligands. However, if the in situ weak ligands behave like EDTA—a relatively weak ligand compared to the strong in situ ligands—then complexation of the 67Cu by them would have been relatively slow and incomplete in our 2 h equilibration time. There is little experimental data for Cu complexation kinetics by natural organic matter in seawater, particularly for open ocean waters. Coale and Bruland (1988) reported that Cu complexation by the strong ligand pool occurred within 5 min at an open ocean station in the North Pacific. However, forward kinetic rate constants have been determined for Cu binding by dissolved organic matter in the Krka estuary (Croatia), and equilibration times were slow (>2 h) (Louis et al., 2009). Given the similarity between our study site and that for Coale and Bruland (1988), we suggest the 67Cu tracer was rapidly complexed by strong Cu-ligand pool, but it may not have been at equilibrium with the weak Cu-ligand pool. Although the concentration of weak Cu-binding ligands is low along Line P (1–5 nM; Bundy unpub.), their role in mediating Cu bioavailability remains unknown. Further work investigating Cu-ligand reaction kinetics of strong and weak in situ ligands would greatly assist future speciation and tracer research.
Previous work along Line P has demonstrated that short-term uptake rates are significantly faster than long-term net uptake rates due to either cellular efflux or remineralization of particulate Cu by micrograzers (Semeniuk et al., 2009, 2015). Thus, both short-term (2 h incubation) and long-term (24 h incubation) uptake rates were measured. Two hours before dawn on each sampling day, 250 mL of seawater were sampled from either the cubitainers or the Teflon pumping system into TMC 250 mL polycarbonate bottles. Sampling occurred inside a Class 100 laminar flow hood. A 10 mL sub-sample was taken from each assay bottle for the 67Cu and in situ ligand pre-complexation step (see above), and the bottles were immediately placed inside the on-deck incubators at the appropriate light levels. Once the 67Cu tracer complexation was complete, the 250 mL assay bottles were retrieved, and the 10 mL 67Cu tracer was added. For the 24 h Cu:C assimilation ratio assays, 185 kBq of H14 were also added to each 250 mL bottle. The bottle lids were sealed with parafilm, and the bottles were immediately returned to the on-deck incubators. Duplicate bottles were prepared for both Cu uptake rate and Cu:C assimilation ratio assays.
After the specified incubation time, the assay bottles were retrieved from the incubators, and a 1 mL “initial” subsample was taken from each bottle in order to determine the total activity of 14C and/or 67Cu added to each bottle. To each H14CO3− initial sample, 500 μL of 6 M NaOH was added to prevent off gassing of 14CO2. The volume of each bottle was recorded, and the seawater was gently vacuum-filtered onto a series of 47 mm diameter 5, 1, and 0.22 μm polycarbonate filters (AMD) separated by nylon drain discs (Millipore). Just before the filters went dry, 20 mL of 1 mM diethylene triamine pentaacetic acid (DTPA) in seawater adjusted to pH 8 were added to the filters to remove any surface-associated tracer (Croot et al., 2003). The filters were completely immersed in the 1 mM DTPA wash for 10 min, the wash was then drained, and 20 mL of filtered seawater (FSW) was applied to rinse away loosely associated tracer. The filters were vacuumed dry to prevent transfer of filtered cells between the filters and drain discs. Each filter was carefully folded and placed inside a 7 mL borosilicate scintillation vial. To each scintillation vial, 1 mL of FSW was added, and the vials were vortexed for 30 s to remove filter-bound cells. Filters collected from the 24 h Cu:C assimilation ratio assays were immediately acidified with 100 μL of 6 M HCl to degas inorganic 14C for 24 h before 1 mL of FSW was added. The activity of 67Cu in each vial was determined using a sea-going gamma counter (Semeniuk et al., 2009). Background 67Cu counts were performed on analysis days and subtracted from the sample counts. After 67Cu counting, sample vials containing 14C were filled with 50% ScintiSafe scintillation cocktail (Fisher) and archived until further analysis in the laboratory once the 67Cu had decayed. Once the 67Cu had decayed (>8 half-lives), the activity of 14C was determined with a Beckman LS65005514 scintillation counter with an internal 14C quench curve.
Filter blanks and kill controls were performed in triplicate at P26 (10 m depth) in order to account for abiotic adsorption of 67Cu to the polycarbonate filters and particles that was not removed by the DTPA wash. For filter blanks, the 0.22 μm filtered seawater was spiked for 2 min with pre-complexed 67Cu, the seawater was filtered, and the filters were processed as in the Cu uptake assays. Glutaraldehyde (2% final concentration) was added to another set of triplicate bottles filled with unfiltered seawater, and the cells were fixed for 2 h before pre-complexed 67Cu was added. The killed bottles were incubated for 2 h alongside the short-term Cu uptake rates, and similarly processed. The average activity for the filter blanks + kill controls (~20% of the total filter activity on average; 15% from the filter, and 5% from the cells) was subtracted from the assay filters for all stations and depths.
The specific activity of 67Cu (disintegrations per minute; DPM per mol) in the assays conducted along the transect was calculated by dividing the activity measured in 1 mL of unfiltered sample (DPM per mL) by the total dissolved Cu concentration measured in UV-digested samples (mol per mL; see above). The specific activity of 14C was calculated in the same way, but we assumed a dissolved inorganic carbon concentration of 2.1 mM. The total amount of Cu and/or C on each polycarbonate filter was determined by dividing the activity on each filter (DPM per filter) by the specific activity of the isotope (DPM per mol).
Volumetric Cu uptake rates (ρCuV; mol Cu L−1 h−1) were determined by dividing mol of Cu on each filter by the sample volume filtered and the incubation time. In order to calculate carbon-normalized Cu uptake rates, we estimated particulate organic carbon concentrations in each size fraction using previously published conversion factors. For the 0.22–1 μm size fraction, total bacterial abundance was converted to organic carbon using 20 fg C bacterium−1 (Lee and Fuhrman, 1987). For the 1–5 μm and >5 μm size fractions, [chl a] was converted to organic carbon using 50 g C g chl a−1 (Booth et al., 1993). Total ρCuB was determined by the sum of volumetric Cu uptake rates divided by total particulate carbon concentrations derived from the total bacterial abundance and total particulate [chl a].
Cu:C assimilation ratios (μmol Cu mol C−1) measured over 24 h were calculated for each size fraction by dividing the Cu uptake rate by the C uptake rate measured for each size fraction. Total particulate Cu:C assimilation ratios were calculated by dividing the sum of size-fractionated particulate Cu by sum of size-fractionated particulate C. The Cu:C assimilation ratios for the 0.22–1 μm size fraction include both photosynthetic and non-photosynthetic bacteria. Non-photosynthetic bacteria will acquire Cu without fixing 14C, and will then result in an overestimate of the Cu:C assimilation ratios for the smallest size fraction of phytoplankton.
The Cu:C assimilation ratios presented herein are not equivalent to steady-state Cu quotas measured in previous laboratory studies (Annett et al., 2008; Guo et al., 2012). Previous laboratory studies acclimated phytoplankton to 24 h light. In contrast, our field Cu:C assimilation ratio assays were performed for 24 h under a day-night cycle. During the night hours, Cu uptake may have taken place while fixation of 14C stopped and respiration of previously fixed 14C likely occurred. Freshly fixed organic carbon can be quickly metabolized after a few hours (Halsey et al., 2011). Thus, the Cu:C assimilation ratios measured in phytoplankton communities sampled along Line P may be higher than those determined in laboratory studies.
Net primary productivity (NPP) along the transect was determined using H14. Just before dawn on each sampling day, four 60 mL TMC polycarbonate bottles were rinsed and filled with sample water and spiked with 185 kBq of H14. A 0.5 mL subsample was taken from each bottle in order to determine the total activity of 14C added, and 0.5 mL of 6 M NaOH was added to prevent degassing of 14CO2. One bottle was immediately wrapped in aluminum foil and placed in an opaque black plastic bag as a “dark” bottle to account for non-photosynthetic carbon fixation and non-specific 14C binding. Bottles were incubated at in situ light and temperature for 24 h in the on-deck incubators. After the incubation, the volume of each bottle was recorded and the contents were gently filtered onto 25 mm GFF filters. The filters were then placed into 7 mL scintillation vials, and 100 μL of 6 M HCl was added to degas inorganic 14C for 24 h. The filters were then immersed in scintillation cocktail and archived until they could be analyzed in the laboratory.
Results
Depth Profiles along Line P
Mixed layer seawater density was highest at P26 (24.50 kg m−3), decreased along the transect toward P4 (23.54 kg m−3), and increased slightly at P3 (23.70 kg m−3) (Figure 2). Mixed layer depths ranged two-fold (15–31 m), and were deepest farthest offshore (P16 and P26) (Table 1). Light attenuation was greatest at P3 (light attenuation coefficient, kD = 0.211 m−1), and so the euphotic zone depth (Zeu) was shallowest at this station (22 m) (Tables 1, 2). At stations P4 through P26, light attenuation (light attenuation coefficient, kD = 0.093–0.096) and the euphotic depths (48–49 m) were similar (Tables 1, 2).
Mixed layer nitrate concentrations were below detection (0.2 μM; Barwell-Clarke and Whitney, 1996) at P3, P4, and P12 (Table 2 and Figure 2). However, they were elevated at P16 (5.20 μM) and P26 (11.2 μM), which is characteristic of HNLC waters. Phosphate and silicic acid concentrations were not limiting across the transect. At P3, a broad fluorescence peak was present from 5 to 30 m depth (Figure 2). Dissolved oxygen (DO) was elevated in the mixed layer at this station (293–298 μM), showed a large decrease between 12 and 17 m (280 μM), and increased again below the thermocline (300 μM) (Figure 2). Subsurface chlorophyll maxima (SCM) were most pronounced below the thermocline at P4 (~45 m) and P12 (~35 m), and corresponded with increased nitrate concentrations, increased DO, and low light levels (< 5% of the incident irradiation; Io) (Figure 2). Smaller SCM were present at P16 and P26 and corresponded to subsurface DO maxima. The discrete depths sampled across the transect corresponded to a range of irradiances between 3 and 39% of Io (Table 2).
Copper Concentrations and Speciation
Total dissolved Cu concentrations ranged between 1.5 and 2.8 nM along the transect (Table 3). Dissolved Cu was highest near the coast at P3 (2.4–2.8 nM). Mixed layer [Cu]d decreased along the transect toward P20 (1.7 nM), and increased at P26 (2.1 nM). Dissolved ligand concentrations were highest at P3 (14.7 and 17.4 nM at 7 and 12 m depth, respectively). Ligands were between three and seven-fold in excess of [Cu]d, and with high (13.7–14.5). The average [L]:[Cu]d ratio was 4.8 ± 1.2 (n = 12) (Table 3). The [L]:[Cu]d ratios at P3 were generally higher at both depths (6.1–6.2) compared to the remaining 10 depths sampled along the transect (4.6 ± 1.1; n = 10) (Table 3). Ligand concentrations were positively correlated with [Cu]d (slope = 5.9; r2 = 0.44, p = 0.0184).
The excess strong [L] resulted in inorganic Cu concentrations ([Cu′]) between 19 and 94 fM and coincident pCu values (−log[Cu2+]) ranging between 15.1 and 14.4 along the transect (Table 3). At each station, [Cu′] tended to be lowest at the shallowest depth and increase with depth. Notably, the lowest [Cu′] measured along the transect corresponded with the highest NPPV at P26 (10 m depth). The [Cu]d, [L], and [Cu′] at the shallowest depth sampled at each station were compared with surface salinities along the transect sampled at 5 m depth (Figure 3). [Cu]d and [L] were highest at the lowest salinities near the coast, and decreased offshore to P16, and increased again at P26. [Cu′] was more variable, and did not show an obvious trend with salinity.
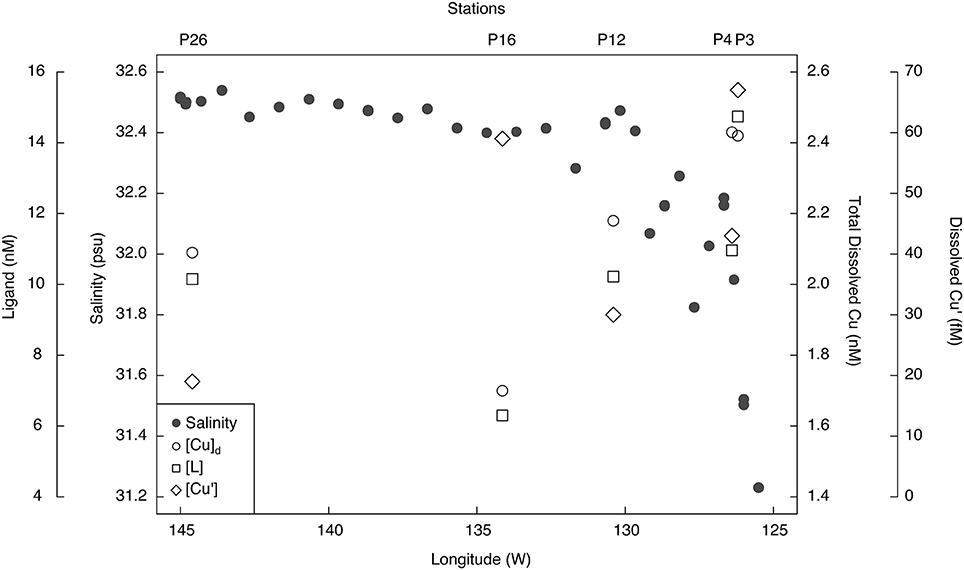
Figure 3. Surface salinity, total dissolved Cu (nM), Cu-binding ligands (nM), and inorganic Cu (fM) concentrations along the Line P transect. Salinity was sampled at 5 m using the ship's internal seawater pumping system, while the Cu concentration and speciation samples were from the shallowest depths sampled along the transect (7–10 m; Table 2).
Biomass and Productivity
Total [chl a] varied more than 20-fold along Line P varied between 0.04 and 0.96 μg chl a L−1, with highest concentrations at P3, and lowest in the mixed layer at P4 (Table 4). The 0.22–1, 1–5, and >5 μm size fractions made up 7 ± 8, 48 ± 15, and 45 ± 12% of the total [chl a] across the transect, respectively (Table 5). The 0.22–1 μm size fraction made up < 10% of the total [chl a] at all sampling depths except for 12 m at P3 (31%). Cyanobacteria and picoeukaryote abundance varied between 0.77–200 × 106 cells L−1, and 0.55–16.3 × 10⁶ cells L−1, respectively (Table 4). They were most abundant at P3 and tended to be more prevalent at deeper depths at all stations (e.g., P4, P12, and P16). The maximum fluorescence yield (Fv/Fm) was highest near the coast (0.23–0.64), lowest at P16 (0.19–0.29), and decreased toward the HNLC waters (Table 4).
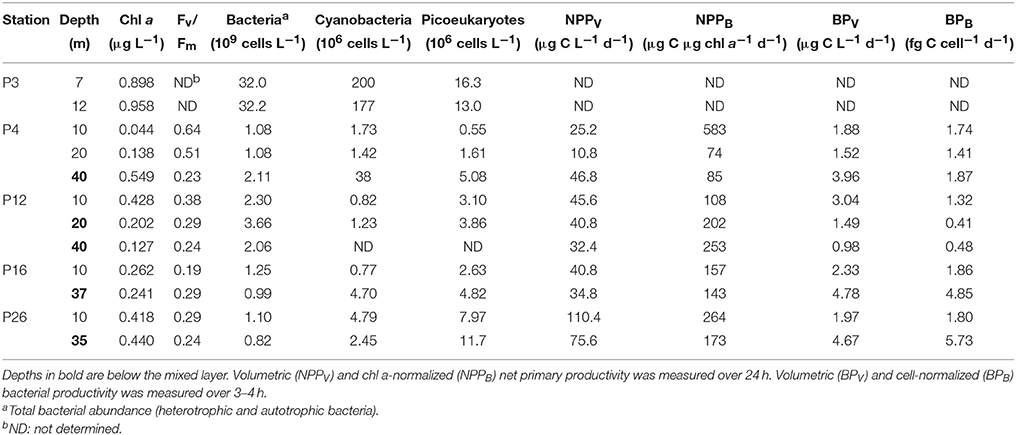
Table 4. Biomass and rate parameters measured at each sampling depth along Line P.
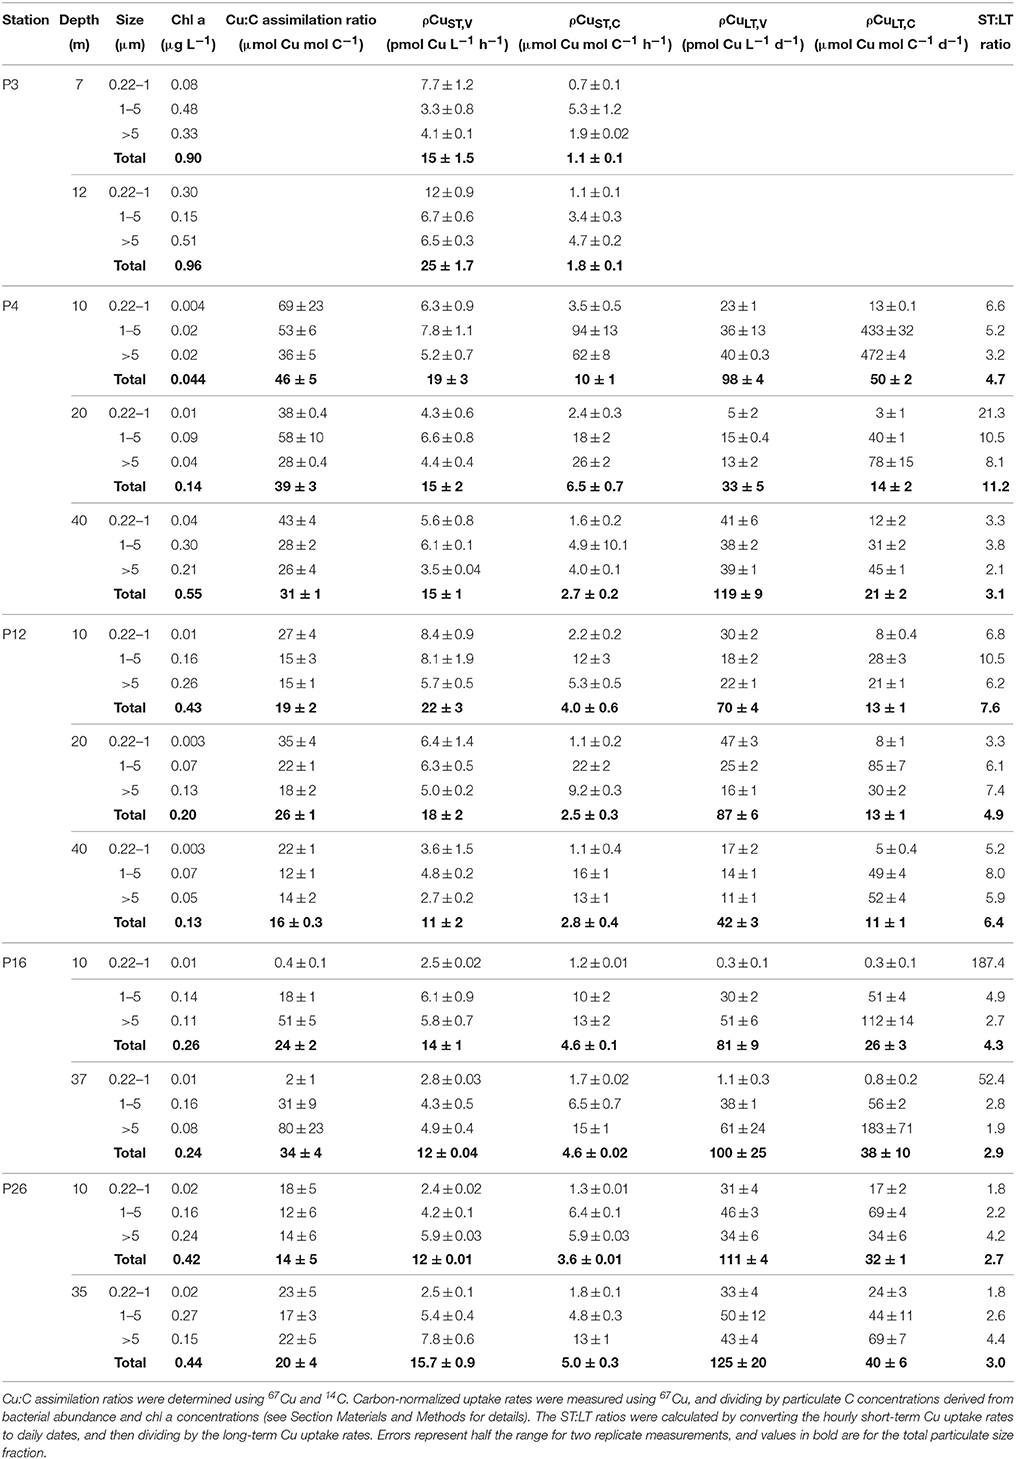
Table 5. Size-fractionated Cu:C assimilation ratios (24 h), short-term Cu uptake rates (2 h), long-term Cu uptake rates (24 h), and the short-term:long-term uptake rate ratio for each sampling depth along Line P in August 2011.
NPPV ranged between 11 and 110 μg C L−1 d−1. It was highest in the mixed layer at P26 (110 μg C L−1 d−1), and co-occurred with a higher Fv/Fm (0.29) compared to the mixed layer at P16 (41 μg C L−1 d−1; Fv/Fm = 0.19) (Table 4). These rates are within the range previously reported for the upper 40 m along Line P in the summer (10–100 μg C L−1 d−1) (Boyd and Harrison, 1999). NPPB ranged between 74 and 583 μg C μg chl a−1 d−1, with the fastest rate (583 μg C μg chl a−1 d−1) in the mixed layer at P4.
Total bacterial abundance between stations P4 and P26 varied between 0.82 and 3.66 × 10⁹ cells L−1, and was an order of magnitude higher at P3 (32.0–32.2 × 10⁹ cells L−1) (Table 4). Volumetric and cell-normalized rates of bacterial productivity varied between 0.98 and 4.78 μg C L−1 d−1, and 0.41 and 4.85 fg C cell−1 d−1, respectively. Both volumetric and carbon-normalized rates of bacterial productivity were fastest at P16 and P26. Bacterial abundance and productivity were within the range previously reported for summer months along Line P (0.80–1.35 × 10⁹ cells L−1 and 2–6 μg C L−1 d−1, respectively) (Sherry et al., 1999).
Correlations of Cu Assimilation, Biomass, Productivity, and Cu Speciation
The concomitant sampling of total dissolved Cu, Cu speciation, and various measures of biological biomass and productivity allow us to determine how Cu might influence microorganisms along Line P. There were a number of statistically significant correlations along the transect (for p-values, see Table 6). Total NPPV, as well as 1–5 μm and >5 μm NPPV (from the size-fractionated Cu:C assimilation ratio assays) were negatively correlated with [Cu′] (r2 = −0.63 to −0.86) and positively correlated with (r2 = 0.63–0.74) (Figures 4A,C). These correlations are stronger than those between NPPV and nitrate (r2 = 0.54), phosphate (r2 = 0.56), or silicic acid (r2 = 0.54) (Table 6). There were no significant correlations between NPPB and either [Cu′] or , with or without the inclusion of the P4 outlier sampled at 10 m (Figures 4B,D). Total chl a, as well as >5 μm chl a, were not strongly correlated with NPPV (r2 = 0.41 and 0.51, respectively; Table 6), while chl a in the 1–5 μm size fraction was not correlated with NPPV (p>0.05). This indicates that the correlations between [Cu′], , and NPPV may not have been solely driven by changes in biomass. Ligand concentrations were positively correlated with total particulate [chl a] (r2 = 0.39), >5 μm [chl a] (r2 = 0.46), and bacterial abundance (r2 = 0.65; Table 6).
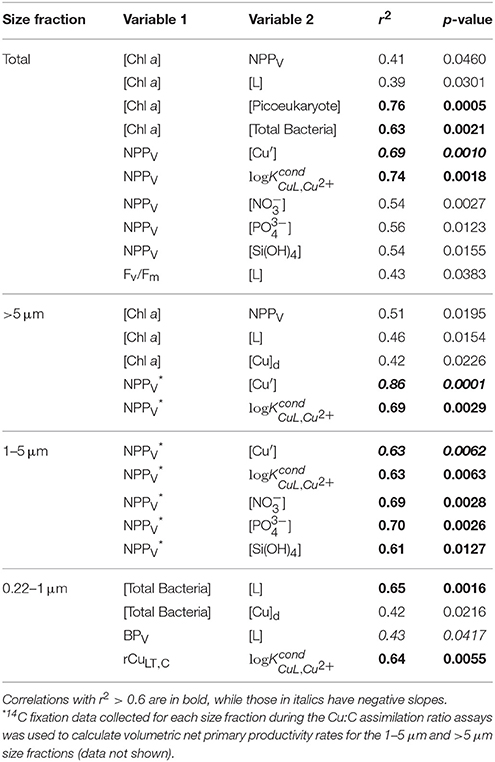
Table 6. Statistically significant Pearson correlations of biomass, productivity, Cu uptake, and chemical parameters measured along Line P in August 2011.
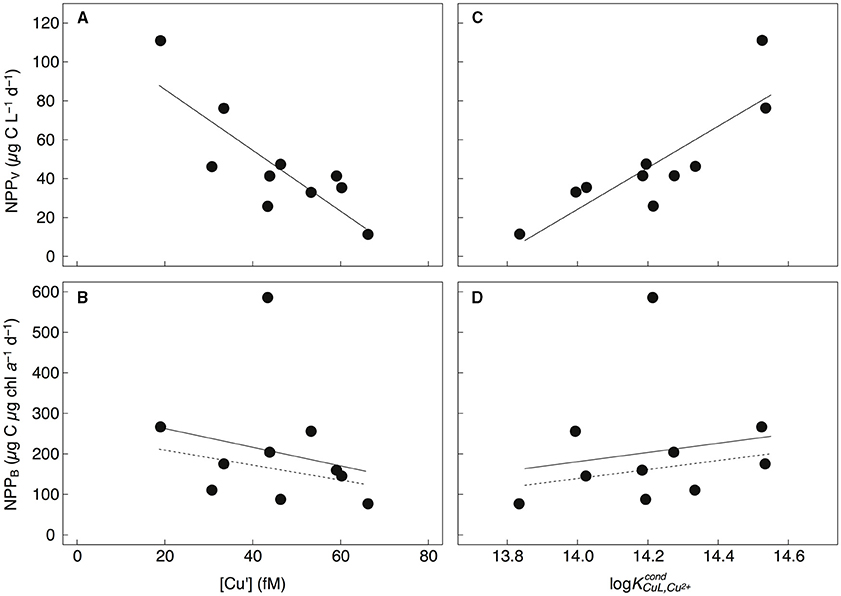
Figure 4. Total particulate NPPV (μg C L−1 d−1) (A,C), and NPPB (μg C μg chl a−1 d−1) (B,D) vs. [Cu′] (fM) and log measured along Line P. NPPV was negatively correlated with [Cu′] (NPPV = −1.56[Cu′] + 117; r2 = 0.69, p = 0.001) and positively correlated with (NPPV = 107 − 1472; r2 = 0.74, p = 0.002). NPPB was not significantly correlated with [Cu′] or whether the outlier at P4 was included (solid line) or excluded (dashed line).
Cu:C Assimilation Ratios
The Cu:C assimilation ratios ranged between 0.4 and 80 μmol Cu mol C−1 across the transect (Table 5). The average Cu:C assimilation ratios were similar across the transect for all size fractions (28 ± 20, 27 ± 16, 30 ± 21, and 27 ± 11 for the 0.22–1 μm, 1–5 μm, >5 μm, and total particulate size fractions, respectively). The Cu:C assimilation ratios were not correlated with [Cu]d, [Cu′], [L], or .
Cu Uptake Rates
Total particulate ρCuST, C varied ~9-fold, and ranged between 1.1 ± 0.1 and 10 ± 1 μmol Cu mol C−1 h−1. Size-fractionated ρCuST, C were more variable, and varied up to 130-fold across the size fractions (ranging from 0.7 ± 0.1–94 ± 13 μmol Cu mol C−1 h−1). Average ρCuST, C were similar for the 1–5 μm (17 ± 24 μmol Cu mol C−1 h−1) and >5 μm (14 ± 16 μmol Cu mol C−1 h−1) size fractions, and were slowest for the 0.22–1 μm size fraction (1.6 ± 0.8 μmol Cu mol C−1 h−1). Average CuST, V along the transect were similar for all size fractions (~5 pmol Cu L−1 h−1) (Table 5).
Total particulate long-term volumetric uptake rates (ρCuLT, V) varied 3.8-fold, and ranged between 33 ± 10 and 125 ± 40 pmol Cu L−1 d−1. Similar to ρCuST, V, average ρCuLT, V were similar for the 0.22–1 μm (23 ± 17 pmol Cu L−1 d−1), 1–5 μm (31 ± 13 pmol Cu L−1 d−1), and >5 μm (33 ± 17 pmol Cu L−1 d−1) size fractions, and varied 187-fold among the size fractions (0.3 ± 0.1 to 125 ±20 pmol Cu L−1 d−1). Unlike ρCuST, V the ρCuLT, V for the 0.22–1 μm size fraction were not slower than the other size fractions. Variation of carbon-normalized Cu uptake rates (ρCuLT, C) in the total (five-fold), 1–5 μm (16-fold), and >5 μm (21-fold) size fractions was similar to variation in ρCuST, C. However, ρCuLT, C in the 0.22–1 μm size fraction was more variable (155-fold) than ρCuST, C (five-fold). While there were no significant correlations between ρCuLT, C and any measure of Cu speciation along the transect for the eukaryotic size fractions, ρCuLT, C in the 0.22–1 μm size fraction was positively correlated with (r2 = 0.64, p = 0.0055) (Table 6).
Short-term Cu uptake rates are in excess of long-term uptake rates due to either cellular efflux or remineralization by micrograzers (Semeniuk et al., 2015). The ratio of short-term:long-term uptake ratios (ST:LT) was calculated by first converting the hourly short-term rates (pmol Cu L−1 h−1) into daily rates (pmol Cu L−1 d−1). Average ρCuST, V for all size fractions was ~11-times faster than ρCuLT, V, and the total ST:LT ratios ranged between 2.7 and 11.2 across the transect (Table 5). The ST:LT ratios were more variable for the 0.22–1 μm size fraction (1.8–187) than the 1–5 or >5 μm size fractions (1.9–10.5). The two highest ST:LT values in the 0.22–1 μm size fraction (52 and 187) were outliers at P16. Without these outliers, the average ST:LT ratios for all size fractions were consistently lower at P26 (2.7 ± 1.0) and P16 (3.3 ± 1.1; without the two outliers) than P4 (6.9 ± 9.2) or P12 (6.5 ± 2.0).
Discussion
Distribution of Total Dissolved Cu in Line P Surface Waters
We present some of the first measurements of dissolved Cu in the northeast subarctic Pacific Ocean. Total dissolved Cu varied 1.9-fold across the transect (1.5–2.8 nM). These values are similar to surface water [Cu]d previously measured along Line P (1.2–3.5 nM; Martin et al., 1989; Semeniuk et al., 2009), in the North Pacific (0.6–3.5 nmol kg−1) (Boyle et al., 1977; Coale and Bruland, 1988), northwest subarctic Pacific and Bering Sea (1.2–2 nM) (Moffett and Dupont, 2007), and in Washington coastal waters south of the Line P transect (1.86–5.25 nmol kg−1) (Jones and Murray, 1984).
Dissolved Cu was highest in less saline waters near the coast (salinity = 31.5–32) and decreased offshore. The elevated [Cu]d at P3 (7 and 12 m depth) and at 10 m depth at P4 may be due to their closer proximity to terrestrial and shelf sources of Cu. Upwelling begins at these stations by March, due to Ekman pumping as the California and Alaska currents bifurcate along the British Columbia coast (Thomson, 1981; Foreman et al., 2011). Intermediate waters (250–500 m) off the coast of Washington are enriched in Cu (2–3 nM) relative to surface waters (Jones and Murray, 1984). Upwelling of these waters could account for the observed enrichment of [Cu]d at P3 and P4.
Surface water [Cu]d at P26 (2.1–2.2 nM) was higher than previously measured at this station (1.44–1.54 nmol kg−1) (Martin et al., 1989). Total dissolved Cu at P26 was also higher than [Cu]d at P16 (1.7–1.9 nM). Dissolved Fe in the mixed layer was also significantly higher at P26 (0.13–0.21 nM) relative to P16 (0.03–0.07 nM) (Cullen, unpub. data). Recent dissolved lead (Pb) isotope data along Line P indicate that the source of dissolved Pb in the upper 75 m at P26 is from Asian dust sources (McAlister, 2015). At stations P4 through P20, North American dust sources were the dominant sources of metals to surface waters (McAlister, 2015). Thus, the higher Fe and Cu concentrations at P26 compared to P16 could be due to atmospheric dust deposition from Asia. It is also possible that transport of coastal waters via mesoscale eddies (Johnson et al., 2005) or isopycnal transport from continental margins (Lam et al., 2006) carried Cu and Fe to the P26 mixed layer. However, satellite altimetry anomalies demonstrate that there was not an eddy at P26 during the time of sampling (Figure 5). Though it is difficult to distinguish between atmospheric and isopycnal transport of Cu to P26 with our data, sporadic atmospheric dust deposition events have been previously linked to primary productivity increases at P26 (Bishop et al., 2002; Hamme et al., 2010). Interestingly, [chl a], Fv/Fm (a physiological indicator for Fe-limitation), picoeukaryote abundance, and NPPV were also elevated at P26 compared to P16. These data suggest that a recent atmospheric dust deposition event may have occurred at P26 shortly before our arrival.
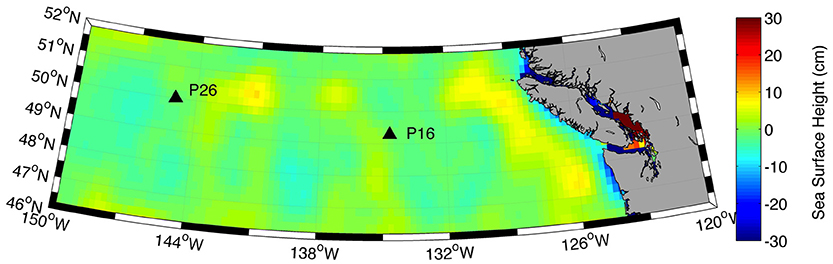
Figure 5. Satellite derived sea surface height anomalies (cm) along the Line P transect for August 8, 2011. Data were retrieved from the Colorado Centre for Astrodynamics Research (CCAR) online database.
Cu Speciation in Surface Waters along Line P
Strong Cu binding ligands were present across the transect at all sampling depths, and were always in excess of the total dissolved Cu concentrations, resulting in sparingly low inorganic Cu concentrations. Compared to previous studies (Buck et al., 2010; Bundy et al., 2013), a single analytical window was employed (5 μM SA) along with higher Cu additions, in order to detect a wider range of ligands. This method was used to achieve the most accurate estimate of Cu2+ while using a single titration window. The ligand concentration range (6.3–17.4 nM) and strength ( = 13.7–14.5) represent both stronger and weaker ligands. Thus, the concentrations reported here are higher than those reported for just the strong ligand class by other groups, using a different analytical window (2–4 nM; e.g., Jacquot et al., 2013). Although this study used a different analytical window than a study in a similar region (Moffett and Dupont, 2007), the calculations of Cu2+ were very similar. This is likely because Cu2+ determinations have been found to be largely independent of analytical window, within a relatively wide range (Bruland et al., 2000). The ligand strengths () are similar to those previously reported for the northwest Pacific Ocean and Bering Sea (13.5–14; Moffett and Dupont, 2007), the Southern Ocean (14–16.4; Buck et al., 2010; Bundy et al., 2013), the eastern tropical south Pacific Ocean (13.5–14.5; Jacquot et al., 2013), and the north Atlantic Ocean (12.9–14.2; Jacquot and Moffett, 2015).
Although the provenance and structure of the strong Cu-binding ligands in the open ocean is unknown, there are a number of possible sources and candidate compounds. Synechococcus and the heterotrophic bacterium Vibrio alginolyticus produce strong Cu-binding ligands ( = 13) when experiencing Cu-toxicity (Moffett and Brand, 1996; Gordon et al., 2000). The concentration of these ligands is normally in excess (0–50%) of the total dissolved Cu in the growth medium. The significant positive correlation between total bacterial cell densities and [L] (r2 = 0.65, p = 0.0016) suggests that prokaryotes may be a source of strong Cu ligands along Line P. Since [L] was not correlated with cyanobacteria abundance, heterotrophic bacteria may produce the majority of these strong Cu binding ligands.
Similar to [Cu]d, [L] was highest near the fresher coastal surface waters and decreased toward the open ocean. The higher [L]:[Cu]d ratio at P3 compared to the average ratio across the transect suggests that there may be an additional source of strong Cu binding ligands along the shelf. Ligands in marine sediment porewaters, though weaker than in surface waters, can exceed 100 nM concentrations and can diffuse into the overlying bottom water (Skrabal et al., 2000; Shank et al., 2004). As intermediate waters pass over the shelf sediments during upwelling, they may become enriched in weaker Cu binding ligands. The lowest measured along the transect were for P3 (12 m depth), and suggests that shelf waters might be a source of weaker Cu ligands in this region. Humic substances bind Cu ( = 12; Whitby and van den Berg, 2015) and may be a portion of the ligand pool in coastal stations. Humic substances are electrochemically active, and their peaks were observed in the coastal stations (data not shown). Inorganic Cu concentrations varied five-fold (19–94 fM) with a corresponding pCu range of 15.1–14.5. While the [Cu′] values are lower than previous measurements in the North Pacific (0.8–2.4 pM; Coale and Bruland, 1988), this is likely due to the lower analytical detection window and different electrochemical method (ASV compared to CSV in this study) used by Coale and Bruland (Bruland et al., 2000; Buck et al., 2012).
Surface water [Cu′] tended to be lower at shallower depths across the transect, and may imply biological utilization of Cu′ and export of particulate Cu below the mixed layer. The negative correlations between NPPV and [Cu′] for all sampling depths and stations for the 1–5 μm, >5 μm, and total particulate size fractions (Figure 4; Table 6) support this. We did not observe a similar correlation between chl a-normalized NPP (NPPB) and [Cu′]. However, the C:chl a ratio of autotrophs can vary more than six-fold at P26 (Booth et al., 1993; Peña and Varela, 2007), and by more than 10-fold between laboratory strains (MacIntyre et al., 2002). This variability likely precluded any significant correlation between NPP [Cu′]. Given laboratory and field evidence for Cu′ uptake by phytoplankton (Sunda and Guillard, 1976; Sunda and Huntsman, 1995; Semeniuk et al., 2015; Walsh et al., 2015), we propose that Cu′ drawdown by the phytoplankton communities along the transect is the most likely explanation for this trend.
Assessing the 67Cu Tracer Technique to Measure Cellular Cu Accumulation
Few direct measurements of cellular Cu quotas—defined as the intracellular ratio of Cu normalized to organic C (e.g., Sunda and Huntsman, 1995)—have been made in marine phytoplankton (Table 7). Similar to standard 24 h oceanographic incubation assays (e.g., O, 15 incubations) the Cu:C assimilation ratios presented here and in our previous study (Semeniuk et al., 2009) assume that the phytoplankton physiology is minimally perturbed over the course of the 24 h assay. Thus, while the accumulation of cellular 67Cu and 14C may vary diurnally, the ratio of the incorporation of each tracer after 24 h will represent a pseudo-steady state Cu:C assimilation ratio, as long as the added tracers are at equilibrium (see Section Cu Uptake Rates, Cu:C Assimilation Ratios, and Net Primary Productivity). Assuming similar environmental conditions, our ratios should be comparable to other field and laboratory estimates of Cu:C quotas of phytoplankton isolates and mixed assemblages.
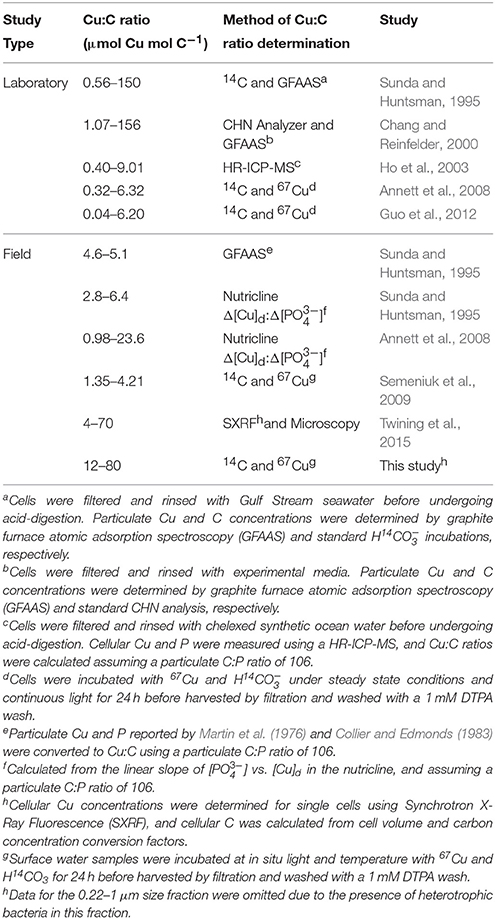
Table 7. Particulate Cu:C ratios in natural phytoplankton communities and laboratory strains grown under Cu-limiting and toxic conditions.
The Cu:C assimilation ratios (~30 μmol Cu mol C−1) across the transect were ~10-times higher (1–4 μmol Cu mol C−1) than during our previous investigation (Semeniuk et al., 2009). There were two major differences between the experimental set-up in this study and our previous study. First, in our previous study, the 67Cu tracer was allowed to equilibrate with the in situ ligands for 30 min, while we chose a 2 h equilibration time here. Stronger Cu-binding ligands will have a faster forward reaction rate constant than weaker ligands due to competition with calcium (see Section Cu Uptake Rates, Cu:C Assimilation Ratios, and Net Primary Productivity). Thus, we could expect the 67Cu tracer to be rapidly bound to the strong ligand pool first, and more of the 67Cu tracer would equilibrate with the weaker ligand pool with a longer equilibration time. Since Cu bound to weaker organic ligands is more bioavailable than Cu bound to stronger ligands (Semeniuk et al., 2015; Walsh et al., 2015), the different equilibration times used in the two studies could have changed the relative bioavailability of the 67Cu tracer. Second, in our previous study, water was collected in the mid to late afternoon, spiked with 67Cu and 14C, and allowed to incubate for 24 h. In the present study, we spiked the water with the isotopes just before dawn. Thus, cells spent a greater proportion in the light near the start of the incubation than in our previous study. A greater amount of fixed 14C would have been available for respiration during the night than in our previous study. Freshly fixed organic 14C can be respired within hours after initially fixed (Halsey et al., 2011), and so this would result in higher Cu:C assimilation ratios as observed in the present study. Both methodological differences may have caused the higher Cu:C assimilation ratios here. Average particulate Cu uptake rates were ~5-times faster than in our previous study, while the average total NPPV (~45 μg C L−1 d−1) were half as fast (~85 μg C L−1 d−1; calculated using data reported in Table 4 by Semeniuk et al., 2009). Thus, the tracer equilibration time appears to play a more important role, and future work should compare the effect of 67Cu equilibration times with the in situ ligands on the measured Cu:C assimilation ratios.
The size fractionated Cu:C assimilation ratios reported here (0.4–80.2 μmol Cu mol C−1) are within the range of Cu quotas reported in previous laboratory studies (0.04–156 μmol Cu mol C−1) (Table 7). In addition, independent measurements of cellular Cu quotas in natural phytoplankton communities compare well with our Cu:C ratios (4–70 μmol Cu mol C−1) (Twining et al., 2015). Average cellular Cu:C ratios were higher in autotrophic flagellates and picoeukaryotes (~30 μmol Cu mol C−1) than in diatoms (~4 μmol Cu mol C−1). Although we did not determine the phytoplankton species composition along the transect, diatoms rarely make up more than 25% of the total [chl a] along Line P during the year (Steiner et al., 2012), and would make up a small portion of the particulate Cu:C. These data suggest that the Cu:C ratios determined here using 67Cu and 14C approximate in situ values. Further work comparing 67Cu and SXRF methods on the same samples would greatly benefit the veracity of both methods.
Geochemical estimates of the Cu:C ratios of exported material can be derived from the slope of [Cu]d and [] measured across the nutricline (Δ[Cu]d:Δ[]) in different ocean basins (assuming a C:P ratio of 106). The range of these ratios (0.98–24 μmol Cu mol C−1; Table 7) is within our observations and those reported by Twining et al. (2015). However, the average Cu:C ratio (~5 μmol Cu mol C−1) determined using Δ[Cu]d:Δ[] is smaller than the average size fractionated Cu:C ratios reported here and for single cells reported by Twining et al. (2015). Interestingly, the Cu:C ratios of single diatom cells in the North Atlantic (~4 μmol Cu mol C−1; Twining et al., 2015) is similar to Cu:C ratios determined using Δ[Cu]d:Δ[]. The Δ[Cu]d:Δ[] method only takes into account Cu and C remineralized from exported material (e.g., diatoms), and not organic material remineralized in shallow waters (e.g., flagellates). Thus, diatoms may be primarily responsible for removing Cu from the mixed layer. In support of this, Löscher (1999) observed a positive correlation between dissolved silicic acid and total [Cu]d in the Southern Ocean.
Only two studies have reported steady-state Cu uptake rates in phytoplankton grown in similar [Cu′] (Annett et al., 2008; Guo et al., 2012). We calculated cell-specific Cu uptake rates along the transect using the 1–5 μm size fraction ρCuLT, V and picoeukaryote abundance, and compared them to steady state Cu uptake rates measured in laboratory studies. The average cell-normalized Cu uptake rates across the transect was 14 ± 19 amol Cu cell−1 d−1, and ranged between 4 and 65 amol Cu cell−1 d−1. Removing the anomalously high value at P4 (10 m), the average uptake rate decreases to 7 ± 2 amol Cu cell−1 d−1. The average steady-state net cellular Cu uptake rates measured for nine phytoplankton species with cell diameters between 1 and 5 μm was 1 ± 0.8 amol Cu cell−1 d−1, with a range of 0.03–3.5 amol Cu cell−1 d−1 (Annett et al., 2008; Guo et al., 2012). Thus, the estimates of cellular Cu uptake rates across the transect are slightly faster than would be predicted using laboratory data. The difference between the laboratory and field estimates could be due to phytoplankton community composition structure and experimental designs (e.g., steady state conditions and 24 h light in the lab; diurnal cycles and varying light in the field). More recent estimates of short-term cellular Cu uptake rates at P26 (~8 amol Cu cell−1 d−1; Semeniuk et al., 2015) are within the range reported here.
Environmental Controls of Biogenic Cu along Line P
Some phytoplankton have higher Cu demands during Fe limitation (Peers et al., 2005; Wells et al., 2005; Maldonado et al., 2006; Annett et al., 2008; Guo et al., 2012; Biswas et al., 2013). Oceanic phytoplankton strains have higher basal metabolic Cu requirements compared to coastal strains, and may reflect an increased reliance on Cu in waters with chronically low Fe (Peers and Price, 2006; Annett et al., 2008). In previous work, Fe uptake and Cu assimilation rates were positively correlated for large (>20 μm) phytoplankton along the Line P transect, indicating that Fe and Cu metabolisms may be linked in large cells (Semeniuk et al., 2009). Indeed, a recent incubation study at station P26 confirmed that large (>5 μm), Fe-limited phytoplankton increase Fe uptake using their high-affinity Fe transport systems when provided with 1 nM CuSO4 (Semeniuk et al., 2016), suggesting that Fe limitation may increase Cu demand along Line P, an HNLC region.
The somewhat elevated Fe concentrations measured at P26, possibly caused by an Fe-input event (see Section Distribution of Total Dissolved Cu in Line P Surface Waters), provide an opportunity to test whether natural Fe-enrichment can influence the Cu physiology of marine phytoplankton. Compared to P26 where the community was clearly Fe-limited, the Cu:C assimilation ratios and ρCuLT, C were consistently higher at P16 for both 1–5 μm and >5 μm size fractions. Furthermore, the differences between Cu:C assimilation ratios and ρCuLT, C measured at P16 and P26 were greater for the >5 μm (62–73%) than the 1–5 μm (0–47%) size fraction. These data indicate that there may be an interaction between Fe and Cu metabolism in indigenous phytoplankton communities, and that larger phytoplankton in HNLC regions may have a greater dependence on Cu availability.
Previous laboratory studies have hypothesized that Cu′ concentrations determine Cu bioavailability to marine phytoplankton (Sunda and Guillard, 1976; Anderson and Morel, 1978; Sunda and Huntsman, 1995). Thus, we hypothesized that Cu:C assimilation ratios and Cu uptake rates might correlate with [Cu]d and/or [Cu′]. There were no correlations between ρCuST, C, ρCuLT, C, and Cu:C assimilation ratios with [Cu′] for the 1–5 μm or >5 μm size fractions across the transect, and so [Cu′] likely does not determine Cu uptake rates or cellular quotas in natural marine phytoplankton communities. Laboratory studies of isolated marine phytoplankton strains have demonstrated that organically complexed Cu is bioavailable (Hudson, 1998; Quigg et al., 2006; Annett et al., 2008; Guo et al., 2010; Walsh et al., 2015). In situ Cu ligand complexes were also bioavailable to marine phytoplankton surveyed at P26 in 2008 (Semeniuk et al., 2015). Despite this, Cu uptake rates or Cu:C assimilation ratios were not correlated with [Cu]d. Since phytoplankton Cu quotas and steady-state Cu uptake rates can vary by an order of magnitude among taxa grown in identical Cu concentrations (Ho et al., 2003; Annett et al., 2008; Guo et al., 2012), phytoplankton species composition, Fe availability, or some other unknown factor, may primarily determine particulate biogenic Cu concentrations in surface waters.
Dissolved-Particulate Cu Cycling and Cu Residence Times
Similar to our previous studies of Cu uptake rates at P26 (Semeniuk et al., 2009, 2015), short-term Cu uptake rates were faster than long-term uptake rates for all size classes along the Line P transect. Our previous work at station P26 demonstrated that particulate Cu concentrations plateaued within 4–8 h of adding the 67Cu tracer, and decreased up to 65% between 8 and 12 h later (Semeniuk et al., 2015). We hypothesized that cellular efflux or remineralization by micrograzers may account for this. Thus, Cu cycling between dissolved and particulate phases in surface waters may be rapid compared to the export of particulate Cu from surface waters.
Assuming that the relationship between total particulate NPPV and [Cu′] is due to biological utilization across the transect, we can calculate the net Cu:C drawdown ratio in surface waters along Line P using this slope (1.56 μg C fmol Cu−1 d−1; Figure 4), and a range of phytoplankton specific growth rates reported for this region (0.2–1 d−1; Booth, 1988). The calculated range, 1.5–7.7 μmol Cu mol C−1, assumes that only Cu′ is being incorporated into or onto particles. Recent estimates suggest that between 0 and 90% of the Cu being acquired by indigenous marine phytoplankton is organically complexed (Semeniuk et al., 2015). If 50% of the dissolved Cu removed from surface waters was organically complexed, then the net Cu:C drawdown ratio would increase to 3–15 μmol Cu mol C−1. Timothy et al. (2013) reports that 2–3 mmol C m−2 d−1 is exported to 200 m depth at P26 during the late summer. This depth is below the permanent halocline at ~150 m along the transect, which limits the winter mixed layer depth (Gargett, 1991). Using a middle value for the net Cu:C drawdown ratio (~10 μmol Cu mol C−1), we estimate a Cu export to 200 m of 20–30 nmol Cu m−2 d−1. Integrated over a 20 m summer mixed layer depth, this corresponds to an estimated net loss of Cu from the mixed layer of 1–1.5 pmol Cu L−1 d−1. Given the total dissolved surface Cu concentrations across Line P varied by ~2-fold (1.46–2.79 nM), we estimate the residence time for Cu in the mixed layer (mixed layer [Cu]diss ÷ estimated net loss) along Line P between 2.5 and 8 years. This is similar to other independent surface layer residence time estimates in the tropical Atlantic Ocean (3–12 years; Helmers and Schrems, 1995) and the North Pacific Ocean (~9 years; Takano et al., 2014). The surface residence time is much longer than other bioactive metals, such as Fe (6–150 days; Bergquist and Boyle, 2006; Ellwood et al., 2014), or Co (~100 days; Saito and Moffett, 2002), and reflects the higher total dissolved Cu concentrations in surface waters (0.2–3 nM) compared to other bioactive metals (0.01–0.2 nM).
The total particulate uptake rates measured using 67Cu (33–125 pmol Cu L−1 d−1) are 22–125 times faster than our estimates of Cu export (1–1.5 pmol Cu L−1 d−1). Assuming that the source and loss terms in the surface mixed layer are at steady state, this indicates that a Cu atom in the surface ocean would exchange between dissolved and particulate phases 22–125 times before being exported. Copper enters phytoplankton through either a high- or low-affinity Cu transport system (Guo et al., 2010, 2015). The HACuTS can be down- or up-regulated, while the low-affinity transport system (LACuTS) seems to be constitutively expressed (Guo et al., 2010). The LACuTS is likely a non-specific divalent metal transporter (e.g., NRAMPs, ZIP) (Sunda and Huntsman, 1983; Guo et al., 2015). Thus, if intracellular Cu increases above the cell's metabolic demand due to non-specific uptake, it will have to be effluxed or detoxified intracellularly. Copper efflux is a common mechanism in bacteria to prevent intracellular metal toxicity (Silver, 1996), and ATP-powered heavy metal resistance pumps have been identified in numerous α-, β-, and γ-proteobacteria (Ridge et al., 2008). Copper efflux has also been documented in marine prokaryotic and eukaryotic phytoplankton (Foster, 1977; Hall et al., 1979; Croot et al., 2003; Quigg et al., 2006; Semeniuk et al., 2015; Walsh et al., 2015), suggesting that Cu efflux might be a common physiological mechanism of Cu homeostasis in marine microorganisms. In addition, micrograzing and bacterial remineralization might mediate fast exchange of Cu between the dissolved and the particulate pools, as recently shown for Ni and Zn (Twining et al., 2014). Therefore, fast biological Cu uptake and efflux, as wells as efficient micrograzing and bacterial remineralization of Cu in surface waters might have significant impacts on the cycling of Cu in the sea.
Author Contributions
The experimental design was carried out by DS and MM. Sample collection and analysis were performed by DS, AP, RB, and MR. All authors contributed to data interpretation, and the manuscript was primarily written by DS.
Funding
DS, AP, and MM were funded by a Natural Sciences and Engineering Council of Canada Discovery grant.
Conflict of Interest Statement
The authors declare that the research was conducted in the absence of any commercial or financial relationships that could be construed as a potential conflict of interest.
References
Anderson, D. M., and Morel, F. M. M. (1978). Copper sensitivity of Gonyaulax tamarensis. Limnol. Oceanogr. 23, 283–295. doi: 10.4319/lo.1978.23.2.0283
Annett, A. L., Lapi, S., Ruth, T. J., and Maldonado, M. T. (2008). The effects of Cu and Fe availability on the growth and Cu:C ratios of marine diatoms. Limnol. Oceanogr. 53, 2451–2461. doi: 10.4319/lo.2008.53.6.2451
Barwell-Clarke, J., and Whitney, F. A. (1996). Institute of Ocean Sciences Nutrient Methods and Analysis, Vol. 182. Canadian Technical Report of Hydrography and Ocean Sciences, Institute of Ocean Sciences.
Bergquist, B. A., and Boyle, E. A. (2006). Dissolved iron in the tropical and subtropical Atlantic Ocean. Glob. Biogeochem. Cycle 20, GB1015. doi: 10.1029/2005GB002505
Bishop, J. K. B., Davis, R. E., and Sherman, J. T. (2002). Robotic observations of dust storm enhancement of carbon biomass in the North Pacific. Science 298, 817–821. doi: 10.1126/science.1074961
Biswas, H., Bandyopadhyay, D., and Waite, A. (2013). Copper addition helps alleviate iron stress in a coastal diatom: response of Chaetoceros gracilis from the Bay of Bengal to experimental Cu and Fe addition. Mar. Chem. 157, 224–232. doi: 10.1016/j.marchem.2013.10.006
Booth, B. C. (1988). Size classes and major taxonomic groups of phytoplankton at two locations in the subarctic Pacific Ocean in May and August, 1984. Mar. Bio. 97, 275–286. doi: 10.1007/BF00391313
Booth, B. C., Lewin, J., and Postel, J. R. (1993). Temporal variation in the structure of autotrophic and heterotrophic communities in the subarctic Pacific. Prog. Oceanog. 32, 57–99. doi: 10.1016/0079-6611(93)90009-3
Boyd, P. W., and Harrison, P. J. (1999). Phytoplankton dynamics in the NE subactic Pacific. Deep Sea. Res. II 46, 2405–2432. doi: 10.1016/S0967-0645(99)00069-7
Boyd, P. W., Jickells, T., Law, C. S., Blain, S., Boyle, E. A., Buesseler, K. O., et al. (2007). Mesoscale iron enrichment experiments 1993-2005: synthesis and future directions. Science 315, 612–617. doi: 10.1126/science.1131669
Boyle, E. A., Sclater, F. R., and Edmond, J. M. (1977). The distribution of dissolved copper in the Pacific. Earth Planet. Sci. Lett. 37, 38–54. doi: 10.1016/0012-821X(77)90144-3
Brand, L. E., Sunda, W. G., and Guillard, R. R. L. (1986). Reduction of marine phytoplankton reproduction rates by copper and cadmium. J. Exp. Mar. Biol. Ecol. 96, 225–250. doi: 10.1016/0022-0981(86)90205-4
Bruland, K. W., Rue, E. L., Donat, J. R., Skrabal, S. A., and Moffett, J. W. (2000). Intercomparison of voltammetric techniques to determine the chemical speciation of dissolved copper in a coastal seawater sample. Anal. Chim. Acta 405, 99–113. doi: 10.1016/S0003-2670(99)00675-3
Buck, K. N., Moffet, J., Barbeau, K. A., Bundy, R. M., Kondo, Y., and Wu, J. (2012). The organic complexation of iron and copper: an intercomparison of competitive ligand exchange–adsorptive cathodic stripping voltammetry (CLE-ACSV) techniques. Limnol. Oceanogr. Methods 10, 496–515. doi: 10.4319/lom.2012.10.496
Buck, K. N., Selph, K. E., and Barbeau, K. A. (2010). Iron-binding ligand production and copper speciation in an incubation experiment of Antarctic Peninsula shelf waters from the Bransfield Strait, Southern Ocean. Mar. Chem. 122, 148–159. doi: 10.1016/j.marchem.2010.06.002
Bundy, R. M., Barbeau, K. A., and Buck, K. N. (2013). Sources of strong copper-binding ligands in Antarctic Peninsula surface waters. Deep Sea Res. II 90, 134–146. doi: 10.1016/j.dsr2.2012.07.023
Chadd, H. E., Newman, J., Mann, N. H., and Carr, N. G. (1996). Identification of iron superoxide dismutase and a copper/zinc superoxide dismutase enzyme activity within the marine cyanobacterium Synechococcus sp. WH (7803). FEMS Microbiol. Lett. 138, 161–165. doi: 10.1111/j.1574-6968.1996.tb08150.x
Chang, S. I., and Reinfelder, J. R. (2000). Bioaccumulation, subcellular distribution, and trophic transfer of copper in a coastal marine diatom. Environ. Sci. Technol. 34, 4931–4935. doi: 10.1021/es001213r
Coale, K. H. (1991). Effects of iron, manganese, copper, and zinc enrichments on productivity and biomass in the Subarctic Pacific. Limnol. Oceanogr. 36, 1851–1864. doi: 10.4319/lo.1991.36.8.1851
Coale, K. H., and Bruland, K. W. (1988). Copper complexation in the Northeast Pacific. Limnol. Oceanogr. 33, 1084–1101. doi: 10.4319/lo.1988.33.5.1084
Collier, R. W., and Edmonds, J. M. (1983). Plankton compositions and trace element fluxes from the surface ocean, in Trace Metals in Sea Water, eds C. S. Wong, E. Boyle, K. W. Bruland, J. D. Burton, and E. D. Goldberg (New York, NY: Springer), 789–809.
Cox, A. D., Noble, A. E., and Saito, M. A. (2014). Cadmium enriched stable isotope uptake and addition experiments with natural phytoplankton assemblages in the Costa Rica Upwelling Dome. Mar. Chem. 166, 70–81. doi: 10.1016/j.marchem.2014.09.009
Croot, P. L., Karlson, B., van Elteren, J. T., and Kroon, J. J. (2003). Uptake and efflux of 64Cu by the marine cyanobacterium Synechococcus (WH7803). Limnol. Oceanogr. 48, 179–188. doi: 10.4319/lo.2003.48.1.0179
Croot, P. L., Moffet, J. W., and Brand, L. E. (2000). Production of extracellular Cu complexing ligands by eucaryotic phytoplankton in response to Cu stress. Limnol. Oceanogr. 45, 619–627. doi: 10.4319/lo.2000.45.3.0619
Croot, P. L., Moffett, J. W., and Luther, G. W. (1999). Polarographic determination of half-wave potentials for copper-orgnaic complexes in seawater. Mar. Chem. 67, 219–232. doi: 10.1016/S0304-4203(99)00054-7
Cutter, G., Andersson, P., Codispoti, L., Croot, P., Francois, R., Lohan, M., et al. (2010). Sampling and Sample-Handling Protocols for GEOTRACES Cruises.
Dupont, C. L., Buck, K. N., Palenik, B., and Barbeau, K. (2010). Nickel utilization in phytoplankton assemblages from contrasting oceanic regimes. Deep Sea Res. I 57, 553–566. doi: 10.1016/j.dsr.2009.12.014
Ellwood, M. J., Nodder, S. D., King, A., Hutchins, D. A., Wilhelm, S. W., and Boyd, P. W. (2014). Pelagic iron cycling during the subtropical spring bloom, east of New Zealand. Mar. Chem. 160, 18–33. doi: 10.1016/j.marchem.2014.01.004
Foreman, M. G. G., Pal, B., and Merryfield, W. J. (2011). Trends in upwelling and downwelling winds along the British Columbia shelf. J. Geophys. Res. 116, C10023. doi: 10.1029/2011JC006995
Foster, P. L. (1977). Copper exclusion as a mechanism of heavy metal tolerance in a green alga. Nature 269, 322–323. doi: 10.1038/269322a0
Gargett, A. E. (1991). Physical processes and the maintenance of nutrient-rich euphotic zones. Limnol. Oceanogr. 36, 1527–1545. doi: 10.4319/lo.1991.36.8.1527
Gordon, A. S., Donat, J. R., Kango, R. A., Dyer, B. J., and Stuart, L. M. (2000). Dissolved copper-complexing ligands in cultures of marine bacteria and estuarine water. Mar. Chem. 70, 149–160. doi: 10.1016/S0304-4203(00)00019-0
Guo, J., Annett, A. L., Taylor, R. L., Lapi, S., Ruth, T. J., and Maldonado, M. T. (2010). Copper uptake kinetics of coastal and oceanic diatoms. J. Phycol. 46, 1218–1228. doi: 10.1111/j.1529-8817.2010.00911.x
Guo, J., Green, B. R., and Maldonado, M. T. (2015). Sequence analysis and gene expression of potential components of copper transport and homeostasis in Thalassiosira pseudonana. Protist 166, 58–77. doi: 10.1016/j.protis.2014.11.006
Guo, J., Lapi, S., Ruth, T. J., and Maldonado, M. T. (2012). The effects of iron and copper availability on the copper stoichiometry of marine phytoplankton. J. Phycol. 48, 312–325. doi: 10.1111/j.1529-8817.2012.01133.x
Hall, A., Fielding, A. H., and Butler, M. (1979). Mechanisms of copper tolerance in the marine fouling alga Ectocarpus siliculosus – evidence for an exclusion mechanism. Mar. Biol. 54, 195–199. doi: 10.1007/BF00395780
Halsey, K. J., Milligan, A. J., and Behrenfeld, M. J. (2011). Linking time-dependent carbon-fixation efficiencies in Dunaliella tertiolecta (chlorophyceae) to underlying metabolic pathways. J. Phycol. 47, 66–76. doi: 10.1111/j.1529-8817.2010.00945.x
Hamme, R. C., Webley, P. W., Crawford, W. R., Whitney, F. A., DeGrandpre, M. D., Emerson, S. R., et al. (2010). Volcanic ash fuels anomalous plankton bloom in subarctic northeast Pacific. Geophys. Res. Lett. 37, L19604. doi: 10.1029/2010GL044629
Heller, M. I., and Croot, P. L. (2015). Copper speciation and distribution in the Atlantic sector of the Southern Ocean. Mar. Chem. 173, 253–268. doi: 10.1016/j.marchem.2014.09.017
Helmers, E., and Schrems, O. (1995). Wet deposition of metals to the tropical north and south Atlantic Ocean. Atmos. Environ. 29, 2475–2484. doi: 10.1016/1352-2310(95)00159-V
Hering, J. G., and Morel, F. M. M. (1988). Kinetics of trace metal complexation: role of alkaline-earth metals. Enrivon. Sci. Technol. 22, 1469–1478. doi: 10.1021/es00177a014
Ho, T. Y., Quigg, A., Finkel, Z. V., Milligan, A. J., Wyman, K., Falkowski, P. G., et al. (2003). The elemental composition of some marine phytoplankton. J. Phycol. 39, 1145–1159. doi: 10.1111/j.0022-3646.2003.03-090.x
Hudson, R. J. M. (1998). Which aqueous species control the rates of trace metal uptake by aquatic biota? Observations and predictions of non-equilibrium effects. Sci. Total Environ. 219, 95–115. doi: 10.1016/S0048-9697(98)00230-7
Hudson, R. J., Covault, D. T., and Morel, F. M. M. (1992). Investigations of iron coordination and redox reactions in seawater using 59Fe radiometry and ion-pair solvent extraction of amphiphilic iron complexes. Mar. Chem. 38, 209–235. doi: 10.1016/0304-4203(92)90035-9
Jacquot, J. E., and Moffett, J. W. (2015). Copper distribution and speciation across the international GEOTRACES Section GA03. Mar. Chem. 116, 187–207. doi: 10.1016/j.dsr2.2014.11.013
Jacquot, J. E., Kondo, Y., Knapp, A. N., and Moffett, J. W. (2013). The speciation of copper across active gradients in nitrogen-cycle processes in the eastern tropical South Pacific. Limnol. Oceanogr. 58, 1387–1394. doi: 10.4319/lo.2013.58.4.1387
Johnson, W. K., Miller, L. A., Sutherland, N. E., and Wong, C. S. (2005). Iron transport by mesoscale Haida eddies in the Gulf of Alaska. Deep Sea Res. II 52, 933–953. doi: 10.1016/j.dsr2.2004.08.017
Jones, C. J., and Murray, J. W. (1984). Nickel, cadmium, and copper in the northeast Pacific off the coast of Washington. Limnol. Oceanogr. 29, 711–720. doi: 10.4319/lo.1984.29.4.0711
Jordi, A., Basterretxeaa, G., Tovar-Saìnchez, A., Alastuey, A., and Querol, X. (2012). Copper aerosols inhibit phytoplankton growth in the Mediterranean Sea. Proc. Nat. Acad. Sci. U.S.A. 109, 21246–21249. doi: 10.1073/pnas.1207567110
Kustka, A. B., Allen, A. E., and Morel, F. M. M. (2007). Sequence analysis and transcriptional regulation of iron acquisition genes in two marine diatoms. J. Phycol. 43, 715–729. doi: 10.1111/j.1529-8817.2007.00359.x
Kustka, A. B., Jones, B. M., Hatta, M., Field, M. P., and Milligan, A. J. (2015). The influence of iron and siderophores on eukaryotic phytoplankton growth rates and community composition in the Ross Sea. Mar. Chem. 173, 195–207. doi: 10.1016/j.marchem.2014.12.002
Lam, P. J., Bishop, J. K. B., Henning, C. C., Marcus, M. A., Waychunas, G. A., and Fung, I. Y. (2006). Wintertime phytoplankton bloom in the subarctic Pacific supported by continental margin iron. Global Biogeochem. Cycle 20, Gb1006. doi: 10.1029/2005GB002557
Lam, P. J., Twining, B. S., Jeandel, C., Roychoudhury, A., Resing, J. A., Santschi, P. H., et al. (2015). Methods for analyzing the concentration and speciation of major and trace elements in marine particles. Progr. Oceanogr. 133, 32–42. doi: 10.1016/j.pocean.2015.01.005
Lee, S., and Fuhrman, J. A. (1987). Relationships between biovolume and biomass of naturally derived marine bacterioplankton. App. Environ. Microb. 53, 1298–1303.
Levy, J. L., Stauber, J. L., and Jolley, D. F. (2007). Sensitivity of marine microalgae to copper: the effect of biotic factors on copper adsorption and toxicity. Sci. Total Environ. 387, 141–154. doi: 10.1016/j.scitotenv.2007.07.016
Löscher, B. M. (1999). Relationships among Ni, Cu, Zn, and major nutrients in the Southern Ocean. Mar. Chem. 67, 67–102. doi: 10.1016/S0304-4203(99)00050-X
Louis, Y., Garnier, C., Lenoble, V., Omanović, D., Mounier, S., and Pižeta, I. (2009). Characterisation and modelling of marine dissolved organic matter interactions with major and trace cations. Mar. Environ. Res. 67, 100–107. doi: 10.1016/j.marenvres.2008.12.002
MacIntyre, H. L., Kana, T. M., Anning, T., and Geider, R. J. (2002). Photoacclimation of photosynthesis irradiance response curves and photosynthetic pigments to microalgae and cyanobacteria. J. Phycol. 38, 17–38. doi: 10.1046/j.1529-8817.2002.00094.x
Maldonado, M. T., Allen, A. E., Chong, J. S., Lin, K., Leus, D., Karpenko, N., et al. (2006). Copper-dependent iron transport in coastal and oceanic diatoms. Limnol. Oceanogr. 51, 1729–1743. doi: 10.4319/lo.2006.51.4.1729
Maldonado, M. T., and Price, N. M. (1999). Utilization of iron bound to strong organic ligands by plankton communities in the subarctic Pacific Ocean. Deep Sea Res. II 46, 2447–2473. doi: 10.1016/S0967-0645(99)00071-5
Mann, E. L., Ahlgren, N., Moffett, J. W., and Chrisholm, S. W. (2002). Copper toxicity and cyanobacterial ecology in the Sargasso Sea. Limnol. Oceanogr. 47, 976–988. doi: 10.4319/lo.2002.47.4.0976
Martin, J. H., Bruland, K. W., and Broenkow, W. W. (1976). Cadmium transport in the California Current, in Marine Pollutant Transfer, eds H. J. Windom and R. A. Duce (Toronto, ON: Lexington Books, D. C. Health and Co.), 159–184.
Martin, J. H., Gordon, R. M., Fitzwater, S., and Broenkow, W. W. (1989). Vertex: phytoplankton/iron studies in the Gulf of Alaska. Deep Sea Res. 36, 649–680. doi: 10.1016/0198-0149(89)90144-1
McAlister, J. (2015). Biogeochemistry of Dissolved Gallium and Lead Isotopes in the Northeast Pacific and Western Arctic Oceans. Doctoral dissertation. Available online at: https://circle.ubc.ca
Moffett, J. W., and Brand, L. E. (1996). Production of strong, extracellular Cu chelators by marine cyanobacteria in response to Cu stress. Limnol. Oceanogr. 41, 388–395. doi: 10.4319/lo.1996.41.3.0388
Moffett, J. W., and Dupont, C. (2007). Cu complexation by organic ligands in the sub-arctic NW Pacific and Bering Sea. Deep Sea Res. I 54, 586–595. doi: 10.1016/j.dsr.2006.12.013
Moffett, J. W., Brand, L. E., Croot, P. L., and Barbeau, K. A. (1997). Cu speciation and cyanobacterial distribution in harbors subject to anthropogenic Cu inputs. Limnol. Oceanogr. 42, 789–799. doi: 10.4319/lo.1997.42.5.0789
Moore, J. K., Doney, S. C., and Lindsay, K. (2004). Upper ocean ecosystem dynamics and iron cycling in a global three-dimensional model. Global Biogeochem. Cycle 18, GB4028. doi: 10.1029/2004GB002220
Morel, F. M. M., Hudson, R. J. M., and Price, N. M. (1991). Limitation of productivity by trace metals in the sea. Limnol. Oceanogr. 36, 1742–1755. doi: 10.4319/lo.1991.36.8.1742
Palenik, B., and Morel, F. M. M. (1991). Amine oxidases of marine phytoplankton. Appl. Environ. Microbiol. 57, 2440–2443.
Peers, G., and Price, N. M. (2006). Copper-containing plastocyanin used for electron transport by an oceanic diatom. Nature 441, 341–344. doi: 10.1038/nature04630
Peers, G., Quesnel, S. A., and Price, N. M. (2005). Copper requirements for iron acquisition and growth of coastal and oceanic diatoms. Limnol. Oceanogr. 50, 1149–1158. doi: 10.4319/lo.2005.50.4.1149
Peña, M. A., and Varela, D. E. (2007). Seasonal and interannual variability in phytoplankton and nutrient dynamics along Line P in the NE subarctic Pacific. Prog. Oceanogr. 75, 200–222. doi: 10.1016/j.pocean.2007.08.009
Quigg, A., Reinfelder, J. R., and Fisher, N. S. (2006). Copper uptake kinetics in diverse marine phytoplankton. Limnol. Oceanogr. 51, 893–899. doi: 10.4319/lo.2006.51.2.0893
Ridge, P. G., Zhang, Y., and Gladyshev, V. N. (2008). Comparative genomic analyses of copper transporters and cuproproteomes reveal evolutionary dynamics of copper utilization and its link to oxygen. PLoS ONE 3:e1378. doi: 10.1371/journal.pone.0001378
Saito, M. A., and Moffett, J. W. (2002). Temporal and spatial variability of cobalt in the Atlantic Ocean. Geochim. Cosmochim. Acta 66, 1943–1953. doi: 10.1016/S0016-7037(02)00829-3
Semeniuk, D. M., Bundy, R. M., Payne, C. D., Barbeau, K. A., and Maldonado, M. T. (2015). Acquisition of organically complexed copper by marine phytoplankton and bacteria in the northeast subarctic Pacific Ocean. Mar. Chem. 173, 222–233. doi: 10.1016/j.marchem.2015.01.005
Semeniuk, D. M., Cullen, J. T., Johnson, W. K., Gagnon, K., Ruth, T. J., and Maldonado, M. T. (2009). Plankton copper requirements and uptake in the subarctic Northeast Pacific Ocean. Deep Sea Res. I 56, 1130–1142. doi: 10.1016/j.dsr.2009.03.003
Semeniuk, D. M., Taylor, R. L., Bundy, R. M., Johnson, W. K., Cullen, J. T., Robert, M., et al. (2016). Iron–copper interactions in iron-limited phytoplankton in the northeast subarctic Pacific Ocean. Limnol. Oceanogr. 61, 279–297. doi: 10.1002/lno.10210
Shank, G. C., Skrabal, S. A., Whitehead, R. F., and Kieber, R. J. (2004). Fluxes of strong Cu-complexing ligands from sediments of an organic-rich estuary. Est. Coast. Sci. 60, 349–358. doi: 10.1016/j.ecss.2004.01.010
Sherry, N. D., Boyd, P. W., Sugimoto, K., and Harrison, P. J. (1999). Seasonal and spatial patterns of heterotrophic bacterial production, respiration, and biomass in the subarctic NE Pacific. Deep Sea Res. II 46, 2557–2578. doi: 10.1016/S0967-0645(99)00076-4
Silver, S. (1996). Bacterial resistances to toxic metal ions - a review. Gene 179, 9–19. doi: 10.1016/S0378-1119(96)00323-X
Skrabal, S. A., Donat, J. R., and Burdige, D. J. (2000). Pore water distributions of dissolved copper and copper-complexing ligands in estuarine and coastal marine sediments. Geochim. Cosmochim. Acta 64, 1843–1857. doi: 10.1016/S0016-7037(99)00387-7
Steiner, N. S., Robert, M., Arychuk, M., Levasseaur, M. L., Merzouk, A., Peña, M. A., et al. (2012). Evaluating DMS measurements and model results in the Northeast subarctic Pacific from 1996-(2010). Biogeochemistry 110, 269–285. doi: 10.1007/s10533-011-9669-9
Sunda, W. G. (2012). Feedback interactions between trace metal nutrients and phytoplankton in the ocean. Front. Microbiol. 3:204. doi: 10.3389/fmicb.2012.00204
Sunda, W. G., and Guillard, R. R. L. (1976). Relationship between cupric ion activity and toxicity of copper to phytoplankton. Mar. Res. 34, 511–529.
Sunda, W. G., and Huntsman, S. A. (1983). Effect of competitive interactions between manganese and copper on cellular manganese and growth in estuarine and oceanic species of the diatom Thalassiosira. Limnol. Oceanogr. 28, 924–934. doi: 10.4319/lo.1983.28.5.0924
Sunda, W. G., and Huntsman, S. A. (1995). Regulation of copper concentration in the oceanic nutricline by phytoplankton uptake and regeneration cycles. Limnol. Oceanogr. 40, 132–137. doi: 10.4319/lo.1995.40.1.0132
Takano, S., Tanimizu, M., Hirata, T., and Sohrin, Y. (2014). Isotopic constraints on biogeochemical cycling of copper in the ocean. Nat. Commun. 5:5663. doi: 10.1038/ncomms6663
Taylor, R. L., Semeniuk, D. M., Payne, C. D., Zhou, J., Tremblay, J.-É., Cullen, J. T., et al. (2013). Colimitation by light, nitrate, and iron in the Beaufort Sea in late summer. J. Geophys. Res. Oceans 118, 1–17. doi: 10.1002/jgrc.20244
Thompson, C. M., Ellwood, M. J., and Sander, S. G. (2014). Dissolved copper speciation in the Tasman Sea, SW Pacific Ocean. Mar. Chem. 164, 84–94. doi: 10.1016/j.marchem.2014.06.003
Thomson, R. E. (1981). Oceanography of the British Columbia coast. Can. Spec. Publ. Fish. Aquat. Sci. 56, 291.
Timothy, D. A., Wong, C. S., Barwell-Clarke, J. E., Page, J. S., White, L. A., and Macdonald, R. W. (2013). Climatology of sediment flux and composition in the subarctic Northeast Pacific Ocean with biogeochemical implications. Progr. Oceanogr. 116, 95–129. doi: 10.1016/j.pocean.2013.06.017
Turner, D. R., Whitfield, M., and Dickson, A. G. (1981). The equilibrium speciation of dissolved components in freshwater and seawater at 25°C and 1 atm pressure. Geochim. Coscmochim. Acta 45, 855–881. doi: 10.1016/0016-7037(81)90115-0
Twining, B. S., Baines, S. B., Fisher, N. S., Maser, J., Vogt, S., Jacobsen, C., et al. (2003). Quantifying trace elements in individual aquatic protist cells with a synchrotron X-ray fluorescence microprobe. Anal. Chem. 75, 3806–3816. doi: 10.1021/ac034227z
Twining, B. S., Nodder, S. D., King, A. L., Hutchins, D. A., LeCleir, G. R., DeBruyn, J. M., et al. (2014). Differential remineralization of major and trace elements in sinking diatoms. Limnol. Oceanogr. 59, 689–704. doi: 10.4319/lo.2014.59.3.0689
Twining, B. S., Rauschenberg, S., Morton, P. L., and Vogt, S. (2015). Metal contents of phytoplankton and labile particulate material in the North Atlantic Ocean. Progr. Oceanogr. 137, 261–283. doi: 10.1016/j.pocean.2015.07.001
van den Berg, D. M. G. (1984). Determination of the complexing capacity and conditional stability constants of complexed of copper(II) with natural organic ligands in seawater by cathodic stripping voltammetry of copper-catechol complex ons. Mar. Chem. 15, 1–18. doi: 10.1016/0304-4203(84)90035-5
Walsh, M. J., Goodnow, S. D., Vezeau, G. E., Richter, L. V., and Ahner, B. A. (2015). Cysteine enhances bioavailability of copper to marine phytoplankton. Environ. Sci. Technol. 49, 12145–12152. doi: 10.1021/acs.est.5b02112
Wells, M. L., Trick, C. G., Cochlan, W. P., Hughes, M. P., and Trainer, V. L. (2005). Domoic acid: the synergy of iron, copper, and the toxicity of diatoms. Limnol. Oceanogr. 50, 1908–1917. doi: 10.4319/lo.2005.50.6.1908
Whitby, H., and van den Berg, C. M. G. (2015). Evidence for copper-binding humic substances in seawater. Mar. Chem. 173, 282–290. doi: 10.1016/j.marchem.2014.09.011
Whitney, F. A., and Freeland, H. J. (1999). Variability in upper-ocean water properties in the NE Pacific Ocean. Deep Sea Res. II 46, 2351–2370. doi: 10.1016/S0967-0645(99)00067-3
Wiramanaden, C. I. E., Cullen, J. T., Ross, A. R. S., and Orians, K. J. (2008). Cyanobacterial copper-binding ligands isolated from artificial seawater cultures. Mar. Chem. 110, 28–41. doi: 10.1016/j.marchem.2008.02.003
Witter, A. E., Hutchins, D. A., Butler, A., and Luther, G. W. (2000). Determination of conditional stability constants and kinetic constants for strong model Fe-binding ligands in seawater. Mar. Chem. 69, 1–17. doi: 10.1016/S0304-4203(99)00087-0
Keywords: iron, copper, uptake, trace metal, ligand, northeast subarctic Pacific Ocean, Line P
Citation: Semeniuk DM, Bundy RM, Posacka AM, Robert M, Barbeau KA and Maldonado MT (2016) Using 67Cu to Study the Biogeochemical Cycling of Copper in the Northeast Subarctic Pacific Ocean. Front. Mar. Sci. 3:78. doi: 10.3389/fmars.2016.00078
Received: 28 January 2016; Accepted: 06 May 2016;
Published: 03 June 2016.
Edited by:
Sylvia Gertrud Sander, University of Otago, New ZealandReviewed by:
Benjamin Twining, Bigelow Laboratory for Ocean Sciences, USACédric Garnier, Université de Toulon, France
Copyright © 2016 Semeniuk, Bundy, Posacka, Robert, Barbeau and Maldonado. This is an open-access article distributed under the terms of the Creative Commons Attribution License (CC BY). The use, distribution or reproduction in other forums is permitted, provided the original author(s) or licensor are credited and that the original publication in this journal is cited, in accordance with accepted academic practice. No use, distribution or reproduction is permitted which does not comply with these terms.
*Correspondence: David M. Semeniuk, david.semeniuk@gmail.com
†Present Address: David M. Semeniuk, Institute of Geological Sciences and Oeschger Center for Climate Change Research, University of Bern, Bern, Switzerland;
Randelle M. Bundy, Marine Chemistry and Geochemistry, Woods Hole Oceanographic Institution, Woods Hole, MA, USA