Worldwide Analysis of Sedimentary DNA Reveals Major Gaps in Taxonomic Knowledge of Deep-Sea Benthos
 Frédéric Sinniger1,2*
  Jan Pawlowski3
  Saki Harii1
  Andrew J. Gooday4
  Hiroyuki Yamamoto2
  Pierre Chevaldonné5
  Tomas Cedhagen6 Gary Carvalho7 Simon Creer7
- 1Tropical Biosphere Research Center, University of the Ryukyus, Motobu, Okinawa, Japan
- 2Research and Development Center for Submarine Resources, Japan Agency for Marine-Earth Science and Technology, Yokosuka, Japan
- 3Department of Genetics and Evolution, University of Geneva, Geneva, Switzerland
- 4National Oceanography Centre, University of Southampton Waterfront Campus, Southampton, UK
- 5IMBE, Centre National de la Recherche Scientifique, Aix Marseille Université, IRD, Avignon Université, Marseille, France
- 6Department of Biosciences, Aarhus University, Aarhus, Denmark
- 7School of Biological Sciences, Bangor University, Bangor, UK
Deep-sea sediments represent the largest but least known ecosystem on earth. With increasing anthropogenic pressure, it is now a matter of urgency to improve our understanding of deep-sea biodiversity. Traditional morpho-taxonomic studies suggest that the ocean floor hosts extraordinarily diverse benthic communities. However, due to both its remoteness and a lack of expert taxonomists, assessing deep-sea diversity is a very challenging task. Environmental DNA (eDNA) metabarcoding offers a powerful tool to complement morpho-taxonomic studies. Here we use eDNA to assess benthic metazoan diversity in 39 deep-sea sediment samples from bathyal and abyssal depths worldwide. The eDNA dataset was dominated by meiobenthic taxa and we identified all animal phyla commonly found in the deep-sea benthos; yet, the diversity within these phyla remains largely unknown. The large numbers of taxonomically unassigned molecular operational taxonomic units (OTUs) were not equally distributed among phyla, with nematodes and platyhelminthes being the most poorly characterized from a taxonomic perspective. While the data obtained here reveal pronounced heterogeneity and vast amounts of unknown biodiversity in the deep sea, they also expose the difficulties in exploiting metabarcoding datasets resulting from the lack of taxonomic knowledge and appropriate reference databases. Overall, our study demonstrates the promising potential of eDNA metabarcoding to accelerate the assessment of deep-sea biodiversity for pure and applied deep-sea environmental research but also emphasizes the necessity to integrate such new approaches with traditional morphology-based examination of deep-sea organisms.
Introduction
Prior to global industrialisation, the deep sea was protected from human influence by its remoteness. However, the impacts of human activities have increased rapidly in recent decades (Glover and Smith, 2003; Benn et al., 2010), mainly through waste disposal (e.g., Thiel, 2003; Watters et al., 2010; Miyake et al., 2011; Ramirez-Llodra et al., 2013) and the expansion of fishing and hydrocarbon extraction to bathyal depths on continental margins (e.g., Koslow et al., 2000; Roberts, 2002; Clark, 2009). The mining of metal-rich minerals in environments ranging from abyssal plains to hydrothermal vents and seamounts is a serious prospect in the fairly near future (e.g., Wedding et al., 2013; Fisher et al., 2014; Schlacher et al., 2014; Van Dover, 2014). Such combinations of different direct anthropogenic stressors will likely exacerbate multiple interacting stressors arising from climatic changes acting at a global scale (Mora et al., 2013; Jones et al., 2014), creating major threats to the largest environment on Earth (Ramirez-Llodra et al., 2011). Environmental stresses on whole ecosystems led to a loss of biodiversity observed worldwide, with consequences to ecosystem functioning (Worm et al., 2006; Hooper et al., 2012). It is, therefore, essential to acquire baseline information on deep-sea diversity in order to establish reference data reflecting near pristine or less impacted habitats. Such baseline studies are crucial to the assessment of changes in deep-sea ecosystems resulting from the increasing human activity.
The World Register of Marine Species (WoRMS Editorial Board, 2014) lists 23,708 metazoan species found in the deep sea (Figure 1). Arthropods, chordates, molluscs, annelids, and echinoderms dominate this inventory of deep-sea species. Although such richness is certainly an underestimate, there is no consensus on how many deep-sea species exist (Miljutin et al., 2010), in part because of uncertainty concerning their distribution patterns in a vast and chronically undersampled environment (McClain and Hardy, 2010). The lack of publicly available molecular data, with only about one fifth of the inventoried species (4918) being associated with such data in publicly accessible databases (Figure 1), coupled with the particularly challenging taxonomic identification of meiofauna (Herman and Heip, 1988; Giere, 2008), illustrate clearly the difficulty in assessing metazoan diversity in deep-sea sediments mainly inhabited by small-sized animals (e.g., Thiel, 1975, 1983).
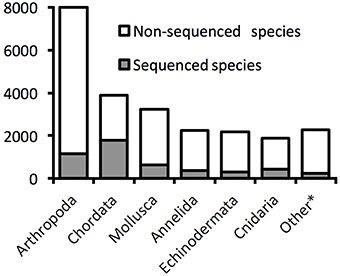
Figure 1. Proportions of deep-sea species with available DNA sequences on GenBank. The numbers are based on valid species described and registered in the World Register of Deep-Sea Species. The category “Other” groups Porifera, Bryozoan, Nematoda, Brachiopoda, Platyhleminthes, Sipuncula, Echiura, Chaetognatha, Nemertea, Ctenophora, Tardigrada, Hemichordata, Cephalorhyncha, Dicyemida, Acanthocephala, Entoprocta, Gastrotricha, Phoronida (listed by order of described species number). Data accessed 17.10.2014.
The development of DNA barcoding has substantially improved taxonomic knowledge in some groups that are difficult to identify morphologically (Blaxter, 2004). Investigation of the molecular signatures of benthic fauna in environmental samples was therefore the logical development of DNA barcoding approaches (Markmann and Tautz, 2005). In recent years, en mass sequencing of environmentally derived DNA has expanded rapidly with the availability of high-throughput sequencing technologies, commonly referred to as metabarcoding (Taberlet et al., 2012b). We consider environmental DNA (eDNA) to comprise not only DNA from living species, including their eggs and larvae, but also DNA from fragments of dead organisms, gut contents and extracellular DNA (Taberlet et al., 2012a). Since marine sediments host a tremendous diversity of eukaryotic organisms, metabarcoding is particularly useful because of its potential to explore the biodiversity of all taxa in parallel (Bik et al., 2012b). Such an approach has revealed novel biodiversity in various coastal environments (e.g., Chariton et al., 2010; Fonseca et al., 2010; Bik et al., 2012a; Lallias et al., 2014; Pawlowski et al., 2014; Cowart et al., 2015). However, despite the dynamic expansion of eDNA studies, little metabarcoding information is available for benthic diversity at bathyal and abyssal depths (Pawlowski et al., 2011). High-throughput sequencing of deep-sea sedimentary eDNA has revealed a high level of previously unknown diversity among benthic foraminifera (Lecroq et al., 2011) and other deep-sea protists (Stock et al., 2013). Moreover, the capacity of deep-sea sediments to preserve DNA (Corinaldesi et al., 2011) has allowed inferences to be drawn about the past biodiversity of planktonic and benthic eukaryotes (Lejzerowicz et al., 2013). Metabarcoding has also been used to explore biogeographic patterns of microbial eukaryotes in the deep sea (Bik et al., 2012c; Guardiola et al., 2015). Thus, in many different ways, limited studies on eDNA clearly show the strong potential of metabarcoding in deep-sea biodiversity research where samples are scarce and expensive to collect.
Here, we use eDNA metabarcoding to identify gaps in our taxonomic knowledge of deep-sea biodiversity. We address this issue using en masse sampling of sediments from deep-sea environments distributed worldwide from upper bathyal (a few hundred meters depth) to abyssal (4–5 km below sea surface) depths. We use our global dataset to (a) test the potential of eDNA metabarcoding to assess deep-sea biodiversity and (b) identify the taxonomic breadth of hitherto unknown benthic diversity.
Methods
Sampling and DNA Extractions
Sediments were collected during various cruises worldwide, mostly at abyssal and bathyal depths (see Table S1 and Figure 2), and stored at −80°C. The sampling methods differed depending on the cruises (multicores, box cores, grab samples). Subsamples were obtained following a standardized method from the more or less undisturbed surficial sediments collected by the sampling gear. The samples consisted of fine mud, except for the Maud Rise samples that included a larger sand fraction. Only surface sediments (approximately within the first 3 cm) were processed. For each location, four DNA extractions were performed using MOBIO PowerMax extraction kits with <10 g of sediments (corresponding to a volume of between 5 and <10 ml depending on the nature of the sediments). In addition, for Northwest Pacific, Arctic, Southern Ocean, and South Atlantic samples, 8 replicates of <1 g of sediments (roughly corresponding to 0.7–1 ml each) were extracted using MOBIO PowerSoil extraction kits.
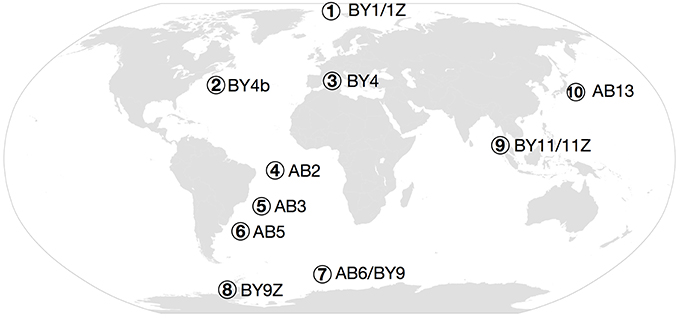
Figure 2. Map of the sampled regions. (1) Arctic (BY1 and BY1Z), (2) NW Atlantic (BY4b), (3) Mediterranean Sea (BY4), (4) Pernambuco Abyssal Plain (AB2), (5) Brazil Basin (AB3), (6) Argentinean Basin (AB5), (7) Southern Ocean (AB6 and BY9), (8) Antarctic Peninsula (BY9Z), (9) Andaman Sea (BY11), (10) NW Pacific (AB13).
PCR Amplification and 454 Sequencing
Preparation of amplicon libraries for 454 sequencing of the V1-V2 region of the nuclear small ribosomal subunit (18S) followed the protocols described previously (Fonseca et al., 2010). In order to maximize inclusion of metazoans in the primer mix, primer R22 (Blaxter et al., 1998) was modified as follows: R22mod 5′CCTGCTGCCTTCCTTRGA3′, the primer F04 was left unmodified. Compared to the original R22 primer and based on sequences of various phyla from GenBank, R22mod was shortened to remove mismatches in some groups (cnidarians, echinoderms, priapulids, and kinorhynchs) and one ambiguity (R) was added to accommodate the presence of a thymidine (T) instead of a cytidine (C) at this position in brachiopods, bryozoan, kinorhynchs, rotifers, and within several other groups. The PCR amplifications were performed directly using the combined 454 adaptors, link, MID (Molecular Identifier) tags and primers. MID tags were inserted only in the forward primers as sequencing was made unidirectionally and 8 bp MID tags were used to distinguish between independent samples (Table S2). In order to reduce chimera artifacts created during the PCR (Fonseca et al., 2012), we reduced the PCR cycles to 23–25 cycles. The positive amplifications were identified on a 1.5% agarose gel stained with ethidium bromide. Five amplifications were performed in parallel for each core and extraction method. PCR products for each sample were pooled on a 2% agarose gel, and then excised bands were purified using the QIAquick PCR purification kit (Qiagen). The purified products were quantified using a Bioanalyzer (Agilent) and sequenced on a 454 Roche GSFLX sequencer on either quartets, or half plates at the sequencing platform of Liverpool University.
Sequence Analyses
Sequences were analyzed using the QIIME 1.7 (Caporaso et al., 2010). Raw reads were assigned to samples based on MID tags and checked for quality using split_libraries.py. All sequences shorter than 200 bp were discarded, minimum quality score was set at 25 and maximum homopolymer run was set at 6 bp. No mismatches in primer or MID tags were tolerated. In order to reduce the potential bias introduced by intragenomic variability and sequencing errors, OTUs were clustered at 97% identities. Cluster seeds were selected as representative sequences for each OTUs using pick_rep_set.py in QIIME 1.7. Sequences were aligned using align_seqs.py and the aligned s108 SILVA database as template. Chimeric sequences were removed using identify_chimeric_seqs.py and ChimeraSlayer in QIIME 1.7 and single singletons (i.e., single sequences present in a single sample) were removed from the dataset.
The 18S sequences were then compared, using the BLAST method with an E-value threshold of 1e−100, against a reference database consisting of a “customized” version of the Silva database s108 release formatted for use within the QIIME pipeline (Caporaso et al., 2010), using assign_taxonomy.py in QIIME 1.7. The E-value threshold was empirically determined following the observation that the default parameter (E-value threshold of 0.001) provided an unrealistic number of identified OTUs, which after verification were often only poorly related to the assigned taxa, even at phylum level. Several OTUs were independently compared to the GenBank database and the E-values below 1e−100 did not allow reliable identification at phylum level in many cases. As a result, we chose to use a strict E-value threshold to limit “folkloric” taxonomic assignments. The database was customized by correcting some obvious misidentification (e.g., a copepod crustacean sequence labeled as octocoral cnidarian) and adding recent deep-sea sequences obtained from public databases and individual sequencing of deep-sea organisms. All “uncultured (marine) eukaryote” or environmental samples identified above the phylum level were also removed from the reference database. Raw 454 reads and reference database are available on the European Nucleotide Archive (Acc. No. PRJEB 13170) and in the supplementary material.
After taxonomic assignment, a phylogenetic tree was built with the unassigned sequences and the branch corresponding to metazoans was identified by independent blasts against the GenBank database. All the sequences forming the branch identified with confidence as metazoan were isolated and merged to the metazoan dataset with the following taxonomic assignment “Eukaryota; Metazoa; no blast hit.” However, because of the conservative approach chosen, and based on the limited phylogenetic resolution provided by the fragment analyzed, the most basal metazoan OTUs (such as those assigned to sponges) may not have been included in the “metazoan branch.” The decision to restrict the analyses to metazoans reflects the fact that the original primers were specific to metazoans and the observation that one major group of deep-sea protists, the foraminifera, was not found in our dataset, thus providing a biased estimation of deep-sea eukaryotic biodiversity.
Alpha diversity was measured using the simple “observed OTU” metric in order to estimate the depth of sequencing for the sediments analyses. OTU networks, linking the OTUs to the different biogeographic provinces in which they were found, were built using make_otu_network.py in QIIME 1.7 and drawn in Cytoscape 2.7.0 (Shannon et al., 2003) using the unweighted spring embedded layout. Beta diversity analyses were conducted using the unweighted UNIFRAC method (Lozupone and Knight, 2005) implemented in QIIME 1.7. This method takes into account the phylogenetic information in the dataset. The unweighted approach allows the use of only qualitative data (i.e., presence/absence) and reduces bias from quantitative results. While this approach increases the importance of rare taxa, the quantitative bias potentially induced by the biomass (Bohmann et al., 2014; Hirai et al., 2015) was estimated too high considering the minimal amounts of sediments used. Unrarefied data allowed us to consider the total diversity recovered from the samples analyzed. However, in order to make more objective comparisons between heterogeneous samples, Principal Coordinates Analyses of beta diversity was performed based on 100 rarefied datasets at 4488 metazoan reads per province. The same beta-diversity distances matrices were used to build UPGMA trees. Bootstrap support was calculated based on the 100 rarefied datasets. Biogeographic comparisons are based on the lower bathyal and abyssal provinces described in Watling et al. (2013). According to the latter (Watling et al., 2013), the Mediterranean Sea and the North Atlantic both belong to the same bathyal province BY4. However, based on the differences in our sampling locations and data, as well as the suggestion made by Watling et al. (2013) that this province may require subdivision based on differences in environmental parameters such as temperature, we decided to treat both locations separately and refer to the bathyal Mediterranean as BY4 and the bathyal NW Atlantic as BY4b. Additionally, since Watling et al. (2013) did not divide upper bathyal regions (300–800 m depth) into provinces, we identified our upper bathyal regions by adding a “Z” to the name (i.e., BY1Z, BY9Z, and BY11Z).
Results
Taxonomic Composition
After quality checking, and removal of chimera and single singletons (i.e., single reads present in a single sample, rather than reads being single in each of a few samples), the resulting dataset contained 530976 reads (from 3819 to 97456 reads per location), 38% of which could be confidently assigned to metazoans using a combination of BLAST and the phylogenetic approach (Table 1). The remaining reads were assigned to various other eukaryotic groups (e.g., Stramenopiles, Fungi). The distribution of reads within the different metazoan groups was highly variable between locations with a large dominance of annelids at nearly half of the sampling sites. Nematodes were also sequenced abundantly in several samples followed by arthropods and a large proportion of reads that could not be confidently assigned by BLAST methods to any specific phylum (Figure 3).
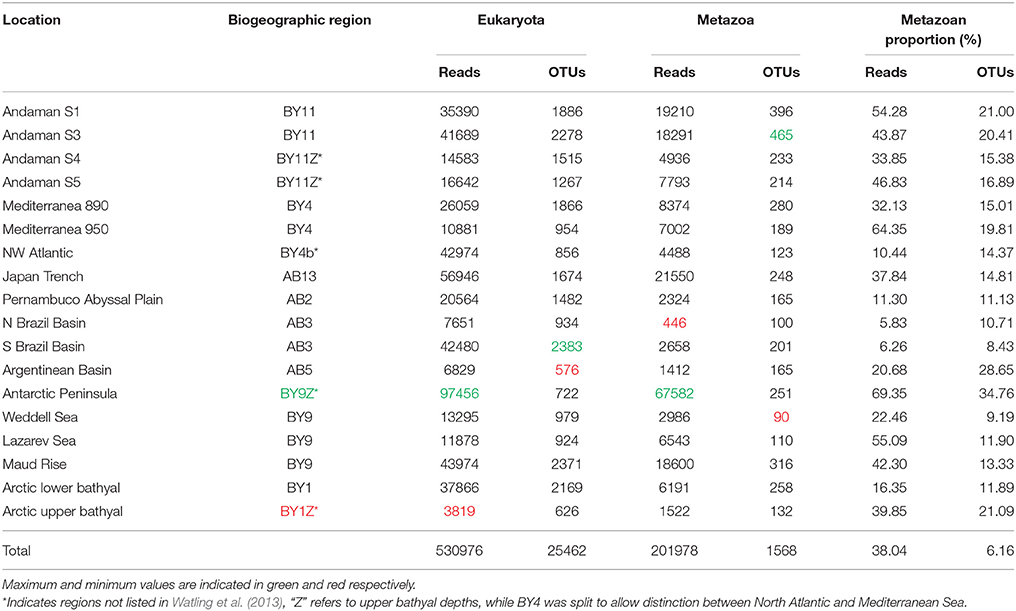
Table 1. Amounts and proportions of reads/OTUs for each location.
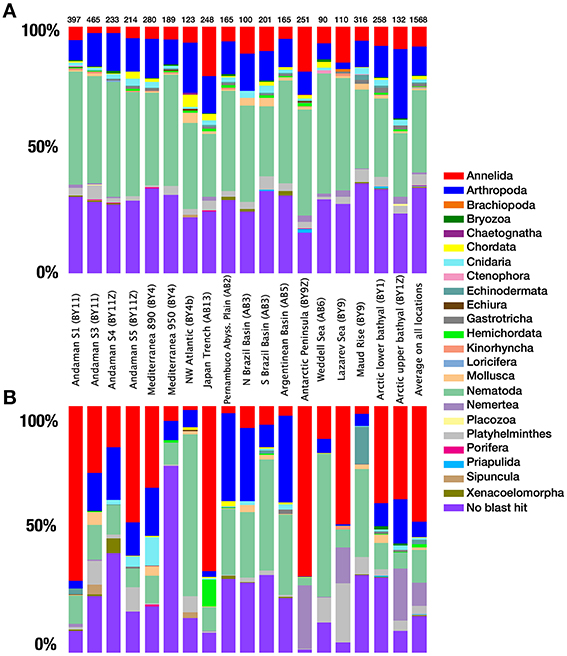
Figure 3. Taxonomic composition. (A) Species richness, contribution of OTUs from different phyla to the total metazoan species richness for each province. (B) Quantitative distribution of the reads from each phyla to the total amount of metazoan reads for each province. The number of metazoan reads obtained for each location is indicated above each column. The last column represents the proportions based on all locations.
OTU richness data showed less variation between locations compared to abundance data (Figure 3). At a clustering threshold of 97%, metazoan OTUs represented between 8.4% (S Brazil Basin, abyssal) and 34.8% (Antarctic Peninsula) of the total eukaryotic richness for each site. Metazoan diversity was largely dominated by nematodes, which formed the most diverse group in all samples (from 25.4 to 48.9%). The next most diverse phyla were arthropods (mainly copepods) and annelids, followed by platyhelminthes (Figure 3A). These four groups comprised nearly 88% of the total number of assigned OTUs. The remaining OTUs were assigned to 19 other phyla. Among the unassigned OTUs that could not be reliably recognized using BLAST with the strict E-value threshold selected here, individual BLAST of some OTUS against GenBank database suggests that they likely belong to the phyla Mesozoa and Tardigrada. Combined, the taxa inferred to be present based on our data represented almost all higher-level diversity of marine Metazoa (with the exception of a few minor phyla such as Acanthocephala, Entoprocta, and Phoronida).
A substantial diversity of orders and families was recovered within each of the three major phyla (nematodes, annelids, arthropods), based on BLAST data. At order level, the diversity was relatively equally distributed among nematodes, with less than a quarter of OTUs belonging to the order Enoplida (Figure 4A). The arthropods were clearly dominated by harpacticoid copepods (68%) (Figure 4B), while more than 50% of annelids belonged to the infraclass Scolecida or orders Spionida and Terebellida (Figure 4C). Within orders, a wide diversity of families has been observed in the three major phyla (Figures 4A–C).
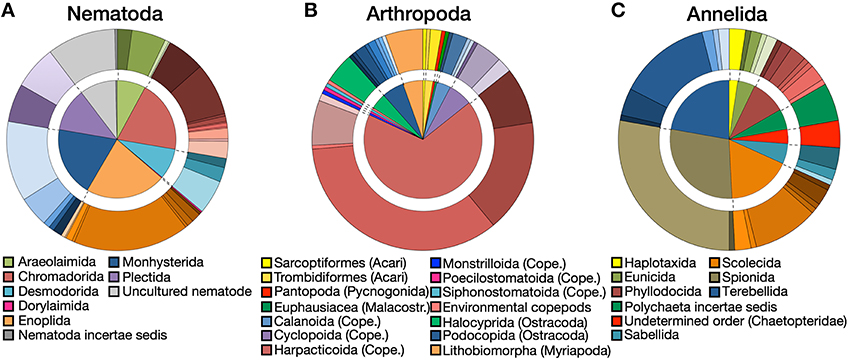
Figure 4. Order and family diversity. Proportions at order (inside chart) and family (outside chart) levels for (A) nematodes, (B) arthropods, and (C) annelids. Different shades of the same color in the outside charts indicate different families within each order. Detailed legends on the family charts are available in Figure S1.
Phylogenetic analyses of metazoan OTUs (97% identity threshold) showed the uneven distribution of unidentified OTUs (in red in Figure 5) throughout the resulting tree. Although the unknown OTUs were found in almost all taxonomic groupings, several clusters were composed mainly of unassigned OTUs. Our analyses confirmed the impressive diversity of nematodes, representing almost half of the tree (Figure 5), although a significant part of this diversity may originate from intragenomic polymorphisms (Dell'Anno et al., 2015). Other monophyletic clusters were formed by the superphylum Deuterostomia, the phylum Gastrotricha, the class Ostracoda and the subclass Copepoda. The Copepoda comprised mainly harpacticoids as shown by a comparison between OTUs assigned to copepods and sequences of harpacticoids available in the database (Figure S2).
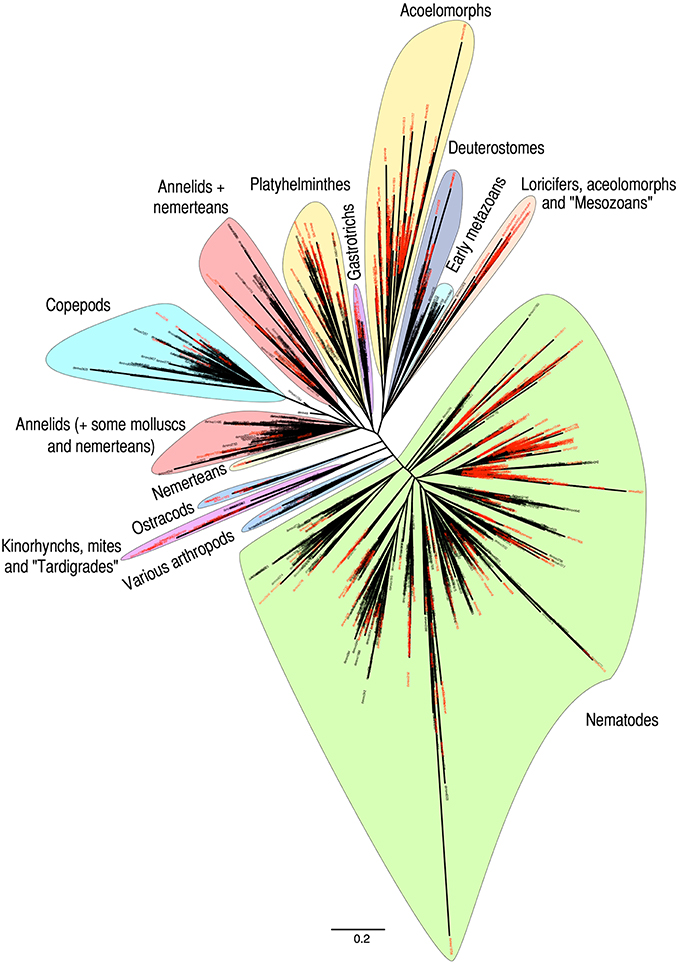
Figure 5. Phylogenetic distance tree obtained from all metazoan OTUs. OTUs unassigned using BLAST are named in red. Major taxa identified through independent BLASTs are highlighted. Names within quotation marks indicate taxa corresponding to OTUs that could not be reliably identified by BLAST but that were subsequently identified using the complete GenBank database and phylogenetic distance with reference sequences. Branch lengths are representative of the genetic distances between sequences.
Several clades were formed by OTUs belonging to different taxonomic groups (Figure 5). The annelids grouped with the molluscs, the kinorhynchs grouped with mites and potential tardigrades while the echinoderms clustered with hemichordates and chordates forming a deuterostome clade. Within deuterostomes, detailed observation showed that echinoderms, hemichordates, vertebrates, and tunicates formed independent sub-clusters with tunicates appearing clearly distinct at the base of this group (data not shown). Early metazoans (sponges, placozoans, and cnidarians) also formed a monophyletic group branching between the deuterostomes and the clade comprising loriciferans, aceolomorphs and putative mesozoans. Nemerteans were either located within the two clades containing annelids or formed an independent cluster nearby. Within this “nemertean only” cluster, it is interesting to note the presence of a few “platyhelminthes” OTUs assigned to the flatworm “Nematoplana sp.” However, most likely the reference sequence from the public database originates from a misidentified specimen (sequence GenBank D85093). Except for this likely artefactual identification, all platyhelminthes clustered together in a monophyletic group. Interestingly, aside from the platyhelminthes cluster, which already includes a significant number of unassigned OTUs, another large clade is composed exclusively of unassigned OTUs. While no reliable BLAST identification could be obtained, these OTUs appear to be related to acoelomorphs. Although meiobenthic tunicates can be found, the presence of DNA from vertebrates (fish and cetacean) and most likely planktonic tunicates illustrates well the potential of eDNA to amplify not only organisms physically present in the sediments but also both indigenous and allochthonous extracellular DNA.
Biogeographic Patterns
When considering all provinces regardless of the depth, out of the 1570 metazoan OTUs recovered, only 3 OTUs were shared among all 13 provinces (a harpacticoid copepod, a nematode and an unassigned OTU), 18 additional OTUs were found in 10–12 provinces (7 nematodes, 3 copepods and another undefined arthropod, 2 annelids, 1 hemichordate, and 4 unassigned OTUs). No evidence was found for a higher proportion of predominantly planktonic groups, such as Ctenophora and Chaetognatha, among “cosmopolitan” OTUs, although some tunicates, hydrozoans and halocyprid ostracods observed in the abyssal provinces might have originated from the water column. Such findings correspond with the overall low representation of OTUs originating from the water column.
The spring embedded network visualization of OTUs distributes the provinces on the network in order to minimize the differences in lengths of the edges connecting OTUs to the provinces (i.e., in a similar way as if the edges would be springs connecting balls corresponding to OTUs and provinces). Although easily saturated when including large amounts of OTUs, this method of visualizing the distribution showed that the geographic distribution of OTUs appeared not random for several taxonomic groups. In annelids, the OTUs from abyssal provinces tended to cluster together, separated from the upper bathyal provinces by the lower bathyal provinces. Moreover, the two polar lower bathyal provinces grouped near the abyssal ones while the two polar upper bathyal provinces appeared more isolated (Figure 6A).
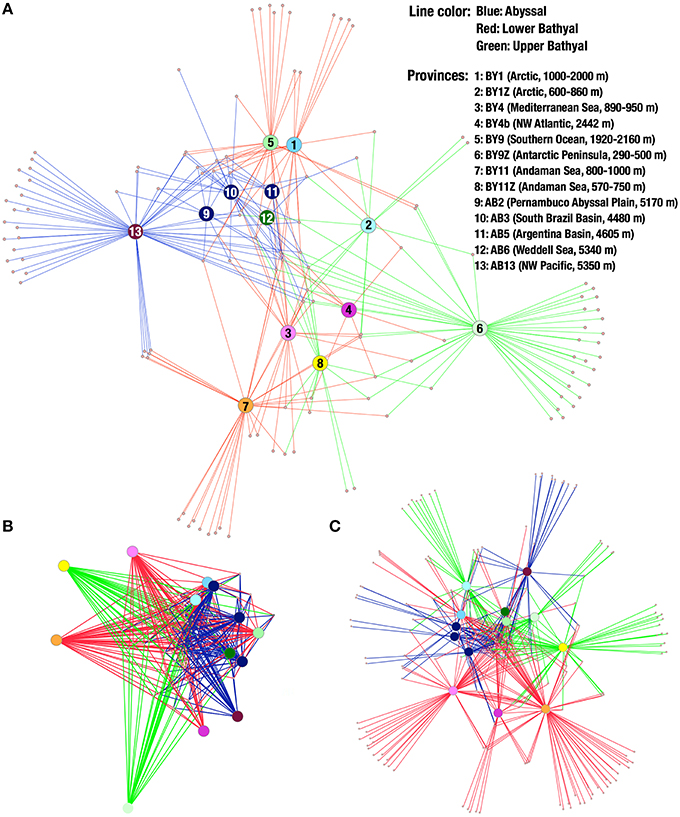
Figure 6. (A) Annelid OTU network. Small dots represent OTUs and larger discs represent provinces. Lines connect OTUs to the provinces they were found. Lines are colored according to depth: blue, abyssal; red, lower bathyal; green, upper bathyal. (B) Network of nematode OTUs shared by 6 provinces or more. (C) Network of all arthropod OTUs.
Such patterns are not visible for all phyla, but the pattern observed in the Nematoda (Figure 6B, based on OTUs shared by 6 provinces or more) tends to suggest relationships between abyssal provinces, although more appropriate sampling is required to explore biogeography in details. Compared to the patterns obtained with annelid OTUs, the upper bathyal Arctic also grouped close to the South Atlantic and Weddell Sea abyssal provinces. Moreover, the polar bathyal provinces clustered near or even within abyssal provinces in the nematodes data. The network made from arthropod MOTUs (Figure 6C, including all OTUs) showed a different pattern with the Southern Ocean provinces clustering together, as well as the Arctic and abyssal South Atlantic provinces. The single abyssal Pacific province (NW Pacific, on the edge of the Japan Trench) appears relatively isolated from the other abyssal provinces and the Mediterranean, NW Atlantic and two Andaman Sea provinces all appear quite isolated from each other and from the other provinces.
While networks facilitate the visualization of the OTUs distributions, they are limited to taxonomic groups with limited numbers of OTUs (otherwise the network will saturate) and are directly affected by the sequencing depth (not rarefied). Principal coordinate analyses (PCoA) on rarefied dataset of all metazoan OTUs provided a more robust comparison of the different locations (Figure 7). Unfortunately, the rarefaction threshold of 4488 metazoan reads per location did not allow the inclusion of several locations in the analyses (e.g., most abyssal locations including all the equatorial and South Atlantic locations, see Table 1). Nevertheless, all the locations in Andaman Sea, the province with the most locations sampled, clustered relatively closely together. The two Mediterranean locations also grouped within this cluster. The situation was different for the lower bathyal Southern Ocean, for which the two sampled locations considered did not group together. One possible reason for the difference observed between the Lazarev Sea and the Maud Rise, may be related to the sediment characteristics, as Maud Rise sediments sampled were sandier than the fine muddy sediments from Lazarev Sea. Moreover, compared to the distances between the locations within Mediterranean Sea or within Andaman Sea, the Maud Rise was much more distant from the Lazarev Sea, increasing the possibility of different ecosystems being sampled (Giere, 2008).
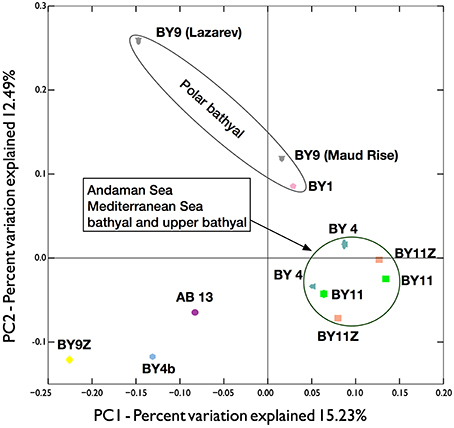
Figure 7. Principal Coordinate Analyses (PCoA) plot of the beta diversity distances obtained from the unweighted UNIFRAC analyses on 100 independent resampling of 4488 metazoan reads per province (most abyssal samples did not reach this threshold and were discarded from the analyses). Symbol color correspond to the biogeographic regions, overlapping ellipses (most often masked by the symbols) represent the interquartile range. Gray triangles, BY9 (Southern Ocean with Lazarev Sea and Maud Rise); pink pentagon, BY1 (Arctic); petrol blue triangles, BY4 (Mediterranea); green squares, BY11 (bathyal Andaman Sea); salmon squares, BY11Z (upper bathyal Andaman Sea); yellow diamond, BY9Z (upper bathyal Antarctic peninsula); blue hexagon, BY4b (NW Atlantic); purple circle, AB13 (Abyssal NW Pacific).
Discussion
Most Deep-Sea Diversity is Unknown
Pioneering investigations in the 1960s (e.g., Hessler and Sanders, 1967; Sanders and Hessler, 1969), together with more recent studies (e.g., Snelgrove and Smith, 2002; Brandt et al., 2007; Rex and Etter, 2010) on bathyal and abyssal fauna, have challenged the long-held notion that the deep sea hosts a low diversity of metazoan organisms. Our results, based on the total DNA from the sediments (including organismal and extraorganismal DNA), reveal a large proportion of unassigned OTUs (Figure 5). Although there is not necessarily a direct correspondence between DNA sequence data and morphological species diversity, these results do suggest that significant unknown diversity exists in deep-sea sediments at different taxonomic levels, supporting the idea of a highly diverse deep-sea fauna. Moreover, the irregular distribution of unassigned OTUs in the phylogenetic tree provides clear evidence that some taxonomic groups are particularly understudied. These less sequenced groups include cryptic and/or fragile organisms such as the acoelomorphs and loriciferans, which are rarely seen in deep-sea samples, as well as several groups of nematodes.
Based on the rate at which new taxonomic descriptions are being published, it has been proposed recently that most biodiversity on Earth might be described in the relatively near future (e.g., Appeltans et al., 2012; Costello et al., 2013). A distinction does need to be made between species that have been described taxonomically and those that have only been sequenced (Figure 1). Nevertheless, by suggesting that important unknown genetic diversity exists within several deep-sea metazoan phyla (Figure 4), our results tend to challenge these ambitious predictions and support the view that a large part of the planet's biodiversity remains to be discovered in the deep sea (e.g., Grassle and Maciolek, 1992; Poore and Wilson, 1993; Brandt et al., 2007; George et al., 2014). Many of these OTUs could not be assigned to any taxonomic group and some could therefore represent new higher taxa. Unfortunately, no DNA information is available for much of the known deep-sea metazoan diversity (Figure 1) and their novelty is therefore impossible to confirm. These uncertainties should not undermine the potential of metabarcoding to better understand the diversity of poorly known communities. Indeed, the total information obtained from a large number of taxa in parallel provides a good estimator of environmental community diversity that has many practical applications for ecosystem assessment and monitoring (Chariton et al., 2010, 2014; Czernik et al., 2013; Stephenson et al., 2013; Lallias et al., 2014; Pawlowski et al., 2014; Willerslev et al., 2014; Guardiola et al., 2015; Lejzerowicz et al., 2015; Pochon et al., 2015; Boschen et al., 2016).
Almost all marine benthic phyla were found in the sediments analyzed and even with a conservative OTU clustering threshold of 97% and a limited number of samples, a wide diversity of OTUs was identified within the dominant phyla (Figure 5, Figure S2). The prevalence of nematodes and other meiofaunal groups is immediately apparent and confirms that meiofauna are an important component of the deep-sea benthic biodiversity. Such community composition is consistent with the slower rate of decline in the abundance and biomass of metazoan meiofauna from bathyal to abyssal regions compared to that of larger animals (macrofauna and megafauna) (e.g., Thiel, 1975; Rex et al., 2006; Rex and Etter, 2010). However, the absence of some macrobenthic taxa (e.g., peracarid crustaceans) and particularly of megabenthos such as decapod crustaceans, sea cucumbers and fish, which are very common in the deep sea, can be partially explained by the limited volume of analyzed sediment samples (i.e., <10 ml per core). The megafaunal (vertebrate) sequences found in our data clearly originate from extracellular DNA and illustrate well the potential of eDNA to inform not only on the organisms physically present in the sample but also on DNA traces of large sized species.
In comparison with previous studies, we retrieved a lower proportion of metazoans than when the meiobenthos is isolated by decantation and sieving (45–1000 μm size fraction) prior to DNA extraction (Creer et al., 2010; Fonseca et al., 2010, 2014; Bik et al., 2012a,c). This finding is consistent with recent comparisons between different sampling sizes (Brannock and Halanych, 2015). However, in terms of metazoan diversity, our approach of analysing the DNA extracted directly from sediments does not appear to have retrieved significantly different patterns of diversity, as the dominant phyla are similar using both approaches. Brannock and Halanych (2015) recommend the use of elutriated samples (with meiofauna extracted from the sediments) to increase the amount of metazoan reads recovered. However, such approach requires larger volumes of sediments, which are not always available in deep-sea research. Extracting DNA from raw sediments has the advantage of including more extracellular DNA, but also the risk of including DNA from non-benthic organisms. Another study based on abyssal sedimentary DNA suggested that the DNA of planktonic species might account for more than 30% of all eDNA preserved in seafloor sediments (Pawlowski et al., 2011), although our new results do not reflect these findings. The length of the amplified fragment likely explains the higher proportion of benthic diversity observed here. The DNA fragment sequenced in this study was significantly longer (~450 bp) than the 150-bp-long V9 region used in Pawlowski et al. (2011). Comparison between different genetic markers or data obtained with different primer pairs should be considered with caution (Hadziavdic et al., 2014). For example, different markers will likely have different evolution rates that will additionally vary between taxonomic groups, leading to confusing taxonomic interpretations of the results obtained. However, overall, targeting larger DNA fragments will favor the amplification of DNA from living organisms, or that of recently dead individuals whose genomic content still persists in good condition in the environment. Considering the logistic difficulties to sample in the deep sea, and the additional bias induced during the meiofaunal isolation process (Bik et al., 2012c), sequencing the total sedimentary eDNA represents a good compromise for exploring the biodiversity of small-sized, deep-sea metazoans.
Biogeographic Patterns
Broad spatial distributions are reported among small-sized eukaryotic taxa such as rotaliid foraminifera (Pawlowski et al., 2007; Gooday and Jorissen, 2012), nematodes (Vanreusel et al., 2010; Zeppilli et al., 2011), and harpacticoid copepods (Menzel et al., 2011), as well as certain macrofaunal and megafaunal taxa (Sibuet, 1979; Allen, 2008). However, in some cases, detailed morphological and/or molecular re-examination of putative cosmopolitan species resulted in the recognition of cryptic species having much smaller distribution ranges (Moura et al., 2008; Brandão and Yasuhara, 2013; Krapp-Schickel and De Broyer, 2014; Yasuhara et al., 2014). The lower numbers of cosmopolitan taxa in our study originate either from higher than expected biodiversity or undersampling of the vast ocean-floor environment. Unfortunately, we cannot discriminate between these two hypotheses because the samples on which this study is based were collected opportunistically, with different numbers of samples and different sequencing depths at each location.
Deep-sea habitat heterogeneity at larger spatial scales is poorly understood but is believed to play an important role in the maintenance of benthic biodiversity on the ocean floor (e.g., Levin et al., 2001; Van Gaever et al., 2009; Vanreusel et al., 2010; Durden et al., 2015). Our data suggest a considerable degree of taxonomic differentiation, and hence biogeographic patterning, between the soft-sediment benthic communities that are represented by our eDNA samples (Figures 6, 7). For example, the lower bathyal (1920–2160 m) polychaete data from the Lazarev Sea and Maud Rise (BY9) and those derived from upper bathyal (290–500 m) samples taken on the unusually deep Antarctic shelf (BY9Z) are strikingly different. This is inconsistent with the extended bathymetric ranges often observed among species living around the Antarctic continent (Brandt et al., 2007), but is not surprising given the distinctive nature of benthic communities on the western side of the Antarctic Peninsula (Scotia area; De Broyer and Koubbi, 2014). The composition of soft-sediment communities in the lower and particularly the upper bathyal Andaman Sea provinces will almost certainly be influenced by the oxygen minimum zone in this region (Cedhagen et al., 2013). However, further biogeographic interpretation of our data would be inappropriate given the fact that our samples were obtained opportunistically from scattered locations. More extensive sampling, preferably targeted in relation to environmental gradients (e.g., depth, productivity, bottom-water oxygen levels), will be required in order to assess the full potential of eDNA metabarcoding to explore the heterogeneity of deep-sea metazoan communities and their biogeographic patterns.
Future Challenges of Deep-Sea eDNA Metabarcoding
From a molecular perspective, the main challenge for deep-sea metabarcoding studies is to find optimal molecular markers for metazoan species delimitation. Metazoa comprise highly diversified phyla with different rates of evolution (Johnson et al., 2014) and selecting a region of rRNA genes that would have a similar taxonomic resolution for all species is virtually impossible. For example, based on 18S rDNA data publicly available, different species within the deep-sea mollusc genus Bathymodiolus share between 99.2 and 100% identities, while species of the crustacean genus Paramunida share between only 91.5 and 99.4% identities and different genera within the cnidarian family Parazoanthidae share between 97.8 and 99.7% identities. Consequently both 97 and 99% identity clustering thresholds will merge OTUs representing very different taxonomic ranks depending on the taxa concerned. Even within organisms, a recent study of deep-sea nematodes by Dell'Anno et al. (2015) demonstrates how significant intragenomic polymorphism can impact the interpretation of metabarcoding data. Due to the arbitrary nature of species definitions and evolutionary differences between metazoan taxa, such issue will remain crucial despite efforts made to improve the taxonomic assignments of high-throughput sequencing data (Quince et al., 2011; Morgan et al., 2013).
The widely used COI gene has been proposed as an alternative metabarcoding marker to compensate for the lack of resolution of 18S rDNA at species, genus, or even higher taxonomic ranks in meiobenthos taxa (Tang et al., 2012). However, finding conserved COI priming sites in all metazoans is even more problematic than for 18S rDNA (Deagle et al., 2014). Moreover, the level of codon saturation provided by COI precludes us from identifying OTUs without an accurate and complete reference dataset. A test study conducted in parallel with this research has shown that <10% of the reads obtained for a standard COI fragment could be identified by BLAST (unpublished data). These results support published data on seagrass meadows where 93% of the COI OTUs recovered remained unassigned (Cowart et al., 2015). Therefore, although the high-resolution power of COI for identifying species provides a significant advantage, the substantial inadequacy of available reference sequences is even more acute than for rRNA genes.
From a taxonomic perspective, the main challenge for deep-sea biodiversity research is to expand the reference database. Deep-sea diversity remains largely unknown (Costello et al., 2010; Danovaro et al., 2010) and even when identified using molecular taxonomic approaches, high-level assignment cannot be achieved in many cases. Moreover, a complete and reliable reference database is not only needed for taxonomic assignment but is also essential for post-sequencing processing of the data (Edgar et al., 2011; Quince et al., 2011; Fonseca et al., 2014). As shown in Figure 5, the level of taxonomic identification depends on the group. For example, the copepod clade, several groups of nematodes, and one group of annelids include only a modest proportion of unassigned OTUs. However, other groups are almost entirely composed of unassigned OTUs, suggesting the absence of reference sequences in the database. Overall, the amount and clustering of the unassigned OTUs observed here suggest the existence of largely uncharacterized taxonomic groups and highlights the potential extent of the unknown diversity in the deep sea.
DNA barcoding and morphology-based taxonomy have sometimes been perceived as antagonistic approaches (e.g., Ebach and Holdrege, 2005; Trewick, 2008; Boero, 2010). However, our results clearly emphasize the absolute necessity to increase taxonomic effort, including morphological analyses as proposed originally for DNA barcoding approaches (Hebert et al., 2003), in order to fully exploit the gigantic amounts of DNA data obtained by metabarcoding. On the one hand, morphological examination of the specimens that compose benthic communities is not always possible and even when possible is often extremely time consuming and usually requires the expertise of specialist taxonomists. Such limitations apply especially in the deep sea, where samples are difficult to obtain and often limited in size. On the other hand, as discussed above and in Dell'Anno et al. (2015), interpretation of metabarcoding data is limited by the reference database available. Therefore, rather than being in competition, the two approaches complement each other in providing a concerted framework that can be used to obtain the most accurate estimation of marine biodiversity on our planet for both pure and applied environmental research.
Author Contributions
FS, JP, SC planned the experiments; FS conducted the experiments, JP, SC, HY, SH, PC, TC contributed to the experiments, FS, SC, JP, SH analyzed the data, FS, JP, AG, SC wrote the manuscript; GC, SH, PC critically reviewed the manuscript.
Funding
This study was funded through the European Community FP7 Marie Curie International Incoming Fellowship project MARMEDIV (No 253251) and a Japan Society for Promotion of Science grant in aid for young researcher to FS (no 26870917). Part of this research was funded by the Japanese Cross-ministerial Strategic Innovation Promotion (SIP) Program for Development of New-generation Research Protocol for Submarine Resources and part of the sampling was supported by the Carlsberg foundation to TC (No 2010-01-0376), Swiss National Science Foundation to JP (grant 31003A-140766), and a British Antarctic Survey collaborative gearing scheme to SC (No 57). Mediterranean samples were obtained through funding by the “Deepsets” Responsive Mode Proposal (RMP) of the MarBEF NoE (EU Network of Excellence).
Conflict of Interest Statement
The authors declare that the research was conducted in the absence of any commercial or financial relationships that could be construed as a potential conflict of interest.
Acknowledgments
We thank the crews and participants to the various cruises that allowed us to obtain the deep-sea sediments, especially to Dr. P. Martinez-Arbizu, Dr. A. Brandt, Dr. T. Pérez, Dr. T. Maruyama, and Dr. M. Tsuchiya. Thanks go also to the British Antarctic Survey, Dr. L. Peck and all the staff of the Rothera Antarctic station during the summer 2010–2011 who made the sampling possible, and to Mr. B. Vanhoorne for his precious help with the WoRMS data.
Supplementary Material
The Supplementary Material for this article can be found online at: https://www.frontiersin.org/article/10.3389/fmars.2016.00092
References
Allen, J. A. (2008). Bivalvia of the deep Atlantic. Malacologia 50, 57–173. doi: 10.4002/0076-2997-50.1.57
Appeltans, W., Ahyong, S. T., Anderson, G., Angel, M. V., Artois, T., Bailly, N., et al. (2012). The magnitude of global marine species diversity. Curr. Biol. 22, 2189–2202. doi: 10.1016/j.cub.2012.09.036
Benn, A. R., Weaver, P. P., Billet, D. S., Van Den Hove, S., Murdock, A. P., Doneghan, G. B., et al. (2010). Human activities on the deep seafloor in the North East Atlantic: an assessment of spatial extent. PLoS ONE 5:e12730. doi: 10.1371/journal.pone.0012730
Bik, H. M., Halanych, K. M., Sharma, J., and Thomas, W. K. (2012a). Dramatic shifts in benthic microbial eukaryote communities following the deepwater horizon oil spill. PLoS ONE 7:e38550. doi: 10.1371/journal.pone.0038550
Bik, H. M., Porazinska, D. L., Creer, S., Caporaso, J. G., Knight, R., and Thomas, W. K. (2012b). Sequencing our way towards understanding global eukaryotic biodiversity. Trends Ecol. Evol. 27, 233–243. doi: 10.1016/j.tree.2011.11.010
Bik, H. M., Sung, W., De Ley, P., Baldwin, J. G., Sharma, J., Rocha-Olivares, A., et al. (2012c). Metagenetic community analysis of microbial eukaryotes illuminates biogeographic patterns in deep-sea and shallow water sediments. Mol. Ecol. 21, 1048–1059. doi: 10.1111/j.1365-294X.2011.05297.x
Blaxter, M. L. (2004). The promise of a DNA taxonomy. Philos. Trans. R. Soc. Lond. B Biol. Sci. 359, 669–679. doi: 10.1098/rstb.2003.1447
Blaxter, M. L., De Ley, P., Garey, J. R., Liu, L. X., Scheldeman, P., Vierstraete, A., et al. (1998). A molecular evolutionary framework for the phylum Nematoda. Nature 392, 71–75. doi: 10.1038/32160
Boero, F. (2010). The study of species in the era of biodiversity: a tale of stupidity. Diversity 2, 115–126. doi: 10.3390/d2010115
Bohmann, K., Evans, A., Gilbert, M. T. P., Carvalho, G. R., Creer, S., Knapp, M., et al. (2014). Environmental DNA for wildlife biology and biodiversity monitoring. Trends Ecol. Evol. 29, 358–367. doi: 10.1016/j.tree.2014.04.003
Boschen, R. E., Collins, P. C., Tunnicliffe, V., Carlsson, J., Gardner, J. P., Lowe, J., et al. (2016). A primer for use of genetic tools in selecting and testing the suitability of set-aside sites protected from deep-sea seafloor massive sulfide mining activities. Ocean Coast. Manag. 122, 37–48. doi: 10.1016/j.ocecoaman.2016.01.007
Brandão, S. N., and Yasuhara, M. (2013). Challenging deep-sea cosmopolitanism: taxonomic re-evaluation and biogeography of ‘Cythere dasyderma Brady, 1880′(Ostracoda). J. Micropalaeontol. 32, 109–122. doi: 10.1144/jmpaleo2012-009
Brandt, A., Gooday, A. J., Brandão, S. N., Brix, S., Brökeland, W., Cedhagen, T., et al. (2007). First insights into the biodiversity and biogeography of the Southern Ocean deep sea. Nature 447, 307–311. doi: 10.1038/nature05827
Brannock, P. M., and Halanych, K. M. (2015). Meiofaunal community analysis by high-throughput sequencing: comparison of extraction, quality filtering, and clustering methods. Mar. Genomics 23, 67–75. doi: 10.1016/j.margen.2015.05.007
Caporaso, J. G., Kuczynski, J., Stombaugh, J., Bittinger, K., Bushman, F. D., Costello, E. K., et al. (2010). QIIME allows analysis of high-throughput community sequencing data. Nat. Methods 7, 335–336. doi: 10.1038/nmeth.f.303
Cedhagen, T., Aungtonya, C., Banchongmanee, S., Sinniger, F., and Pawlowski, J. (2013). Gromiids and monothalamous foraminiferans (Rhizaria) from the Andaman Sea, Thailand–taxonomic notes. Phuket Mar. Biol. Cent. Res. Bull. 72, 1–17.
Chariton, A. A., Court, L. N., Hartley, D. M., Colloff, M. J., and Hardy, C. M. (2010). Ecological assessment of estuarine sediments by pyrosequencing eukaryotic ribosomal DNA. Front. Ecol. Environ. 8, 233–238. doi: 10.1890/090115
Chariton, A. A., Ho, K. T., Proestou, D., Bik, H., Simpson, S. L., Portis, L. M., et al. (2014). A molecular-based approach for examining responses of eukaryotes in microcosms to contaminant-spiked estuarine sediments. Environ. Toxicol. Chem. 33, 359–369. doi: 10.1002/etc.2450
Clark, M. R. (2009). Deep-sea seamount fisheries: a review of global status and future prospects. Lat. Am. J. Aquat. Res. 37, 501–512. doi: 10.3856/vol37-issue3-fulltext-17
Corinaldesi, C., Barucca, M., Luna, G. M., and Dell'Anno, A. (2011). Preservation, origin and genetic imprint of extracellular DNA in permanently anoxic deep-sea sediments. Mol. Ecol. 20, 642–654. doi: 10.1111/j.1365-294X.2010.04958.x
Costello, M. J., Coll, M., Danovaro, R., Halpin, P., Ojaveer, H., and Miloslavich, P. (2010). A census of marine biodiversity knowledge, resources, and future challenges. PLoS ONE 5:e12110. doi: 10.1371/journal.pone.0012110
Costello, M. J., May, R. M., and Stork, N. E. (2013). Can we name Earth's species before they go extinct? Science 339, 413–416. doi: 10.1126/science.1237254
Cowart, D. A., Pinheiro, M., Mouchel, O., Maguer, M., Grall, J., Miné, J., et al. (2015). Metabarcoding is powerful yet still blind: a comparative analysis of morphological and molecular surveys of seagrass communities. PLoS ONE 10:e0117562. doi: 10.1371/journal.pone.0117562
Creer, S., Fonseca, V. G., Porazinska, D. L., Giblin-Davis, R. M., Sung, W., Power, D. M., et al. (2010). Ultrasequencing of the meiofaunal biosphere: practice, pitfalls and promises. Mol. Ecol. 19, 4–20. doi: 10.1111/j.1365-294X.2009.04473.x
Czernik, M., Taberlet, P., Swislocka, M., Czajkowska, M., Duda, N., and Ratkiewicz, M. (2013). Fast and efficient DNA-based method for winter diet analysis from stools of three cervids: moose, red deer, and roe deer. Acta Theriol. 58, 379–386. doi: 10.1007/s13364-013-0146-9
Danovaro, R., Company, J. B., Corinaldesi, C., D'Onghia, G., Galil, B., Gambi, C., et al. (2010). Deep-sea biodiversity in the Mediterranean Sea: the known, the unknown, and the unknowable. PLoS ONE 5:e11832. doi: 10.1371/journal.pone.0011832
De Broyer, C., and Koubbi, P. (2014). “The biogeography of the Southern Ocean,” in Biogeographic Atlas of the Southern Ocean, eds C. De Broyer, P. Koubbi, H. J. Griffiths, B. Raymond, C. D'Udekem D'Acoz, A. P. Van De Putte, B. Danis, B. David, S. Grant, J. Gutt, C. Held, G. Hosie, F. Huettmann, A. Post, and Y. Ropert-Coudert (Cambridge, UK: Scientific Committee on Antarctic Research), 2–9.
Deagle, B. E., Jarman, S. N., Coissac, E., Pompanon, F., and Taberlet, P. (2014). DNA metabarcoding and the cytochrome c oxidase subunit I marker: not a perfect match. Biol. Lett. 10:20140562. doi: 10.1098/rsbl.2014.0562
Dell'Anno, A., Carugati, L., Corinaldesi, C., Riccioni, G., and Danovaro, R. (2015). Unveiling the biodiversity of deep-sea nematodes through metabarcoding: are we ready to bypass the classical taxonomy? PLoS ONE 10:e0144928. doi: 10.1371/journal.pone.0144928
Durden, J. M., Bett, B. J., Jones, D. O., Huvenne, V. A., and Ruhl, H. A. (2015). Abyssal hills–hidden source of increased habitat heterogeneity, benthic megafaunal biomass and diversity in the deep sea. Prog. Oceanogr. 137, 209–218. doi: 10.1016/j.pocean.2015.06.006
Ebach, M. C., and Holdrege, C. (2005). DNA barcoding is no substitute for taxonomy. Nature 434, 697–697. doi: 10.1038/434697b
Edgar, R. C., Haas, B. J., Clemente, J. C., Quince, C., and Knight, R. (2011). UCHIME improves sensitivity and speed of chimera detection. Bioinformatics 27, 2194–2200. doi: 10.1093/bioinformatics/btr381
Fisher, C. R., Hsing, P.-Y., Kaiser, C. L., Yoerger, D. R., Roberts, H. H., Shedd, W. W., et al. (2014). Footprint of Deepwater Horizon blowout impact to deep-water coral communities. Proc. Natl. Acad. Sci. U.S.A. 111, 11744–11749. doi: 10.1073/pnas.1403492111
Fonseca, V. G., Carvalho, G. R., Nichols, B., Quince, C., Johnson, H. F., Neill, S. P., et al. (2014). Metagenetic analysis of patterns of distribution and diversity of marine meiobenthic eukaryotes. Global Ecol. Biogeogr. 23, 1293–1302. doi: 10.1111/geb.12223
Fonseca, V. G., Carvalho, G. R., Sung, W., Johnson, H. F., Power, D. M., Neill, S. P., et al. (2010). Second-generation environmental sequencing unmasks marine metazoan biodiversity. Nat. Commun. 1:98. doi: 10.1038/ncomms1095
Fonseca, V. G., Nichols, B., Lallias, D., Quince, C., Carvalho, G. R., Power, D. M., et al. (2012). Sample richness and genetic diversity as drivers of chimera formation in nSSU metagenetic analyses. Nucleic Acids Res. 40:e66. doi: 10.1093/nar/gks002
George, K. H., Veit-Köhler, G., Arbizu, P. M., Seifried, S., Rose, A., Willen, E., et al. (2014). Community structure and species diversity of Harpacticoida (Crustacea: Copepoda) at two sites in the deep sea of the Angola Basin (Southeast Atlantic). Org. Divers. Evol. 14, 57–73. doi: 10.1007/s13127-013-0154-2
Giere, O. (2008). Meiobenthology: The Microscopic Motile Fauna of Aquatic Sediments. Heidelberg: Springer Science & Business Media.
Glover, A. G., and Smith, C. R. (2003). The deep-sea floor ecosystem: current status and prospects of anthropogenic change by the year 2025. Environ. Conserv. 30, 219–241. doi: 10.1017/S0376892903000225
Gooday, A. J., and Jorissen, F. J. (2012). Benthic foraminiferal biogeography: controls on global distribution patterns in deep-water settings. Ann. Rev. Mar. Sci. 4, 237–262. doi: 10.1146/annurev-marine-120709-142737
Grassle, J. F., and Maciolek, N. J. (1992). Deep-sea species richness: regional and local diversity estimates from quantitative bottom samples. Am. Nat. 139, 313–341. doi: 10.1086/285329
Guardiola, M., Uriz, M. J., Taberlet, P., Coissac, E., Wangensteen, O. S., and Turon, X. (2015). Deep-sea, deep-sequencing: metabarcoding extracellular DNA from sediments of marine canyons. PLoS ONE 10:e0139633. doi: 10.1371/journal.pone.0139633
Hadziavdic, K., Lekang, K., Lanzen, A., Jonassen, I., Thompson, E. M., and Troedsson, C. (2014). Characterization of the 18S rRNA gene for designing universal eukaryote specific primers. PLoS ONE 9:e87624. doi: 10.1371/journal.pone.0087624
Hebert, P. D., Cywinska, A., and Ball, S. L. (2003). Biological identifications through DNA barcodes. Proc. R. Soc. Lond. B Biol. Sci. 270, 313–321. doi: 10.1098/rspb.2002.2218
Herman, P. M., and Heip, C. (1988). On the use of meiofauna in ecological monitoring: who needs taxonomy? Mar. Pollut. Bull. 19, 665–668. doi: 10.1016/0025-326X(88)90386-4
Hessler, R. R., and Sanders, H. L. (1967). Faunal diversity in the deep-sea. Deep Sea Res.Oceanogr. Abstr. 14, 65–70, IN25–IN28, 71–78. doi: 10.1016/0011-7471(67)90029-0
Hirai, J., Kuriyama, M., Ichikawa, T., Hidaka, K., and Tsuda, A. (2015). A metagenetic approach for revealing community structure of marine planktonic copepods. Mol. Ecol. Resour. 15, 68–80. doi: 10.1111/1755-0998.12294
Hooper, D. U., Adair, E. C., Cardinale, B. J., Byrnes, J. E., Hungate, B. A., Matulich, K. L., et al. (2012). A global synthesis reveals biodiversity loss as a major driver of ecosystem change. Nature 486, 105–108. doi: 10.1038/nature11118
Johnson, K. P., Allen, J. M., Olds, B. P., Mugisha, L., Reed, D. L., Paige, K. N., et al. (2014). Rates of genomic divergence in humans, chimpanzees and their lice. Proc. R. Soc. Lond. B Biol. Sci. 281:20132174. doi: 10.1098/rspb.2013.2174
Jones, D. O., Yool, A., Wei, C. L., Henson, S. A., Ruhl, H. A., Watson, R. A., et al. (2014). Global reductions in seafloor biomass in response to climate change. Glob. Chang. Biol. 20, 1861–1872. doi: 10.1111/gcb.12480
Koslow, J. A., Boehlert, G., Gordon, J., Haedrich, R., Lorance, P., and Parin, N. (2000). Continental slope and deep-sea fisheries: implications for a fragile ecosystem. ICES J. Mar. Sci. 57, 548–557. doi: 10.1006/jmsc.2000.0722
Krapp-Schickel, T., and De Broyer, C. (2014). Revision of Leucothoe (Amphipoda, Crustacea) from the Southern Ocean: a cosmopolitanism concept is vanishing. Eur. J. Taxon. 80, 1–55. doi: 10.5852/ejt.2014.80
Lallias, D., Hiddink, J. G., Fonseca, V. G., Gaspar, J. M., Sung, W., Neill, S. P., et al. (2014). Environmental metabarcoding reveals heterogeneous drivers of microbial eukaryote diversity in contrasting estuarine ecosystems. ISME J. 9, 1208–1221. doi: 10.1038/ismej.2014.213
Lecroq, B., Lejzerowicz, F., Bachar, D., Christen, R., Esling, P., Baerlocher, L., et al. (2011). Ultra-deep sequencing of foraminiferal microbarcodes unveils hidden richness of early monothalamous lineages in deep-sea sediments. Proc. Natl. Acad. Sci. U.S.A. 108, 13177–13182. doi: 10.1073/pnas.1018426108
Lejzerowicz, F., Esling, P., Majewski, W., Szczucinski, W., Decelle, J., Obadia, C., et al. (2013). Ancient DNA complements microfossil record in deep-sea subsurface sediments. Biol. Lett. 9:20130283. doi: 10.1098/rsbl.2013.0283
Lejzerowicz, F., Esling, P., Pillet, L., Wilding, T. A., Black, K. D., and Pawlowski, J. (2015). High-throughput sequencing and morphology perform equally well for benthic monitoring of marine ecosystems. Sci. Rep. 5:13932. doi: 10.1038/srep13932
Levin, L. A., Etter, R. J., Rex, M. A., Gooday, A. J., Smith, C. R., Pineda, J., et al. (2001). Environmental influences on regional deep-sea species diversity. Annu. Rev. Ecol. Syst. 32, 51–93. doi: 10.1146/annurev.ecolsys.32.081501.114002
Lozupone, C., and Knight, R. (2005). UniFrac: a new phylogenetic method for comparing microbial communities. Appl. Environ. Microbiol. 71, 8228–8235. doi: 10.1128/AEM.71.12.8228-8235.2005
Markmann, M., and Tautz, D. (2005). Reverse taxonomy: an approach towards determining the diversity of meiobenthic organisms based on ribosomal RNA signature sequences. Philos. Trans. R. Soc. B Biol. Sci. 360, 1917–1924. doi: 10.1098/rstb.2005.1723
McClain, C. R., and Hardy, S. M. (2010). The dynamics of biogeographic ranges in the deep sea. Proc. R. Soc. B Biol. Sci. 277, 3533–3546. doi: 10.1098/rspb.2010.1057
Menzel, L., George, K. H., and Arbizu, P. M. (2011). Submarine ridges do not prevent large-scale dispersal of abyssal fauna: a case study of Mesocletodes (Crustacea, Copepoda, Harpacticoida). Deep Sea Res. I Oceanogr. Res. Pap. 58, 839–864. doi: 10.1016/j.dsr.2011.05.008
Miljutin, D. M., Gad, G., Miljutina, M. M., Mokievsky, V. O., Fonseca-Genevois, V., and Esteves, A. M. (2010). The state of knowledge on deep-sea nematode taxonomy: how many valid species are known down there? Mar. Biodivers. 40, 143–159. doi: 10.1007/s12526-010-0041-4
Miyake, H., Shibata, H., and Furushima, Y. (2011). “Deep-sea litter study using deep-sea observation tools,” in Interdisciplinary Studies on Environmental Chemistry-Marine Environmental Modeling and Analysis, eds K. Omori, X. Guo, N. Yoshie, N. Fujii, I. C. Handoh, A. Isobe, and S. Tanabe (Tokyo: Terrapub), 261–269.
Mora, C., Wei, C.-L., Rollo, A., Amaro, T., Baco, A. R., Billett, D., et al. (2013). Biotic and human vulnerability to projected changes in ocean biogeochemistry over the 21st century. PLoS Biol. 11:e1001682. doi: 10.1371/journal.pbio.1001682
Morgan, M. J., Chariton, A. A., Hartley, D. M., Court, L. N., and Hardy, C. M. (2013). Improved inference of taxonomic richness from environmental DNA. PLoS ONE 8:e71974. doi: 10.1371/journal.pone.0071974
Moura, C. J., Harris, D. J., Cunha, M. R., and Rogers, A. D. (2008). DNA barcoding reveals cryptic diversity in marine hydroids (Cnidaria, Hydrozoa) from coastal and deep-sea environments. Zool. Scr. 37, 93–108. doi: 10.1111/j.1463-6409.2007.00312.x
Pawlowski, J., Christen, R., Lecroq, B., Bachar, D., Shahbazkia, H. R., Amaral-Zettler, L., et al. (2011). Eukaryotic richness in the abyss: insights from pyrotag sequencing. PLoS ONE 6:e18169. doi: 10.1371/journal.pone.0018169
Pawlowski, J., Esling, P., Lejzerowicz, F., Cedhagen, T., and Wilding, T. A. (2014). Environmental monitoring through protist next-generation sequencing metabarcoding: assessing the impact of fish farming on benthic foraminifera communities. Mol. Ecol. Resour. 14, 1129–1140. doi: 10.1111/1755-0998.12261
Pawlowski, J., Fahrni, J., Lecroq, B., Longet, D., Cornelius, N., Excoffier, L., et al. (2007). Bipolar gene flow in deep-sea benthic foraminifera. Mol. Ecol. 16, 4089–4096. doi: 10.1111/j.1365-294X.2007.03465.x
Pochon, X., Wood, S. A., Keeley, N. B., Lejzerowicz, F., Esling, P., Drew, J., et al. (2015). Accurate assessment of the impact of salmon farming on benthic sediment enrichment using foraminiferal metabarcoding. Mar. Pollut. Bull. 100, 370–382. doi: 10.1016/j.marpolbul.2015.08.022
Poore, G. C. B., and Wilson, G. D. F. (1993). Marine species richness. Nature 361, 597–598. doi: 10.1038/361597a0
Quince, C., Lanzen, A., Davenport, R. J., and Turnbaugh, P. J. (2011). Removing noise from pyrosequenced amplicons. BMC Bioinform. 12:38. doi: 10.1186/1471-2105-12-38
Ramirez-Llodra, E., De Mol, B., Company, J. B., Coll, M., and Sardà, F. (2013). Effects of natural and anthropogenic processes in the distribution of marine litter in the deep Mediterranean Sea. Prog. Oceanogr. 118, 273–287. doi: 10.1016/j.pocean.2013.07.027
Ramirez-Llodra, E., Tyler, P. A., Baker, M. C., Bergstad, O. A., Clark, M. R., Escobar, E., et al. (2011). Man and the last great wilderness: human impact on the deep sea. PLoS ONE 6:e22588. doi: 10.1371/journal.pone.0022588
Rex, M. A., and Etter, R. J. (2010). Deep-Sea Biodiversity: Pattern and Scale. Harvard: Harvard University Press.
Rex, M. A., Etter, R. J., Morris, J. S., Crouse, J., McClain, C. R., Johnson, N. A., et al. (2006). Global bathymetric patterns of standing stock and body size in the deep-sea benthos. Mar. Ecol. Prog. Ser. 317, 1–8. doi: 10.3354/meps317001
Roberts, C. M. (2002). Deep impact: the rising toll of fishing in the deep sea. Trends Ecol. Evol. 17, 242–245. doi: 10.1016/S0169-5347(02)02492-8
Sanders, H. L., and Hessler, R. R. (1969). Ecology of the deep-sea benthos. Science 163, 1419–1424. doi: 10.1126/science.163.3874.1419
Schlacher, T. A., Baco, A. R., Rowden, A. A., O'Hara, T. D., Clark, M. R., Kelley, C., et al. (2014). Seamount benthos in a cobalt-rich crust region of the central Pacific: conservation challenges for future seabed mining. Divers. Distrib. 20, 491–502. doi: 10.1111/ddi.12142
Shannon, P., Markiel, A., Ozier, O., Baliga, N. S., Wang, J. T., Ramage, D., et al. (2003). Cytoscape: a software environment for integrated models of biomolecular interaction networks. Genome Res. 13, 2498–2504. doi: 10.1101/gr.1239303
Sibuet, M. (1979). Distribution and diversity of asteroids in Atlantic abyssal basins. Sarsia 64, 85–91. doi: 10.1080/00364827.1979.10411367
Snelgrove, P. V. R., and Smith, C. R. (2002). “A riot of species in an environmental calm: the paradox of the species-rich deep-sea floor,” in Oceanography and Marine Biology, An Annual Review, eds. R. Gibson, M. Barnes, and R. Atkinson (London: Taylor & Francis), 311–342.
Stephenson, S., Chariton, A. A., Holley, M. P., O'sullivan, M., Gillings, M. R., and Hose, G. C. (2013). Changes in prokaryote and eukaryote assemblages along a gradient of hydrocarbon contamination in groundwater. Geomicrobiol. J. 30, 623–634. doi: 10.1080/01490451.2012.746408
Stock, A., Edgcomb, V., Orsi, W., Filker, S., Breiner, H.-W., Yakimov, M. M., et al. (2013). Evidence for isolated evolution of deep-sea ciliate communities through geological separation and environmental selection. BMC Microbiol. 13:150. doi: 10.1186/1471-2180-13-150
Taberlet, P., Coissac, E., Hajibabaei, M., and Rieseberg, L. H. (2012a). Environmental DNA. Mol. Ecol. 21, 1789–1793. doi: 10.1111/J.1365-294x.2012.05542.x
Taberlet, P., Coissac, E., Pompanon, F., Brochmann, C., and Willerslev, E. (2012b). Towards next-generation biodiversity assessment using DNA metabarcoding. Mol. Ecol. 21, 2045–2050. doi: 10.1111/j.1365-294X.2012.05470.x
Tang, C. Q., Leasi, F., Obertegger, U., Kieneke, A., Barraclough, T. G., and Fontaneto, D. (2012). The widely used small subunit 18S rDNA molecule greatly underestimates true diversity in biodiversity surveys of the meiofauna. Proc. Natl. Acad. Sci. U.S.A. 109, 16208–16212. doi: 10.1073/pnas.1209160109
Thiel, H. (1975). The size structure of the deep-sea benthos. Int. Rev. Gesamten Hydrobiol. 60, 575–606.
Thiel, H. (1983). “Meiobenthos and nanobenthos of the deep sea,” in The Sea, ed G. T. Rowe (New York, NY: Wiley Interscience), 167–230.
Thiel, H. (2003). “Anthropogenic impacts on the deep sea,” in Ecosystems of the World, ed. P.A. Tyler (Amsterdam: Elsevier), 427–472.
Trewick, S. A. (2008). DNA Barcoding is not enough: mismatch of taxonomy and genealogy in New Zealand grasshoppers (Orthoptera: Acrididae). Cladistics 24, 240–254. doi: 10.1111/j.1096-0031.2007.00174.x
Van Dover, C. L. (2014). Impacts of anthropogenic disturbances at deep-sea hydrothermal vent ecosystems: a review. Mar. Environ. Res. 102, 59–72. doi: 10.1016/j.marenvres.2014.03.008
Van Gaever, S., Galéron, J., Sibuet, M., and Vanreusel, A. (2009). Deep-sea habitat heterogeneity influence on meiofaunal communities in the Gulf of Guinea. Deep Sea Res. II Top. Stud. Oceanogr. 56, 2259–2269. doi: 10.1016/j.dsr2.2009.04.008
Vanreusel, A., Fonseca, G., Danovaro, R., Da Silva, M. C., Esteves, A. M., Ferrero, T., et al. (2010). The contribution of deep-sea macrohabitat heterogeneity to global nematode diversity. Mar. Ecol. 31, 6–20. doi: 10.1111/j.1439-0485.2009.00352.x
Watling, L., Guinotte, J., Clark, M. R., and Smith, C. R. (2013). A proposed biogeography of the deep ocean floor. Prog. Oceanogr. 111, 91–112. doi: 10.1016/j.pocean.2012.11.003
Watters, D. L., Yoklavich, M. M., Love, M. S., and Schroeder, D. M. (2010). Assessing marine debris in deep seafloor habitats off California. Mar. Pollut. Bull. 60, 131–138. doi: 10.1016/j.marpolbul.2009.08.019
Wedding, L. M., Friedlander, A. M., Kittinger, J. N., Watling, L., Gaines, S. D., Bennett, M., et al. (2013). From principles to practice: a spatial approach to systematic conservation planning in the deep sea. Proc. R. Soc. Lond. B Biol. Sci. 280, 20131684. doi: 10.1098/rspb.2013.1684
Willerslev, E., Davison, J., Moora, M., Zobel, M., Coissac, E., Edwards, M. E., et al. (2014). Fifty thousand years of Arctic vegetation and megafaunal diet. Nature 506, 47. doi: 10.1038/nature12921
Worm, B., Barbier, E. B., Beaumont, N., Duffy, J. E., Folke, C., Halpern, B. S., et al. (2006). Impacts of biodiversity loss on ocean ecosystem services. Science 314, 787–790. doi: 10.1126/science.1132294
WoRMS Editorial Board (2014). World Register of Marine Species. Available online at: http://www.marinespecies.org at VLIZ (Accessed October 17, 2014).
Yasuhara, M., Stepanova, A., Okahashi, H., Cronin, T. M., and Brouwers, E. M. (2014). Taxonomic revision of deep-sea Ostracoda from the Arctic Ocean. Micropaleontology 60, 399–444.
Keywords: environmental DNA, biodiversity, metabarcoding, meiobenthos, 18S rDNA
Citation: Sinniger F, Pawlowski J, Harii S, Gooday AJ, Yamamoto H, Chevaldonné P, Cedhagen T, Carvalho G and Creer S (2016) Worldwide Analysis of Sedimentary DNA Reveals Major Gaps in Taxonomic Knowledge of Deep-Sea Benthos. Front. Mar. Sci. 3:92. doi: 10.3389/fmars.2016.00092
Received: 26 March 2016; Accepted: 27 May 2016;
Published: 14 June 2016.
Edited by:
Anthony Grehan, National University of Ireland - Galway, IrelandReviewed by:
Paul Snelgrove, Memorial University of Newfoundland, CanadaDaniela Zeppilli, Institut Français de Recherche pour l'Exploitation de la MER, France
Copyright © 2016 Sinniger, Pawlowski, Harii, Gooday, Yamamoto, Chevaldonné, Cedhagen, Carvalho and Creer. This is an open-access article distributed under the terms of the Creative Commons Attribution License (CC BY). The use, distribution or reproduction in other forums is permitted, provided the original author(s) or licensor are credited and that the original publication in this journal is cited, in accordance with accepted academic practice. No use, distribution or reproduction is permitted which does not comply with these terms.
*Correspondence: Frédéric Sinniger, fredsinniger@hotmail.com