A Framework for Incorporating Species, Fleet, Habitat, and Climate Interactions into Fishery Management
 Sarah K. Gaichas1*
  Richard J. Seagraves2
  Jessica M. Coakley2
  Geret S. DePiper1
  Vincent G. Guida3
  Jonathan A. Hare4 Paul J. Rago1
  Michael J. Wilberg5
- 1Woods Hole Lab, NOAA Northeast Fisheries Science Center, Woods Hole, MA, USA
- 2Mid-Atlantic Fishery Management Council, Dover, DE, USA
- 3Sandy Hook Lab, NOAA Northeast Fisheries Science Center, Highlands, NJ, USA
- 4Narragansett Lab, NOAA Northeast Fisheries Science Center, Narragansett, RI, USA
- 5Chesapeake Biological Laboratory, University of Maryland Center for Environmental Science, Solomons, MD, USA
Marine ecosystems are characterized by many complex interactions. Fisheries managers face the challenge of maintaining or restoring sustainability for individual living resources which are affected by both ecological and economic interactions with other species, through processes like predation and fishing fleet interactions. These species interactions are further complicated by interactions with habitats that are changing due to both human activities and climate change. Often, fishery management systems designed to promote sustainability of individual resources have few tools or processes that also address interactions between species, fleets, habitat, and climate. Here, we review existing and potential fishery assessment and management information and tools, and we develop a potential framework for addressing interactions in management at the request of the U.S. Mid-Atlantic Fishery Management Council. The structured framework can be used to first prioritize interactions, second specify key questions regarding high priority interactions, and third tailor appropriate analyses to address them. The primary tools for the initial steps in the framework are risk assessment and Management Strategy Evaluation (MSE). Finally, implemented management would be evaluated to ensure that objectives are being met, or to adjust measures as conditions change. In the final section, we outline an example to illustrate how a structured decision making process within the framework could work.
Introduction
The Mid-Atlantic Fishery Management Council (Council) manages fishery resources in the US Exclusive Economic Zone (EEZ; out to 200 nmi from shore) from North Carolina to New York (Figure 1). The Council recently articulated objectives for the living marine resources under its management authority in its Strategic Plan (http://www.mafmc.org/strategic-plan/). Foremost among these objectives is the need to advance ecosystem approaches to fisheries management in the Mid-Atlantic. This will be accomplished by moving beyond single species assessment and management to the development and implementation of assessments and management frameworks that incorporate, (1) environmental drivers, (2) habitat and climate change, (3) species interactions, and (4) fleet interactions, into fisheries management.
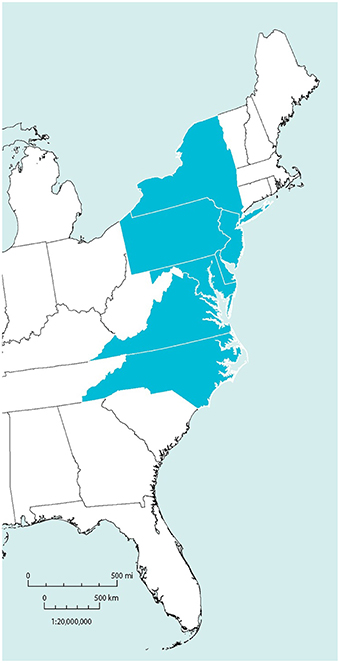
Figure 1. Mid-Atlantic Fishery Management Council management jurisdiction (source: http://www.mafmc.org/about/).
In June 2015, the Council convened a workshop with scientists and managers to discuss potential strategies to more fully consider species interactions and climate drivers in the stock assessment and management process (including determination of catch limits), and to build capacity within the region to conduct comprehensive management strategy evaluations (MSEs) as part of the Mid-Atlantic Council's Ecosystem Approach to Fisheries Management (EAFM). The workshop reviewed existing single species approaches as well as information and analytical tools available to address key interactions between species and their environment, between species within the food web, and between the ecosystem and fisheries, and between fleets due to technical or management issues. The workshop and this resulting paper explore alternative pathways to incorporating ecosystem interactions into the Council's fishery management policies and programs as part of the development of its EAFM Policy.
Here, we review existing data and tools which have not previously been considered together for integrated analysis within the Council process, then outline a potential framework and process for addressing ecosystem interactions. We then provide a brief example of how the Council might proceed through the process: prioritizing based on risk, evaluating which interactions need to be addressed, and designing targeted analyses to evaluate management strategies that achieve Council objectives. Key concepts and questions are defined in Box 1. In the Section Information and Tools Available to Address Interactions in Fishery Management, we explain the importance of addressing species, climate, habitat, and fleet interactions, and review information and analytical tools currently available to address these interactions for fishery managers in the Mid-Atlantic region. We then describe comprehensive tools that may help the Council address multiple interaction types simultaneously. In the Section A Potential Framework for Addressing Interactions, we propose a potential framework for the Council to address these interactions in management, which would be tailored to specific questions to ensure the best management outcomes for the Council. In the Section How might the Framework be used? An Example, we outline an example that the Council could address to illustrate how a structured decision making process within the framework could work. We conclude with a “checklist” of practical considerations for addressing habitat, climate, species, and fleet interactions to further define the framework.
Box 1. Key Concepts to Consider.
Key Concepts
Definitions:
Predator-prey interactions: Predator: an animal that eats other animals. Prey: an animal that is eaten by other animals. Fishery managers are interested because managed fish eat each other at various life stages, and managed fish are eaten by protected species. Predator prey interactions are quantified with food habits or other diet data.
Competition: “Interaction between organisms, populations, or species, in which birth, growth and death depend on gaining a share of a limited environmental resource.” Competition can be for food, space, or mates. Competition is difficult to quantify in the marine environment with current information and understanding.
Mutualism, symbiosis: Species interactions with mutually beneficial outcomes. Mutualism is difficult to quantify in the marine environment with current data.
Multifleet interactions: Vessels may participate in multiple target fisheries, and catch fish in different fishery management plans (FMPs). Commercial and recreational fleets target overlapping species. Fleets have varying footprints, gear configurations, catch compositions, and abilities to adapt to change. Quantified with landings, catch, observer, permit, and other data.
Key questions:
Can our current management system adequately address these interactions?
• Can ecological and fleet relationships be addressed across FMPs?
• How do we address species and fleet interaction across multiple jurisdictions?
• Can we link ecological and fishery interactions with existing data?
• How will environmental changes alter interactions between habitats, species ranges, economic markets, and community conditions and the needs of the management system?
What tools can help managers look at the big picture?
• Model suites including single stock, multispecies, multifleet, and full ecosystem levels to address different questions
• Conceptual models linking key components, interactions, management objectives to see issues in the larger context
• Risk assessment methods for prioritizing issues to address
• MSEs addressing specific questions
• Tracking indicator and proxies of the parameters and processes of interest
• Understand past and present regulations from a species, FMP, and ecosystem perspective
Information and Tools Available to Address Interactions in Fishery Management
The Mid-Atlantic region has considerable available resources for addressing interactions, both in terms of available data and in terms of analytical tools. There is a wealth of environmental, ecological, and social and economic data that could potentially be integrated into analyses to support management decisions. An overview of available information (but not an exhaustive list) is synthesized in the Northeast Fisheries Science Center (NEFSC) Ecosystem Status Report (ESR; available at http://www.nefsc.noaa.gov/ecosys/ecosystem-status-report/sitemap.html). Despite this wealth of data, information to address particular interactions may be sparse, such that information needs should be evaluated for each management issue, and uncertainties arising from missing information should be considered, as is current practice.
A spectrum of assessment and modeling methods are available to assist the Council with incorporating species, fleet, and climate interactions into management. Models range from conceptual to statistical and mechanistic mathematical models, from single species population dynamics to integrated ecosystem assessment, and from tactical to strategic. Ultimately, the Council will need to prioritize which interactions to deal with first, and risk assessment methods can contribute to this decision process. Similarly, the Council will need to evaluate management strategies to determine how they perform in achieving Council objectives, as well as evaluate tradeoffs between those objectives, which may be inevitable when considering a range of interactions and possible outcomes. A combination of these tools designed to address particular interactions can be developed for each management issue as with data above, as is also current practice.
Interactions in Single Species Stock Assessments
The Council currently relies on single species stock assessments and analyses to manage fisheries (as is typical for most fisheries management organizations worldwide). The questions the Council considers on a regular basis include “is this individual stock overfished, or subject to overfishing?” Much of the data collection and analysis in the region is designed for and incorporated within these single species assessments, which estimate fishing mortality and stock size to determine whether both are sustainable. However, most assessments do not directly address climate, habitat, or species interactions, and they address fleet interactions only to the extent that multiple fleets catch the assessed species.
In some ways, environmental, species, and fleet interactions can be accounted for in current stock assessments, depending on data inputs and model configuration. For example, single species stock assessments that use changing weight-at-age data over time as input are incorporating the effects of a changing environment and ecology on fish growth, although the sources of this variation cannot be identified. Further, some assessments incorporate changes in natural mortality (M) over time which can represent changing species interactions (most often, predation), but could also represent habitat or other environmentally mediated changes. Some effects of technical interactions between fisheries are included for individual species using a standardized bycatch reporting methodology to ensure that mortality from both directed fisheries and incidental catch are accounted for in assessments.
Successful fishery management can actually make the effects of interactions more important. As fishing mortality declines, natural mortality becomes a more important fraction of total mortality and therefore more influential on population dynamics. Reductions in fishing mortality also tend to increase lifespan and reveal traits obscured by high exploitation. To understand dynamics for rebuilding depleted stocks requires multiple disciplines, including population biology and ecology as well as bioeconomics, ecological and environmental change. Forecasting these changes can be challenging, but some key research at the interface of these disciplines can help.
Determination of absolute abundance for each species is the greatest challenge for single species, multispecies, and ecosystem modeling. To address this challenge, managers and scientists should foster an environment where there is increased interaction between gear technologists and assessment scientists (see e.g., Somerton et al., 1999 and Box 2). Within a single species model, the ability to estimate changes in natural mortality (M) is dependent on ability to fix the quantity scaling the fishery independent index of population size to absolute population size (Q or survey catchability). Considerable improvement in estimation of fishing mortality (F) and other management reference points requires determination of scale, whether the model is of a single population, of multiple interacting populations, or of the full food web, as described below.
Box 2. Practical Approaches for Improving Abundance Estimates.
The Northeast Trawl Advisory Panel (NTAP) was recently established to bring commercial fishing, fisheries science, and fishery management professionals together to identify concerns about regional research survey performance and data, to identify methods to address or mitigate these concerns, and to promote mutual understanding and acceptance of the results of this work among their peers and in the broader community. The NTAP is a joint advisory panel of the Mid-Atlantic and New England Fishery Management Councils. It is composed of Council members, fishing industry, academic, and government and non-government fisheries experts who will provide advice and direction on the conduct of trawl research. In addition, the Council has recently revised its research funding initiative (formerly the Research Set Aside Program) under the MAMFC Collaborative Research Program. The new Collaborative Research Program, in combination with advice and recommendations from the NTAP, offers an excellent venue to develop and conduct cooperative research with industry to address the critical issue of Northeast Fisheries Science Center survey catchability and to improve our understanding of the relationship between fishery independent indices of the abundance from the survey and true abundance in the ocean.
Trophic and Multispecies Interactions
In addition to the single species data and stock assessments currently used to provide management advice, information on predator-prey interactions can be derived from the extensive food habits databases maintained at NEFSC and the Virginia Institute of Marine Science (VIMS). Food web models implemented in Ecopath (Polovina, 1984; Christensen and Walters, 2004) using this data have been completed for 4 regions of the Northeast US shelf, including the Mid-Atlantic, Southern New England, Georges bank, and Gulf of Maine (Link et al., 2008, 2009). Updated food web models with more detail for individual species in each region and multi-fleet fisheries are currently under construction. Food web models are useful for estimating the relative proportion of fishing and predation mortality to evaluate whether assessments should consider including variable predation mortality. Food web models also quantify major prey for key species and can be used to evaluate whether assessments should consider including food-limited growth when prey fluctuate. Full ecosystem models can also be useful in addressing species interactions (as well as climate, habitat, and fleet interactions; see below). A spatially explicit bio-geochemical end-to-end ecosystem model, Atlantis (Fulton et al., 2011), has been developed for the full Northeast US shelf (Link et al., 2010), and compared with recent data on multispecies and ecosystem trends (Olsen et al., 2016).
Models intermediate in scale between single stock and full ecosystem may be most promising in terms of providing tactical advice that incorporates species and fleet interactions as well as some environmental factors (Plagányi et al., 2014; Collie et al., 2016). Work is in progress by many research groups testing the capabilities of multispecies assessment models (e.g., Curti et al., 2013; Van Kirk et al., 2015). A prototype multispecies assessment project has been initiated for Georges Bank just north of the Mid-Atlantic region, which incorporates multispecies production models, multispecies delay difference models, and empirical non-linear time series forecast models as assessment models within a multi-model inference framework. The multispecies assessment models were fit to simulated data, and assessment model estimates of biomass and catch trends were compared with “true” operating model values for each time series. This process both improves the multispecies models and informs managers of their strengths and weaknesses. Based on this work, multispecies models can be designed and evaluated for Mid-Atlantic stocks.
Climate and Habitat Interactions
Climate and habitat interactions are critical drivers of fish populations, but have been difficult to integrate directly into fishery management decisions to date. Climate is changing rapidly in the Northeast US, with ocean temperatures increasing in the region more quickly than much of the rest of the world (Hobday and Pecl, 2014). Fish require healthy surroundings to survive and reproduce. Habitat for a fish is the environment which supports it; this includes the benthic habitat, water column habitat, and ecological connections and linkages that occur throughout. Climate obviously plays a large role in shaping habitat, as ocean temperature and water column properties are driven directly by broader climate conditions. The concept of habitat is simple and adaptable for describing a very complex system. Fish habitat plays an essential role in the reproduction, growth, and sustainability of commercial and recreational fisheries and supports the biodiversity on which these ecosystems depend. Habitat can be described in different ways. One approach is a top-down stock-based approach to description, where you start with a species and then describe its associated habitat. The latter is a more landscape ecology type of approach from the bottom up, starting with the habitat and then associated species. Within the standard single species management process, it can be difficult to incorporate habitat and climate considerations, although US regulations require Essential Fish Habitat (EFH) be defined for each managed stock. Under MSA (16 U.S.C. 1802(10)), EFH is “those waters and substrate necessary to fish for spawning, breeding, feeding or growth to maturity.” Essential fish habitat for mid-Atlantic species therefore currently uses the stock based approach of defining its habitat for individual species and life stages (eggs, larvae, adults, juveniles).
Some areas of the ocean are more productive for fish and shellfish than others. However, the importance of habitats in fish production and essential ecosystem services is poorly understood. A better understanding of habitat and its linkages to productivity is essential with the multiple demands and pressures on the ecosystem. Human activities have significantly altered coastal and marine habitat over time. Fish habitat continues to be degraded or lost due to a variety of factors, including coastal development, land-based pollution, fishing gear impacts, invasive species, dams and other blockages that restrict access for migratory fish species, and reduction in the amount and delivery of freshwater to estuaries. In addition, climate change and the demand for new sources of energy have the potential to cause wide-ranging impacts on fish and shellfish habitat (e.g., Nye et al., 2009; Doney et al., 2012; Samhouri and Levin, 2012). Given the continuing trend for coastal development, and projected impacts of climate change, the pressures on coastal and marine habitats are expected to increase (Frumhoff et al., 2007). Data related to these drivers and pressures is already assembled and reported for the Mid-Atlantic region in the NEFSC Ecosystem Status Report described above. Integrated ecosystem assessments (see Section Comprehensive Tools: Integrated Ecosystem Assessments below) may provide a way forward in integrating habitat considerations into fisheries management decision-making. Risk assessment (Section Comprehensive Tools: Conceptual Models below) may provide a useful context for integrating climate considerations into fisheries management.
Fleet Interactions
Similar to climate and habitat interactions above, social and economic interactions are only partially accounted for in the current fishery management process, but are critical drivers of fishery dynamics. Social and economic linkages across species are important because they can bind species that otherwise have no strong biological interactions (for example, yellowtail flounder as a bycatch in the scallop fishery), or generate effects that either reinforce or dampen the signals from biological interactions. These fishery interactions have the potential to greatly impact fishing behavior, with implications for both human and marine communities. The linkages manifest themselves in seafood and other commercial markets for marine resources, technological interactions of the fishing gear themselves, management policies, and social networks, among others. In the context of EAFM, the currently available tools for assessing these interactions are high level, due to the complexity of the interactions, and generate indicators that can be tracked over time. More nuanced tools aimed at understanding drivers of fleet behaviors can be developed, but must be customized to answer specific questions.
As a brief introduction to social and economic data, we present fleet-level information not usually reviewed by the Council during its management process. For example, revenue from Council managed species for the period 2005–2014, in 2014 equivalent dollar terms is available (Figure 2). The revenue peaks at $250 million in 2006, with what seems to be a downward trend since then. Revenue is dominated by summer flounder, surf clam and ocean quahog, monkfish, and long-finned squid, and landed primarily in Massachusetts, New Jersey, and Rhode Island ports. Of interest is the fact that a relatively large number of ports in both New York and Maine have landed Council managed species historically, although the total revenue landed in these states is comparatively low. The total revenue generated from permits that landed Council managed species in each year (Figure 3) is roughly 4 times greater than revenue from Council managed species only. This means that the majority of the revenue generated by fishermen that catch Council managed species actually comes from species not managed by the Council, which indicates substantial multi-jurisdictional fleet interactions in the Mid-Atlantic region.
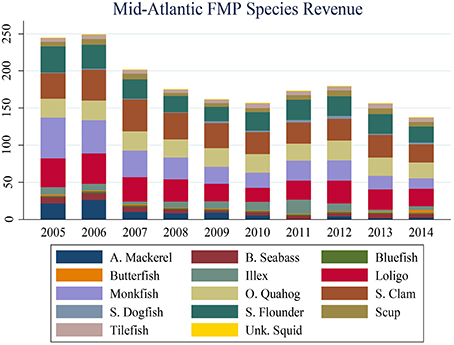
Figure 2. Revenue (million $US) generated from Council managed species, by species.
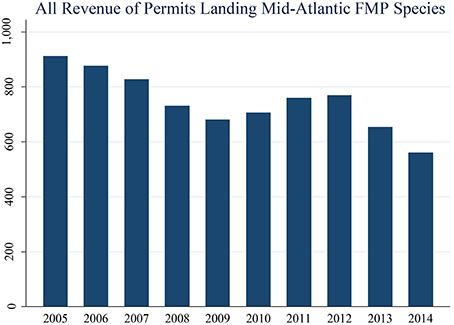
Figure 3. Total revenue (million $US) generated by permits landing Council managed species in that year.
Gear and vessel size, as well as species catch information is available for analysis. Bottom trawl serves as the dominant gear for much of the time series, although in more recent years the number of permits for scallop dredge, hand gear, and gillnets are on par with the bottom trawl permit numbers (Figure 4). Conversely, the 30 to 50 ft. vessel class seems to have increased in proportion over the time series, primarily to the detriment of the largest vessel category (75 ft. and above; Figure 5). Estimates of catch diversity have been developed to better understand whether specialization is occurring. The distribution of effective Shannon indices1 for species revenue at the permit level, for all permits landing Council managed species within a year indicates substantial heterogeneity in the diversity of species landed across permit holders (Figure 6). Further, this distribution is relatively constant across the time series, with no trend apparent, suggesting specialization has not been a dominant force recently. Fleet diversity, defined as the revenue generated by the combination of major gear and vessel class, shows a downward trend (Figure 7), suggesting that fleet diversity has decreased over time. Similar indices can been calculated to look at the diversity of ports landing Council managed species, to investigate the expansion or contraction of the suite of ports within the Mid-Atlantic, and better understand the dynamics within the system.
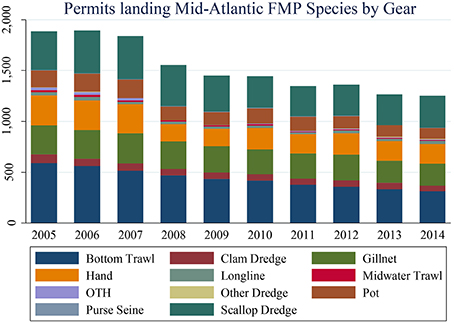
Figure 4. Number of permits landing Council managed species, by gear.
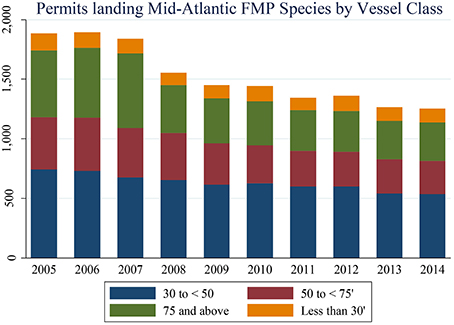
Figure 5. Number of permits landing Council managed species, by vessel class.
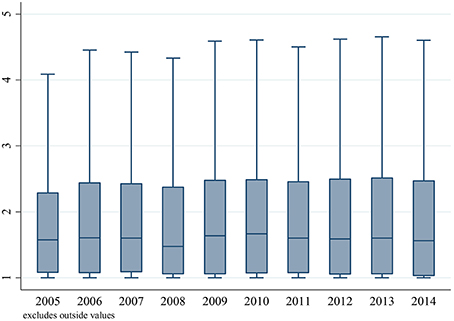
Figure 6. Distribution of effective Shannon indices for the diversity of species revenue at the permit level.
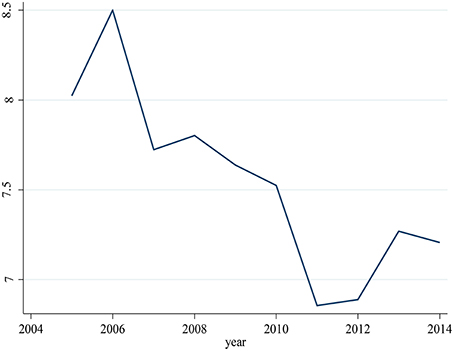
Figure 7. Fleet diversity, as measured by the revenue generated by each subfleet.
Regulatory Interactions
Regulations designed for one fishery, fleet, or issue may also interact with other fisheries or fleets, creating unintentional side effects or constraining fishing opportunities. These interactions are often discovered after implementation of regulations, causing difficulties for fishermen and throughout the management process. For example, limits on the catch of one depleted species may cause it to act as a “choke” species, limiting the catch of other species caught in the same habitats to well below their allowable biological catch if the limiting species cannot be avoided. Similarly, time and or area management designed to meet an objective for a single species may also limit the catch of other associated species, causing fleets targeting the other species not to meet economic objectives. Fishery restrictions designed to reduce or minimize interactions with marine mammals under the Marine Mammal Protection Act are another example of regulatory interactions. Fishing behavior often changes in reaction to these regulatory interactions, potentially leading to changes in fishing locations, species and size composition of catches. These management-related interactions should be considered and analyzed prior to implementation of new management measures.
Comprehensive Tools: Integrated Ecosystem Assessments
Levin et al. (2009) outline the general process of Integrated Ecosystem Assessment (IEA). The three primary tools outlined in Sections Comprehensive Tools: Conceptual Models to Comprehensive Tools: Management Strategy Evaluation below, and suggested for addressing species, fleet, climate, and habitat interactions in the Northeast US Mid-Atlantic region are all components of this IEA framework. The US National Oceanic and Atmospheric Administration (NOAA)'s IEA program (www.noaa.gov/iea) continues to make progress on integrated assessment in all 5 US regions where it is currently being implemented (i.e., California Current, Gulf of Mexico, Northeast Shelf, Alaska Complex, Pacific Islands). The Northeast Shelf region has well-developed ocean observation systems, marine ecosystem surveys and habitat studies, though social and economic data collection systems are less well developed, and steps are being taken throughout the region to organize existing information and effectively communicate it to stakeholders and decision-makers. An IEA framework may be helpful for considering the cumulative effects of the interactions presented above. At the ecosystem level, interactions between both large scale environmental drivers and human activities (including fishing) are mediated by habitat and species interactions to affect the ecological systems under management.
On the Northeast Shelf, the primary IEA reference is the Northeast US Ecosystem Status Report, an entirely web-based product (http://www.nefsc.noaa.gov/ecosys/), which provides a comprehensive synthesis of climate and ecosystem data and reporting for each Northeast US region, including the Mid-Atlantic. An IEA framework can be particularly useful for evaluating ecosystem-wide productivity, climate trends, and habitat quantity and quality. For example, climate trends for the Northeast US shelf are regularly reported and updated (see http://www.nefsc.noaa.gov/ecosys/climate-change/), and updates of current conditions are provided (http://www.nefsc.noaa.gov/ecosys/current-conditions/). IEA indicators for habitat types apply to multiple species associated with or dependent on that habitat type. Initial Northeast IEA habitat indicators are already compiled within the NEFSC Ecosystem Considerations webpage (see http://www.nefsc.noaa.gov/ecosys/ecosystem-status-report/ecosystem-services.html).
At the IEA level, managed fish and invertebrate species could be categorized by habitat type; e.g., Council managed mackerel, squids, and butterfish would be in the pelagic habitat category, while surfclams and ocean quahogs would be in the seafloor habitat category. Alternatively, managed species could be classified by warm or cold water habitat preference to evaluate potential climate-driven distribution shifts. Using components of the IEA framework, connections between climate, habitats, species, and fleets within and outside Council jurisdiction can be visualized and eventually quantified, if that becomes a priority for the Council. This would complement existing single stock assessment and EFH by taking a full system perspective.
Comprehensive Tools: Conceptual Models
“Conceptual models” developed for the California Current IEA are being adapted for the Northeast US shelf, and could be a useful tool for Fishery Management Councils to address species and fleet interactions. Conceptual models are intended to provide a unifying framework that crosses disciplines, and clarifies system boundaries and any gaps in knowledge (Heemskerk et al., 2003; Orians et al., 2012). They are invaluable as a communication tool within an IEA working group, with other scientists, and with the public. This framework allows linking of indicators with elements of the conceptual models, as well as linking concepts across ecological and social components of a given system. The California Current IEA project worked for over a year to produce a set of linked conceptual models in December, 2014 (Levin et al., in press; http://www.noaa.gov/iea/Assets/iea/california/Report/pdf/10.%20Human%20Dimensions_2013.pdf.).
In developing these conceptual models, the IEA team looked at each focal ecosystem component to develop links between ecological interactions (e.g., what are the strongest food web interactions), environmental drivers (what are the acknowledged drivers of abundance and community composition?), human activities (what are the strongest known human interactions or human risks posed to this focal ecosystem component?) and human wellbeing (what is the human dimensions context?). Detailed linkage models were developed for six ecosystem components: salmon species, coastal pelagic species, groundfish species, marine mammals, seabirds, biodiversity, and habitat. The California Current IEA project has used these conceptual models to improve communications with regional fishery management councils regarding key linkages between managed species and the environment, in groundfish stock assessment ecosystem considerations sections, and on their webpages for navigation by users to see linked information on status, trend, indicators, etc. A possible conceptual model for the US Mid-Atlantic region demonstrating these linkages would show how climate and human activities interact with species in the food web and with habitat. Further it would show how healthy habitat supports biological objectives (e.g., healthy biomass levels, production, and trophic structure) for managed species, which in turn support objectives for human well-being (e.g., seafood production, recreational opportunities, profitability, employment, stability, and culture).
Comprehensive Tools: Risk Assessment
Risk assessment is a process to evaluate the potential, magnitude, and consequence of negative events occurring. It is a component of the IEA process, and is a best practice adopted originally from business management fields and encoded by the International Standards Organization (ISO) standard 31000 (ISO, 2009a,b,c). The ISO standard bases risk management on a three-step risk assessment process: identification, analysis, and evaluation, which ultimately determines whether risk treatment is required to meet management objectives. Built into the standard are requirements for risk communication, consultation, review, and continued monitoring. The advantage of this approach is that it is consistent, transparent, and standardized. Furthermore, the approach has been adapted to evaluate a wide range of environmental issues (e.g., US EPA, 1998; Standards Australia, 2012; Cormier et al., 2013) including some instances of risk assessment for fisheries stocks (e.g., Fletcher, 2005; Smith et al., 2007; Martin-Smith, 2009; Patrick et al., 2010; Hobday et al., 2011; Hollowed et al., 2013).
A simple ecosystem based risk assessment for the Aleutian Islands Fishery Ecosystem Plan in Alaska demonstrates how this tool can be used to prioritize key interactions within an region for further research, analysis, and or MSEs (AIFEP Team, 2007). In this application, expert opinion was used to first develop a set of key ecosystem interactions not currently assessed or monitored within the fisheries management system, and then to rate the probability of key ecosystem interactions occurring and the impact of the interaction to identify the highest risk interactions as those with high probability and high impact. Similar to the Australian Level 1 assessment, this risk assessment both identified high priority interactions and potential indicators suited to monitoring changes in the interactions. A quick assessment like this can form the basis for further development of management objectives. This contrasts with a more quantitative risk analysis that would be done once objectives are established, which would evaluate the risk of not meeting the management objectives, possibly under alternative management scenarios as in MSEs. Climate vulnerability assessment has been conducted for Northeast US species (NEVA; (Hare et al., 2016)) and may form the basis for further Council consideration of climate interactions in fishery management (Figure 8; Box 3). Risk is also considered within portfolio analysis integrating species and economic interactions to consider risk reward tradeoffs in Northeast US fisheries (Jin et al., 2016; Box 4).
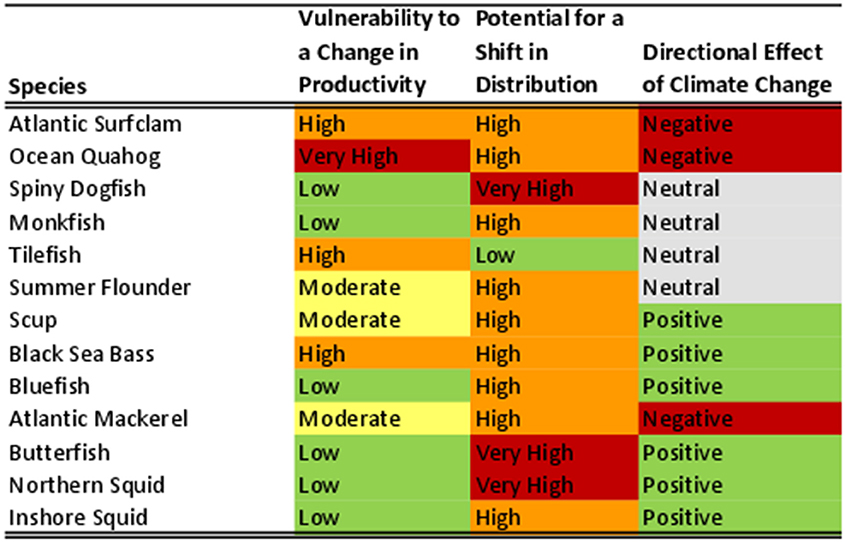
Figure 8. Summary of results from the Northeast Fisheries Climate Vulnerability Assessment (NEVA) for Mid-Atlantic Council managed species. Colors represent low (green), moderate (yellow), high (orange) and very high (red) potential for a change in productivity or distribution. Colors in the rightmost column represent expected negative (red), neutral (gray), and positive (green) overall directional effect of climate change on the species in this region.
Box 3. Identifying Climate Risks to Mid-Atlantic Managed Species.
Climate vulnerability assessment has already been conducted for Mid-Atlantic managed fish species at both the general community (Gaichas et al., 2014) and species specific (Hare et al., 2016) levels. These analyses applied similar vulnerability assessment frameworks which used currently existing knowledge and expert opinion. Both used quantitative data when available, and qualitative information when data was lacking. In both analyses, “Vulnerability” was defined as the risk of changes in stock abundance or productivity in a changing climate. Stocks with ability to shift distributions in a changing climate may receive a “low vulnerability” ranking using these methods. Therefore, a subset of the attributes may be useful in identifying stocks that possess the ability to shift distributions, which is also important to fishery managers.
The community level analysis showed that the most vulnerable Mid-Atlantic stocks included both commercially important and non-target benthic organisms, followed by commercially important demersal fish, with pelagic fish generally least vulnerable (Gaichas et al., 2014). The species level analysis used model projections of climate conditions and evaluated individual species. This analysis also found that exposure to climate change throughout the Northeast US shelf is high to very high, and that climate sensitivity is higher for shellfish species and lower for groundfish and pelagics. Within the Mid-Atlantic region, 1 managed species received a very high vulnerability rating, 3 were rated high vulnerability, 3 were rated moderate, and only 6 was rated low (Figure 8). In addition, the NEVA (Hare et al., 2016) identifies which species are likely to shift distributions in response to projected climate patterns within the region: all but one managed species had high to very high distribution change potential. Finally, the NEVA evaluated the directional effect of climate change on fish and shellfish species. Three MAFMC managed species are likely to respond negatively, while six species are likely to respond positively.
This preliminary risk assessment, like any analysis, is not intended to answer all climate related questions for the Council, but it can be extremely helpful for making certain decisions. For example, it does not address magnitude of climate effects, it does not consider exposure or sensitivity as thresholds (cumulative), it does not evaluate harvest control rules or determine appropriate catch levels or replace mechanistic models, and it does not apply outside of the study area. Importantly, the NEVA does inform stakeholders as to the relative vulnerability of species. It identifies important climate exposure factors and sensitivity attributes. It informs data gaps and can contribute to setting research priorities. It identifies species where mechanistic models and/or MSE's that include climate change might be useful, and it does help identify species and issues that need more research attention. In short, this analysis could help the Council identify which species need integrated research on climate, habitat, species, and fleet interactions first.
Box 4. Minimizing Risks to Economic Returns in Multispecies Fisheries.
The portfolio analysis developed in Jin et al. (2016), and following Sanchirico et al. (2008), provides an overview of the risk exposure associated with the mix of species managed by the Mid-Atlantic. Consideration of risk is weaved throughout the National Standards of the Magnuson-Stevens Fishery Conservation and Management Act. Portfolio theory allows the economic risk-reward trade-offs of multispecies fishery management to be assessed. Risk aversion entails choosing a mix of landings from species that minimizes the variance (risk) around an expected return (reward) from the system, subject to the biological constraints within the fishery. Put plainly, the portfolio approach identifies the mix of species that maximizes the probability of achieving the targeted returns to a system in any given year. Portfolio analysis can be used to assess historical performance of the fisheries under Council management by comparing the realized level of risk to the minimum risk that could have produced the same level of returns.
An example below from Jin et al. (2016) presents historical analysis for Maine, Massachusetts, and Rhode Island, with the risk represented as the difference between the realized and optimal standard deviations divided by the realized returns. This analysis identifies the time periods in which the largest divergence from the risk-minimizing landings portfolio occurred. Further, because this analysis can be run at multiple spatial resolutions (from the full Northeast US, to the Mid-Atlantic region, to individual ports), it can identify disproportional risk exposure across different geographic resolutions, and identify whether the risk propagates through or is balanced within the system as a whole. The portfolio model can also be coupled to the multispecies models currently under development at the NEFSC, and provide an explicit understanding of risk-reward trade-offs of future scenarios. Given that returns are not the only objective of management, the portfolio analysis would allow an understanding of the cost, in terms of additional economic risk, of achieving the suite of management objectives.
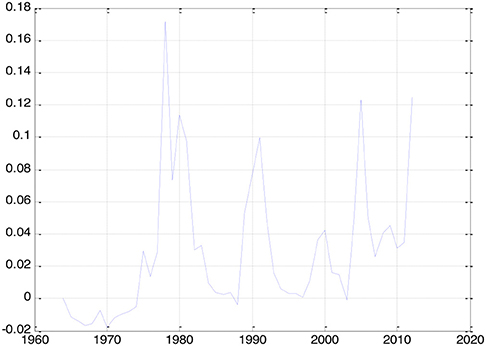
Risk inefficiency in ME, MA, and RI 1964–2012
Comprehensive Tools: Management Strategy Evaluation
Management decisions are always made with substantial uncertainty. For example, there is uncertainty in the estimate of the status of the resource, the population dynamics of the resource, and the effects of the management decision on the resource and on the system as a whole. There is also uncertainty and risk associated with management choices. MSE is an approach to determine if a method for making decisions is likely to achieve specified objectives (Smith, 1994; Butterworth, 2007; Smith et al., 2007; Punt et al., 2014). The MSE approach requires objectives be specified, performance metrics be identified, and management strategies, scenarios, and uncertainties to be specified clearly, and then uses a simulation model to test each management strategy's ability to meet the specified objectives. Processes simulated within the “natural system” can include ecological, climate, habitat, fleet, economic, and social interactions. Data collection, assessment and management processes, as well as regulation of human activities with feedbacks into the natural system can also be simulated—this “closed loop” is a critical characteristic of MSE. Different management strategies are evaluated for performance against pre-determined performance measures.
The Council has already used MSE to inform decision-making. For example, the performance of alternative ABC control rules have been tested, as well as the performance of methods for implementing control rules. Similarly, MSEs have tested the performance of other characteristics of the management system (e.g., assessment frequency and management lag; data poor ABC estimation methods). Typically, the uncertainty in population dynamics (recruitment, fishery and survey size selectivity, and natural mortality) are included within the MSE, as well as uncertainty in fishery dependent and independent sampling and in stock assessment. However, many other uncertainties could be included in an MSE, depending on Council and stakeholder objectives. Examples of performance metrics used in MSEs can include average catch (short and long term), average biomass (short and long term), probability of overfishing, ability for populations to rebuild, and average annual variability of the catch. Again, many other performance metrics can be included in an MSE to measure performance against Council and stakeholder objectives related to fleet, species, habitat, and climate interactions.
An important aspect of MSE is that defining the objectives, performance metrics, and key uncertainties should be done within an inclusive stakeholder process. MSE is a simulation analysis, but to be helpful with management decisions, framing the analysis and the control rules or other management procedures to test must include managers, policy makers, fishermen, scientists, and other stakeholders. Overall, MSE allows the Council an opportunity to test management measures before implementation. MSEs can be particularly good for identifying strategies that will not work. MSE should be considered an investment rather than a quick fix, because the time requirement can be long and MSE is inherently an iterative process. Further, not all important uncertainties and objectives can be explicitly included, and MSE results can be highly dependent on the assumed dynamics. Therefore, investment in multiple simulation models with adequate alternative structures to evaluate the interactions of interest (species, habitat, climate and fleet) is a pre-requisite for effective MSE.
A Potential Framework for Addressing Interactions
To incorporate species, fleet, habitat, and climate interactions into management, the Council might consider a structured framework to first prioritize interactions, second specify key questions regarding high priority interactions, and third tailor appropriate analyses to address them. The primary tools for the initial steps in the framework are risk assessment and MSE. Finally, implemented management would be evaluated to ensure that objectives are being met, or to adjust measures as conditions change (Figure 9).
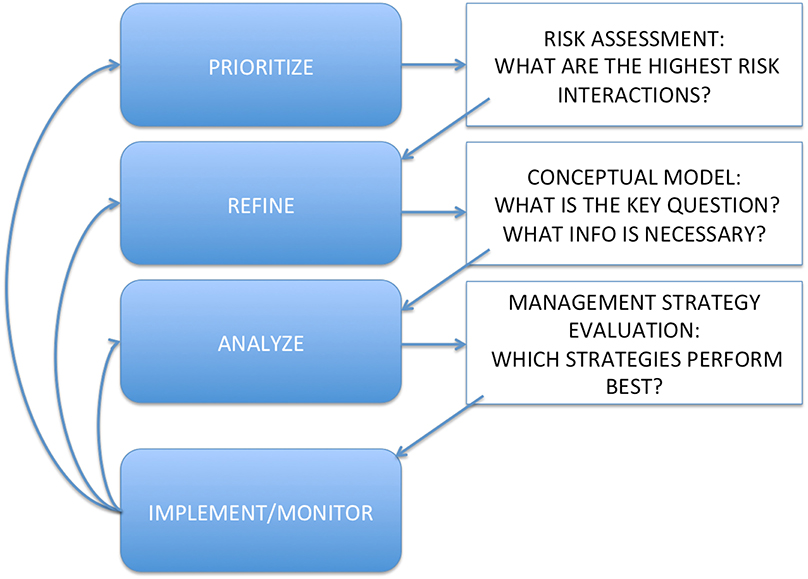
Figure 9. A potential framework for integrating interactions into management.
Step 1: Prioritize with Risk Assessment Tools
There are so many possible interactions in a fishery ecosystem that one analysis or tool cannot effectively address them all, so risk assessment is proposed as the initial step to identify a subset of high priority interactions for the Council to address first. The Council's goals and objectives would shape the assessment by first identifying risks and impacts of concern. Risk assessment is a critical nexus of science and management because this is where scientific information feeds directly into management decision making, in particular in developing risk criteria and consequences. Risk assessment helps managers to decide where to focus limited resources by clarifying priorities. These methods could be used much more often for screening out interactions of lesser importance that may currently have equal or more resources devoted to them than higher risk interactions.
For example, the NEVA has already identified which species are most likely to be vulnerable to climate/habitat change (Figure 8, Box 3), so the Council could elect to evaluate whether species interactions pose further risks to meeting management objectives for the most climate-vulnerable species. Alternatively, climate-vulnerable coastal communities (e.g., Colburn et al., 2016) and or fishing fleets could serve as a starting point, evaluating additional risks due to management, ecological, and other interactions.
Step 2: Refine Key Management Questions for Highest Risk Interactions
What are the Council's primary questions regarding a given high priority interaction? What are the Council's objectives for integrating the interaction into management? As the Council refines the question with stakeholders, scientists can evaluate data availability and gaps, and identify analytical tools to address the question. While much data and many tools exist for the Mid-Atlantic region, adequate time for data acquisition and quality control and tool refinement should be allocated to ensure a tailor-made, appropriate analysis.
Basic conceptual models can be developed for the particular question during this process to ensure that key ecological, climate, habitat, fleet, social, and economic interactions are addressed. Conceptual models help organize analyses and information, and clarify interactions for all stakeholders to work from a common understanding. For example, a question centered on climate impacts to a particular species might start with a conceptual model of known climate and habitat interactions for that species, but build in any critical interactions with other species, fishing fleets, fishing communities, regional and global economic markets, etc., as necessary to address the questions and management objectives.
This step is critically important in the framework, because it adds a point in the process where interactions are systematically considered. In particular, management interactions and inter-jurisdictional issues can be formally considered here (e.g., Council managed species discard in other regions; species moving into or out of the region due to climate and habitat change; land use practices altering nursery habitat for managed species). It may be necessary to consult with other management entities and involve them in further steps.
Step 3: Analyze Management Procedures with Comprehensive MSE
The Council's questions and objectives identified in Step 2, along with available data, tools, and management strategies feed into comprehensive MSE employing performance measures across biological, ecological, management, social, and economic outcomes. This iterative and stakeholder-driven process can evaluate the impacts of uncertainties in data collection systems, assessment methods, management decision processes, implementation of management measures, and other human activities as well as in the underlying climate, habitat, and ecology.
Some simulation models with capabilities to address species, habitat, climate, fleet, social, and economic interactions are available in the Mid-Atlantic region, although further development would be necessary for any particular MSE. Addressing questions with multiple simulation models and linking existing economic, single species, and ecosystem models expands analytical possibilities.
Step 4: Implement, Monitor, Adapt, and Iterate as Needed
Management measures designed to address interaction between species, habitats, fleets, and climate forcing may require additional or different monitoring to determine if objectives are being met. Careful consideration of performance measures and monitoring systems to be used in real time (as well as in MSE) needs to be part of this process. There is considerable potential to make better use of existing real time observing systems, in particular for climate and habitat interactions, as well as fishermen-based observation systems to evaluate management success.
How Might the Framework be Used? An Example
Step 1: Prioritize with Risk Assessment Tools
The Council could conduct a comprehensive but quick risk assessment addressing all managed species and multiple risk categories. For example, the current status of each stock with respect to single species objectives could be included first, because preventing overfishing and keeping stocks above the overfished level are legally mandated objectives. Second, the Council could consider the level of stock assessment uncertainty and/or data availability for each stock (addressing abundance estimates, etc., considered under Section Interactions in Single Species Stock Assessments above). Next, the level of fishery discards and how well/poorly they are accounted for in assessments could be considered. Food web considerations (whether species are key prey for other managed species, or predators that rely on other managed species), climate considerations (whether species productivity or distribution are predicted to change), threats to habitat, and difficulties with allocation between fleets, fishery sectors, or regional jurisdictions could also be considered. While the Council would define these risk categories and others may be included, it is possible to visualize the risks across species and categories (Figure 10). From here, the Council might consider species groups with the most high risks as priority candidates for further analysis of ecosystem interactions.
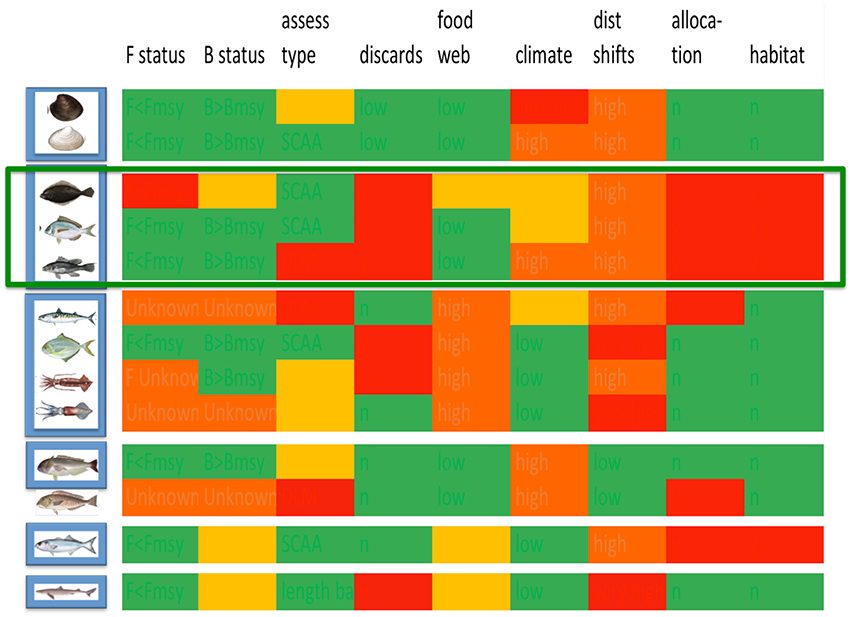
Figure 10. Example qualitative risk assessment across Council managed species (left column) and multiple risk categories (top row; see text for descriptions). Colors represent low (green), moderate (yellow), high (orange) and very high (red) risks within each category. A set of species within a current fishery management plan characterized by multiple relatively high risk scores is selected for further analysis. We note that this is only an example for illustration, and not a Council analysis.
Step 2: Refine Key Management Questions for Highest Risk Interactions
A conceptual model linking climate, habitat, species, fleet, and regulatory interactions can be constructed for the set of species using a multi-disciplinary team with expertise appropriate to identify key interactions. For this example (Figure 11), the existing Mid-Atlantic food web model is used to define key species interactions for each managed species, habitat expertise is needed to link habitats to species, physical oceanographic and climate expertise is needed to link key climate drivers to habitats, and the expertise of fishermen, economists and other social scientists, and fishery managers is needed to link fish with fisheries and objectives for human well-being. The key link between fisheries and human well-being objectives is identified as the system of regulatory allocations of total allowable catch between states along the Mid-Atlantic coast. The interaction between this allocation system (based on historical catch) and climate-driven distribution shifts of the managed species has created considerable difficulty in this region. This conceptual model clearly connects climate considerations to management, as well as habitat considerations of concern to the Council but outside Council jurisdiction (water quality in coastal estuaries).
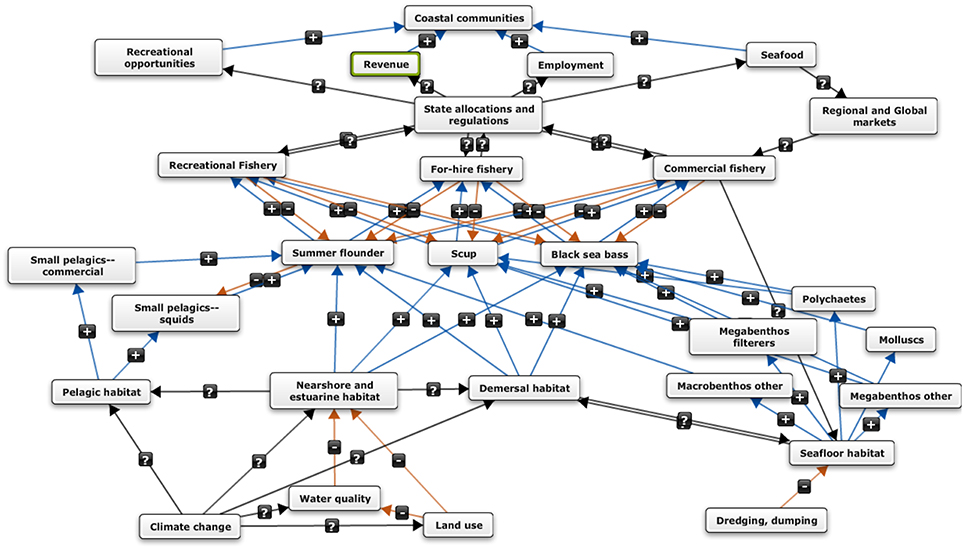
Figure 11. Conceptual model linking climate, habitat, species, fleet, and regulatory interactions for Council managed species summer flounder, scup, and black sea bass. The focal managed species are at the center of the model. Climate and human activity impacts on habitat are oriented toward the bottom of the model, and species interactions between the habitats and focal species (because prey species are associated with habitats as well). Fishing fleet and regulatory interactions with human well-being objectives are placed at the top of the conceptual model. We note that this is only an example for illustration, and not a Council analysis. Image created in online Mental Modeler software (http://www.mentalmodeler.org/#download).
Step 3: Analyze Management Procedures with Comprehensive MSE
Once key interactions are identified, objectives for a more detailed MSE would be defined by the Council, along with stakeholders (Figure 12). Using the example above, further tool development would then occur depending on the direction that the Council wanted to take. We offer two examples below. There are many other examples of questions the Council could ask. These would each lead to a different analysis using different tools. These are only examples and not recommendations.
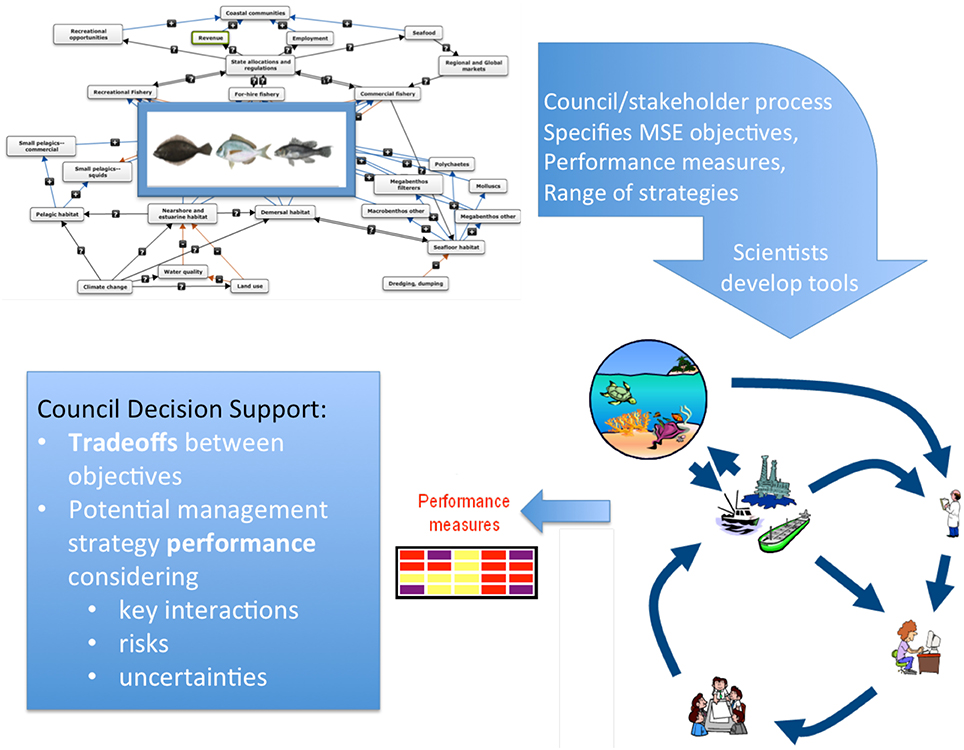
Figure 12. Linkages between the conceptual model and the MSE process. MSE representation adapted from figure by Beth Fulton at CSIRO; (http://www.cmar.csiro.au/research/mse/).
Question 1: “What management structure (i.e., licensing, allocations, etc.) provides the flexibility necessary to absorb the impacts of climate change, including shifting species distributions, and more broadly any large perturbation to the system.”
Tools that could be used to answer question 1:
• Experimental economics can be used to understand the magnitude of both the intended and unintended consequences of management decisions. A good example of this would be the experiments investigating the point system that was proposed as part of scoping for Amendment 16 of the New England Fishery Management Council's Northeast Multispecies FMP (Anderson, 2010).
• Participatory modeling and MSE with the Council and stakeholders could be used to inform potential outcomes of alternatives during the design of alternatives, for which historical data might not provide much insight (i.e., reallocation of stocks).
Question 2: “Under the current management system, what are the likely effects of inaction in the face of shifting species distributions and how quickly do they accrue?”
To address Question 2, exposure of species, fishermen, and communities to climate can be drawn together relatively quickly, given the current knowledge and models available. However, specific models would need to be developed to assess the changes in welfare associated with future shifts.
• Economic models could be developed to assess which fishermen are likely to continue fishing, and what species would be caught.
• There are not currently off-the-shelf models to answer either question, and it would take time to generate the models/build up capacity. Therefore, having the Council identify priority questions is vital.
Step 4: Implement, Monitor, Adapt, and Iterate as Needed
The MSE would suggest alternate management strategies and give information on how well each would meet the range of objectives established by the Council. MSE requires the specification of performance measures to determine how well objectives are met; assuming that the performance measures represent actual data streams available to the Council, these could also be used to monitor the actual performance of selected and implemented management measures. However, given that both climate and human uses of the ecosystem change over time, revisiting risk assessment, interactions, conceptual models, and management strategies over time will be necessary.
Conclusions
An ecosystem approach to fisheries management emphasizes a more integrated approach to habitat, sustainability, multi-species interactions, connectivity, and dynamic change. To address these ecosystem factors in terrestrial systems, there is high quality, easily collected data with a well mapped landscape, standard classification systems for habitat types and guilds of species (i.e., Southern Oak Pine Forest; Northern Peatland and Fens), and timely data collection systems. In the marine and aquatic environment there are none of these terrestrial advantages. The data are patchy in both space and time, and oceanographic data and biological data are incomplete. It is also very difficult to collect information in the very deep waters of the continental shelf.
So what do we do? Acknowledge we are in a transitional state and the incomplete nature of the data and science with which we have to work, and move forward both strategically and systematically. We first need to recognize that most of the Council's managed resources have strong nearshore and coastal linkages to habitat, and in many cases the nearshore and offshore environment for these managed resources is one continuum.
We need to start expanding how we describe Mid-Atlantic species habitat by focusing on the biological, physical-hydrographic, and ecological criteria. This should include taking tips from the landscape ecology approaches on land, which use the synecological/biotope approaches to describing habitat and associated species assemblages. As a first step this should include improving how EFH is designated.
Temperature can serve as a basic biological point to start mapping and modeling habitat. While salinity may set the biological boundaries between the freshwater, estuarine, and marine environment, temperature is a driving factors in a variety of biological processes. It plays a role in predator and prey migration (onshore-offshore and vertical movements), light regimes, dissolved oxygen concentrations and fluctuations, and drives primary production, reproduction, survival, growth, and is a factor in ocean acidification.
To improve how we describe habitat, we need to prioritize the collection of data. This should include sampling both habitat types and use by species. The current fishery-independent trawl surveys and seine surveys actually sample trawl-able habitat and beaches often during migratory/transitional behaviors—we should be sampling across all habitat types seasonally to describe habitat characteristics and use by species. Under the current sampling, food habitat data and information may be biased for some species. We need to prioritize resources for habitat science to address these information gaps. Using technology and more efficient ways to collect and validate the information we need will be necessary given current sampling resources are limited.
To address habitat in the larger context, we must first:
1. Consider multi-stock assemblages and habitat use,
2. Define habitat by uniform and relevant biological, physical-hydrographic, and ecological criteria, and,
3. Address spatial and temporal scales in uniform way.
To address climate driven changes in productivity for some species
• Consider evaluating for changes in reference points
• Consider adjusting risk polices
◦ Declining productivity ~ less risk
◦ Increasing productivity ~ more risk
To address climate driven changes in distribution for many species
• Re-evaluate stock boundaries and data collection systems
• Re-evaluate spatial allocations
• Re-evaluate time and space closures
• Food-web will change; evaluate impacts on consumption / natural mortality
• New species will come into area (e.g., BluelineTilefish, Chub Mackerel, others)
To address Climate driven changes in productivity and distribution of forage species and protected species
• Consider effect of increase interaction with protected species
• Consider mechanisms to decrease interactions with protected species
• Consider effect of changes in forage fish
To address Climate driven change in fish and invertebrate populations will force changes in the socio-economics of fishing
• Community vulnerability to climate factors
• Changes in interactions with protected species or choke species
• Changes in markets
• Long-term economic decisions (individual and community)
• Consider other co-stressors (e.g., contaminants, habitat, invasive species)
To integrate trophic interactions into management, consider prioritizing:
• Strong interactions between managed species (high energy flow and/or mortality)
• Strong interactions between managed and protected species
• Key forage species supporting many managed and protected species
To manage strongly interacting species, (in addition to forage recommendations)
• Consider conditional reference points for strongly interacting species (e.g., Species X Bmsy is dependent on Species Y F or B and or prevailing habitat volume/climate conditions)?
◦ How would these be put through the management and regulatory process? How often would they need updating?
To manage fleet and any interactions,
• How would fishermen react to different management alternatives?
• What other options do they have from both a regulatory and ecological perspective?
Profit and production functions can provide much more detailed evaluation of fishery interactions at the level of the fishing business, and help answer questions surrounding fleet dynamics across numerous margins. For example, expected shifts in species distribution have the potential to affect fleet composition, species targeting and bycatch, fishing locations, and landing ports, among others. Each of these margins, in turn, provide understanding that help answer a different question, and although they all rely on a single underlying theoretical model, require a different specification of the empirical model to be estimated for tractability. Thus, the models are developed to answer specific questions which need to be defined as a first step, with specific guidance from the Council.
Author Contributions
SKG and RJS developed the conceptual framework and edited the full paper, and wrote individual sections. JMC, GSD, VGG, JAH, PJR, MJW wrote individual sections and contributed analyses.
Funding
This work was prepared by employees of the Mid-Atlantic Fishery Management Council and the US Federal Government (Department of Commerce, National Oceanic and Atmospheric Administration) as part of their official duties. MJW was funded by the Mid-Atlantic Fishery Management Council.
Conflict of Interest Statement
The authors declare that the research was conducted in the absence of any commercial or financial relationships that could be construed as a potential conflict of interest.
Footnotes
1. ^This index is calculated as , with pi representing the proportion of revenue generated by species i, and is a composite of richness (the number of species landing) and abundance (the revenue generated from each species).
References
AIFEP Team (2007). Aleutian Islands Fishery Ecosystem Plan. Anchorage, AK: North Pacific Fishery Management Council. Available online at: http://www.fakr.noaa.gov/npfmc/PDFdocuments/conservation_issues/AIFEP/AIFEP12_07.pdf
Anderson, C. M. (2010). An experimental analysis of a points-based system for managing multispecies fisheries. Agric. Resour. Econ. Rev. 39, 227–244. Available online at: http://purl.umn.edu/90830
Butterworth, D. S. (2007). Why a management procedure approach? Some positives and negatives. ICES J. Mar. Sci. J. Cons. 64, 613–617. doi: 10.1093/icesjms/fsm003
Christensen, V., and Walters, C. J. (2004). Ecopath with Ecosim: methods, capabilities, and limitations. Ecol. Model. 172, 109–139. doi: 10.1016/j.ecolmodel.2003.09.003
Colburn, L. L., Jepson, M., Weng, C., Seara, T., Weiss, J., and Hare, J. A. (2016). Indicators of climate change and social vulnerability in fishing dependent communities along the Eastern and Gulf Coasts of the United States. Marine Policy. doi: 10.1016/j.marpol.2016.04.030. [Epub ahead of print].
Collie, J. S., Botsford, L. W., Hastings, A., Kaplan, I. C., Largier, J. L., Livingston, P. A., et al. (2016). Ecosystem models for fisheries management: finding the sweet spot. Fish Fish. 17, 101–125. doi: 10.1111/faf.12093
Cormier, R., Kannen, A., Elliott, M., Hall, P., and Davies, I. M. (eds.). (2013). Marine and Coastal Ecosystem-Based Risk Management Handbook. ICES Cooperative Research Report No. 317. Copenhagen: International Council for the Exploration of the Sea.
Curti, K. L., Collie, J. S., Legault, C. M., Link, J. S., and Hilborn, R. (2013). Evaluating the performance of a multispecies statistical catch-at-age model. Can. J. Fish. Aquat. Sci. 70, 470–484. doi: 10.1139/cjfas-2012-0229
Doney, S. C., Ruckelshaus, M., Duffy, J. E., Barry, J. P., Chan, F., English, C. A., et al. (2012). Climate change impacts on marine ecosystems. Annu. Rev. Mar. Sci. 4, 11–37. doi: 10.1146/annurev-marine-041911-111611
Fletcher, W. (2005). The application of qualitative risk assessment methodology to prioritize issues for fisheries management. Ices J. Mar. Sci. 62, 1576–1587. doi: 10.1016/j.icesjms.2005.06.005
Frumhoff, P. C., McCarthy, J. J., Melillo, J. M., Moser, S. C., and Wuebbles, D. J. (2007). Confronting Climate Change in the U.S. Northeast: Science, Impacts, and Solutions. Synthesis report of the Northeast Climate Impacts Assessment. Cambridge, MA: Union of Concerned Scientists. Available online at: http://www.climatechoices.org/assets/documents/climatechoices/confronting-climate-change-in-the-u-s-northeast.pdf
Fulton, E. A., Link, J. S., Kaplan, I. C., Savina-Rolland, M., Johnson, P., Ainsworth, C., et al. (2011). Lessons in modelling and management of marine ecosystems: the Atlantis experience. Fish Fish. 12, 171–188. doi: 10.1111/j.1467-2979.2011.00412.x
Gaichas, S. K., Link, J. S., and Hare, J. A. (2014). A risk-based approach to evaluating northeast US fish community vulnerability to climate change. ICES J. Mar. Sci. 71, 2323–2342. doi: 10.1093/icesjms/fsu048
Hare, J. A., Morrison, W. E., Nelson, M. W., Stachura, M. M., Teeters, E. J., Griffis, R. B., et al. (2016). A vulnerability assessment of fish and invertebrates to climate change on the Northeast U.S. Continental Shelf. PLoS ONE 11:e0146756. doi: 10.1371/journal.pone.0146756
Heemskerk, M., Wilson, K., and Pavao-Zuckerman, M. (2003). Conceptual models as tools for communication across disciplines. Conserv. Ecol. 7:8. Available online at: http://www.consecol.org/vol7/iss3/art8/
Hobday, A. J., and Pecl, G. T. (2014). Identification of global marine hotspots: sentinels for change and vanguards for adaptation action. Rev. Fish Biol. Fish. 24, 415–425. doi: 10.1007/s11160-013-9326-6
Hobday, A. J., Smith, A. D. M., Stobutzki, I. C., Bulman, C., Daley, R., Dambacher, J. M., et al. (2011). Ecological risk assessment for the effects of fishing. Fish. Res. 108, 372–384. doi: 10.1016/j.fishres.2011.01.013
Hollowed, A. B., Planque, B., and Loeng, H. (2013). Potential movement of fish and shellfish stocks from the sub-Arctic to the Arctic Ocean. Fish. Oceanogr. 22, 355–370. doi: 10.1111/fog.12027
ISO (2009a). Risk Management - Risk Assessment Techniques. International Standards Organization. IEC/ISO 31010. (Geneva: International Standards Organization).
ISO (2009b). Risk Management Principles and Guidelines. International Standards Organization. ISO 31000:2009(E). (Geneva: International Standards Organization).
ISO (2009c). Risk Management Vocabulary. International Standards Organization. ISO GUIDE 73:2009(E/F). (Geneva: International Standards Organization).
Jin, D., DePiper, G., and Hoagland, P. (2016). Applying Portfolio Management to Implement Ecosystem-Based Fishery Management (EBFM). North Am. J. Fish. Manag. 36, 652–669. doi: 10.1080/02755947.2016.1146180
Levin, P. S., Breslow, S. J., Harvey, C. J., Norman, K. C., Poe, M. R., and Williams, G. D. (in press). Conceptualization of social-ecological systems of the California current: an examination of interdisciplinary science supporting Ecosystem-based Management. Coast. Manag..
Levin, P. S., Fogarty, M. J., Murawski, S. A., and Fluharty, D. (2009). Integrated ecosystem assessments: developing the scientific basis for ecosystem-based management of the ocean. PLoS Biol. 7:e1000014. doi: 10.1371/journal.pbio.1000014
Link, J., Col, L., Guida, V., Dow, D., O'Reilly, J., Green, J., et al. (2009). Response of balanced network models to large-scale perturbation: implications for evaluating the role of small pelagics in the Gulf of Maine. Ecol. Model. 220, 351–369. doi: 10.1016/j.ecolmodel.2008.10.009
Link, J., Overholtz, W., O'Reilly, J., Green, J., Dow, D., Palka, D., et al. (2008). The Northeast U.S. continental shelf Energy Modeling and Analysis exercise (EMAX): Ecological network model development and basic ecosystem metrics. J. Mar. Syst. 74, 453–474. doi: 10.1016/j.jmarsys.2008.03.007
Link, J. S., Fulton, E. A., and Gamble, R. J. (2010). The northeast US application of ATLANTIS: a full system model exploring marine ecosystem dynamics in a living marine resource management context. Prog. Oceanogr. 87, 214–234. doi: 10.1016/j.pocean.2010.09.020
Martin-Smith, K. (2009). A risk-management framework for avoiding significant adverse impacts of bottom fishing gear on vulnerable marine ecosystems. CCAMLR Sci. 16, 177–193. Available online at: https://www.ccamlr.org/en/system/files/science_journal_papers/09martin-smith.pdf
Nye, J. A., Link, J. S., Hare, J. A., and Overholtz, W. J. (2009). Changing spatial distribution fish stocks in relation to climate and population size within the Northeast US continental shelf. Mar. Ecol. Prog. Ser. 393, 111–129. doi: 10.3354/meps08220
Olsen, E., Fay, G., Gaichas, S., Gamble, R., Lucey, S., and Link, J. S. (2016). Ecosystem model skill assessment. Yes We Can! PLoS ONE 11:e0146467. doi: 10.1371/journal.pone.0146467
Orians, G., Dethier, M., Hirschman, C., Kohn, A., Patten, D., and Young, T. (eds.). (2012). Sound Indicators: A Review for the Puget Sound Partnership an Assessment of the Puget Sound Partnership's Progress in Developing the Scientific Basis for Monitoring and Assessing Progress Toward Achieving a Vibrant Puget Sound. Available online at: http://www.washacad.org/about/files/WSAS_Sound_Indicators_wv1.pdf [Accessed: January 13, 2016].
Patrick, W. S., Spencer, P., Link, J., Cope, J., Field, J., Kobayashi, D., et al. (2010). Using productivity and susceptibility indices to assess the vulnerability of United States fish stocks to overfishing. Fish. Bull. 108, 305–322. Available onine at: http://fishbull.noaa.gov/1083/patrick.pdf
Plagányi, É. E., Punt, A. E., Hillary, R., Morello, E. B., Thébaud, O., Hutton, T., et al. (2014). Multispecies fisheries management and conservation: tactical applications using models of intermediate complexity. Fish Fish. 15, 1–22. doi: 10.1111/j.1467-2979.2012.00488.x
Polovina, J. J. (1984). Model of a coral reef ecosystem I. The ECOPATH model and its application to French Frigate Shoals. Coral Reefs 3, 1–11. doi: 10.1007/BF00306135
Punt, A. E., A'mar, T., Bond, N. A., Butterworth, D. S., Moor, C. L., de, Oliveira, J. A. A. D., et al. (2014). Fisheries management under climate and environmental uncertainty: control rules and performance simulation. ICES J. Mar. Sci. J. Cons. 71, 2208–2220. doi: 10.1093/icesjms/fst057
Samhouri, J. F., and Levin, P. S. (2012). Linking land- and sea-based activities to risk in coastal ecosystems. Biol. Conserv. 145, 118–129. doi: 10.1016/j.biocon.2011.10.021
Sanchirico, J. N., Smith, M. D., and Lipton, D. W. (2008). An empirical approach to ecosystem-based fishery management. Ecol. Econ. 64, 586–596. doi: 10.1016/j.ecolecon.2007.04.006
Smith, A. D. M. (1994). “Management strategy evaluation – the light on the hill,” in Population Dynamics for Fisheries Management, ed D. A. Hancock (Perth: Australian Society for Fish Biology), 249–253.
Smith, A. D. M., Fulton, E. J., Hobday, A. J., Smith, D. C., and Shoulder, P. (2007). Scientific tools to support the practical implementation of ecosystem-based fisheries management. ICES J. Mar. Sci. 64, 633–639. doi: 10.1093/icesjms/fsm041
Somerton, D., Ianelli, J., Walsh, S., Smith, S., Godø, O. R., and Ramm, D. (1999). Incorporating experimentally derived estimates of survey trawl efficiency into the stock assessment process: a discussion. ICES J. Mar. Sci. J. Cons. 56, 299–302. doi: 10.1006/jmsc.1999.0443
Standards Australia (2012). Handbook: Managing Environmental Risk, HB 203:2012. Available online at: http://infostore.saiglobal.com/store/details.aspx?=1516912
US EPA (1998). Guidelines for Ecological Risk Assessment. EPA/630/R-95/002F. U.S. Environmental Protection Agency, Washington DC. Federal Register 63(93):26846-26924. Available online at: http://www.epa.gov/raf/publications/pdfs/ECOTXTBX.PDF
Keywords: fisheries management, risk assessment, management strategy evaluation, ecosystem approach, conceptual modeling
Citation: Gaichas SK, Seagraves RJ, Coakley JM, DePiper GS, Guida VG, Hare JA, Rago PJ and Wilberg MJ (2016) A Framework for Incorporating Species, Fleet, Habitat, and Climate Interactions into Fishery Management. Front. Mar. Sci. 3:105. doi: 10.3389/fmars.2016.00105
Received: 01 March 2016; Accepted: 08 June 2016;
Published: 23 June 2016.
Edited by:
Michael Arthur St. John, DTU Aqua, National Institute of Aquatic Resources, DenmarkReviewed by:
Katrine Soma, Wageningen UR, NetherlandsSebastian Villasante, Universidad de Santiago de Compostela - USC, Spain
Copyright © 2016 Gaichas, Seagraves, Coakley, DePiper, Guida, Hare, Rago and Wilberg. This is an open-access article distributed under the terms of the Creative Commons Attribution License (CC BY). The use, distribution or reproduction in other forums is permitted, provided the original author(s) or licensor are credited and that the original publication in this journal is cited, in accordance with accepted academic practice. No use, distribution or reproduction is permitted which does not comply with these terms.
*Correspondence: Sarah K. Gaichas, sarah.gaichas@noaa.gov