Identifying the Sources and Sinks of CDOM/FDOM across the Mauritanian Shelf and Their Potential Role in the Decomposition of Superoxide ()
 Maija I. Heller
 Kathrin Wuttig
 Peter L. Croot
- 1Marine Biogeochemistry, GEOMAR Helmholtz Centre for Ocean Research Kiel, Kiel, Germany
- 2Department of Ocean Sciences, University of California, Santa Cruz, Santa Cruz, CA, USA
- 3Antarctic Climate and Ecosystems Cooperative Research Centre, University of Tasmania, Hobart, TAS, Australia
- 4Earth and Ocean Sciences, School of Natural Sciences, National University of Ireland Galway, Galway, Ireland
Superoxide () is a short lived reactive oxygen species (ROS) formed in seawater by photochemical or biological sources, it is important in the redox cycling of trace elements and organic matter in the ocean. The photoproduction of is now thought to involve reactions between O2 and reactive reducing (radical) intermediates formed from dissolved organic matter (DOM) via intramolecular reactions between excited singlet state donors and ground-state acceptors (Zhang et al., 2012). In seawater the main pathways identified for the decomposition of into H2O2 and O2, involve reactions with Cu, Mn, and DOM. In productive regions of the ocean, the reaction between DOM and can be a significant sink for . Thus, DOM is a key component of both the formation and decomposition of and formation of H2O2. In the present work we examined the relationships between decay rates and parameters associated with chromophoric dissolved organic matter (CDOM) and fluorescent dissolved organic matter (FDOM) by using the thermal source SOTS-1. Filtered samples (0.2 μm) were run both in the presence, and absence, of the metal chelator diethylenetriaminepentaacetic acid (DTPA) to determine the contribution from DOM. Samples were collected along a transect across the continental shelf of the Mauritanian continental shelf during a period of upwelling. In this region we found that reactions with DOM, are a significant sink for in the Mauritanian Upwelling, constituting on average 58 ± 13% of the loss rates. Superoxide reactivity with organic matter showed no clear correlation with bulk CDOM or FDOM properties (as assessed by PARAFAC analysis) suggesting that future work should concentrate at the functional group level to clearly elucidate which molecular species are involved as bulk properties represent a wide spread of chemical moieties with different reactivities. Analysis of FDOM parameters indicates that many of the markers used previously for terrestrial sources of DOM and FDOM are called into question as marine sources exist. In particular recent work (Rico et al., 2013) indicates that algal species may also produce syringic, vanillic, and cinnamic acids, which had previously been ascribed solely to terrestrial vegetation.
Introduction
Reactive Oxygen Species in Seawater—Superoxide () and Peroxide (H2O2)
Superoxide () is an important transient reactive oxygen species (ROS) in the ocean formed as a reactive intermediate in photosynthesis and respiration and with this the conversion of oxygen (O2) into water and vice versa. is a highly reactive and the short-lived radical anion can be produced both via photochemical (Micinski et al., 1993) and biological processes in the ocean (Diaz et al., 2013; Roe et al., 2016). and H2O2 are directly involved in degradation of organic pollutants and photobleaching of CDOM (Scully et al., 2003; Chen et al., 2009), cause oxidative stress in aquatic organisms and alter the redox cycling of trace metals like Fe, Cu, and Mn (Moffett and Zika, 1987; Wuttig et al., 2013b). In earlier work, where we examined the decomposition rate of throughout the water column in the Eastern Tropical North Atlantic (ETNA) Ocean, we found that in the surface ocean, which is in this area strongly impacted by Saharan aerosols and coastal sediment resuspension, the main decay pathways for superoxide (Figure 1) were reactions with Mn(II) and DOM (Wuttig et al., 2013a,b).
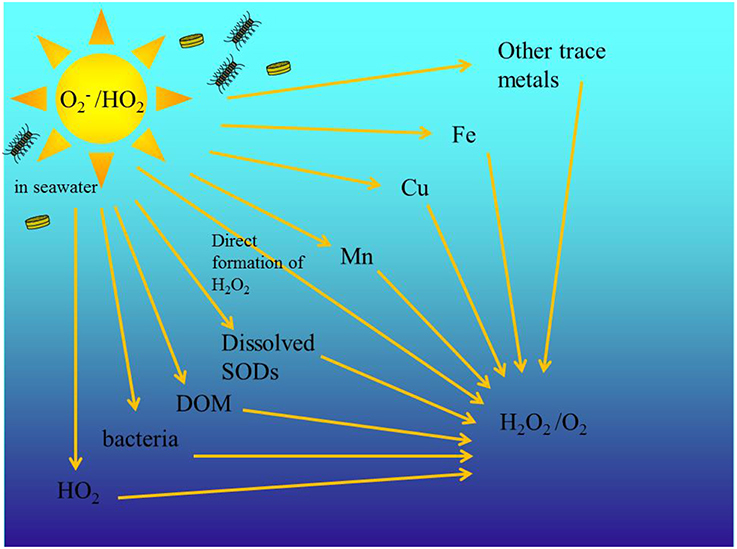
Figure 1. Schematic of the different decay pathways for decay in the ocean. is biologically and photo produced. Modified from Wuttig et al. (2013a).
Chromophoric Dissolved Organic Matter (CDOM)
DOM is a complex mix of organic molecules and is poorly described in terms of it composition. CDOM is the proportion of DOM that absorbs light and this can be characterized by its absorbance and fluorescence properties (Coble, 2007). CDOM is a ubiquitous component of the open ocean dissolved matter pool, and is important because of its influence on the optical properties of the water column, its role in photochemistry and photobiology, and its utility as a tracer of deep ocean biogeochemical processes and circulation. The general distribution of CDOM in the global ocean is controlled by a balance between production and photolysis, with vertical circulation playing an important role in the transport of CDOM to and from intermediate water masses. Fluctuations in the abundance of CDOM in the global surface ocean have been observed, indicating a potentially important role for CDOM in ocean-climate connections because of its impact on photochemistry and photobiology (Nelson and Siegel, 2013).
Pioneering work by Coble (1996) showed that the Excitation Emission Matrix (EEM) measurements of CDOM fluorescence (often referred to as FDOM) can generally be divided into two categories—humic-type or protein/amino acid-type fluorescence. Furthermore, Coble (1996) defined 5 major fluorescence regions as per the excitation/emission spectra as follows: Humics—peak A (λex/λem ~260/380–460 nm), Peak C (λex/λem ~350/420–480 nm), peak M (λex/λem ~312/380–420 nm); Proteins—peak B (λex/λem ~275/310 nm) and peak T (λex/λem ~275/340 nm). More recently EEM has been combined with parallel factor (PARAFAC) data analysis (Stedmon and Bro, 2008) to independently determine multiple components of the CDOM pool–many, but not all, of which are related to the peaks found in the original Coble analysis. Humic-like fluorescence (FDOMH: typically λex/λem ~320/420 nm) has been observed in a wide range of marine environments correlates in general well with nutrients (, ) and apparent oxygen utilization (AOU) in different water masses (Hayase and Shinozuka, 1995; Kuma et al., 1998; Yamashita et al., 2007; Yamashita and Tanoue, 2008). These correlations suggest that some of the components that make up FDOM are formed by the remineralization of settling organic particles and are destroyed or modified by irradiation. However, marine humic substances are composed of a large fraction of the uncharacterized DOM pool in the ocean (Zafiriou et al., 1984) and the relative contribution of these complex substances to seawater fluorescence is still unclear.
Role of CDOM in the Production and Decomposition of ROS in Seawater
Our understanding of how ROS species are generated in seawater by CDOM absorption of sunlight in the euphotic zone of the ocean has advanced substantially in recent years. In particular the paradigm that existed until recently, that excited triplet states of CDOM reacted with 3O2 to form and carbocations (O'Sullivan et al., 2005) has been replaced with a new mechanism in which a low-efficiency intramolecular electron transfer from an excited singlet donor (e.g., substituted phenol) to a ground-state acceptor (e.g., quinone), that produces a radical species that reacts with O2 to form and subsequently H2O2 (Zhang et al., 2012; Sharpless and Blough, 2014).
Recent work by Powers and Miller (2014) estimated using satellite climatologies, using average apparent quantum yield (AQY) spectrum determined from laboratory irradiations, found that daily H2O2 photoproduction rates (averaged over an annual cycle) were highest in equatorial regions and lowest at the poles (range: 0.07–93.2; average: 40.4; median; 39.5 nM per day). The same group in a further paper, Powers et al. (2015), also reevaluated the photoreactivity of refractory DOC by investigating the photochemical production H2O2 and , using controlled irradiations at sea and in the laboratory. They found that in the open ocean, a large fraction of photoproduced does not lead to H2O2, which means, that the relationship between these two ROS involve complex pathways. In particular, the apparent stoichiometry of formation was found to be closer to 4:1 (Powers et al., 2015) instead of the 2:1 which would be expected solely from dismutation. This may in part be explained by the photo generation of oxidized CDOM species, which can act as an electron acceptor, and react with to form O2 (Garg et al., 2011; Zhang et al., 2012). This in turn may be a significant sink for refractory DOC as it circulates through the surface ocean (Mopper et al., 1991; Stubbins et al., 2012).
It is well-known that photo-oxidation of proteins such as Tryptophan produces and subsequently H2O2 (Mccormick and Thomason, 1978), reactions with other photo-produced reactive oxygen species (ROS) (e.g., 1O2 and OH) may also be important pathways for the destruction of proteins, and hence the loss of protein-like fluorescence, in the ocean (Boreen et al., 2008). Similarly the loss of FDOM in surface waters is often ascribed to photo-bleaching which may be due to reactions with (Omori et al., 2011). Thus, quantitative information on the production, sinks, and concentrations of and H2O2 in the open ocean is fundamental to fully understand their role in global biogeochemical cycles (Powers and Miller, 2014).
Study Region—Mauritanian Upwelling
In the present work we focus on the Mauritanian upwelling system which stretches from the Iberian Peninsula to about 10°N along the Northwest African coast. The Mauritanian upwelling is one of the main Eastern Boundary Upwelling Systems (EBUS), where nutrient rich waters are upwelled by the trade winds to fuel one of the most biologically productive regions in the global ocean (Messié and Chavez, 2015). Due to changes in wind forcing the coastal upwelling off Mauritania exhibits a pronounced seasonal cycle and the Mauritanian upwelling is the most productive branch of the Canary Current upwelling system (Tanhua and Liu, 2015). Upwelling between 20° N and 25° N is persistent throughout the year (Schafstall et al., 2010). In contrast, upwelling north and south of this area is strongly seasonal due to wind forcing associated with the migration of the ITCZ (Tomczak and Godfrey, 1994). Vertical mixing induced by bottom turbulence is also an important transport process for supplying nutrients to the euphotic zone (Schafstall et al., 2010). Primary production is high year-round (80–200 mmol m−2 d−1 of C) and elevated beyond the shelf break (Huntsman and Barber, 1977).
The seasonality in the upwelling strength also impacts phytoplankton dynamics of the Senegal-Mauritanian upwelling region (Farikou et al., 2015), as a seasonal cycle is observed beginning with the onset of the upwelling (December–February), mainly nanoeukaryote type phytoplankton are found in the coastal area; while in April–May, the period corresponding to the maximum chlorophyll a concentration, the nanoeukaryotes were replaced by diatoms.
The Oxygen Minimum Zone (OMZ) in the ETNA appears to be undergoing a significant water column deoxygenation of 0.5 μmol kg−1 yr−1 (Stramma et al., 2009).
Aims and Objectives of the Present Study
Our main aim in this study was to assess the role of DOM in the decomposition of along a transect across the continental shelf in the Mauritanian upwelling region by comparing decay rates to bulk CDOM and FDOM properties. A further objective was to identify CDOM or FDOM parameters that may indicate what type of organic material is responsible for the production or decomposition of in the ocean. The final objective was to examine the influence of primary production, photobleaching, and microbial activity on CDOM and FDOM properties in an upwelling region devoid of riverine input.
Materials and Methods
In order to prevent trace metal contamination all laboratory work was performed at sea in a trace metal clean chemistry laboratory under ISO Class 5 conditions using a specially designed containerized clean room (Clean Modules UK). All chemicals that were used in this study were of ultrapure grade unless noted. Ultrapure (UP) water (resistivity > 18.2 MΩ cm−1) was obtained in the laboratory and in the ship going clean container via a Millipore Synergy 185 system that was fed by an Elix-3 (Millipore) reverse osmosis system connected to the mains supply. Pipettes (Finnpipette) were calibrated monthly and trace metal clean pipette tips (Rainin RT-250, RT-1000, and Finntip 10) were used as supplied. An inoLab pH 720 (WTW) was used to determine pH values on the NBS scale (pHNBS). All plasticware and bottles (low density high polyethylene (LDPE) and Polytetrafluoroethylene (PTFE)) were extensively cleaned according to the GEOTRACES trace metal clean protocols (Cutter et al., 2010).
Seawater Sampling
Seawater samples were collected using Go-Flo sampling bottles deployed on a Kevlar line at 5 stations (Figure 2) occupied during the RV Maria S. Merian expedition MSM17/4 from March 13 to April 5 2011 (boreal spring, upwelling season). The E-W transect along 18°N across the shelf/slope at the Mauritanian upwelling region covered a distance of 50 km where water depth increases from ~50 to ~1100 m (please See Table S1 for the details on all of the stations occupied and samples taken).
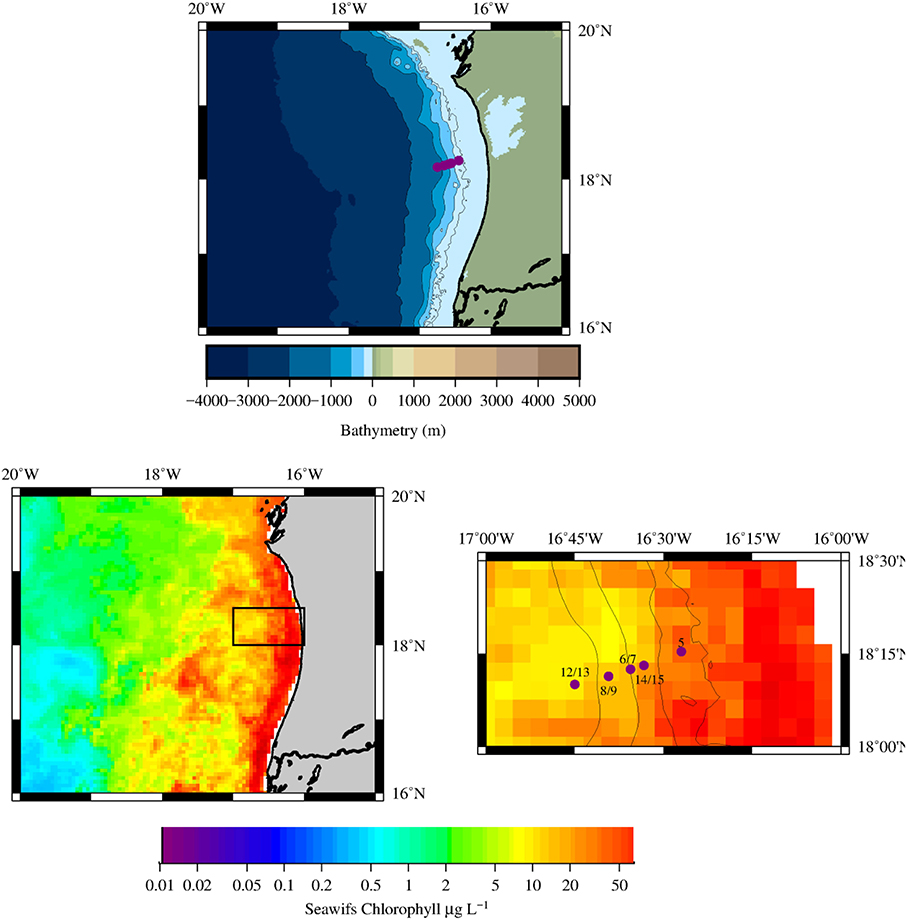
Figure 2. (Top) Bathymetry of the Mauritanian upwelling region, the 5 stations occupied are shown as purple circles, note the presence of the Banc d'Arguin along the Mauritanian coast (bottom left) Chlorophyll composite map derived from MODIS-AQUA images for March 2011. The black box indicates the location of the main study region (bottom right) Composite image (bathymetry and satellite chlorophyll) of the study region with the location of the 5 main stations sampled in this work (purple circles).
Hydrography and Nutrients
Hydrographical data was obtained using a Seabird Conductivity-Temperature-Depth (CTD) rosette system. This system consisted of a SBE911plus CTD system in combination with a carousel water sampler SBE32 with 24 12-L bottles. The CTD system was equipped with a CT sensor pair, two O2 sensors (SBE43 SN871 and SBE43 SN950 -calibrated by comparison to Winkler O2 titrations), a turbidity sensor and a chlorophyll sensor (chlorophyll a fluorescence—calibrated according to the manufacturers protocols). CDOM and FDOM samples were obtained from Go-Flo bottles and Niskins on the CTD system. Samples for dissolved macro nutrients were subsampled from the Go-Flo bottles and either analyzed onboard for low level (nM) concentrations of nitrite (N) and ammonium () using photometric (Grasshoff et al., 1999) or fluorometric method (Holmes et al., 1999), respectively. Samples for silica (H4SiO4), phosphate () and nitrate (N) were frozen, transported back to Germany for analysis in the Nutrient laboratory of the MPI-Bremen (Grasshoff et al., 1999).
Satellite Data
Satellite chlorophyll-a data was obtained from OBPG MODIS-Aqua Monthly Global 9-km Products via GIOVANNI (http://giovanni.gsfc.nasa.gov/giovanni/) using the Ocean Color Time-Series Online Visualization and Analysis platform. Analyses and visualizations used in this paper were produced with the Giovanni online data system, developed and maintained by the NASA Goddard Earth Sciences (GES) Data and Information Services Center (DISC). All satellite images were finally displayed as postscript images using the Generic Mapping Tools (GMT) software (Wessel and Smith, 1998).
CDOM Absorbance and Fluorescence
CDOM Absorbance
CDOM absorbance measurements were performed using a liquid waveguide capillary cell (LWCC) (LWCC-2100 World Precision Instruments, Sarasota, FL, USA) and an Ocean Optics USB4000 UV-VIS spectrophotometer in conjunction with an Ocean Optics DT-MINI-2-GS light source. Samples were filtered through an 0.2 μm syringe filter (Sarstedt) using a 10 mL Telfon syringe (Savillex), the first ~10 mL were discarded and the absorbance of the afterwards filtered solution then measured by direct injection into the LWCC. Absorbance measurements were made relative to UP and corrected for the refractive index of seawater based on the procedure outlined in Nelson et al. (2007). The resulting dimensionless optical density spectra were converted to absorption coefficient (m−1): aCDOM(λ) = 2.303 Aλ/l, where 2.303 converts decadal logarithmic absorbance to base e, and l is the effective optical pathlength of the waveguide (here 100.3 ± 0.5 cm as determined by the manufacturer). In the present work we measured CDOM absorbance over the wavelength (λ) range 280–800 nm.
The spectral slope parameter (Helms et al., 2008), S, was calculated over a range of 275–295 nm (S275–295) and 350–400 nm (S350–400) using a non-linear least squares fitting procedure in Matlab. S275–295 is commonly used as a proxy for molecular weight with increasing values indicating decreasing molecular weight and aromaticity (Helms et al., 2008). Similarly the E2:E3 ratio, also used to track changes in the relative size of CDOM, was calculated as the ratio of CDOM absorption at 250 to 365 nm (De Haan and De Boer, 1987).
CDOM Fluorescence—Excitation Emission Matrix
Samples for CDOM fluorescence measurements were syringe filtered through 0.2 μm filters (Sarstedt) as described above for the absorbance measurements. Humic-type fluorescence measurements were performed with a Cary Eclipse Fluorometer using a 1 cm quartz cell. Measurements of FDOMH (Tani et al., 2003) were performed by analysis of samples using excitation at 320 nm and emission at 420 nm (10 nm slit widths). Each sample was also analyzed as Excitation Emission Matrix (EEM) on the Cary Eclipse Fluorometer using the same 1 cm quartz cell as for the FDOMH measurements. For the EEM analysis, excitation wavelengths were scanned (12000 nm/min) from 250 to 500 nm (5 nm slit width and 5 nm increments) and emission wavelengths (5 nm slit width and 5 nm increments) from 280 to 600 nm, the photon multiplier tube (PMT) voltage was set at 700 V (maximum) and the response time 0.08 s. Day to day variation in the instrument was monitored by daily measurements of the Raman scattering of UP water (excitation 350 nm; Stedmon et al., 2003; Heller et al., 2013) and the use of a standard of quinine sulfate (1 ppm in 0.05 N H2SO4) which was also diluted to form a calibration series for quinine fluorescence (QSU) and run daily (Mopper and Schultz, 1993).
Post-processing of the complete EEM data set (Go-Flo and Niskin bottles) was performed according to accepted protocols (Lawaetz and Stedmon, 2009; Murphy et al., 2010) in the following sequence: (i) correction of instrument bias using the correction files provided by the manufacturer, (ii) subtraction of the EEM of UP water, and finally, (iii) the fluorescence intensity was normalized to the area under the UP water Raman peak (excitation 350 nm) run with each sample batch. Note as the sample absorbance was low, no correction was made for the internal absorption of the samples.
PARAFAC Analysis of 3D Excitation Emission Matrix (EEM)
The normalized EEMs were analyzed by PARAFAC in MATLAB under application of the DOMFluor toolbox (Stedmon and Bro, 2008) using models constrained to non-negative values. Outlier identification was performed using the outlier test function provided with the DOMFluor toolbox. No samples with extreme leverage were found, indicating no extreme, and potentially outlying, EEMs in the dataset. Determination of the most suitable number of components was achieved by the split-half analysis and random initialization where by both halves were successfully validated. No systematic residual was found in the modeled EEMs.
Determination of H2O2
Samples for H2O2 were analyzed directly using a flow injection chemiluminescence (FIA-CL) reagent injection method (Yuan and Shiller, 1999) as described previously (Croot et al., 2004). Samples were analyzed using 5 replicates: typical precision was 2–3% through the concentration range 0.5–100 nM, the detection limit (3 s) is typically 0.2 nM.
Determination of Decay Rates
Experimental Design
In the present study we employed the thermal source SOTS-1 [di(4-carboxybenzyl) hyponitrite—molecular weight 330.3 gmol−1; Ingold et al., 1997] as described by us previously (Heller and Croot, 2010a). SOTS-1 has some advantages over KO2 and other currently used methods which generate at μM concentrations as it produces slowly and continuously over a longer duration to be able to mimic the in vivo situation and additionally there is little or no H2O2 formed upon introduction to the sample. It also avoids the problem of adding the chelator DTPA, in order to complex metals, prior to irradiating ketone solutions to produce (Mcdowell et al., 1983), as photodegradation products of DTPA will be formed and cause problems with calibration and speciation analysis (Heller and Croot, 2011).
The decomposition rate of SOTS-1 is well-described in seawater and was shown to follow a first order decay with a 40 mol% yield of (Ingold et al., 1997).
500 μg aliquots of SOTS-1 were used as received (Cayman Chemicals) and stored at −80°C until use. Immediately prior to the start of any experiment a primary stock of SOTS-1 was prepared by the dissolution of the 500 μg SOTS-1 aliquots in DMSO (Fluka, puriss p.a.=99.9%) before further dilution in seawater. Final starting concentrations for SOTS-1 ([SOTS-1]0) at the beginning of each experiment in this study were between 0.86 and 1.78 μM (Table S2). Experiments were performed in Teflon bottles (Nalgene) which were either left unamended or had DTPA, Cu (0.79, 1.58 nM), Mn (1.00, 2.00 nM), or Fe (0.90, 1.79 nM) added. All samples were equilibrated for at least 12 h before the experiment was initiated by the addition of a specific amount of SOTS-1 from the primary standard to a known volume of seawater. All reagents and samples were kept at a constant temperature (21.5 ± 0.2°C) throughout the course of the experiment in the temperature controlled class 100 clean laboratory. Only the unamended and DTPA results are reported in the present work, the results from the trace metal additions will be reported elsewhere.
Determination of Concentrations using MCLA Chemiluminescence
The most widely used approach to measuring in seawater (Rose et al., 2008; Heller and Croot, 2010a) is via the use of the chemiluminescence probe Cypridina luciferin analog [[2-methyl-6- (4-methoxyphenyl)-3,7-dihydroimidazo[1,2-a]pyrazin-3-one, HCl]] (MCLA) (Fluka) (Nakano et al., 1986). In the present work we used the same method as we had used previously (Heller and Croot, 2010a,c). A brief description follows; MCLA was used as received, a primary 1 mM MCLA standard was prepared by dissolving 10 mg MCLA in 34.5 mL MQ water, where upon 1 mL aliquots of this solution were then pipetted into 2 mL polyethylene vials and frozen at −80°C until required for use. The working MCLA standard, 1 μM, was prepared from a thawed vial of the primary stock by dilution into a 1 L solution of 0.05 M Sodium acetate (Sigma Ultra) buffered (4.1 g) in MQ water adjusted to pHNBS 6. Several time points between 0 and 23 h were taken from the experimental solutions as described above, and were drawn directly into the flow cell of the chemiluminescence detector as described before (Heller and Croot, 2010c). The sensitivity of the MCLA method is very strongly temperature dependent and for this reason all samples and reagents were kept at constant temperature (21.5 ± 0.2°C) throughout the course of the experiments.
Analysis of Decay Using SOTS-1 as Source
In this work the rate of the superoxide reaction with unamended seawater is reported as kSW while that of the DTPA amended is listed as kDTPA. It is assumed that the rate of reaction with organic matter is equal to the reaction in the presence of DTPA, i.e., korg = kDTPA. Other assumptions include:
(i) That the response of the system is overall first order with respect to
(ii) That all the metal species are made inert by complexation with DTPA, leaving only reactions with organic species and the uncatalysed self dismutation reaction as the pathways for decay.
(iii) That the 2nd order self-dismutation reaction is significantly small that it can be ignored. In the present case this a reasonable assumption as this reaction is well-described in seawater as a function of pH (Zafiriou, 1990; Heller and Croot, 2010c) and the nM to pM levels of generated using μM concentrations of SOTS-1 indicates that results in a pseudo first order reaction on the order of 1 × 10⁻⁴ s−1 or less.
The analysis of the time dependent concentration of generated in seawater samples due to the additions of SOTS-1 was performed as previously described (Heller and Croot, 2010a). Briefly raw photon counts are firstly corrected for the signal blank due to MCLA auto-oxidation and then converted to a concentration of by applying the calculated sensitivity factor previously determined by calibration of a seawater sample with additions of KO2.
The rate equation derived for the formation of from SOTS-1 previously (Heller and Croot, 2010a) is shown below:
where t is the time since the introduction of the SOTS-1, k is the rate of thermal decomposition of SOTS-1, [SOTS]0 is the initial concentration of SOTS-1 and kobs is the observed 1st order loss rate of . If the initial concentration of is zero (a reasonable assumption when the seawater is filtered and kept in the dark), then Equation 1 has the exact solution (Harcourt and Esson, 1866):
When kobs >> k, as would be expected under most circumstances in seawater, Equation 2 reduces to:
Taking the natural logarithm of both sides then gives:
Thus, in this case a plot of ln[]i vs. time will have a slope of k, the thermal decomposition rate of SOTS-1. Note that the value of kobs can also be determined here from the value of the intercept as the value for [SOTS]0 is known. Rearranging Equation 3 gives the following:
Operationally the determination of kobs is optimal once the maximum value of []i is reached:
Typically it takes 10 min to reach the maximum []i at 25° C if kobs = 0.01 s−1. Thus, in the present case we used data collected after 30 min and up to 23 h since the initiation of the experiment to determine kobs.
Results
Hydrography and Nutrients
During the month of April, 2011 there was weak but persistent upwelling across the Mauritanian shelf with high concentrations of chlorophyll extending out into the Atlantic Ocean (Figure 2). Vertical profiles of chlorophyll fluorescence (Figure 3) indicated highest surface concentrations in offshore waters with lower levels inshore, indicating that satellite estimates of chlorophyll in these type 2 waters are currently overestimated, presumably by a combination of Saharan dust, suspended sediment, and CDOM. Transmission data (not shown) indicated that there was a considerable bottom nepheloid layer present across the shelf and shelf edge this was consistent with earlier microstructure measurements taken in the same region (Schafstall et al., 2010). The core of the OMZ of the ETNA was found in offshore waters between 300 and 600 m depth, as observed previously (Stramma et al., 2009) and was still present at this depth upon encountering the continental shelf. Shelf waters were still oxygenated however with a strong vertical gradient present between surface and depth.
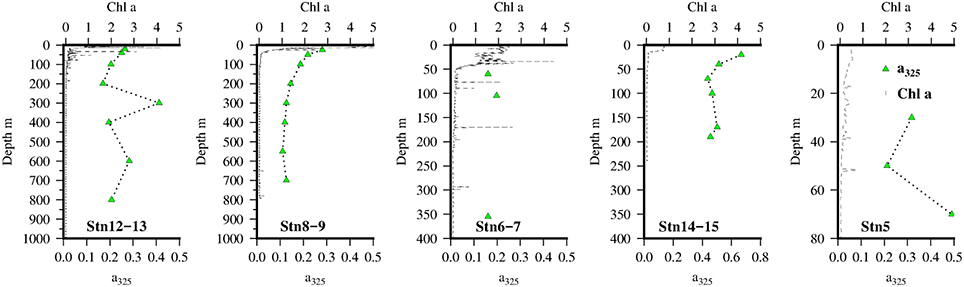
Figure 3. Vertical distribution of chlorophyll a (black line)and a325 (green triangles) at the 5 Go-Flo stations along the transect in the Mauritanian Upwelling.
CDOM Absorbance
Vertical profiles of CDOM absorbance, a325, at the 5 GO-FLO stations are shown in Figure 3. Highest values of a325 were found near the shelf break (Stn 14–15) and decreased offshore.
Values of E2:E3 (Figure 4) were ~6 at stations on the shelf and in surface waters off the shelf. At stations 8–9 there was a monotonic increase in E2:E3 with depth which may have been caused by strong mixing at depth across the shelf as evidenced by the transmission profiles (not shown). Thus, it is likely that material from the sediments with a higher E2:E3 (~9) was being resuspended and mixed through the water column in the vicinity of the shelf break (Stns 8–9 and 6–7). There is limited data for E2:E3 values of marine porewaters but what data there is suggests that values increase with sediment depth (Dang et al., 2014), though it is likely that this is dependent on the rate of carbon and O2 supply. As an increase in E2:E3 is thought to reflect a shift toward lower molecular weight compounds this may also represent diffusion of such material from the shelf sediments.
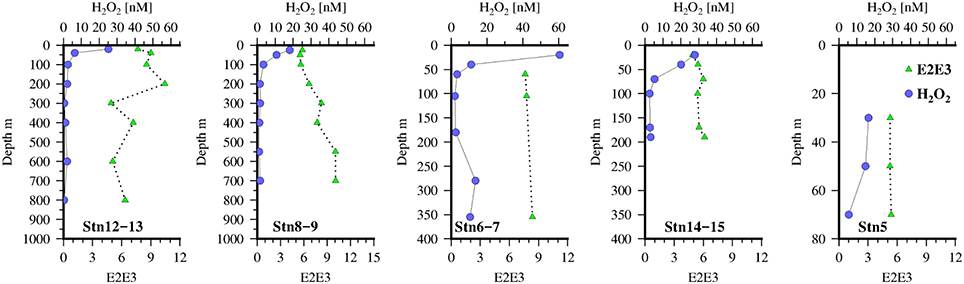
Figure 4. Vertical distribution of H2O2(blue circles) and E2:E3 (green triangles) at the 5 Go-Flo stations along the transect in the Mauritanian Upwelling.
PARAFAC Analysis and FDOMH
PARAFAC analysis of our complete 3D EEM FDOM data set identified 3 independent components (Table 1; Table S3 and Figures 5, 6). The calculated excitation and emission spectra for each of the 3 components is shown in Figure S1. Component C1 was similar to a marine fulvic (M-peak), λex/λem = 240/412 and 320/412. Component C2 had elements that were similar to both classical terrestrial humics (A and C-peaks), λex/λem = 240/412 and 320/412. Lastly component C3 was similar to the Tryptophan-like T-peak, λex/λem = 280/330. In the present case it was not clear if the data was of sufficient resolution for PARAFAC to separate out more components, other approaches which assume the presence of specific chromophores may be able to resolve this better but would be reliant on assumptions made regarding the presence of specific chromophores in solution. Direct measurements of humic fluorescence (not shown) or FDOMH (λex/λem = 320/420) correlated [Spearman's rho, calculated using corr function in Matlab (Mathworks)] most strongly with C1 (ρ = 0.59, n = 252, p < 0.001) but also had weaker correlations with C2 (ρ = 0.21, n = 251, p < 0.001) and C3 (r = 0.41, n = 251, p < 0.001) (Tables 1 and S3, Figures 5, 6). This differed from our earlier work (Heller et al., 2013) where only one of the components identified by PARAFAC was strongly correlated to FDOMH.
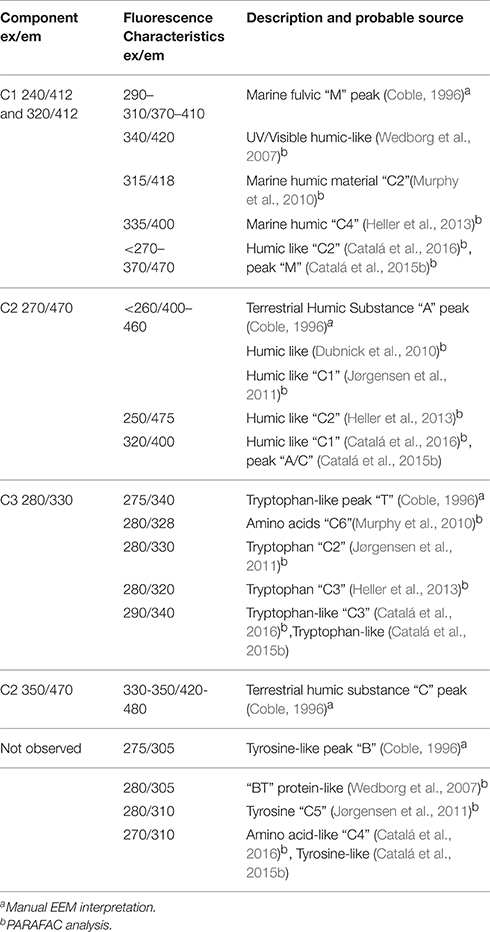
Table 1. PARAFAC analysis and identification of fluorophores.
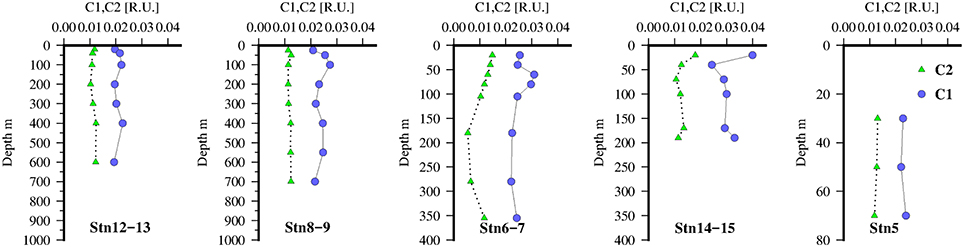
Figure 5. FDOM humic-like components identified by PARAFAC, C1(green triangles), and C2(blue circles) at 5 stations along the transect in the Mauritanian Upwelling.
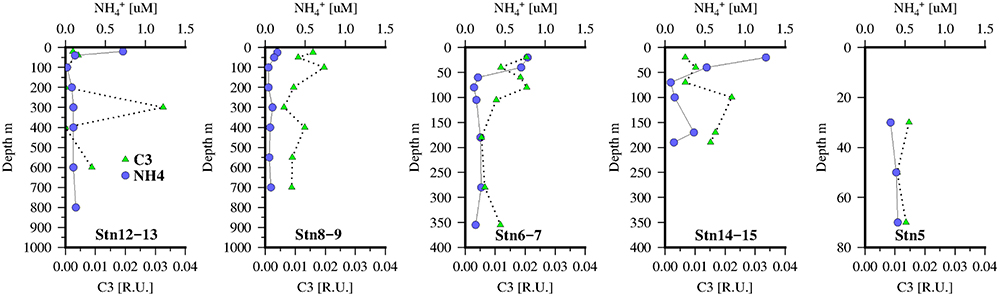
Figure 6. concentrations (blue circles) and protein-like FDOM component identified by PARAFAC, C3 (green triangles) at 5 stations along the transect in the Mauritanian Upwelling.
The vertical distribution of C1 and C2 at the Go-Flo stations are shown in Figure 5. Profiles of C1 were relatively constant throughout the water column (~0.02 R.U.), the only noticeable feature is small positive excursions below the chlorophyll maxima (Figure 3) at the 3 stations offshore and suggests a relationship to zooplankton grazing or microbial remineralization of sinking particles. At stations near the shelf break, C1 was slightly elevated in surface waters, in contrast with open ocean profiles (Heller et al., 2013) of FDOMH in open ocean tropical waters which typically exhibit a strong photobleaching effect with a minimum in the surface. This suggests that the productive waters in the upwelling region were a stronger source of C1, FDOMH to surface waters than photobleaching was a sink. At the offshore stations, and on the shelf, C2 was low and almost constant (~0.01 R.U.) throughout the water column with only a slight enrichment in surface waters close to the shelf break.
The distribution of the tryptophan-like component, C3 (Figure 6), also showed some similarities to C2 with local maximum below the chlorophyll maxima and suggestive also of links to zooplankton or microbial activity. Although comparison with (Figure 6), as a tracer of zooplankton activity, reveals that concentrations are higher in the mixed layer and not coincident with the C3 maxima. However, as is also taken up by phytoplankton/bacteria this approach may be too simplistic. Dissolved O2 concentrations were also weakly correlated with C2 (ρ = 0.36, n = 251, p < 0.001) and C3 (ρ = 0.45, n = 251, p < 0.001).
H2O2 Distribution
H2O2 concentrations (Figure 4) were as expected high in the sunlit surface waters with low background levels in the aphotic zone. Overall surface waters were low in H2O2 compared to other open ocean sites in the Tropical North Atlantic not impacted by the ITCZ (Croot et al., 2004), though they were similar to observations near Cape Verde (Heller and Croot, 2010b). Most likely the lower surface concentrations observed here is reflecting strong consumption of H2O2 by the phytoplankton growing in the upwelling waters. On the shelf edge (stations 6–7) there were slightly enhanced levels of H2O2 in the bottom waters possibly indicating a sedimentary source, coincident with elevated levels of C1 and C3 also seen at this station. As pore water measurements from sediments along the same transect, taken on the same expedition, indicated that surface sediments were always oxic and that only on the shelf itself did sediments accumulate H2S at depth (Dale et al., 2014). Thus, it is unlikely that these sediments are a source of H2O2 from the oxidation of Fe(II) released from the sediments, and it is more likely resulting from bacterial respiration of particulate carbon that has sunk to the sediments from the overlying productive waters.
Decay Rates Using SOTS-1 as Source
Rates of decomposition (Table 2; Table S4) as determined using SOTS-1 as a thermal source for are shown in Figure 7 for seawater with DTPA (kDTPA) and unamended (kSW). Values of kDTPA and kSW were comparable to most other recent studies in Tropical waters (Table 2). Over the entire transect the reaction between and DOM was a major pathway ranging from 28 to 80% of the overall loss rate (kDTPA∕kSW) with an average of 58 ± 13 (1 sd) %. This is slightly more than what was observed further to the south of the present study area (Wuttig et al., 2013a) and in strong contrast to the Southern Ocean where the organic pathway was found to be only minor (Heller and Croot, 2010c). There was no significant correlation (ρ < 0.1, n = 36) between either kDTPA or kSW with the 3 components identified by PARAFAC or FDOMH. A significant correlation was however found between kDTPA and S350–400 (ρ = 0.58, n = 36, p < 0.002), with a weaker correlation between kSW and S350–400 (ρ = 0.44, n = 36, p < 0.02).
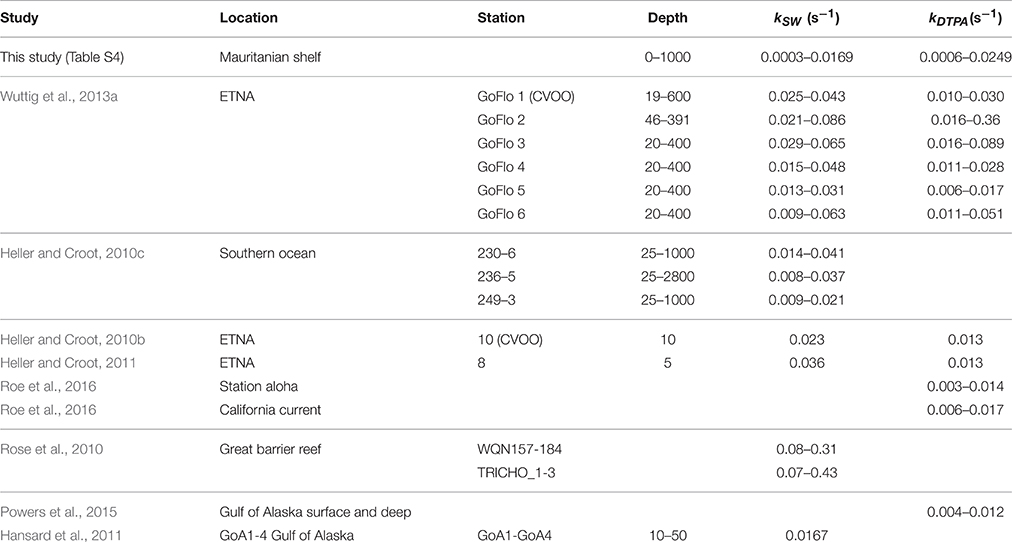
Table 2. Compilation of rates (with and without DTPA) for the decay of in seawater during this work and from other studies.
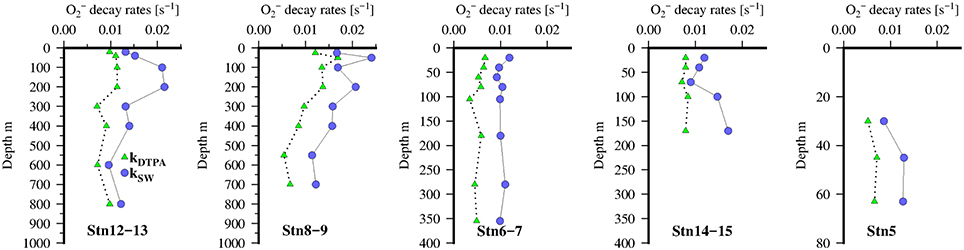
Figure 7. Vertical distribution of decomposition rates kDTPA (green triangles) and kSW (blue circles) at 5 stations along the transect in the Mauritanian Upwelling.
Discussion
CDOM Absorbance Along the Transect across the Mauritanian Upwelling
CDOM Absorbance in EBUS
There have been a few other studies of CDOM in EBUS (Kudela et al., 2006; Day and Faloona, 2009) and the North Atlantic (Kitidis et al., 2006; Nelson et al., 2007; Nelson and Siegel, 2013). In the Californian system, CDOM absorbance a325 was found to be lowest in recently upwelled waters (Day and Faloona, 2009) with the implication that it was derived from primary production and not from sediment resuspension. In a related study (Kudela et al., 2006), CDOM was found to exhibit seasonal patterns in the spectral slope (S350–600) related to both the strength of the upwelling and to the input of rivers to this region.
Sources of CDOM to the Mauritanian Upwelling
The main source of CDOM to our study region appears to be from new production by phytoplankton as evidenced by increases in a325 (Figure 3) coincident with the euphotic zone. However, there were also a potential source from the sediment as seen in the E2:E3 data (Figure 4) at the shelf break, which the increase in E2:E3 suggested an input of lower molecular weight CDOM. A high E2:E3 source from pore waters or sediments has not been described before to our knowledge and without pore water measurements to constrain these values we hesitate to assign them to any particular biogeochemical process. The E2:E3 values found in the present study were similar to that found in surface marine waters off the Portuguese coast (Santos et al., 2014), where a significant negative correlation was found between E2:E3 and β-GlCase activity tentatively suggesting that decreases in E2:E3 are associated with increases in microbial activity. Photobleaching has been shown to increase E2:E3 (Helms et al., 2008) and while this process was clearly occurring in surface waters it was apparently not fast enough to change the phytoplankton or microbial signal observed.
A recent study in the waters of the equatorial upwelling region of the Atlantic (Andrew et al., 2013) showed several lines of evidence that the CDOM found in surface waters there was derived from terrestrial components. They suggested that changes in the optical properties of CDOM associated with increases in AOU (Yamashita and Tanoue, 2008, 2009; Swan et al., 2009; Nelson et al., 2010; Yamashita et al., 2010) could be associated with redox changes in existing terrestrial material. A recent work (Aparicio et al., 2015) made a direct test of the hypothesis put forward by Andrew et al. (2013), by incubating microbial communities with a suite of organic compounds (glucose and acetate) and with or without humic matter. They found that new FDOMH was produced particularly when humic precursors were added, thus in accordance with the hypothesis. The results of Aparicio et al. (2015) also supported the hypothesis of Jørgensen et al. (2014) in which the less labile the precursor material is, the more humic fluorescence is generated.
The hypothesis of Andrew et al. is partly based on evidence from ultra-resolution mass spectral data for the presence of terrestrial lignins in seawater (Opsahl and Benner, 1997; Kujawinski et al., 2009). However, recent data was published that indicated that some of the lignin precursor compounds or breakdown products (including the Vanillyl, Syringyl, and Cinnamyl phenols) were exuded by diatom cultures under optimal growth and different metal stress conditions (Rico et al., 2013; López et al., 2015; Rubino, 2015). Now it could be argued that the diatoms, or bacteria associated with them, were simply degrading existing lignin structures in seawater, however it is well-established that many marine organisms contain or synthesize polyphenols (Vreeland et al., 1998; Rico et al., 2013; Gómez et al., 2016) so there is a strong possibility that some of this material is exuded or released by grazing zooplankton or viral lysis.
Potential for ROS Production from CDOM
Recently there have been a number of studies that have examined the relationship between CDOM properties and ROS production in natural waters (Dalrymple et al., 2010; Peterson et al., 2012; Zhang et al., 2012; Powers and Miller, 2014). Dalrymple et al. (2010) in a laboratory study with freshwater humic substances observed that quantum yields for 1O2 (Φ1O2)increased with increasing E2:E3 values, however quantum yields for H2O2 (ΦH2O2) decreased with increasing E2:E3. These authors suggested that this inverse relationship between Φ1O2 and ΦH2O2 was due to competitive formation of the 1O2 and H2O2 precursors. Sharpless and Blough (2014) further suggested that the inverse correlation of E2:E3 with ΦH2O2 could be related to enhanced rates of CDOM radical formation due to higher levels of aromatic donors.
In the present study we were only able to measure a “snap shot” of the H2O2 concentration (Figure 4) and so have no production rates, though earlier work (M68-3) we performed in the same region over diel cycles suggested a strong gradient in H2O2 production from inshore to offshore (unpublished data). Near surface values of E2:E3 (Figure 4) are relatively constant (~6) perhaps indicating new production dominated over photobleaching (Helms et al., 2008) at this time. It was likely then that H2O2 concentrations and inventories in near surface waters were determined more by loss rates than production, as an earlier study offshore of this region found higher H2O2 surface concentrations in low chlorophyll waters (Steigenberger and Croot, 2008), thus presumably the high phytoplankton and bacterial abundances in the near sure waters resulted in lower H2O2 due to the presence of cellular peroxidases.
FDOM Distribution: Sources and Sinks in the Mauritanian Upwelling
Recent Advances in Our Understanding of FDOM
Two recent contributions to this field have helped make significant advances, firstly in a recent review article, Sharpless and Blough (2014) showed that fluorescence spectra of natural water samples were not simply a superposition of individual chromophores and instead they suggested it could be explained using a physical model incorporating charge transfer interactions between electron donating and accepting chromophores within the CDOM. In this context then the identification of specific individual chromophores from a seawater sample is highly unlikely but broad conclusions about the functional groups might be gathered. In this regard another recent advance was provided by Wünsch et al. (2015) who compared quantum yields and fluorescence properties of chromophores identified as being potential components of CDOM and compared them to 3D EEM and PARAFAC data held in the OpenFluor database (Murphy et al., 2014).
PARAFAC Identification of FDOM Components
In the present work we identified 3 FDOM components (Table 1) that were related to the traditional M (C1), A and C (C2) and T (C3) peaks. Our PARAFAC results are similar to those found in other recent studies (Table 1). In particular, a series of paper published by Catalá et al. (2015a,b, 2016) examined the FDOM data gathered during the Spanish Malaspina circumnavigation of the globe. This work builds on an earlier study by Jørgensen et al. (2011) that used data collected during the Danish Galathea circumnavigation. In the global data set acquired by Catalá et al. they identified 4 FDOM species by PARAFAC (denoted here using the subscript M and their original designation), 2 humic like MC1 related to peaks A and C and MC2 associated with peak M) and 2 protein-like fluorophores (MC3 Tryptophan −T, MC4 Tyrosine −B). They were able to estimate an overall turnover time in the deep ocean, for the different peaks MC1 (A/C) 435 ± 41 years and MC2 (M) 610 ± 55 years and peak MC3 (T) 379 ± 103 years (Catalá et al., 2015b). Modeling of their data indicated a higher production rate of MC2 than MC1 (almost double) as a function of AOU. Comparison with the current work suggests that MC2 ~ C1 and MC1 ~ C2, with MC3 ~ C3 (Table 1).
Production/Decomposition of FDOM by Phytoplankton, Zooplankton, and Bacteria
Laboratory experiments with axenic phytoplankton indicates that many species can produce significant concentrations of FDOM during both growth and senescence phases (Chari et al., 2013; Fukuzaki et al., 2014). Measured EEMs of axenic cultures of the diatom Ditylum brighwelli (Fukuzaki et al., 2014)were found to produce peaks (λex/λem = 350/450) similar to peak C, which had commonly been associated as a terrestrial humic. The raphidophyte Heterosigma akashiwo also produced FDOM (λex/λem = 370/450–470) similar to peak C but slightly red shifted from the diatom (Fukuzaki et al., 2014). In a further laboratory study (Romera-Castillo et al., 2011) grew phytoplankton under axenic conditions and also found that they exuded humic like substances (λex/λem = 310/392—similar to C1 in the current study). When bacteria were grown in the phytoplankton exudates, the fluorescence from peak M decreased and new substances fluoresced (λex/λem = 340/440—similar to peak C2 in our study). Peak T was seen to increase in the cultures during the exponential growth phase and decrease later.
Humic material is both produced (Shimotori et al., 2009, 2012; Zhang et al., 2015) and consumed (Bussmann, 1999; Rocker et al., 2012) by bacteria in the ocean. Laboratory studies have also shown that bacteria can simultaneously remove fluorescence associated with FDOM peak M that had been exuded by phytoplankton, while producing DOM (λex/λem = 340/440) similar to FDOM peak C (Romera-Castillo et al., 2011). The generation of FDOMH by remineralization of particulate material resulting in the consumption of O2 in intermediate and deep waters is presumed to occur by microbial activity (Yamashita and Tanoue, 2008) and results in strong correlations between FDOMH and AOU and species which are similarly regenerated by remineralization processes (e.g., and ). A strong correlation is found between FDOMH and AOU in most of the world's ocean basins (Jørgensen et al., 2011; Catalá et al., 2016) with the exception of the North Atlantic (Jørgensen et al., 2011; Heller et al., 2013). In the equatorial Atlantic De La Fuente et al. (2014) found support for this relationship between AOU and FDOMH (defined in their study as λex/λem = 340/440). In situ evidence for the formation of FDOMH comes from dark incubations in the eastern north Atlantic (Lønborg et al., 2015) results of dark incubation experiments where marine humic-like materials (λex/λem = 320/410 similar to FDOMH) were produced as a by-product of microbial DOM degradation. The study of Lønborg et al. (2015) also revealed that the protein-like fluorescence (λex/λem = 280/320) can be used as a proxy for the dynamics of the labile dissolved organic nitrogen (DON) pool, opening up the potential for looking using FDOM to look at aspects of the nitrogen cycle.
Copepods have been observed to exude a humic-like substance that fluoresces at peak M (C1; Urban-Rich et al., 2006), however in the present study the distribution of this fluorophore was relatively constant throughout the water column and showed no indication it was sourced from grazing (Figure 5). The composition of the phytoplankton prey is also important to the FDOM formed via grazing (Urban-Rich et al., 2004), with a release of humic like material with a diet of either diatoms or dinoflagellates in the exponential growth phase, but feeding on senescent cells lead to an increase in protein like FDOM. Interestingly Urban-Rich et al. (2006) found a shift to lower wavelength humic-like material may reflect a unique zooplankton signal. However, in the present case it appears that PARAFAC is unable to resolve such small differences in spectral signals in order to determine these as separate individual components.
Phytoplankton cells may also release organic matter after viral lysis and this “viral shunt” is suggested to be a major source of DOM in aquatic systems (Wommack and Colwell, 2000). The impact on FDOM resulting from viral lysis of the marine phytoplankton Micromonas pusilla was recently studied by Lønborg et al. (2013), who found that protein-like FDOM (λex/λem = 280/320–Tryptophan like) and humic-like FDOM (λex/λem = 320/410 similar to FDOMH) was elevated 4.1 and 2.8 times, respectively in infected cultures. This pioneering study demonstrates that viral lysis must also be considered in the production of FDOM in seawater.
In the context of the present study, and on the balance of the evidence from the literature, it appears that component C1 is most likely produced by phytoplankton, while C2 is derived from bacteria, with the possibility that elements of C1 are precursors for C2. However, this is a simplistic viewpoint as the relatively uniform vertical distribution of C1 at offshore stations may be interpreted as implying that the bulk of this signal is recalcitrant DOM with more labile material being formed in the high production zones close to the shelf break. For component C3 there are a number of potential sources and sinks with grazing the most likely source.
Photobleaching and Photoformation of FDOM
It has previously been noted that EEM Peak C is the most photo-labile component of FDOM (Helms et al., 2013) as expected as it is presumably lost by direct photochemical reactions as its excitation spectrum stretches into the near UV and thus will be exposed to sunlight in near surface waters. Similarly peak B has also been identified as being prone to photobleaching (Helms et al., 2013). No component similar to peak B was identified using PARAFAC in the present work. Conversion between FDOM species is also possible, as a humic like material was produced from the photo irradiation of the protein tyrosine (peak B; Berto et al., 2016). Nitrate and nitrite may also act as a photosensitizers in the photo-transformation of phenol containing compounds to form FDOM (Calza et al., 2012). A further potential reaction that may result in changes to FDOM is from bromination of organic matter (Méndez-Díaz et al., 2014) due to the reaction of CDOM with formed by the reaction of Br− and OH radicals (Zafiriou et al., 1987).
Determining if the Source of FDOM is Terrestrial or Marine
The Fluorescence index (FI = λex, 470/λex, 520 at λem, 370; Hansen et al., 2016) has been used to distinguish between DOM derived from terrestrial or microbial sources. In the present case there is almost no fluvial input to this region (Cotrim Da Cunha et al., 2009), though terrestrial humic material may be associated with Saharan dust (Williams et al., 2007; Paris and Desboeufs, 2013) deposited in this region as has been previously suggested for the supply of organic matter to lakes in the Alps (Mladenov et al., 2011). In the present study we found values of FI = 2.6 ± 1.2, this is considerably higher than the typical range of reported values for FI of 1.2–1.8, however Hansen et al. (2016) found that leachates of the marine diatom Thalassiosira weissflogii had FI values up to 3.5 following biodegradation and lower values when this was combined with exposure to light. Earlier work at an oligotrophic site in the North Pacific (Station Aloha), far from any freshwater inputs had lower values for FI ranging from 1.55 in the surface to 1.72 at 3500 m (Helms et al., 2013). Thus, it appears that FI when applied in a marine setting is not a good indicator of terrestrial input but could instead be an indicator or phytoplankton derived FDOM.
In the present study, our PARAFAC analysis did not detect a distinct chromophore that aligned to peak C (C2 was aligned to A and C), which was initially regarded as being of terrestrial origin, though it has also been shown to form in seawater due to microbial action (Romera-Castillo et al., 2011). Another metric commonly used to assess terrestrial vs. marine FDOM is the ratio of Peak M to Peak C fluorescence (M:C), which should correlate with the relative source strength of marine-derived FDOM (λex, 310/λem, 410) vs. terrestrial FDOM (λex, 345/λex, 445; Helms et al., 2013). Across the Mauritanian shelf we found M:C = 1.03 ± 0.19. Higher values (mean 2.09) have been observed in coastal Mediterranean surface waters (Para et al., 2010). In the context of the hypothesis by Andrew et al. (2013) that all marine humic material may be terrestrial in origin it is clear that there are no distinctly terrestrial only FDOM signals, as a marine source can also be found, and that testing of this hypothesis requires the application of other analytical techniques.
CDOM Promoted Decomposition Pathways
Decomposition Rates across the Mauritanian Upwelling
Across our study area (Table S4), values of kDTPA varied from 0.0003 to 0.0169 s−1 (mean 0.0074 ± 0.0038 s−1) while kSW ranged from 0.0006 to 0.0241 s−1 (mean 0.0122 ± 0.0054 s−1). These values are similar to what has been observed in other recent studies of loss rates (see Table 2).
Potential CDOM/FDOM Components as Sinks for
A number of organic species (e.g., quinones, thiols) have been suggested previously as potential DOM sinks for in seawater (Heller and Croot, 2010b). The correlation we found between kDTPA and S350−400(ρ = 0.58, n = 36, p < 0.002) is suggestive of a reaction between superoxide and aromatic moieties such as quinones, phenols/polyphenols, or humics which absorb over this range (Wünsch et al., 2015). Quinones have previously been identified as the most likely candidates as they react rapidly with and can be involved in a catalytic cycle with regeneration of the original reactant and production of O2 and H2O2.
where Q is the quinone, QH2 is the hydroquinone and Q•− is the semiquinone radical (Eyer, 1991; Roginsky et al., 1999). The semiquinone radical however can also generate superoxide by reactions with oxygen (Meisel, 1975).
If no catalytic cycle is able to be established, then the reactant is consumed in a stoichiometric fashion and the reaction products will favor either O2 or H2O2 depending on whether it is a reducing or oxidizing reaction. Identification of quinones as FDOM by 3D EEM is complicated as typically the hydroquinone has a high fluorescence quantum yield than the quinone itself, with many of quinones having no apparent fluorescence (Ma et al., 2010). Indeed it has been suggested that carbonyl compounds may play a more important role in the FDOM signal than quinones (Ma et al., 2010). So while quinones are likely present in seawater there is currently no data on what concentrations they may be present in.
It should be noted that the present work was conducted in a lab and in the absence of solar irradiation. During daylight in the ocean there are also reactants that could be photochemically generated, for instance oxidation of tryptophan (or other phenoxy species) to the semi oxidized Tryptophan radical occurs on reaction with , itself formed from OH reactions in seawater (Zafiriou et al., 1987). The tryptophan radical species reacts rapidly with to form tryptophan hydroperoxide (Ehrenshaft et al., 2015), however it can also react with O2 to form and so may be both a source and sink for . Similarly, tyrosine and protein tyrosyl radicals react rapidly with to form hydroperoxides (Möller et al., 2012; Das et al., 2014) and these reactions may be important under certain conditions (e.g., in the sea surface microlayer).
Polyphenols as Superoxide Sinks in Seawater
Previously it has been assumed that only source of polyphenols is from oxidation of terrestrial lignins (Opsahl and Benner, 1997, 1998; Krachler et al., 2012) and that they can form iron humic complexes that stabilize riverine iron in seawater (Krachler et al., 2010, 2012, 2015). Indeed, CDOM optical properties have been used to predict lignin concentration in seawater (Fichot et al., 2016). Gallic acid, along with other polyphenols from peat lands, has also been suggested as a possible ligand for transporting Fe to the sea (Wu et al., 2016). However, several lines of direct and indirect evidence now point to a seawater source for some of these compounds:
(1) Recent work has shown that polyphenols were released in response to metal stress by the diatom Phaeodactylum tricornutum (Rico et al., 2013; Santana-Casiano et al., 2014). Gallic acid was only detected in iron-enriched diatom cultures.
(2) An earlier estuarine study (Maie et al., 2007) using size exclusion chromatography found that the “T-peak,” usually assigned to “Tryptophan-like” substances (Coble, 1996), typically of high molecule weight (Yamashita and Tanoue, 2003), could be separated into a high molecule weight protein signal and a lower molecular weight polyphenol signal. More recently an investigation of riverine humics (Pagano et al., 2012) showed that the polyphenol, tannic acid, gave a peak λex/λem~270/340 nm, similar to the “T-peak.”
(3) Analysis of the OpenFluor database (Murphy et al., 2014; Wünsch et al., 2015) indicated a number of polyphenol compounds as being similar to the excitation/emission spectra identified by PARAFAC in 3D EEM spectra of natural samples.
In light of this, the T-peak appears to be related to the phenol content of Typtophan rather than the protein component. In the current work, PARAFAC component C3 was similar to the classical “T-peak,” however there was no apparent correlation between C3 and kDTPA (r = −0.19, n = 36). Though, it is recognized that there is a wide range of reaction rates with for the different phenolic compounds (Taubert et al., 2003) that may be present in this FDOM pool so it might be expected that there is very poor or no correlation at all between kDTPA and C3. As noted previously there is a difficulty in discriminating between similar phenol compounds using PARAFAC (Bosco et al., 2006).
Several of the polyphenols are known sinks for (Taubert et al., 2003; Terpinc and Abramović, 2010) and while there is currently significant interest in them as antioxidants there is surprisingly little agreement about their rate of reactivity with as most studies focused on inhibition experiments. An example of this is Ferulic acid (FA), a cinnamyl phenol, and an oxidation product of lignin, that are particular abundant in grasses and many herbaceous tissues (Opsahl and Benner, 1998). FA reacts with (Toda et al., 1991; Nasr Bouzaiene et al., 2015), to form a radical species which is resonance stabilized and can form the dimer curcumin and other products (Graf, 1992). FA was also one of the phenolic compounds excreted by diatoms in the study by Rico et al. (2013). Gallic acid (GA) reacts moderately fast with (Table S5: kO2− = 5.4 × 10⁶ M s−1 at 25° C; Taubert et al., 2003). Overall studies have shown that compounds with pyrogallol or catechol moieties are the most rapid superoxide scavengers, and the gallate moiety was found to be the minimal essential structure for maximal reaction rate constants with superoxide (Bors and Michel, 1999).
Polyphenols as Sources of in Seawater
That some polyphenols (e.g., tannin, pyrogallol, or gallic acid) produce H2O2 in weak alkaline solutions from reactions between with O2 has been known for over 150 years (Schönbein, 1860). The reaction is thought to proceed via as an intermediate and both thermal and photochemical pathways of H2O2 formation have been observed (Clapp et al., 1990). The presence of such compounds could result in an additional thermal flux in experiments utilizing SOTS-1, though at typical seawater temperatures and assuming nM concentrations of these polyphenols this flux would be expected to be relatively insignificant.
Consideration of Other Sources of FDOM to the Study Region
In our study region there are no major riverine sources (Cotrim Da Cunha et al., 2009) to the coastal and thus a terrestrial/fluvial source for organic matter is considered unlikely. However, sandwiched between the upwelling region and the Saharan dust is the Banc d'Arguin, a shallow gulf with extensive tidal flats covered with extensive seagrass beds, predominantly Zostera noltii and Cymodocea nodosa (Hemminga and Nieuwenhuize, 1991). Many species of seagrasses have been found to contain high concentrations of polyphenols (e.g., Gallic, Caffeic, and Ferulic acid; Vergeer and Develi, 1997), including Zostera noltii (Grignon-Dubois et al., 2012) and Cymodocea nodosa (Cariello et al., 1979). Decaying seagrass (Hemminga and Nieuwenhuize, 1991) could thus be a potential source of poly phenols and/or FDOM to our study area, though from the limited physical oceanography carried out over the Banc d'Arguin the evidence suggest there is little exchange between the warm salty inshore water and the offshore upwelling (Peters, 1976; Loktionov, 1993; Carlier et al., 2015) and most of the seagrasses decay in situ (Hemminga and Nieuwenhuize, 1991).
CDOM Red Fluorescence in OMZ Waters
Previously Röttgers and Koch (2012) had reported the presence of a distinct absorption shoulder in CDOM at 415–420 nm in the OMZ waters of the Atlantic that was partially correlated with AOU. On further examination using methanol extracts of CDOM they related the absorption peak at ~415 nm to red fluorescence at 650 nm. Röttgers and Koch suggested this peak may be bacterial in origin and most likely a non-chlorin, metal-free porphyrin, like degradation products of hemes, cytochromes, and chlorophyll c, etc. In an earlier work red fluorescence (Ex/Em 420/660) had been found to correlate with dissolved O2 in the OMZ of the Arabian Sea (Breves and Reuter, 2000; Breves et al., 2003) with values ranging from 0 to 0.01 Raman units nm−1 (Ex/Em 270/300 Heuermann et al., 1995). Conversely while a small absorption line at 420 nm was also reported for CDOM data from the Equatorial Atlantic (Andrew et al., 2013), those authors did not observe any related fluorescence at 640 nm and could not exclude it as a filtration artifact. In our work we observed fluorescence in the dissolved phase at these excitation/emission wavelengths but there was no apparent correlation with oxygen concentrations (Figure 8) and the signal appeared to be related more to soluble pigments released in the photic zone presumably by zooplankton grazing (Kleppel, 1998).
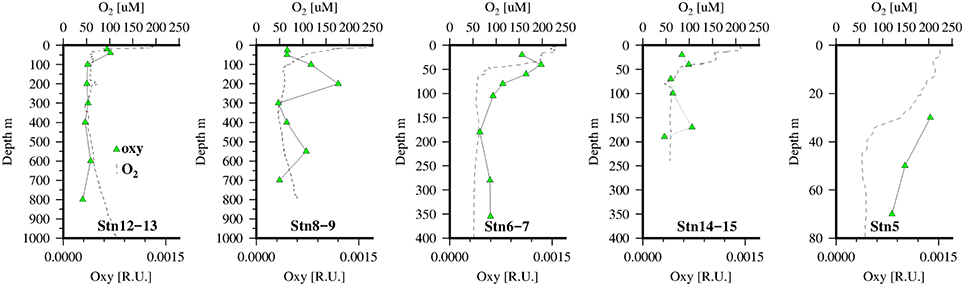
Figure 8. Dissolved O2 (dotted line) and FDOM (λex∕λem = 420/640) pigment “oxy” (green triangles) at 5 stations along the transect in the Mauritanian Upwelling.
Authors Contributions
MH, KW, and PC designed and planned the experiments. MH and KW participated in the cruise, carried out the sampling and analysis onboard. MH, KW, and PC performed the data analysis and wrote the paper.
Funding
MH's participation was financially supported by the German BMBF project SOPRAN III (FKZ 03F0611A and 03F0662A, PC co-PI) that forms part of the German contribution to SOLAS (Surface Ocean Lower Atmosphere Studies). Funding for the participation of KW was awarded to PC from the DFG (CR145/17-1). Research work at sea was funded through SFB754 (DFG), project B5 (PC).
Conflict of Interest Statement
The authors declare that the research was conducted in the absence of any commercial or financial relationships that could be construed as a potential conflict of interest.
Acknowledgments
We sincerely thank the officers and crew of the RV Maria S. Merian and the chief scientist, O. Pfannkuche, for their help at sea. Special thanks are also due to P. Streu, A. Bleyer (both GEOMAR), T. Kalvelage and M. Holtappels (both MPI) for their ship based and laboratory analysis. This work is a contribution of the Collaborative Research Centre 754 “Climate–Biogeochemistry Interactions in the Tropical Ocean” (http://www.sfb754.de), which is supported by the Deutsche Forschungsgemeinschaft (DFG).
Supplementary Material
The Supplementary Material for this article can be found online at: https://www.frontiersin.org/article/10.3389/fmars.2016.00132
References
Andrew, A. A., Del Vecchio, R., Subramaniam, A., and Blough, N. V. (2013). Chromophoric dissolved organic matter (CDOM) in the Equatorial Atlantic Ocean: optical properties and their relation to CDOM structure and source. Mar. Chem. 148, 33–43. doi: 10.1016/j.marchem.2012.11.001
Aparicio, F. L., Nieto-Cid, M., Borrull, E., Romero, E., Stedmon, C. A., Sala, M. M., et al. (2015). Microbially-mediated fluorescent organic matter transformations in the deep ocean. Do the chemical precursors matter? Front. Mar. Sci. 2:106. doi: 10.3389/fmars.2015.00106
Berto, S., De Laurentiis, E., Tota, T., Chiavazza, E., Daniele, P. G., Minella, M., et al. (2016). Properties of the humic-like material arising from the photo-transformation of l-tyrosine. Sci. Total Environ. 545–546, 434–444. doi: 10.1016/j.scitotenv.2015.12.047
Boreen, A. L., Edhlund, B. L., Cotner, J. B., and Mcneill, K. (2008). Indirect photodegradation of dissolved free amino acids: the contribution of singlet oxygen and the differential reactivity of DOM from various sources. Environ. Sci. Technol. 42, 5492–5498. doi: 10.1021/es800185d
Bors, W., and Michel, C. (1999). Antioxidant capacity of flavanols and gallate esters: pulse radiolysis studies. Free Rad. Biol. Med. 27, 1413–1426. doi: 10.1016/S0891-5849(99)00187-2
Bosco, M. V., Garrido, M., and Larrechi, M. S. (2006). Determination of phenol in the presence of its principal degradation products in water during a TiO2-photocatalytic degradation process by three-dimensional excitation–emission matrix fluorescence and parallel factor analysis. Anal. Chim. Acta 559, 240–247. doi: 10.1016/j.aca.2005.12.001
Breves, W., Heuermann, R., and Reuter, R. (2003). Enhanced red fluorescence emission in the oxygen minimum zone of the Arabian Sea. Ocean Dyn. 53, 86–97. doi: 10.1007/s10236-003-0026-y
Breves, W., and Reuter, R. (2000). Bio-optical properties of gelbstoff in the Arabian Sea at the onset of the southwest monsoon. J. Earth Syst. Sci. 109, 415–425. doi: 10.1007/BF02708329
Bussmann, I. (1999). Bacterial utilization of humic substances from the Arctic Ocean. Aquat. Microbial Ecol. 19, 37–45. doi: 10.3354/ame019037
Calza, P., Vione, D., Novelli, A., Pelizzetti, E., and Minero, C. (2012). The role of nitrite and nitrate ions as photosensitizers in the phototransformation of phenolic compounds in seawater. Sci. Total Environ. 439, 67–75. doi: 10.1016/j.scitotenv.2012.09.009
Cariello, L., Zanetti, L., and De Stefano, S. (1979). Posidonia ecosystem—V. Phenolic compounds from marine phanerogames, Cymodocea nodosa and Posidonia oceanica. Comp. Biochem. Physiol. Part B Comp. Biochem. 62, 159–161. doi: 10.1016/0305-0491(79)90304-3
Carlier, A., Chauvaud, L., Van Der Geest, M., Le Loc'h, F., Le Duff, M., Vernet, M., et al. (2015). Trophic connectivity between offshore upwelling and the inshore food web of Banc d'Arguin (Mauritania): new insights from isotopic analysis. Estuar. Coast. Shelf Sci. 165, 149–158. doi: 10.1016/j.ecss.2015.05.001
Catalá, T. S., Reche, I., Fuentes-Lema, A., Romera-Castillo, C., Nieto-Cid, M., Ortega-Retuerta, E., et al. (2015b). Turnover time of fluorescent dissolved organic matter in the dark global ocean. Nat. Commun. 6, 5986. doi: 10.1038/ncomms6986
Catalá, T. S., Reche, I., Álvarez, M., Khatiwala, S., Guallart, E. F., Benítez-Barrios, V. M., et al. (2015a). Water mass age and aging driving chromophoric dissolved organic matter in the dark global ocean. Glob. Biogeochem. Cycles 29, 917–934. doi: 10.1002/2014GB005048
Catalá, T. S., Álvarez-Salgado, X. A., Otero, J., Iuculano, F., Companys, B., Horstkotte, B., et al. (2016). Drivers of fluorescent dissolved organic matter in the global epipelagic ocean. Limnol. Oceanogr. 61, 1101–1119. doi: 10.1002/lno.10281
Chari, N. V. H. K., Keerthi, S., Sarma, N. S., Pandi, S. R., Chiranjeevulu, G., Kiran, R., et al. (2013). Fluorescence and absorption characteristics of dissolved organic matter excreted by phytoplankton species of western Bay of Bengal under axenic laboratory condition. J. Exp. Mar. Biol. Ecol. 445, 148–155. doi: 10.1016/j.jembe.2013.03.015
Chen, Y., Hu, C., Hu, X., and Qu, J. (2009). Indirect photodegradation of amine drugs in aqueous solution under simulated sunlight. Environ. Sci. Technol. 43, 2760–2765. doi: 10.1021/es803325j
Clapp, P. A., Du, N., and Evans, D. F. (1990). Thermal and photochemical production of hydrogen-peroxide from dioxygen and tannic-acid, gallic acid and other related-compounds in aqueous-solution. J. Chem. Soc. Faraday Trans. 86, 2587–2592. doi: 10.1039/ft9908602587
Coble, P. G. (1996). Characterization of marine and terrestrial DOM in seawater using excitation-emission matrix spectroscopy. Mar. Chem. 51, 325. doi: 10.1016/0304-4203(95)00062-3
Coble, P. G. (2007). Marine optical biogeochemistry: the chemistry of ocean color. Chem. Rev. 107, 402–418. doi: 10.1021/cr050350+
Cotrim Da Cunha, L., Croot, P., and Laroche, J. (2009). Influence of river discharge in the tropical and subtropical North Atlantic Ocean. Limnol. Oceanogr. 54, 644–648. doi: 10.4319/lo.2009.54.2.0644
Croot, P. L., Streu, P., Peeken, I., Lochte, K., and Baker, A. R. (2004). Influence of the ITCZ on H2O2 in near surface waters in the equatorial Atlantic Ocean. Geophys. Res. Lett. 31, L23SL04. doi: 10.1029/2004GL020154
Cutter, G. A., Andersson, P., Codispoti, L., Croot, P., Francois, R., Lohan, M., et al. (2010). Sampling and Sample-Handling Protocols for GEOTRACES Cruises. Available online at: http://www.geotraces.org/libraries/documents/Intercalibration/Cookbook.pdf.
Dale, A. W., Sommer, S., Ryabenko, E., Noffke, A., Bohlen, L., Wallmann, K., et al. (2014). Benthic nitrogen fluxes and fractionation of nitrate in the Mauritanian oxygen minimum zone (Eastern Tropical North Atlantic). Geochim. Cosmochim. Acta 134, 234–256. doi: 10.1016/j.gca.2014.02.026
Dalrymple, R. E. M., Carfagno, A. K., and Sharpless, C. M. (2010). Correlations between dissolved organic matter optical properties and quantum yields of singlet oxygen and hydrogen peroxide. Environ. Sci. Technol. 44, 5824–5829. doi: 10.1021/es101005u
Dang, D. H., Lenoble, V., Durrieu, G., Mullot, J.-U., Mounier, S., and Garnier, C. (2014). Sedimentary dynamics of coastal organic matter: an assessment of the porewater size/reactivity model by spectroscopic techniques. Estuar. Coast. Shelf Sci. 151, 100–111. doi: 10.1016/j.ecss.2014.10.002
Das, A. B., Nauser, T., Koppenol, W. H., Kettle, A. J., Winterbourn, C. C., and Nagy, P. (2014). Rapid reaction of superoxide with insulin-tyrosyl radicals to generate a hydroperoxide with subsequent glutathione addition. Free Rad. Biol. Med. 70, 86–95. doi: 10.1016/j.freeradbiomed.2014.02.006
Day, D. A., and Faloona, I. (2009). Carbon monoxide and chromophoric dissolved organic matter cycles in the shelf waters of the northern California upwelling system. J. Geophys. Res. Oceans 114:C01006. doi: 10.1029/2007JC004590
De Haan, H., and De Boer, T. (1987). Applicability of light absorbance and fluorescence as measures of concentration and molecular size of dissolved organic carbon in humic Lake Tjeukemeer. Water Res. 21, 731–734. doi: 10.1016/0043-1354(87)90086-8
De La Fuente, P., Marrasé, C., Canepa, A., Antón Álvarez-Salgado, X., Gasser, M., Fajar, N. M., et al. (2014). Does a general relationship exist between fluorescent dissolved organic matter and microbial respiration?—The case of the dark equatorial Atlantic Ocean. Deep Sea Res. Part I Oceanogr. Res. Papers 89, 44–55. doi: 10.1016/j.dsr.2014.03.007
Diaz, J. M., Hansel, C. M., Voelker, B. M., Mendes, C. M., Andeer, P. F., and Zhang, T. (2013). Widespread production of extracellular superoxide by heterotrophic bacteria. Science 340, 1223–1226. doi: 10.1126/science.1237331
Dubnick, A., Barker, J., Sharp, M., Wadham, J., Lis, G., Telling, J., et al. (2010). Characterization of dissolved organic matter (DOM) from glacial environments using total fluorescence spectroscopy and parallel factor analysis. Ann. Glaciol. 51, 111–122. doi: 10.3189/172756411795931912
Ehrenshaft, M., Deterding, L. J., and Mason, R. P. (2015). Tripping up Trp: modification of protein tryptophan residues by reactive oxygen species, modes of detection, and biological consequences. Free Rad. Biol. Med. 89, 220–228. doi: 10.1016/j.freeradbiomed.2015.08.003
Eyer, P. (1991). Effects of superoxide dismutase on the autoxidation of 1,4-hydroquinone. Chem. Biol. Interact. 80, 159. doi: 10.1016/0009-2797(91)90022-Y
Farikou, O., Sawadogo, S., Niang, A., Diouf, D., Brajard, J., Mejia, C., et al. (2015). Inferring the seasonal evolution of phytoplankton groups in the Senegalo-Mauritanian upwelling region from satellite ocean-color spectral measurements. J. Geophys. Res. Oceans 120, 6581–6601. doi: 10.1002/2015jc010738
Fichot, C. G., Benner, R., Kaiser, K., Shen, Y., Amon, R. M. W., Ogawa, H., et al. (2016). Predicting dissolved lignin phenol concentrations in the coastal ocean from chromophoric dissolved organic matter (CDOM) absorption coefficients. Front. Mar. Sci. 3:7. doi: 10.3389/fmars.2016.00007
Fukuzaki, K., Imai, I., Fukushima, K., Ishii, K.-I., Sawayama, S., and Yoshioka, T. (2014). Fluorescent characteristics of dissolved organic matter produced by bloom-forming coastal phytoplankton. J. Plankton Res. 36, 685–694. doi: 10.1093/plankt/fbu015
Garg, S., Rose, A. L., and Waite, T. D. (2011). Photochemical production of superoxide and hydrogen peroxide from natural organic matter. Geochim. Cosmochim. Acta 75, 4310–4320. doi: 10.1016/j.gca.2011.05.014
Gómez, A. L., López, J. A., Rodríguez, A., Fortiz, J., Martínez, L. R., Apolinar, A., et al. (2016). Producción de compuestos fenólicos por cuatro especies de microalgas marinas sometidas a diferentes condiciones de iluminación. Lat. Am. J. Aquat. Res. 44, 137–143. doi: 10.3856/vol44-issue1-fulltext-14
Graf, E. (1992). Antioxidant potential of ferulic acid. Free Rad. Biol. Med. 13, 435–448. doi: 10.1016/0891-5849(92)90184-I
Grasshoff, K., Kremling, K., and Ehrhardt, M. (1999). Methods of Seawater Analysis. Weinheim (FRG): Wiley-VCH Verlag.
Grignon-Dubois, M., Rezzonico, B., and Alcoverro, T. (2012). Regional scale patterns in seagrass defences: phenolic acid content in Zostera noltii. Estuar. Coast. Shelf Sci. 114, 18–22. doi: 10.1016/j.ecss.2011.09.010
Hansard, S. P., Easter, H. D., and Voelker, B. M. (2011). Rapid reaction of nanomolar Mn(II) with superoxide radical in seawater and simulated freshwater. Environ. Sci. Technol. 45, 2811–2817. doi: 10.1021/es104014s
Hansen, A. M., Kraus, T. E. C., Pellerin, B. A., Fleck, J. A., Downing, B. D., and Bergamaschi, B. A. (2016). Optical properties of dissolved organic matter (DOM): effects of biological and photolytic degradation. Limnol. Oceanogr. 61, 1015–1032. doi: 10.1002/lno.10270
Harcourt, A. V., and Esson, W. (1866). On the laws of connexion between the conditions of a chemical change and its amount. Phil. Trans. R. Soc. Lond. 156, 193–221. doi: 10.1098/rstl.1866.0010
Hayase, K., and Shinozuka, N. (1995). Vertical distribution of fluorescent organic matter along with AOU and nutrients in the equatorial Central Pacific. Mar. Chem. 48, 283. doi: 10.1016/0304-4203(94)00051-E
Heller, M. I., and Croot, P. L. (2010a). Application of a Superoxide () thermal source (SOTS-1) for the determination and calibration of fluxes in seawater. Anal. Chim. Acta 667, 1–13. doi: 10.1016/j.aca.2010.03.054
Heller, M. I., and Croot, P. L. (2010b). Kinetics of superoxide reactions with dissolved organic matter in tropical Atlantic surface waters near Cape Verde (TENATSO). J. Geophys. Res. 115, C12038. doi: 10.1029/2009JC006021
Heller, M. I., and Croot, P. L. (2010c). Superoxide decay kinetics in the Southern Ocean. Environ. Sci. Technol. 44, 191–196. doi: 10.1021/es901766r
Heller, M. I., and Croot, P. L. (2011). Reply to comment on “Application of a superoxide () thermal sources (SOTS-1) for the determination and calibration of fluxes in seawater.” Anal. Chim. Acta. 702, 146–147. doi: 10.1016/j.aca.2011.05.023
Heller, M. I., Gaiero, D. M., and Croot, P. L. (2013). Basin scale survey of marine humic fluorescence in the Atlantic: relationship to iron solubility and H2O2. Glob. Biogeochem. Cycles 27, 88–100. doi: 10.1029/2012GB004427
Helms, J. R., Stubbins, A., Perdue, E. M., Green, N. W., Chen, H., and Mopper, K. (2013). Photochemical bleaching of oceanic dissolved organic matter and its effect on absorption spectral slope and fluorescence. Mar. Chem. 155, 81–91. doi: 10.1016/j.marchem.2013.05.015
Helms, J. R., Stubbins, A., Ritchie, J. D., Minor, E. C., Kieber, D. J., and Mopper, K. (2008). Absorption spectral slopes and slope ratios as indicators of molecular weight, source, and photobleaching of chromophoric dissolved organic matter. Limnol. Oceanogr. 53, 955–969. doi: 10.4319/lo.2008.53.3.0955
Hemminga, M. A., and Nieuwenhuize, J. (1991). Transport, deposition and in situ decay of seagrasses in a tropical mudflat area (Banc D'Arguin, Mauritania). Netherlands J. Sea Res. 27, 183–190. doi: 10.1016/0077-7579(91)90011-O
Heuermann, R., Loquay, K.-D., and Reuter, R. (1995). A multi-wavelength in situ fluorometer for hydrographic measurements. EARSeL Adv. Remote Sens. 3, 71–77.
Holmes, R. M., Aminot, A., Kérouel, R., Hooker, B. A., and Peterson, B. J. (1999). A simple and precise method for measuring ammonium in marine and freshwater ecosystems. Can. J. Fisher. Aquat. Sci. 56, 1801–1808. doi: 10.1139/f99-128
Huntsman, S. A., and Barber, R. T. (1977). Primary production off northwest Africa: the relationship to wind and nutrient conditions. Deep Sea Res. 24, 25–33.
Ingold, K. U., Paul, T., Young, M. J., and Doiron, L. (1997). Invention of the first azo compound to serve as a superoxide thermal source under physiological conditions: concept, synthesis, and chemical properties. J. Am. Chem. Soc. 119, 12364–12365. doi: 10.1021/ja972886l
Jørgensen, L., Stedmon, C. A., Granskog, M. A., and Middelboe, M. (2014). Tracing the long-term microbial production of recalcitrant fluorescent dissolved organic matter in seawater. Geophys. Res. Lett. 41, 2481–2488. doi: 10.1002/2014GL059428
Jørgensen, L., Stedmon, C. A., Kragh, T., Markager, S., Middelboe, M., and Søndergaard, M. (2011). Global trends in the fluorescence characteristics and distribution of marine dissolved organic matter. Mar. Chem. 126, 139–148. doi: 10.1016/j.marchem.2011.05.002
Kitidis, V., Stubbins, A. P., Uher, G., Upstill Goddard, R. C., Law, C. S., and Woodward, E. M. S. (2006). Variability of chromophoric organic matter in surface waters of the Atlantic Ocean. Deep Sea Res. Part II Topical Stud. Oceanogr. 53, 1666–1684. doi: 10.1016/j.dsr2.2006.05.009
Kleppel, G. S. (1998). The fate of the carotenoid pigment fucoxanthin during passage through the copepod gut: pigment recovery as a function of copepod species, season and food concentration. J. Plankton Res. 20, 2017–2028. doi: 10.1093/plankt/20.10.2017
Krachler, R., Krachler, R. F., Von Der Kammer, F., Süphandag, A., Jirsa, F., Ayromlou, S., et al. (2010). Relevance of peat-draining rivers for the riverine input of dissolved iron into the ocean. Sci. Total Environ. 408, 2402–2408. doi: 10.1016/j.scitotenv.2010.02.018
Krachler, R., Krachler, R. F., Wallner, G., Hann, S., Laux, M., Cervantes Recalde, M. F., et al. (2015). River-derived humic substances as iron chelators in seawater. Mar. Chem. 174, 85–93. doi: 10.1016/j.marchem.2015.05.009
Krachler, R., Von Der Kammer, F., Jirsa, F., Süphandag, A., Krachler, R. F., Plessl, C., et al. (2012). Nanoscale lignin particles as sources of dissolved iron to the ocean. Glob. Biogeochem. Cycles 26, GB3024. doi: 10.1029/2012GB004294
Kudela, R. M., Garfield, N., and Bruland, K. W. (2006). Bio-optical signatures and biogeochemistry from intense upwelling and relaxation in coastal California. Deep Sea Res. Part II Topical Stud. Oceanogr. 53, 2999–3022. doi: 10.1016/j.dsr2.2006.07.010
Kujawinski, E. B., Longnecker, K., Blough, N. V., Vecchio, R. D., Finlay, L., Kitner, J. B., et al. (2009). Identification of possible source markers in marine dissolved organic matter using ultrahigh resolution mass spectrometry. Geochim. Cosmochim. Acta 73, 4384–4399. doi: 10.1016/j.gca.2009.04.033
Kuma, K., Katsumoto, A., Kawakami, H., Takatori, F., and Matsunaga, K. (1998). Spatial variability of Fe(III) hydroxide solubility in the water column of the northern North Pacific Ocean. Deep Sea Res. 45, 91–113. doi: 10.1016/S0967-0637(97)00067-8
Lawaetz, A. J., and Stedmon, C. A. (2009). Fluorescence intensity calibration using the Raman Scatter Peak of water. Appl. Spectrosc. 63, 936–940. doi: 10.1366/000370209788964548
Loktionov, Y. (1993). Hydrographical observations west of the Banc d'Arguin, Mauritania, in may 1988. Hydrobiologia 258, 21–32. doi: 10.1007/BF00006183
Lønborg, C., Middelboe, M., and Brussaard, C. P. D. (2013). Viral lysis of Micromonas pusilla: impacts on dissolved organic matter production and composition. Biogeochemistry 116, 231–240. doi: 10.1007/s10533-013-9853-1
Lønborg, C., Yokokawa, T., Herndl, G. J., and Antón Álvarez-Salgado, X. (2015). Production and degradation of fluorescent dissolved organic matter in surface waters of the eastern north Atlantic ocean. Deep Sea Res. Part I: Oceanogr. Res. Papers 96, 28–37. doi: 10.1016/j.dsr.2014.11.001
López, A., Rico, M., Santana-Casiano, J. M., González, A. G., and González-Dávila, M. (2015). Phenolic profile of Dunaliella tertiolecta growing under high levels of copper and iron. Environ. Sci. Pollut. Res. 22, 14820–14828. doi: 10.1007/s11356-015-4717-y
Ma, J., Del Vecchio, R., Golanoski, K. S., Boyle, E. S., and Blough, N. V. (2010). Optical properties of humic substances and CDOM: effects of borohydride reduction. Environ. Sci. Technol. 44, 5395–5402. doi: 10.1021/es100880q
Maie, N., Scully, N. M., Pisani, O., and Jaffé, R. (2007). Composition of a protein-like fluorophore of dissolved organic matter in coastal wetland and estuarine ecosystems. Water Res. 41, 563–570. doi: 10.1016/j.watres.2006.11.006
Mccormick, J. P., and Thomason, T. (1978). Near-ultraviolet photooxidation of tryptophan. Proof of formation of superoxide ion. J. Am. Chem. Soc. 100, 312–313. doi: 10.1021/ja00469a068
Mcdowell, M. S., Bakac, A., and Espenson, J. H. (1983). A convenient route to superoxide ion in aqueous solution. Inorg. Chem. 22, 847–848. doi: 10.1021/ic00147a033
Meisel, D. (1975). Free-energy correlation of rate constants for electron-transfer between organic systems in aqueous-solutions. Chem. Phys. Lett. 34, 263–266. doi: 10.1016/0009-2614(75)85269-9
Méndez-Díaz, J. D., Shimabuku, K. K., Ma, J., Enumah, Z. O., Pignatello, J. J., Mitch, W. A., et al. (2014). Sunlight-driven photochemical halogenation of dissolved organic matter in seawater: a natural abiotic source of organobromine and organoiodine. Environ. Sci. Technol. 48, 7418–7427. doi: 10.1021/es5016668
Messié, M., and Chavez, F. P. (2015). Seasonal regulation of primary production in eastern boundary upwelling systems. Prog. Oceanogr. 134, 1–18. doi: 10.1016/j.pocean.2014.10.011
Micinski, E., Ball, L. A., and Zafiriou, O. C. (1993). Photochemical oxygen activation - superoxide radical detection and production-rates in the Eastern Caribbean. J. Geophys. Res. Oceans 98, 2299–2306. doi: 10.1029/92JC02766
Mladenov, N., Sommaruga, R., Morales-Baquero, R., Laurion, I., Camarero, L., Diéguez, M. C., et al. (2011). Dust inputs and bacteria influence dissolved organic matter in clear alpine lakes. Nat. Commun. 2, 405. doi: 10.1038/ncomms1411
Moffett, J. W., and Zika, R. G. (1987). Reaction kinetics of hydrogen peroxide with copper and iron in seawater. Environ. Sci. Technol. 21, 804–810. doi: 10.1021/es00162a012
Möller, M. N., Hatch, D. M., Kim, H.-Y. H., and Porter, N. A. (2012). Superoxide reaction with tyrosyl radicals generates para-hydroperoxy and para-hydroxy derivatives of tyrosine. J. Am. Chem. Soc. 134, 16773–16780. doi: 10.1021/ja307215z
Mopper, K., and Schultz, C. A. (1993). Fluorescence as a possible tool for studying the nature and water column distribution of DOC components. Mar. Chem. 41, 229–238. doi: 10.1016/0304-4203(93)90124-7
Mopper, K., Zhou, X., Kieber, R. J., Kieber, D. J., Sikorski, R. J., and Jones, R. D. (1991). Photochemical degradation of dissolved organic carbon and its impact on the oceanic carbon cycle. Nature 353, 60–62. doi: 10.1038/353060a0
Murphy, K. R., Butler, K. D., Spencer, R. G. M., Stedmon, C. A., Boehme, J. R., and Aiken, G. R. (2010). Measurement of dissolved organic matter fluorescence in aquatic environments: an interlaboratory comparison. Environ. Sci. Technol. 44, 9405–9412. doi: 10.1021/es102362t
Murphy, K. R., Stedmon, C. A., Wenig, P., and Bro, R. (2014). OpenFluor- an online spectral library of auto-fluorescence by organic compounds in the environment. Anal. Methods 6, 658–661. doi: 10.1039/C3AY41935E
Nakano, M., Sugioka, K., Ushijima, Y., and Goto, T. (1986). Chemiluminescence probe with Cypridina luciferin analog, 2-methyl-6-phenyl-3,7-dihydroimidazo[1,2-a]pyrazin-3-one, for estimating the ability of human granulocytes to generate O2. Anal. Biochem. 159, 363–369. doi: 10.1016/0003-2697(86)90354-4
Nasr Bouzaiene, N., Kilani Jaziri, S., Kovacic, H., Chekir-Ghedira, L., Ghedira, K., and Luis, J. (2015). The effects of caffeic, coumaric and ferulic acids on proliferation, superoxide production, adhesion and migration of human tumor cells in vitro. Eur. J. Pharmacol. 766, 99–105. doi: 10.1016/j.ejphar.2015.09.044
Nelson, N. B., and Siegel, D. A. (2013). The global distribution and dynamics of chromophoric dissolved organic matter. Ann. Rev. Mar. Sci. 5, 447–476. doi: 10.1146/annurev-marine-120710-100751
Nelson, N. B., Siegel, D. A., Carlson, C. A., and Swan, C. M. (2010). Tracing global biogeochemical cycles and meridional overturning circulation using chromophoric dissolved organic matter. Geophys. Res. Lett. 37, L03610. doi: 10.1029/2009GL042325
Nelson, N. B., Siegel, D. A., Carlson, C. A., Swan, C., Smethie, J. W. M., and Khatiwala, S. (2007). Hydrography of chromophoric dissolved organic matter in the North Atlantic. Deep Sea Res. Part I Oceanogr. Res. Papers 54, 710. doi: 10.1016/j.dsr.2007.02.006
Omori, Y., Hama, T., Ishii, M., and Saito, S. (2011). Vertical change in the composition of marine humic-like fluorescent dissolved organic matter in the subtropical western North Pacific and its relation to photoreactivity. Mar. Chem. 124, 38–47. doi: 10.1016/j.marchem.2010.11.005
Opsahl, S., and Benner, R. (1997). Distribution and cycling of terrigenous dissolved organic matter in the ocean. Nature 386, 480–482. doi: 10.1038/386480a0
Opsahl, S., and Benner, R. (1998). Photochemical reactivity of dissolved lignin in river and ocean waters. Limnol. Oceanogr. 43, 1297–1304. doi: 10.4319/lo.1998.43.6.1297
O'Sullivan, D. W., Neale, P. J., Coffin, R. B., Boyd, T. J., and Osburn, S. L. (2005). Photochemical production of hydrogen peroxide and methylhydroperoxide in coastal waters. Mar. Chem. 97, 14–33. doi: 10.1016/j.marchem.2005.04.003
Pagano, T., Ross, A. D., Chiarelli, J., and Kenny, J. E. (2012). Multidimensional fluorescence studies of the phenolic content of dissolved organic carbon in humic substances. J. Environ. Monitor. 14, 937–943. doi: 10.1039/c2em10501b
Para, J., Coble, P. G., Charrière, B., Tedetti, M., Fontana, C., and Sempéré, R. (2010). Fluorescence and absorption properties of chromophoric dissolved organic matter (CDOM) in coastal surface waters of the northwestern Mediterranean Sea, influence of the Rhône River. Biogeosciences 7, 4083–4103. doi: 10.5194/bg-7-4083-2010
Paris, R., and Desboeufs, K. V. (2013). Effect of atmospheric organic complexation on iron-bearing dust solubility. Atmos. Chem. Phys. Discuss. 13, 3179–3202. doi: 10.5194/acpd-13-3179-2013
Peters, H. (1976). The spreading of water masses of the Banc d'Arguin in the up-welling area of the Northern Mauritanian coast. Meteor Forschungsergebnisse 18, 78–100.
Peterson, B. M., Mcnally, A. M., Cory, R. M., Thoemke, J. D., Cotner, J. B., and Mcneill, K. (2012). Spatial and temporal distribution of singlet oxygen in lake superior. Environ. Sci. Technol. 46, 7222–7229. doi: 10.1021/es301105e
Powers, L. C., Babcock-Adams, L. C., Enright, J. K., and Miller, W. L. (2015). Probing the photochemical reactivity of deep ocean refractory carbon (DORC): lessons from hydrogen peroxide and superoxide kinetics. Mar. Chem. 177, Part 2, 306–317. doi: 10.1016/j.marchem.2015.06.005
Powers, L. C., and Miller, W. L. (2014). Blending remote sensing data products to estimate photochemical production of hydrogen peroxide and superoxide in the surface ocean. Environ. Sci. Process. Impacts 16, 792–806. doi: 10.1039/c3em00617d
Rico, M., López, A., Santana-Casiano, J. M., Gonzàlez, A. G., and Gonzàlez-Dàvila, M. (2013). Variability of the phenolic profile in the diatom Phaeodactylum tricornutum growing under copper and iron stress. Limnol. Oceanogr. 58, 144–152. doi: 10.4319/lo.2013.58.1.0144
Rocker, D., Brinkhoff, T., Grüner, N., Dogs, M., and Simon, M. (2012). Composition of humic acid-degrading estuarine and marine bacterial communities. FEMS Microbiol. Ecol. 80, 45–63. doi: 10.1111/j.1574-6941.2011.01269.x
Roe, K. L., Schneider, R. J., Hansel, C. M., and Voelker, B. M. (2016). Measurement of dark, particle-generated superoxide and hydrogen peroxide production and decay in the subtropical and temperate North Pacific Ocean. Deep Sea Res. Part I Oceanogr. Res. Papers 107, 59–69. doi: 10.1016/j.dsr.2015.10.012
Roginsky, V. A., Pisarenko, L. M., Bors, W., and Michel, C. (1999). The kinetics and thermodynamics of quinone-semiquinone-hydroquinone systems under physiological conditions. J. Chem. Soc. Perkin Trans. 2, 871–876. doi: 10.1039/a807650b
Romera-Castillo, C., Sarmento, H., Álvarez-Salgado, X. A., Gasol, J. M., and Marrasé, C. (2011). Net production and consumption of fluorescent colored dissolved organic matter by natural bacterial assemblages growing on marine phytoplankton exudates. Appl. Environ. Microbiol. 77, 7490–7498. doi: 10.1128/AEM.00200-11
Rose, A. L., Godrant, A., Furnas, M., and David, T. (2010). Dynamics of nonphotochemical superoxide production in the Great Barrier Reef lagoon. Limnol. Oceanogr. 55, 1521–1536. doi: 10.4319/lo.2010.55.4.1521
Rose, A. L., Moffett, J. W., and Waite, T. D. (2008). Determination of superoxide in seawater using 2-Methyl-6-(4-methoxyphenyl)-3,7- dihydroimidazo[1,2-a]pyrazin-3(7H)-one Chemiluminescence. Anal. Chem. 80, 1215–1227. doi: 10.1021/ac7018975
Röttgers, R., and Koch, B. P. (2012). Spectroscopic detection of a ubiquitous dissolved pigment degradation product in subsurface waters of the global ocean. Biogeosciences 9, 2585–2596. doi: 10.5194/bg-9-2585-2012
Rubino, F. (2015). Toxicity of glutathione-binding metals: a review of targets and mechanisms. Toxics 3:20. doi: 10.3390/toxics3010020
Santana-Casiano, J. M., González-Dávila, M., González, A. G., Rico, M., López, A., and Martel, A. (2014). Characterization of phenolic exudates from Phaeodactylum tricornutum and their effects on the chemistry of Fe(II)–Fe(III). Mar. Chem. 158, 10–16. doi: 10.1016/j.marchem.2013.11.001
Santos, L., Santos, E. B. H., Dias, J. M., Cunha, A., and Almeida, A. (2014). Photochemical and microbial alterations of DOM spectroscopic properties in the estuarine system Ria de Aveiro. Photochem. Photobiol. Sci. 13, 1146–1159. doi: 10.1039/C4PP00005F
Schafstall, J., Dengler, M., Brandt, P., and Bange, H. (2010). Tidal-induced mixing and diapycnal nutrient fluxes in the Mauritanian upwelling region. J. Geophys. Res. 115, C10014. doi: 10.1029/2009JC005940
Schönbein, C. F. (1860). Fortsetzung der Beiträge zur nähern Kenntniss des Sauerstoffes. J. Praktische Chem. 81, 257–276. doi: 10.1002/prac.18600810136
Scully, N. M., Cooper, W. J., and Tranvik, L. J. (2003). Photochemical effects on microbial activity in natural waters: the interaction of reactive oxygen species and dissolved organic matter. FEMS Microbiol. Ecol. 46, 353–357. doi: 10.1016/S0168-6496(03)00198-3
Sharpless, C. M., and Blough, N. V. (2014). The importance of charge-transfer interactions in determining chromophoric dissolved organic matter (CDOM) optical and photochemical properties. Environ. Sci. Process. Impacts 16, 654–671. doi: 10.1039/c3em00573a
Shimotori, K., Omori, Y., and Hama, T. (2009). Bacterial production of marine humic-like fluorescent dissolved organic matter and its biogeochemical importance. Aquat. Microbial Ecol. 58, 55–66. doi: 10.3354/ame01350
Shimotori, K., Watanabe, K., and Hama, T. (2012). Fluorescence characteristics of humic-like fluorescent dissolved organic matter produced by various taxa of marine bacteria. Aquat. Microbial Ecol. 65, 249–260. doi: 10.3354/ame01552
Stedmon, C. A., Markager, S., and Bro, R. (2003). Tracing dissolved organic matter in aquatic environments using a new approach to fluorescence spectroscopy. Mar. Chem. 82, 239–254. doi: 10.1016/S0304-4203(03)00072-0
Stedmon, C., and Bro, R. (2008). Characterizing dissolved organic matter fluorescence with parallel factor analysis: a tutorial. Limnol. Oceanogr. Methods 6, 572–579. doi: 10.4319/lom.2008.6.572
Steigenberger, S., and Croot, P. L. (2008). Identifying the processes controlling the distribution of H2O2 in surface waters along a meridional transect in the Eastern Atlantic. Geophys. Res. Lett. 35, L03616. doi: 10.1029/2007GL032555
Stramma, L., Visbeck, M., Brandt, P., Tanhua, T., and Wallace, D. (2009). Deoxygenation in the oxygen minimum zone of the eastern tropical North Atlantic. Geophys. Res. Lett. 36:L20607. doi: 10.1029/2009gl039593
Stubbins, A., Niggemann, J., and Dittmar, T. (2012). Photo-lability of deep ocean dissolved black carbon. Biogeosciences 9, 1661–1670. doi: 10.5194/bg-9-1661-2012
Swan, C. M., Siegel, D. A., Nelson, N. B., Carlson, C. A., and Nasir, E. (2009). Biogeochemical and hydrographic controls on chromophoric dissolved organic matter distribution in the Pacific Ocean. Deep Sea Res. Part I Oceanogr. Res. Papers 56, 2175–2192. doi: 10.1016/j.dsr.2009.09.002
Tanhua, T., and Liu, M. (2015). Upwelling velocity and ventilation in the Mauritanian upwelling system estimated by CFC-12 and SF6 observations. J. Mar. Systems 151, 57–70. doi: 10.1016/j.jmarsys.2015.07.002
Tani, H., Nishioka, J., Kuma, K., Takata, H., Yamashita, Y., Tanoue, E., et al. (2003). Iron(III) hydroxide solubility and humic-type fluorescent organic matter in the deep water column of the Okhotsk Sea and the northwestern North Pacific Ocean. Deep Sea Res. 50, 1063–1078. doi: 10.1016/S0967-0637(03)00098-0
Taubert, D., Breitenbach, T., Lazar, A., Censarek, P., Harlfinger, S., Berkels, R., et al. (2003). Reaction rate constants of superoxide scavenging by plant antioxidants. Free Rad. Biol. Med. 35, 1599–1607. doi: 10.1016/j.freeradbiomed.2003.09.005
Terpinc, P., and Abramović, H. (2010). A kinetic approach for evaluation of the antioxidant activity of selected phenolic acids. Food Chem. 121, 366–371. doi: 10.1016/j.foodchem.2009.12.037
Toda, S., Kimura, M., and Ohnishi, M. (1991). Effects of phenolcarboxylic acids on superoxide anion and lipid peroxidation induced by superoxide anion. Planta Med. 57, 8–10. doi: 10.1055/s-2006-960005
Tomczak, M., and Godfrey, J. (1994). Hydrology of the Atlantic Ocean. Regional Oceanography: An Introduction. Oxford: Elsevier.
Urban-Rich, J., Mccarty, J. T., Fernández, D., and Acuña, J. L. (2006). Larvaceans and copepods excrete fluorescent dissolved organic matter (FDOM). J. Exp. Mar. Biol. Ecol. 332, 96–105.
Urban-Rich, J., Mccarty, J. T., and Shailer, M. (2004). Effects of food concentration and diet on chromophoric dissolved organic matter accumulation and fluorescent composition during grazing experiments with the copepod Calanus finmarchicus. ICES J. Mar. Sci. 61, 542–551. doi: 10.1016/j.icesjms.2004.03.024
Vergeer, L. H. T., and Develi, A. (1997). Phenolic acids in healthy and infected leaves of Zostera marina and their growth-limiting properties towards Labyrinthula zosterae. Aquat. Bot. 58, 65–72. doi: 10.1016/S0304-3770(96)01115-1
Vreeland, V., Waite, J. H., and Epstein, L. (1998). Polyphenols and oxidases in substratum adhesion by marine algae and mussels. J. Phycol. 34, 1–8. doi: 10.1046/j.1529-8817.1998.340001.x
Wedborg, M., Persson, T., and Larsson, T. (2007). On the distribution of UV-blue fluorescent organic matter in the Southern Ocean. Deep Sea Res. Part I Oceanogr. Res. Papers 54, 1957. doi: 10.1016/j.dsr.2007.07.003
Wessel, P., and Smith, W. H. F. (1998). New improved version of the generic mapping tools released. EOS Trans. AGU 79, 579. doi: 10.1029/98EO00426
Williams, J., Gros, V., Atlas, E., Maciejczyk, K., Batsaikhan, A., Scholer, H. F., et al. (2007). Possible evidence for a connection between methyl iodide emissions and Saharan dust. J. Geophys. Res. Atmospheres 112:D07302. doi: 10.1029/2005JD006702
Wommack, K. E., and Colwell, R. R. (2000). Virioplankton: viruses in aquatic ecosystems. Microbiol. Mol. Biol. Rev. 64, 69–114. doi: 10.1128/MMBR.64.1.69-114.2000
Wünsch, U. J., Murphy, K. R., and Stedmon, C. A. (2015). Fluorescence quantum yields of natural organic matter and organic compounds: implications for the fluorescence-based interpretation of organic matter composition. Front. Mar. Sci. 2:98. doi: 10.3389/fmars.2015.00098
Wu, Y., Xiang, W., Fu, X., Yan, S., Su, J., Liu, J., et al. (2016). Geochemical interactions between iron and phenolics originated from peatland in Hani, China: implications for effective transport of iron from terrestrial systems to marine. Environ. Earth Sci. 75, 1–12. doi: 10.1007/s12665-015-5189-6
Wuttig, K., Heller, M. I., and Croot, P. L. (2013a). Pathways of superoxide () decay in the Eastern Tropical North Atlantic. Environ. Sci. Technol. 47, 10249–10256. doi: 10.1021/es401658t
Wuttig, K., Heller, M. I., and Croot, P. L. (2013b). Reactivity of Inorganic Mn and Mn Desferrioxamine B with O2, O2–, and H2O2 in Seawater. Environ. Sci. Technol. 47, 10257–10265. doi: 10.1021/es4016603
Yamashita, Y., Cory, R. M., Nishioka, J., Kuma, K., Tanoue, E., and Jaffé, R. (2010). Fluorescence characteristics of dissolved organic matter in the deep waters of the Okhotsk Sea and the northwestern North Pacific Ocean. Deep Sea Res. Part II Topical Stud. Oceanogr. 57, 1478–1485. doi: 10.1016/j.dsr2.2010.02.016
Yamashita, Y., and Tanoue, E. (2003). Chemical characterization of protein-like fluorophores in DOM in relation to aromatic amino acids. Mar. Chem. 82, 255–271. doi: 10.1016/S0304-4203(03)00073-2
Yamashita, Y., and Tanoue, E. (2008). Production of bio-refractory fluorescent dissolved organic matter in the ocean interior. Nat. Geosci. 1, 579–582. doi: 10.1038/ngeo279
Yamashita, Y., and Tanoue, E. (2009). Basin scale distribution of chromophoric dissolved organic matter in the Pacific Ocean. Limnol. Oceanogr. 54, 598–609. doi: 10.4319/lo.2009.54.2.0598
Yamashita, Y., Tsukasaki, A., Nishida, T., and Tanoue, E. (2007). Vertical and horizontal distribution of fluorescent dissolved organic matter in the Southern Ocean. Mar. Chem. 106, 498. doi: 10.1016/j.marchem.2007.05.004
Yuan, J., and Shiller, A. M. (1999). Determination of subnanomolar levels of hydrogen peroxide in seawater by reagent-injection chemiluminescence detection. Anal. Chem. 71, 1975–1980. doi: 10.1021/ac981357c
Zafiriou, O. C. (1990). Chemistry of superoxide ion () in seawater. I. (HOO) and uncatalysed dismutation kinetics studied by pulse radiolysis. Mar. Chem. 30, 31–43. doi: 10.1016/0304-4203(90)90060-P
Zafiriou, O. C., Joussot-Dubien, J., Zepp, R. G., and Zika, R. G. (1984). Photochemistry of natural waters. Environ. Sci. Technol. 18, 358A–371A. doi: 10.1021/es00130a711
Zafiriou, O. C., True, M. B., and Hayon, E. (1987). “Consequences of OH radical reaction in sea water: formation and decay of ion radical,” in Photochemistry of Environmental Aquatic Systems, eds R. G. Zika and W. J. Cooper. (Washington, DC: American Chemical Society), 89–105.
Zhang, Y., Del Vecchio, R., and Blough, N. V. (2012). Investigating the mechanism of hydrogen peroxide photoproduction by humic substances. Environ. Sci. Technol. 46, 11836–11843. doi: 10.1021/es3029582
Keywords: reactive oxygen species, parafac, colored dissolved organic matter (CDOM), Atlantic Ocean, excitation emission matrix fluorescence, fluorescence dissolved organic matter (FDOM), superoxide dismutase, hydrogen peroxide
Citation: Heller MI, Wuttig K and Croot PL (2016) Identifying the Sources and Sinks of CDOM/FDOM across the Mauritanian Shelf and Their Potential Role in the Decomposition of Superoxide (). Front. Mar. Sci. 3:132. doi: 10.3389/fmars.2016.00132
Received: 31 May 2016; Accepted: 18 July 2016;
Published: 03 August 2016.
Edited by:
Leanne C. Powers, Skidaway Institute of Oceanography, USAReviewed by:
Yi Zhang, University of Maryland, College Park, USAChristopher James Miller, University of New South Wales, Australia
Copyright © 2016 Heller, Wuttig and Croot. This is an open-access article distributed under the terms of the Creative Commons Attribution License (CC BY). The use, distribution or reproduction in other forums is permitted, provided the original author(s) or licensor are credited and that the original publication in this journal is cited, in accordance with accepted academic practice. No use, distribution or reproduction is permitted which does not comply with these terms.
*Correspondence: Maija I. Heller, maijaheller@gmail.com