A Bioreactor Approach to Investigate the Linkage between Methane Oxidation and Nitrate/Nitrite Reduction in the Pelagic Oxic-Anoxic Transition Zone of the Central Baltic Sea
 Gunnar Jakobs1*†
  Matthias Labrenz1
  Gregor Rehder1 Susanna Hietanen2 Katrin Kießlich1
  Angela Vogts1
  Martin Blumenberg3†
  Oliver Schmale1*
- 1Leibniz Institute for Baltic Sea Research Warnemünde (IOW), Rostock, Germany
- 2Department of Environmental Sciences, University of Helsinki, Helsinki, Finland
- 3Geoscience Centre, Georg-August-University Göttingen, Göttingen, Germany
Evidence of aerobic methane oxidation coupled to denitrification has been provided for different freshwater environments, whereas the significance of this process for the marine realm has not been adequately investigated. The goal of this study was to investigate the methane-related reduction of nitrate/nitrite in a marine environment (salinity 8.5). A water sample was collected from the oxic-anoxic transition zone of the Gotland Deep (central Baltic Sea) and the microorganisms contained therein were cultivated in a bioreactor under hypoxic conditions (0.5 μM O2). To enrich the microorganisms involved in the coupled process the bioreactor was continuously sparged with methane as the sole energy and carbon source and simultaneously supplied with a nutrient solution rich in nitrate and nitrite. The bioreactor experiment showed a relationship between the turnover of methane and the concomitant concentration decrease of nitrite and nitrate at the early stage of the experiment. This relationship indicates the role of methanotrophs, which may support heterotrophic denitrifiers by the release of organic compounds as an energy source. Besides, a mixture of uncultured microorganisms, aerobic methanotrophic and heterotrophic denitrifying bacteria were identified in the enrichment culture. Microbial incorporation of nitrite and methane was proven on the cellular and gene levels via 15NO/13CH4 incubation experiments and subsequent analyses with nano secondary ion mass spectrometry (NanoSIMS) and stable isotope probing (SIP). The NanoSIMS showed the incorporation of 15N in almost all the bacteria and in 9% of those there was a concomitant enrichment in 13C. The relatively low abundance of methane-consuming bacteria in the bioreactor was further reflected in specific fatty acids indicative for type I methanotrophic bacteria. Based on pmoA gene analyses, this bacterium is different from the one that was identified as the only key player of methane oxidation in previous studies in the Gotland Deep, indicating the existence of other subordinate methanotrophic bacteria at that site. The results provide the first indications for the predisposition of a methane-related reduction of nitrate/nitrite under hypoxic conditions in the marine realm, supporting the assumption of an interaction between methanotrophic and denitrifying bacteria which hitherto has only been described for fresh water environments.
Introduction
Apart from the classical microbial processes that oxidize methane via electron acceptors such as oxygen and sulfate, various alternative pathways have been identified in different aquatic systems over the last few decades (Modin et al., 2007; Reeburgh, 2007). Sedimentary studies have shown that there is oxidation of methane coupled to the reduction of nitrate, nitrite, iron and manganese (Reeburgh, 2007; Beal et al., 2009; Ettwig et al., 2010). Beal et al. (2009) provided the first indications that there is a manganese- (MnO2) and iron- (Fe(OH)3) dependent anaerobic oxidation of methane (AOM) in sediment samples gathered from a methane seep site (Eel River Basin). The first evidence for anaerobic methane oxidation coupled to denitrification was shown in a bioreactor containing acetate degrading and denitrifying organisms from fresh water environments (Islas-Lima et al., 2004). Sludge from this bioreactor was exposed to methane, which led to a decrease in nitrate concentration as well as an increase in dinitrogen production, with methane as the sole electron donor. The microbial community involved was described by Raghoebarsing et al. (2006), who enriched a microbial consortium consisting of bacteria and archaea from freshwater sediments, that was able to oxidize methane anaerobically using nitrite rather than nitrate. Further bioreactor studies disproved the involvement of archaea and identified a single bacterium responsible for this process. This bacterium named “Ca. Methylomirabilis oxyfera” uses internally generated oxygen for the consumption of methane (Ettwig et al., 2010). Specific labeling experiments with “Ca. Methylomirabilis oxyfera” identified the incorporation of carbon originating from bicarbonate instead of methane, providing evidence of a carbon dioxide fixing organism as well as of the role of methane as the dominating energy source in the process (Rasigraf et al., 2014).
These observations are in contrast to the metabolism of aerobic methanotrophic bacteria, that utilize methane exclusively as a source for carbon and energy (Hanson and Hanson, 1996). According to their carbon assimilation that can either be performed by the ribulose monophosphate (RuMP) or serine pathway, aerobic methanotrophic bacteria are separated into the main groups type I and type II, respectively. Aerobic methanotrophs also have an important impact on the nitrogen cycle, because they are capable of oxidizing ammonia to nitrite and nitrous oxide (N2O). This may be due to the evolutionary relationship between the methane monooxygenase and ammonium monooxygenase, which is used by nitrifying bacteria for the oxidation of ammonia (Holmes et al., 1995). Aerobic methanotrophs isolated from a freshwater swamp have been shown to enhance heterotrophic denitrification in the presence of methane in low oxygen conditions (Knowles, 2005). In this process, denitrifiers utilize organic compounds as energy source that are released by methanotrophic bacteria during carbon assimilation. The consumption of methane and oxygen accompanied by the removal of nitrate as well as the formation of nitrous oxide and nitrogen (N2) have been found in several freshwater environments (Amaral et al., 1995; Thalasso et al., 1997; Knowles, 2005). Clear evidence for the synergetic interaction of methane oxidizing and denitrifying bacteria under oxic conditions was first provided by Waki et al. (2004), who showed that there was an inhibition of denitrification when methane oxidation was inhibited using methyl fluoride. Enrichment cultures of denitrifying methanotrophic consortia have revealed type I and II methanotrophic bacteria to be involved (Rhee and Fuhs, 1978; Costa et al., 2000). Methanol, citrate, acetate, as well as proteins, nucleic acids, or carbohydrates have been suggested as intermediate organic substances that are released by the aerobic methanotrophic bacteria and consequently consumed by heterotrophic denitrifiers.
The significance of aerobic methane oxidation coupled to denitrification, while confirmed in different fresh water environments, has not been adequately investigated in the marine realm. The central Baltic Sea represents a brackish basin with a less saline surface- and more saline deep water separated by a permanent halocline. The stable salinity stratification limits the downward transport of oxygen leading to oxic conditions in the upper water column and the formation of a sulfidic deep water layer (Schmale et al., 2010). These two compartments are connected by an oxygen-depleted layer, the oxic-anoxic transition zone. This layer is characterized by a supply of methane from the deep water and a pronounced concentration decrease in nitrate and nitrite concentrations. In the central Baltic Sea (Gotland Deep), Schmale et al. (2012) showed aerobic microbial methane oxidation at the oxic-anoxic transition zone by the strong decrease in methane concentrations toward the transition zone, an enrichment of 13CH4 and the presence of type I methanotrophic bacteria. In addition, the vertical transport rate of methane from the deep anoxic water layer toward the oxic-anoxic transition zone and the intensity of lateral intrusions were identified as major factors determining the methane turnover and the adaptation of the methanotrophic community in that depth interval (Jakobs et al., 2013, 2014; Schmale et al., 2016).
This study aims to provide evidence for methane-related nitrate/nitrite reduction under hypoxic conditions in the marine environment. The stratified water column of the central Baltic Sea with its pronounced methane and nitrate/nitrite gradients within the oxic/anoxic transition zone provides an ideal study area to investigate the link between methane oxidation and nitrogen conversion. In the present study, a water sample from the oxic-anoxic transition zone at the Gotland Deep was used as an inoculum to enrich microorganisms under hypoxic conditions in a bioreactor. Experimental boundary conditions were chosen to promote aerobic methane oxidation coupled to denitrification in the enrichment culture. During the enrichment experiment the culture was studied using analytical methods such as cell counting, nutrient analysis, 14C labeling experiments, biomarker analysis, fingerprint methods, and further characterization by phylogenetic (stable isotope probing) and NanoSIMS analyses.
Methods and Materials
Sampling Location
During cruise 06EZ/12/13 on R/V Elisabeth Mann Borgese in July/August 2012 the vertical profiles of nitrate and nitrite showed a sharp concentration decrease at the oxic-anoxic transition zone of the Gotland Deep (Figure 1). At the same time the oxygen concentration was low (2.7 μM O2) and methane concentrations strongly decreasing toward the oxic-anoxic transition, indicating there were potential conditions for aerobic methane oxidation coupled to denitrification (Thalasso et al., 1997; Modin et al., 2007). A 4.2 L water sample was taken with a rosette sampler at 86 m at this oxic-anoxic transition zone. Moreover, subsequent lab-based analyses by Jakobs et al. (2013) confirmed the occurrence of microbial methane consumption at the chosen sampling depth by the enrichment of 13CH4 together with elevated methane oxidation rates (Figure 1).
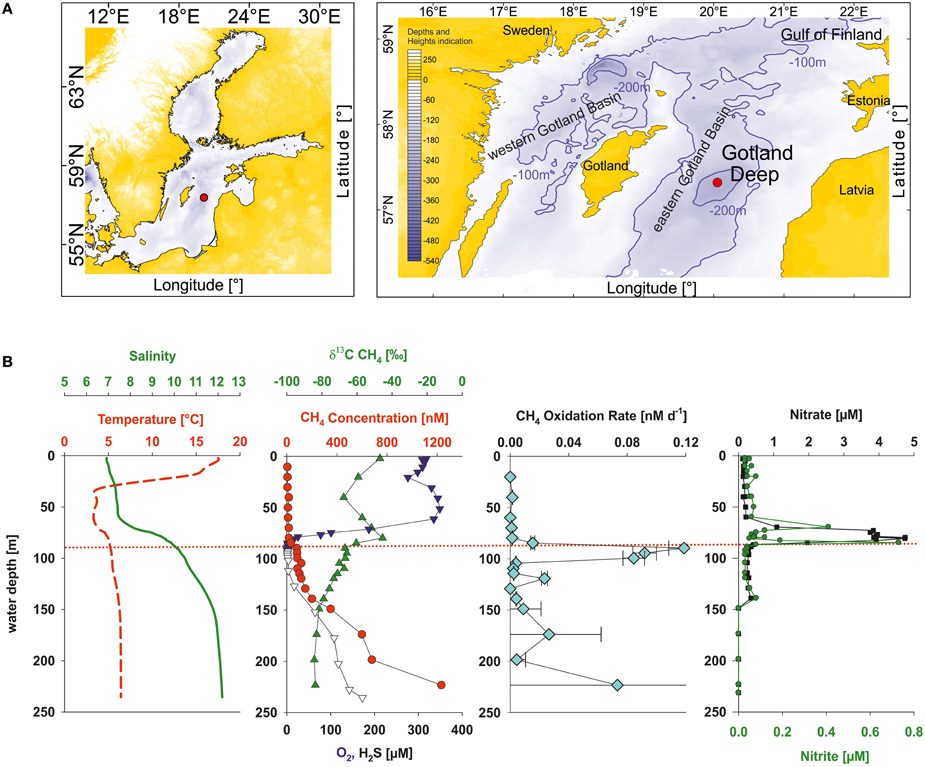
Figure 1. (A) Sampling site (red circle) in the central Baltic Sea (eastern Gotland Basin). (B) Vertical profiles of temperature (red dashed line), salinity (green line), methane (red circles), δ13C values of methane (green triangles up), oxygen (blue triangles down), hydrogen sulfide (open triangles down), methane oxidation rates (light-blue diamonds), nitrate (black squares), and nitrite (green circles). The red dotted line shows the sampling depth of the bioreactor inoculum. All the data shown were obtained from water samples, taken on the same day and station as the sample for the bioreactor. The data -except nitrate and nitrite concentrations- were taken from Jakobs et al. (2013).
Bioreactor Approach
The experimental set-up and cultivation procedure was generally based on the enrichment conditions applied in Raghoebarsing et al. (2006), who enriched microorganisms under exclusion of oxygen. In the present study, the bioreactor approach was chosen to amplify microbial processes (aerobic methane oxidation and nitrate/nitrite reduction) and to detect a potential interaction between involved microorganisms. The chemical setting (e.g., 1 mM nitrite and 5 mM nitrate) of the bioreactor experiment represents idealized conditions to enrich and stimulate selectively microorganisms of interest and in order to outcompete other microbial processes. Moreover, the applied enrichment temperature of 25°C is an essential factor to increase the growth and activity of methanotrophic cells, which results in turn in a higher available biomass in the bioreactor.
The water sample was immediately transferred into an autoclaved bioreactor (Applikon Biotechnology, the Netherlands, total volume 7 L, max. working volume during enrichment 5.2 L, Figure 2). Before filling the bioreactor with the water sample, the culture vessel was flushed with argon to avoid additional oxygen entering the enrichment culture. The cultivation procedure was started immediately on board after filling the bioreactor, and continued on shore (IOW, Rostock, Germany). The bioreactor was sparged with a mixture of CH4/CO2 (95:5 v/v, purity 99,995%, Linde gas, Germany) with a flow rate of 10 ml min−1. The CO2 concentration in the gas supply was maintained at a relatively constant pH (6.8–7.0) in the enrichment liquid, which was monitored by a pH electrode (Applikon Biotechnology, the Netherlands). A nutrient solution (Table 1) consisting of an artificial brackish water medium (Bruns et al., 2002), that was established to cultivate bacteria originating from the Baltic Sea, was continuously added (0.1 ml min−1). This nutrient solution was modified to contain high amounts of nitrate and nitrite according to Raghoebarsing et al. (2006). The nutrient solution was continuously sparged with a mixture of Ar/CO2 (95:5 v/v) during the supply to keep the concentration of oxygen as low as possible. The bioreactor was kept dark with aluminum foil. In addition, all the tubing (Norprene®, Saint Gobain, France) for gas and nutrient supply was lightproof and had low oxygen permeability. The culture was continuously stirred (250 rpm) and temperature maintained at 25°C (precision ± 0.1°C) with a heater band. The gas outlet of the bioreactor was equipped with a gas cooler to condensate evaporated culture liquid, which otherwise would have been exhausted with the gas stream. Dissolved oxygen in the culture liquid was continuously monitored with an oxygen sensor and randomly analyzed by gas chromoatography.
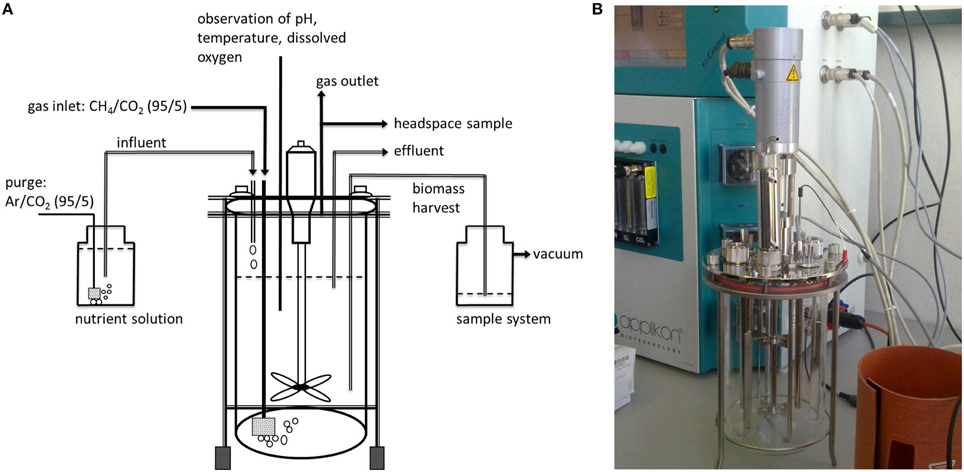
Figure 2. (A) Schematic illustration of the bioreactor set up. (B) Photo of the cultivation equipment showing the bioreactor vessel together with the control unit in the background.
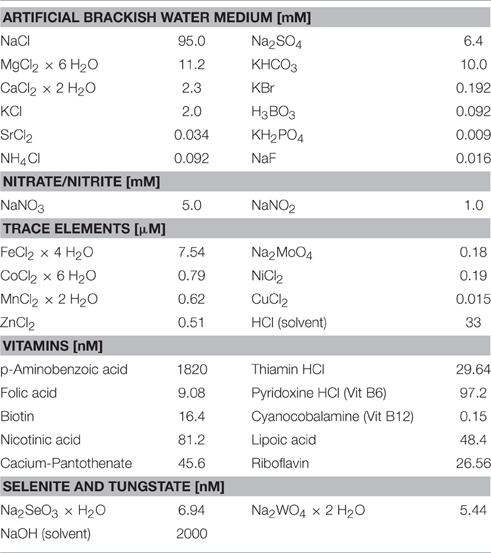
Table 1. Compound concentrations of the nutrient solution.
For 53 weeks in total the bioreactor was always first supplied with nutrient solution for 7 days. Afterwards, the gas influent and gas outlet were closed and the stirrer was stopped to allow the settling of the microbial biomass at the bottom of the culture vessel, thus minimizing removal of particles during the subsequent sampling procedure. After a 1 h settling period, 1 L of the supernatant was removed using the effluent pump. During pumping, the gas outlet was connected to a 2 L flask containing the exhaust gas and additionally supplied with argon (50 ml min−1) to ensure pressure equalization and to prevent the entry of oxygen. This weekly cycle of filling and removing liquid was maintained during the entire enrichment period. A chronological overview of the conducted analyses is given in Figure 3. Compared to the other analytical methods used over the runtime of the experiment, the sampling volume for methane oxidation rates was relatively large (0.9 L). Therefore, these sampling events were reduced to avoid considerable disturbances in the enrichment culture. This is also the reason for the limited number of gas chromatographic determination of oxygen in the headspace of the bioreactor. To ensure precise gas chromatographic oxygen measurements the gas sample from the bioreactor headspace was directly transferred via capillary into the gas chromatograph while the gas supply into the bioreactor was turned off (see details below).
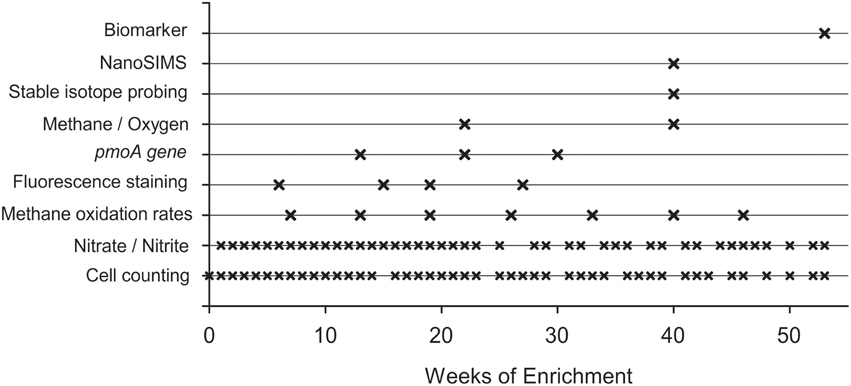
Figure 3. Chronological overview of the analyses during the enrichment experiment.
Cell Counting and Morphology
The number of bacterial cells in the enrichment culture was quantified using flow cytometry (FACS Calibur flow cytometer, Becton and Dickinson) as described by Jost et al. (2008). Briefly, duplicate samples of 1 ml were taken weekly from the enrichment culture under stirred conditions and preserved with 100 μl paraformaldehyde. Bacterial cells were stained with SYBR Green I and measured for 3 min at a flow rate of 26.8 μl min−1. The measuring setup was adjusted to cover a bacterial size range of 0–2 μm. The standard deviation of this method is < 5%.
Changes in the bacterial morphology in the enrichment culture were examined using DAPI fluorescence staining (Porter, 1980). Briefly, 20 ml of the enrichment culture was fixed with 1 ml formalin (37% formaldehyde) and stored for 1 h at 4°C in the dark. An aliquot (2 or 7 ml depending on the cell density) of the fixed samples was filtered onto a membrane filter (Whatman Cyclopore Membrane Polycarbonate Black, 0.2 μm, 25 mm) and exposed to DAPI (4′,6-diamidino-2-phenylindole) for 5 min in the dark before being analyzed using fluorescence microscopy (ZEISS Axioskop 2 mot plus).
Nitrate, Nitrite, Oxygen, and Methane Concentrations
Nutrient analyses were carried out to determine the temporal concentration development of nitrate and nitrite in order to monitor the reduction of nitrogen species. The concentrations of nitrite and nitrate in the cultivation vessel were determined from the supernatant by the method of Grasshoff et al. (1999) using a continuous-flow-analyzer (FLOWSYS, Alliance Instruments, Germany). A precision of ±10 μM nitrate and ±2 μM nitrite was determined for the applied concentration range.
The concentration of dissolved methane in the culture liquid was analyzed by gas chromatography of the bioreactor headspace. Briefly, a 100 μl gas sample was taken with a gastight syringe (Hamilton) from the bioreactor headspace and transferred via on-column injection into a gas chromatograph (Shimadzu GC-2014), which was equipped with an activated aluminum oxide column (60/80 mesh) and a flame ionization detector. The oven temperature was 50°C and the carrier gas (helium) flow rate was 25 ml/min. A precision of ±3.6% was determined for the gas chromatographic analysis. The concentration of dissolved methane in the culture liquid was obtained by the calculation method of Wiesenburg and Guinasso (1979).
The concentration of dissolved oxygen in the culture liquid was monitored continuously with an oxygen sensor (Applikon Biotechnology, the Netherlands, Clark-type, lower detection limit: 45 μM O2, precision ± 0.1 Vol.-% O2) to detect any entry of large quantities of oxygen to the bioreactor. For more sensitive measurements, oxygen was determined periodically via gas chromatography in the headspace of the culture vessel. Therefore, gas samples were directly transferred via capillary from the reactor headspace into a gas chromatograph to avoid any contamination by ambient air. The injection volume was ensured by a 100 μl sample loop. The gas chromatograph (Thermo Scientific, Trace GC Ultra) was equipped with a capillary column (80 m, molecular sieve) and a pulsed discharge detector. The oven temperature was 40°C and the carrier gas (helium) flow rate was 12 ml/min. A detection limit of 0.06 μM dissolved oxygen was determined for this method (precision ±6.2%). The concentration of dissolved oxygen in the culture liquid was obtained using the calculation method due to Weiss (1970).
Methane Oxidation Rates
14C labeling experiments were conducted to investigate a potential correlation between nitrate/nitrite reduction and the microbial turnover of methane. Methane oxidation rate measurements were performed as described in Jakobs et al. (2013). Samples were transferred from the bioreactor under stirred conditions into 100 ml glass bottles and sealed so they were air-free with aluminum crimp caps. 14CH4 dissolved in sterile anoxic water (100 μl injection volume, activity 3 kBq) was added to each sample. The 14CH4 activity of the injected tracer was determined by stripping of the tracer liquid with synthetic air for at least 20 min, followed by combustion on a Cu(II)-oxide catalyst at 850°C. The resulting 14CO2 was quantitatively trapped with a mixture of phenylethylamine and ethyleneglycolmonomethylether (1:7 v/v, 10 ml), and the activity was measured by liquid scintillation counting on a Tri-Carb 2910 TR counter (Perkin Elmer Inc., USA) using a scintillation cocktail (10 ml, Irga-safe Plus, Perkin Elmer). After tracer injection, the bottles were incubated in the dark for 3 days at 22°C. The microbial activity was terminated by injection of sodium hydroxide [500 μl, 50% (w/w)]. For trapping of the microbial-formed 14CO2, the samples were transferred into gastight bottles equipped with scintillation vials positioned in the gas headspace below the bottle cap. These vials contained a mixture of sodium hydroxide (1 ml, 2.5% w/w) and phenylethylamine (1 ml) to capture the 14CO2 released from the sample after acidification with hydrochloric acid (5 ml, 25%) under stirring for 24 h. The activity in the scintillation vials was measured with a 3 ml cocktail per vial. Blank values were obtained by terminating with sodium hydroxide immediately after tracer addition and the samples treated as described above. Triplicate samples resulted in a standard deviation of 10.1% in the oxidation rates. Assuming first-order kinetics methane oxidation rates (rox) were calculated according to Equation (1),
where 14CO2 is the radioactivity [dpm = disintegrations per minute] of the microbial-formed carbon dioxide, 14CH4 is the radioactivity [dpm] of the injected tracer, CH4 is the methane concentration [μM] in the bioreactor before adding the tracer, t is the incubation time [d] and 0.9 the experimentally determined recovery factor described in Jakobs et al. (2013).
pmoA Gene Analysis
The presence of active and inactive methanotrophs was determined using the pmoA gene encoding the alpha subunit of the particulate methane monooxygenase. The detection of pmoA genes was performed as in Jakobs et al. (2013). A volume of 1000 ml supernatant was filtered on a Durapore filter (0.2 μm pore size, GVWP, Merck Millipore, USA), frozen in liquid nitrogen and stored at −80°C. DNA and RNA were extracted from the frozen filters. pmoA transcripts (indicating active methanotrophs) were analyzed with reverse transcriptase PCR (30–33 cycles) using the primer system A189f/mb661r followed by DGGE fingerprinting. Visible bands were cut out of the gel, re-amplified and sequenced by LGC Genomics GmbH (Berlin, Germany). Sequences were checked for quality using SeqMan software (DNASTAR Inc., USA). Phylogenetic affiliations of the partial sequences were initially estimated with the BLAST program. In addition, 50 ng DNA of sample was processed via PCR (30–35 cycles) and DGGE under the same conditions.
Stable Isotope Probing and NanoSIMS Analyses
13CH4 and 15NO incubations
Activity analyses were performed by the enrichment of the involved microorganisms with isotopically labeled substrates (13C and 15N). NanoSIMS analyses were applied to gain insights into the bacterial metabolism on a cellular level and stable isotope probing (SIP) analyses provided information on the link between bacterial activity and their phylogenetic affiliation. Six replicate samples of the stirred enrichment culture were transferred into transfusion bottles (600 ml), sealed air-free with aluminum screw caps and natural rubber septa. The bottles were directly flushed with argon before sampling. To determine the cell-specific incorporation of methane, a headspace of 50 ml 13CH4 (99.9 atom % 13C, Campro Scientific GmbH, Germany) was applied in three replicates resulting in a 12CH4/13CH4 ratio of 1:4 in the transfusion bottles. To define the cell-specific incorporation of nitrogen, Na15NO2 (dissolved in water) was added to these subsamples, which resulted in a final concentration of 1.3 mM 15NO (in situ conc. bioreactor: 1.1 mM NO, week 39). The other three replicates served as unlabeled blanks. In these a 50 ml headspace was applied, using the gas mixture that was used for the aeration of the bioreactor (CH4/CO2, 95:5 v/v, purity 99,995%, Linde gas, Germany). The NOconcentration of the blanks was adjusted to the final concentration in the labeled replicates by the adding of unlabeled NaNO2. All the labeled and unlabeled replicates were carefully shaken and incubated in the dark for 72 h at 25°C.
Sample processing for stable isotope probing
To determine the phylogenetic affiliation of active methanotrophs, the incubated replicate samples were processed for SIP. Five hundred milliliter of each sample were filtered on Durapore filters (0.2 μm pore size, GVWP, Merck Millipore, USA), frozen in liquid nitrogen and stored at −80°C. The filtered samples were processed according to Glaubitz et al. (2009) and references therein. The procedure includes RNA extraction followed by DNase digestion, and isopycnic centrifugation. The gradients were fractionated and the density of each fraction was determined by a refractometer. The 16S rRNA of each fraction was quantified by qPCR. Bacterial communities were analyzed with single-strand conformation polymorphism (Schwieger and Tebbe, 1998) using the primer systems com1f/com2rpH and w036f/w039rph. Bands were cut out of the gel, re-amplified and cloned in E. coli (Strataclone, Agilent). Sequencing was performed by LGC Genomics GmbH (Berlin, Germany). The quality of sequences was checked using the SeqMan software (DNASTAR Inc., USA). Phylogenetic affiliations of the 16S rRNA gene sequences were initially estimated with the BLAST program (Altschul et al., 1990). The phylogenetic classification was calculated using maximum-likelihood algorithms.
Sample processing for NanoSIMS analysis
Aliquots of 3 ml from one labeled and one unlabeled subsample (blank) were filtered on Nucleopore filters (0.2 μm pore size, Nucleopore, Whatmann, USA), dried at RT and sputtered with a gold layer (~30 nm Au, Cressington, UK). Images of 12C−, 13C−, 12C14N−, and 12C15N− were acquired simultaneously using double focalization mass spectrometry under the following conditions: 16 keV energy, 133Cs+ primary ion beam with a current of 4 pA, mass resolving power >7000 (NanoSIMS 50 L instrument from Cameca, France). 9–45 planes were acquired during scanning from 25 different spots (areas from of 5 × 5 μm to 13 × 13 μm, 512 × 512 pixels, dwelling time 250 μs per pixel). The obtained planes were processed using the Look@NanoSIMS software (Polerecky et al., 2012) based on MATLAB (The MathWorks, Inc.). Briefly, the planes were accumulated after correction for temperature-dependent shifts from plane to plane. Bacteria were defined as regions of interest (ROIs) and the isotopic ratios were calculated for each ROI. In this study, the isotopic enrichment is expressed as atom percent enrichment (APE) according to Equation 2 (Popa et al., 2007), with the isotopic ratios of the unlabeled (Ri) and 15N/13C-labeled bacteria (Rf).
Biomarker Analyses
Lipid biomarkers were analyzed that are indicative for methanotrophic microorganisms. The cell material of 4 L stirred enrichment culture was centrifuged and the resulting pellet was subsequently lyophilized. About 7 mg were extracted using a modified Bligh and Dyer extraction method (White and Ringelberg, 1998). The details are described in Berndmeyer et al. (2014). An aliquot (20%) was hydrolyzed using 6% KOH in methanol (2 h at 80°C in an ultrasonication bath), in order to release ester-bound lipids and to extract free lipids. The resulting solution was extracted with n-hexane (3 ×), yielding the neutral lipid fraction. This fraction was treated with N,O-bis(trimethylsilyl)trifluoroacetamide (BSTFA) for 2 h at 80°C to silylate the alcohols. Fatty acids (FA) were obtained by acidification of the residue of the alkaline reaction solution to a pH of 1 and subsequently extracted using n-hexane (3 ×). Fatty acids were then converted to their methyl esters by adding trimethylchlorosilane in methanol (1:9; v:v; 2 h, 80°C) and were subsequently extracted with n-hexane. Silylated neutral lipids and methylated fatty acids were analyzed with coupled gas chromatography-mass spectrometry (GC-MS) using a Varian CP-3800 chromatograph equipped with a fused silica column (Phenomenex Zebron ZB-5MS, 30 m ID 0.32 mm, 0.25 μm film thickness) coupled to a Varian 1200 L mass spectrometer (He as carrier gas). The temperature program was 80°C (3 min) to 310°C (held 25 min) at 6°C min−1. The samples were injected splitless into a PTV. The compounds in the samples were identified by comparing mass spectra and retention times with published data.
Results
Cell Numbers and Fluorescence Staining
The cell number of the water that was used for filling the bioreactor amounted to 8.3*105 cells ml−1. At the beginning of the enrichment experiment the cell number increased continuously (Figure 4, I) and showed a maximum of 1.7*107 cells ml−1 at week 4 indicating a rapid buildup of cell mass. This cell number maximum was accompanied by the formation of macroscopically visible particles (particle diameter: ~1 mm), which can be explained by cell aggregation. For the first 4 weeks of enrichment the average cell division rate was 0.16 d−1 (equivalent to a doubling time of 6.43 d). In the next weeks the cell number dropped by 73% until week 7 after which it remained at a relatively stable level (~4.6*106 cells ml−1) until week 40. In weeks 43 and 53 at the end of the experiment two maxima of 16*106 and 14*106 cells ml−1 were observed. However, because of the limitations of the flowcytometrical method, which does not differentiate between single cells and cell aggregates, an evaluation of the number of single cells is only assessable at the beginning of the experiment before the formation of particles.
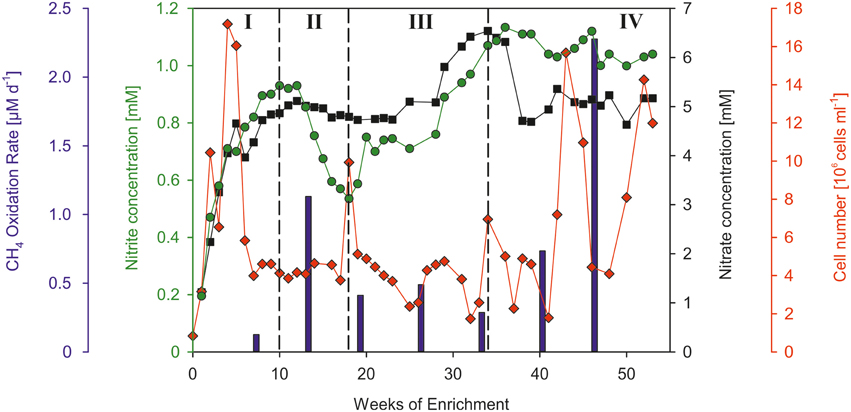
Figure 4. Overview of the temporal development of the cell number (red diamonds), concentrations of nitrate (black squares) and nitrite (green circles), and methane oxidation rates (blue bars). Roman numerals denote the different development stages of the enrichment culture (see text).
The enrichment culture contained cocci and rods, with rod-shaped bacteria dominating the culture (Figure 5, week 6 and 15). Changes in the community could be seen during the experiment, e.g., occurrence of flagellates (Figure 5, see luminous dots at week 19).
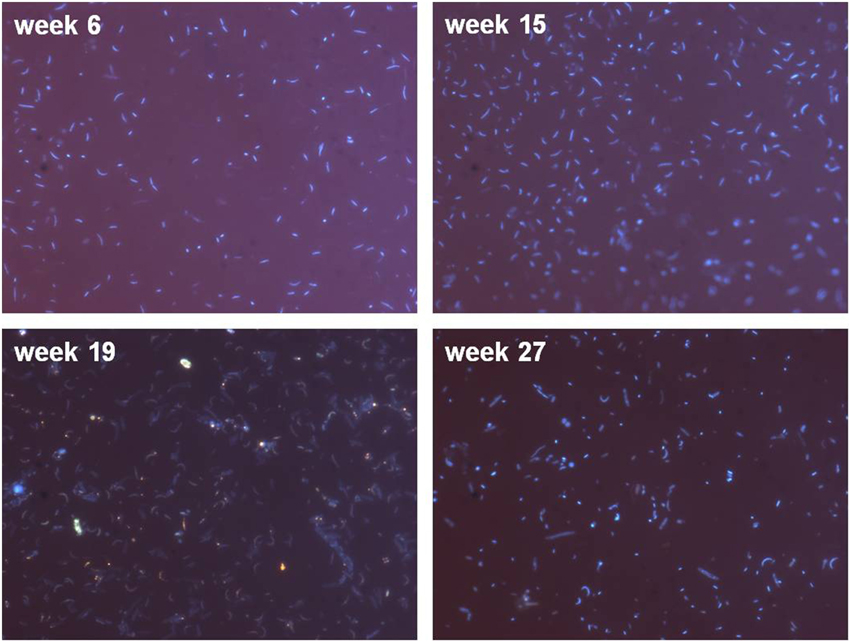
Figure 5. Microscopic examination (1000-fold magnification) of DAPI stained cells showing coccoid- and rod-shaped bacteria. Please note that in order to achieve evaluable fluorescence pictures, the microscopy pictures were obtained with different filtration volumes (week 6 and 27: 2 ml; week 15 and 19: 7 ml) to account for varying cell numbers during the bioreactor runtime.
Oxygen, Methane, Nitrate, and Nitrite Concentrations
The gas chromatographically measured oxygen content in the culture liquid ranged between 0.47 and 0.53 μM O2 (average: 0.5 μM O2). The oxygen was continuously supplied by diffusion into the nutrient solution through the gas tubing. No indications for gas leakage could be detected in the continuous monitoring (lower detection limit: 45 μM O2) during the entire runtime of the experiment. An average concentration of 1.2 mM CH4 was measured in the culture liquid.
Due to the continuous supply of nutrient solution (5 mM NO and 1 mM NO), the concentrations of nitrate and nitrite increased steadily within the first weeks of enrichment (Figure 4, I) and reached a concentration plateau at week 10 (0.93 mM NO nitrite and 4.87 mM NO). An apparent decrease of nitrite (Figure 4, II) was observed from week 12 (0.93 mM) until week 18 (0.54 mM). In this time frame the nitrate concentrations also showed a clear, yet less pronounced decrease (from 5.12 to 4.79 mM NO). A derived denitrification rate of 363 μM N2 d−1 was calculated based on the concentration decrease of nitrate between week 12 and 16, as wells as in consideration of the continuous nutrient supply. In the following time period (Figure 4, III) the concentrations of both compounds increased significantly and reached values (max. 6.54 mM NO and 1.13 mM NO), which exceeded the nitrite and nitrate concentrations of the added nutrient solution. The end of the enrichment experiment (Figure 4, IV) was characterized by nitrite and nitrate concentrations (1.04 mM NO, 5.17 mM NO), comparable to those of the continuously supplied nutrient solution.
Methane Oxidation Rates
The measured methane oxidation rates showed significant temporal variations over the course of the enrichment. An oxidation rate of 0.13 μM d−1 was measured at the beginning of the experiment at week 7 (Figure 4, I). The following measurement at week 13 (Figure 4, II) showed a strongly increased oxidation rate of 1.13 μM d−1. Compared to this oxidation rate, the third period of the enrichment experiment (Figure 4, III) was characterized by lower oxidation rates, which amounted on average to 0.41 μM d−1. The determined oxidation rates at the end of the experiment (Figure 4, IV) showed a strong steady increase from week 33 until week 46 (from 0.29 to 2.28 μM d−1). The presented methane oxidation rates were calculated using a concentration of 1.2 mM CH4, which was measured at both sampling times in the culture liquid.
pmoA Detection and DGGE Analysis
pmoA genes could be detected randomly at week 13, 22, and 30. DGGE analysis of the pmoA gene (DNA level) at these times showed only one involved methanotrophic species. Sequence analysis revealed a similarity of 100% to an uncultured type I methanotrophic bacterium (uncultured Methylococcus sp., accession number KF757070) belonging to the class of Gammaproteobacteria.
Stable Isotope Probing
Two groups of 13C-enriched uncultured bacteria could be identified using SIP with 13CH4: the first group phylogenetically affiliated to type I methanotrophic bacteria (Gammaproteobacteria), the second group belonging to Deltaproteobacteria (red rectangles, Figure 6). The detected unlabeled organisms can be assigned to denitrifying (Betaproteobacteria) and sulfur oxidizing bacteria (Gammaproteobacteria, SUP05 cluster) as well as to the Alphaproteobacteria.
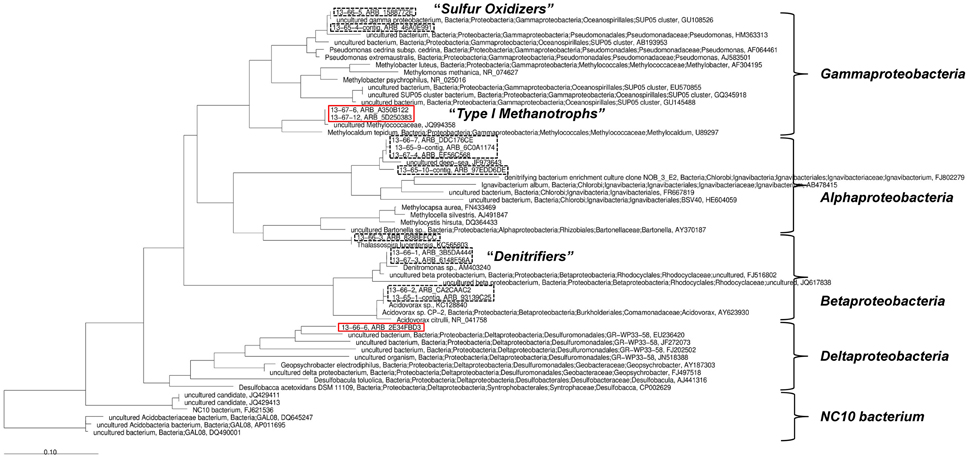
Figure 6. Phylogenetic analysis based on 16S rRNA sequences gained from the stable isotope probing. 13C-enriched organisms are denoted by red rectangles. Black dashed rectangles denote “unlabeled” organisms.
NanoSIMS Analyses
The analyzed bacteria of the labeled sample can be clearly differentiated by their isotopic signature from those measured in the unlabeled sample (Figure 7). Almost all measured bacteria of the labeled sample showed an enrichment of 15N, of which a fraction of ~9% simultaneously revealed an incorporation of 13C. The average enrichment of 15N was much higher than the measured 13C enrichment (average values of the atom percent enrichment of all measured bacteria, coccoid bacteria: 13C 0.009%, 15N 0.06%; rod bacteria: 13C 0.015%, 15N 0.06%).
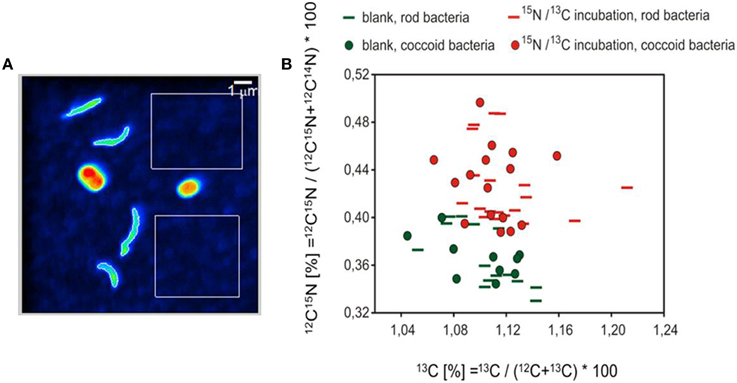
Figure 7. NanoSIMS analysis. (A) 12C14N image representing the cell structures used as the basis for definition of the region of interest (ROI). Please note that the color coding of the 12C14N image does not indicate isotopic enrichment. The white rectangles represent areas for the determination of background values for the quality control of the measurements. (B) Isotopic values of coccoid and rod-shaped bacteria are illustrated according to their shapes. Green colored symbols denote the measured bacteria of the unlabeled blank sample, red symbols the bacteria of the 13CH4 and 15NO2 incubations.
Biomarkers
The biomarker composition at the end of the experiment (Table 2) represented a highly diverse mixture of microorganisms. The occurrence of aerobic methanotrophic bacteria is indicated by the detection of 13C-depleted 16:1 fatty acids and by the abundance of 4α-methyl-C27-steroid-3β-ol (δ13C values of −74.1o and −81.3o, respectively). The 13C-depleted fatty acids were present in relatively low abundance (16:1 FA: 1.5–3.7%) compared to other unspecific fatty acids, which cannot be precisely assigned to a specific group of organisms. Biomarkers indicative for sulfate-dependent AOM could not be detected in the enrichment culture.
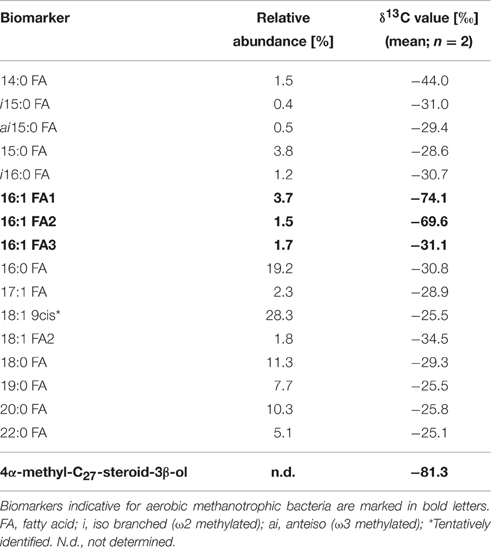
Table 2. Biomarker composition and stable carbon isotope signatures of individual compounds.
Discussion
Methane Oxidation Coupled to Nitrate/Nitrite Reduction
The present study provides a first hint for methane-related reduction of nitrate/nitrite under hypoxic conditions in the marine brackish realm. A coupling of these two processes is indicated by the correlation of methane oxidation rates and nitrite/nitrate removal inferred from the concentrations developments of nitrite/nitrate during phases of the experiment. Our observations during the bioreactor experiment showed an obvious decrease in nitrite and nitrate concentrations from week 12 to 18 (Figure 4, II) that was followed by an increase in methane oxidation rates between week 7 and 13. Conversely, increasing nitrite and nitrate concentrations after week 18 (Figure 4, III) were accompanied by a decrease in the methane oxidation rates. At the last stage of the experiment a further indication for a coupled reaction was provided by the increasing methane consumption and declining nitrate/nitrate concentrations between week 33 and 46 with a higher nitrate than nitrite reduction compared to Period II (Figure 4). The denitrification (363 μM N2 d−1) and methane oxidation rate (1.13 μM CH4 d−1) determined in Period II differ considerably in their proportions (ratio < < 1) and point to a nitrate/nitrite reduction occurring independently from methane oxidation following the ratio (1.27) proposed for freshwater cultivations by Modin et al. (2007). The less pronounced correlation between methane oxidation and nitrate/nitrite reduction at the end of our experiment (Figure 4, III and IV) indicates that at that time the methane-related reduction of nitrate/nitrite plays a minor role. This assumption is also supported by the SIP analyses, biomarkers and changes in the bacterial morphologies showing a diverse mixture of microorganisms and thus indicating that other microbial processes (e.g., nitrification) became more dominant in the further course of the experiment. For example we assume, that the elevated nitrate/nitrite concentrations after week 28 (higher than the nitrate/nitrite concentrations in the supplied medium), can be explained by the production of nitrite/nitrate during remineralization of decomposed cell material, which has been accumulated in the bioreactor vessel.
Microbial Community Involved in Methane Oxidation
The detection of the pmoA gene, together with sequence analysis, clearly indicate the presence of type I methanotrophic bacteria which are phylogenetically affiliated to an uncultured Methylococcus sp. during the enrichment experiment. It has to be noted that this species is different from the one that was identified before as the only key player of methane oxidation at the oxic-anoxic transition zone of the Gotland Basin (Uncultured GotDeep_pmoA1, accession number KC188735, Schmale et al., 2012; Jakobs et al., 2013). Besides potential methodological biases, as primer specificity, the fact that the methanotrophic bacterium in the bioreactor has not previously been identified in the central Baltic Sea could be due to its low abundance, probably even below the detection limit of pmoA gene analysis. This further implies the existence of a methanotrophic bacterium at the oxic-anoxic transition zone of the central Baltic Sea, which potentially plays only a minor role compared to the identified GotDeep_pmoA1. Also the biomarker analyses confirmed the occurrence of type I methanotrophic bacteria using specific fatty acids (16:1) and a 4-Me sterol (4α-methyl-C27-steroid-3β-ol). The 4-Me sterol has previously been found to be especially prominent in Methylococcus capsulatus (Bird et al., 1971; Elvert and Niemann, 2008). The relatively low δ13C values (−74.1o and −81.3o) of these biomarkers are in agreement with the high isotopic fractionation of type I methanotrophic bacteria (Jahnke et al., 1999).
The incorporation of 13C and 15N into the microbial biomass during the incubation with 13CH4 15NO was observed at the cellular level using NanoSIMS analysis (Figure 7). A dominance of denitrifying bacteria in the culture vessel is indicated by an enrichment of 15N in almost all cells, while in contrast, only 9% of the analyzed cells showed an additional enrichment of 13C. This suggests an active growth of methanotrophic cells in the culture vessel. The successful enrichment of methanotrophic bacteria during our bioreactor experiment is indicated by the biomarker studies, which show that the relative abundance of fatty acids in the culture vessel (1.5–3.7%) is higher than in environmental samples taken at the oxic-anoxic transition zone at the same location of the Gotland Basin (1.4%, Schmale et al., 2012). The simultaneous enrichment of 13C and 15N was possibly caused by methanotrophic bacteria during their assimilation of molecular nitrogen, which represents an essential compound in the metabolism of methanotrophic bacteria (Hanson and Hanson, 1996; Madigan and Martinko, 2009). Therefore, the uptake of nitrogen by methanotrophic bacteria in the present study could be covered by molecular 15N-labeled nitrogen released from denitrifying bacteria. Especially some of the type I methanotrophs (e.g., Methylococcus sp.) are able to fix molecular nitrogen (Ward et al., 2004). Another possibility is the direct uptake of the labeled inorganic nitrogen (i.e., 15NO, 15NO) by methanotrophic bacteria.
In accordance with the biomarker analysis a diverse mixture of different organisms was detected by analyzing the incubation assays for SIP. Besides a variety of unlabeled organisms, two groups of 13C-enriched bacteria were found, including type I methanotrophs. Among the unlabeled bacteria, clone sequences of these organisms were closely affiliated to a heterotrophic denitrifying bacterium belonging to Denitromonas sp. (family Rhodocyclaceae), a dominant bacterium described before in denitrifying sludge reactors (Etchebehere et al., 2003). The isotopic signal from the 13C-enriched methanotrophic bacteria was not transferred to the biomass of these coexisting denitrifiers, as was expected from the methane-related nitrate/nitrite reduction under hypoxic conditions. Instead, bacteria affiliated to the order Desulfuromonadales (a Deltaproteobacterium capable to use a variety of electron acceptors under hypoxic or anoxic conditions) were identified as the second group of 13C-enriched microorganisms. This observation is in agreement with the strongly differing methane oxidation and denitrification rates, which implies again the subordinate role of released organic compounds in the present study. In this process, methanotrophic bacteria are capable to produce soluble organic compounds, which can be utilized by denitrifiers as an energy source leading to the reduction of nitrate and nitrite (Knowles, 2005).
Methane-Related Nitrate/Nitrite Reduction under Environmental Conditions
Oxygen suppresses the enzymes (nitrate/nitrite reductase) responsible for denitrification. Modin et al. (2007) and references therein showed that most denitrifying bacteria are capable of consuming oxygen and thereby create anoxic microenvironments, which in turn enables denitrification in oxic waters. The occurrence of particles from week 7 on was accompanied by an increase in methane oxidation and a decrease in nitrate and nitrite concentrations (Figure 4, I and II), indicating a potential relationship between cell aggregation and the interaction between different microorganisms, as shown in denitrifying bioreactors studies (Etchebehere et al., 2003; Modin et al., 2007; Lew et al., 2012). Interestingly, the identified denitrifying bacteria (affiliated to Denitromonas sp.) in the present study was associated with the formation of particles, whereas aggregation in pure Denitromonas cultures has not been observed (Lew et al., 2012).
However, the most important factor controlling the aerobic methane-related nitrate/nitrite reduction is oxygen. The concentration of oxygen should be high enough to enable the oxidation of methane, but at the same time on a level which is not inhibiting denitrification (Modin et al., 2007). Several studies investigating aerobic methane oxidation coupled to denitrification have reported the absence of denitrification when the oxygen supply was stopped to the bioreactor, indicating the necessity of oxygen and thus the essential contribution of aerobic methanotrophic bacteria (Thalasso et al., 1997; Eisentraeger et al., 2001; Waki et al., 2005). In contrast to Rönner and Sörensson (1985) and Jensen et al. (2009), other studies in the Baltic Sea water column showed that denitrification was not detectable under hypoxic conditions, but occurred in the anoxic water layer (Hietanen et al., 2012; Dalsgaard et al., 2013). The removal of nitrogen within the anoxic water layer of the Baltic Sea is suggested to be dominated by autotrophic denitrification, which is driven by the oxidation of reduced sulfur compounds (Brettar and Rheinheimer, 1991; Brettar et al., 2006; Hietanen et al., 2012) and mainly performed by members of the genus Sulfurimonas (Labrenz et al., 2005; Grote et al., 2012). Therefore, the coupled process between methane oxidation and heterotrophic denitrification, which we suggest to be relevant in the present study, most likely plays a subordinate role for the nitrogen cycle under the prevailing environmental conditions at the oxic-anoxic transition zone of the Baltic Sea. However, in the world's oceans, where denitrification under hypoxic conditions is thought also to be regulated by heterotrophic denitrification (Ward et al., 2009), the influence of aerobic methane oxidation on the nitrogen cycle is unknown.
Limitations of the Bioreactor Approach
The results of this study suggest that the release of organic substances (energy source) by methanotrophs and the consumption of oxygen from their surrounding enhance denitrification. Alternatively, oxygen-free microniches in cell aggregates could enable denitrification, so that methane oxidation could proceed in the oxygen containing medium outside the aggregates. Apart from the detected aerobic methane oxidation, we cannot exclude that also anaerobic methane oxidation took place in these oxygen-free microniches. However, our lipid analyses performed at the end of the enrichment experiment could not determine biomarkers (Blumenberg et al., 2004), which are characteristic for sulfate-dependent AOM.
The aim of using enhanced nitrite and nitrate concentrations as well as providing methane as the sole energy and carbon source during our experiment was to enrich denitrifying and methanotrophic bacteria. Besides a mixture of different organisms, our results show that methanotrophic bacteria could be selectively enriched under the specific conditions maintained in the reactor vessel. However, at the later stage of the experiment, when the nutrient composition changed due to remineralization of decomposed cell material or excretion products from bacterial cells, other microbial processes became dominant. That circumstance probably masked the processes of interest and complicates the interpretation. Our finding is in line with other bioreactor experiments inoculated with environmental samples from freshwater systems investigating the methane-related reduction of nitrate/nitrite, showing a large number of non-methanotrophic bacteria in the enrichment culture (Eisentraeger et al., 2001; Modin et al., 2007).
An additional challenge of such bioreactor experiments is the limited sample volume in the culture vessel and the demand on sample volume for the different analyses (e.g., NanoSIMS: 3.6 L; methane oxidation rates: 0.9 L). For temporal analyses of the microbial reactions that take place within a bioreactor, it is beneficial to have as many samples as possible over the runtime of the experiment to evaluate the behavior of system continuously. However, the removal of water or gas from the culture vessel can disturb the microbial community in the bioreactor and must be avoided to limit artifacts. Still, bioreactor enrichment experiments provide a unique experimental tool to selectively cultivate microorganisms and to investigate microbial mediated processes under defined conditions. The present study demonstrates the necessity for an enrichment approach to obtain deeper insights into microbial interactions, which are subordinated under environmental conditions.
Conclusion and Outlook
The present study provides the first indication of the occurrence of a methane-related reduction of nitrate/nitrite within a marine environment. The bioreactor experiment showed a correlation during phases of the experiment between the consumption of methane and the reduction of nitrate/nitrite, thus implying a linkage between both processes. The molecular biological analysis identified type I methanotrophic as well as denitrifying bacteria, indicating a potential role for methanotrophs in supporting heterotrophic denitrifiers. The process is apparently of minor importance in the open Gotland Sea, but could successfully be amplified by the selected chemical conditions in the bioreactor. Our results show the predisposition for a methane-related reduction of nitrate/nitrite under prevailing environmental conditions within the oxic-anoxic transition zone of the central Baltic Sea.
In future work, the inter-dependency of methanotrophy and reduction of nitrate/nitrite should be examined using specific inhibitors for methane oxidation and denitrification. Furthermore, fluorescence in situ hybridization (FISH) in conjunction with NanoSIMS analysis could help to give a clear assignment to the activities and identities of microorganisms involved.
Author Contributions
Experiments, data analysis and manuscript writing by GJ. Assistance of experimental and field work planning and design: OS and GR. Assistance during data interpretation by OS, GR, SH, and ML. Technical assistance by OS and ML. Molecular biological work was carried by KK. NanoSIMS measurements by AV. Biomarker analyses were carried out by MB. Revision of the manuscript: OS, SH, KK, AV, MB, GR, and ML. Principal investigator: OS.
Conflict of Interest Statement
The authors declare that the research was conducted in the absence of any commercial or financial relationships that could be construed as a potential conflict of interest.
Acknowledgments
Many thanks to the crew of the R/V Elisabeth Mann Borgese for their support on cruise 06EZ/12/13. We gratefully acknowledge Birgit Sadkowiak and Lars Kreuzer for nutrient analyses during the runtime of the enrichment experiment. Special thanks go to Jan Donath for his assistance in filling the bioreactor as well as to Annett Grüttmüller for flowcytometrical measurements. We further thank Stine Kedzior for technical support during the gas analyses. We also thank two anonymous reviewers for their comments and suggestions to improve the manuscript. This work was supported by the German Research Foundation (DFG) through Grant SCHM 2530/2-1 to OS, and DFG Grant BL 971/3-1 to MB. The NanoSIMS was funded by the German Ministry of Education and Science, Grant BMBF 03F0626A. The publication of this article was funded partly by the Open Access fund of the Leibniz Association. The present paper based on data that have been published in the framework of a doctoral thesis that was written by Jakobs (2014).
References
Altschul, S. F., Gish, W., Miller, W., Myers, E. W., and Lipman, D. J. (1990). Basic local alignment search tool. J. Mol. Biol. 215, 403–410. doi: 10.1016/S0022-2836(05)80360-2
Amaral, J. A., Archambault, C., Richards, S. R., and Knowles, R. (1995). Denitrification associated with Groups I and II methanotrophs in a gradient enrichment system. FEMS Microbiol. Ecol. 18, 289–298. doi: 10.1111/j.1574-6941.1995.tb00185.x
Beal, E. J., House, C. H., and Orphan, V. J. (2009). Manganese- and iron-dependent marine methane oxidation. Science 325, 184–187. doi: 10.1126/science.1169984
Berndmeyer, C., Thiel, V., and Blumenberg, M. (2014). Test of microwave, ultrasound and Bligh and Dyer extraction for quantitative extraction of bacteriohopanepolyols (BHPs) from marine sediments. Org. Geochem. 68, 90–94. doi: 10.1016/j.orggeochem.2014.01.003
Bird, C. W., Lynch, J. M., Pirt, F. J., Reid, W. W., Brooks, C. J. W., and Middleditch, B. S. (1971). Steroids and Squalene in Methylococcus capsulatus grown on Methane. Nature 230, 473–474. doi: 10.1038/230473a0
Blumenberg, M., Seifert, R., Reitner, J., Pape, T., and Michaelis, W. (2004). Membrane lipid patterns typify distinct anaerobic methanotrophic consortia. Proc. Natl. Acad. Sci. U.S.A. 101, 11111–11116. doi: 10.1073/pnas.0401188101
Brettar, I., Labrenz, M., Flavier, S., Bötel, J., Kuosa, H., Christen, R., et al. (2006). Identification of a thiomicrospira denitrificans-like epsilonproteobacterium as a catalyst for autotrophic denitrification in the central Baltic Sea. Appl. Environ. Microbiol. 72, 1364–1372. doi: 10.1128/AEM.72.2.1364-1372.2006
Brettar, I., and Rheinheimer, G. (1991). Denitrification in the Central Baltic: evidence for H2S-oxidation as motor of denitrification at the oxic-anoxic interface. Mar. Ecol. Prog. Ser. 77, 157–169. doi: 10.3354/meps077157
Bruns, A., Cypionka, H., and Overmann, J. (2002). Cyclic AMP and acyl homoserine lactones increase the cultivation efficiency of heterotrophic bacteria from the central Baltic Sea. Appl. Environ. Microbiol. 68, 3978–3987. doi: 10.1128/AEM.68.8.3978-3987.2002
Costa, C., Dijkema, C., Friedrich, M., García-Encina, P., Fernández-Polanco, F., and Stams, A. J. M. (2000). Denitrification with methane as electron donor in oxygen-limited bioreactors. Appl. Microbiol. Biotechnol. 53, 754–762. doi: 10.1007/s002530000337
Dalsgaard, T., De Brabandere, L., and Hall, P. O. (2013). Denitrification in the water column of the central Baltic Sea. Geochim. Cosmochim. Acta 106, 247–260. doi: 10.1016/j.gca.2012.12.038
Eisentraeger, A., Klag, P., Vansbotter, B., Heymann, E., and Dott, W. (2001). Denitrification of groundwater with methane as sole hydrogen donor. Water Res. 35, 2261–2267. doi: 10.1016/S0043-1354(00)00516-9
Elvert, M., and Niemann, H. (2008). Occurrence of unusual steroids and hopanoids derived from aerobic methanotrophs at an active marine mud volcano. Org. Geochem. 39, 167–177. doi: 10.1016/j.orggeochem.2007.11.006
Etchebehere, C., Cabezas, A., Dabert, P., and Muxi, L. (2003). Evolution of the bacterial community during granules formation in denitrifying reactors followed by molecular, culture-independent techniques. Water Sci. Technol. 48, 75–79.
Ettwig, K. F., Butler, M. K., Le Paslier, D., Pelletier, E., Mangenot, S., Kuypers, M. M. M., et al. (2010). Nitrite-driven anaerobic methane oxidation by oxygenic bacteria. Nature 464, 543–548. doi: 10.1038/nature08883
Glaubitz, S., Lueders, T., Abraham, W.-R., Jost, G., Jürgens, K., and Labrenz, M. (2009). 13C-isotope analyses reveal that chemolithoautotrophic Gamma- and Epsilonproteobacteria feed a microbial food web in a pelagic redoxcline of the central Baltic Sea. Environ. Microbiol. 11, 326–337. doi: 10.1111/j.1462-2920.2008.01770.x
Grasshoff, K., Ehrhardt, M., and Kremling, K. (1999). Methods of Seawater Analysis. Houston, TX: Gulf Publishing; Verlag Chemie.
Grote, J., Schott, T., Bruckner, C. G., Glöckner, F. O., Jost, G., Teeling, H., et al. (2012). Genome and physiology of a model Epsilonproteobacterium responsible for sulfide detoxification in marine oxygen depletion zones. Proc. Natl. Acad. Sci. U.S.A. 109, 506–510. doi: 10.1073/pnas.1111262109
Hietanen, S., Jäntti, H., Buizert, C., Jürgens, K., Labrenz, M., Voss, M., et al. (2012). Hypoxia and nitrogen processing in the Baltic Sea water column. Limnol. Oceanogr. 57, 325–337. doi: 10.4319/lo.2012.57.1.0325
Holmes, A. J., Costello, A., Lidstrom, M. E., and Murrell, J. C. (1995). Evidence that particulate methane monooxygenase and ammonia monooxygenase may be evolutionarily related. FEMS Microbiol. Lett. 132, 203–208. doi: 10.1111/j.1574-6968.1995.tb07834.x
Islas-Lima, S., Thalasso, F., and Gómez-Hernandez, J. (2004). Evidence of anoxic methane oxidation coupled to denitrification. Water Res. 38, 13–16. doi: 10.1016/j.watres.2003.08.024
Jahnke, L. L., Summons, R. E., Hope, J. M., and Des Marais, D. J. (1999). Carbon isotopic fractionation in lipids from methanotrophic bacteria II: the effects of physiology and environmental parameters on the biosynthesis and isotopic signatures of biomarkers. Geochim. Cosmochim. Acta 63, 79–93. doi: 10.1016/S0016-7037(98)00270-1
Jakobs, G. (2014). Spatial and Seasonal Distribution of Methane and Its Microbial Oxidation in the Water Column of the Central Baltic Sea. Dissertation, University of Rostock.
Jakobs, G., Holtermann, P., Berndmeyer, C., Rehder, G., Blumenberg, M., Jost, G., et al. (2014). Seasonal and spatial methane dynamics in the water column of the central Baltic Sea (Gotland Sea). Cont. Shelf Res. 91, 12–25. doi: 10.1016/j.csr.2014.07.005
Jakobs, G., Rehder, G., Jost, G., Kießlich, K., Labrenz, M., and Schmale, O. (2013). Comparative studies of pelagic microbial methane oxidation within the redox zones of the Gotland Deep and Landsort Deep (central Baltic Sea). Biogeosciences 10, 7863–7875. doi: 10.5194/bg-10-7863-2013
Jensen, M. M., Petersen, J., Dalsgaard, T., and Thamdrup, B. (2009). Pathways, rates, and regulation of N2 production in the chemocline of an anoxic basin, Mariager Fjord, Denmark. Mar. Chem. 113, 102–113. doi: 10.1016/j.marchem.2009.01.002
Jost, G., Zubkov, M. V., Yakushev, E. V., Labrenz, M., and Jürgens, K. (2008). High abundance and dark CO2 fixation of chemolithoautotrophic prokaryotes in anoxic waters of the Baltic Sea. Limnol. Oceanogr. 53, 14–22. doi: 10.4319/lo.2008.53.1.0014
Knowles, R. (2005). Denitrifiers associated with methanotrophs and their potential impact on the nitrogen cycle. Ecol. Eng. 24, 441–446. doi: 10.1016/j.ecoleng.2005.01.001
Labrenz, M., Jost, G., Pohl, C., Beckmann, S., Martens-Habbena, W., and Jurgens, K. (2005). Impact of different in vitro electron donor/acceptor conditions on potential chemolithoautotrophic communities from marine pelagic redoxclines. Appl. Environ. Microbiol. 71, 6664–6672. doi: 10.1128/AEM.71.11.6664-6672.2005
Lew, B., Stief, P., Beliavski, M., Ashkenazi, A., Svitlica, O., Khan, A., et al. (2012). Characterization of denitrifying granular sludge with and without the addition of external carbon source. Bioresour. Technol. 124, 413–420. doi: 10.1016/j.biortech.2012.08.049
Modin, O., Fukushi, K., and Yamamoto, K. (2007). Denitrification with methane as external carbon source. Water Res. 41, 2726–2738. doi: 10.1016/j.watres.2007.02.053
Polerecky, L., Adam, B., Milucka, J., Musat, N., Vagner, T., and Kuypers, M. M. M. (2012). Look@NanoSIMS – a tool for the analysis of nanoSIMS data in environmental microbiology. Environ. Microbiol. 14, 1009–1023. doi: 10.1111/j.1462-2920.2011.02681.x
Popa, R., Weber, P. K., Pett-Ridge, J., Finzi, J. A., Fallon, S. J., Hutcheon, I. D., et al. (2007). Carbon and nitrogen fixation and metabolite exchange in and between individual cells of Anabaena oscillarioides. ISME J. 1, 354–360. doi: 10.1038/ismej.2007.44
Porter, K. G. (1980). The use of DAPI for identifying and counting aquatic microflora. Limnol. Oceanogr. 25, 943–948. doi: 10.4319/lo.1980.25.5.0943
Raghoebarsing, A. A., Pol, A., van de Pas-Schoonen, K. T., Smolders, A. J. P., Ettwig, K. F., Rijpstra, W. I. C., et al. (2006). A microbial consortium couples anaerobic methane oxidation to denitrification. Nature 440, 918–921. doi: 10.1038/nature04617
Rasigraf, O., Kool, D. M., Jetten, M. S. M., Sinninghe Damsté, J. S., and Ettwig, K. F. (2014). Autotrophic carbon dioxide fixation via the calvin-benson-bassham cycle by the denitrifying methanotroph “candidatus methylomirabilis oxyfera.” Appl. Environ. Microbiol. 80, 2451–2460. doi: 10.1128/AEM.04199-13
Reeburgh, W. S. (2007). Ocean methane biogeochemistry. Chem. Rev. 107, 486–513. doi: 10.1021/cr050362v
Rhee, G.-Y., and Fuhs, G. W. (1978). Wastewater denitrification with one-carbon compounds as energy source. J. Water Poll. Contr. Fed. 50, 2111–2119.
Rönner, U., and Sörensson, F. (1985). Denitrification rates in the low-oxygen waters of the stratified Baltic proper. Appl. Environ. Microbiol. 50, 801–806.
Schmale, O., Blumenberg, M., Kießlich, K., Jakobs, G., Berndmeyer, C., Labrenz, M., et al. (2012). Aerobic methanotrophy within the pelagic redox-zone of the Gotland Deep (central Baltic Sea). Biogeosciences 9, 4969–4977. doi: 10.5194/bg-9-4969-2012
Schmale, O., Krause, S., Holtermann, P., Power Guerra, N. C., and Umlauf, L. (2016). Dense bottom gravity currents and their impact on pelagic methanotrophy at oxic/anoxic transition zones. Geophys. Res. Lett. 43, 5225–5232. doi: 10.1002/2016GL069032
Schmale, O., Schneider von Deimling, J., Gülzow, W., Nausch, G., Waniek, J. J., and Rehder, G. (2010). Distribution of methane in the water column of the Baltic Sea. Geophys. Res. Lett. 37, L12604. doi: 10.1029/2010GL043115
Schwieger, F., and Tebbe, C. C. (1998). A new approach to utilize PCR–single-strand-conformation polymorphism for 16S rRNA gene-based microbial community analysis. Appl. Environ. Microbiol. 64, 4870–4876.
Thalasso, F., Vallecillo, A., García-Encina, P., and Fdz-Polanco, F. (1997). The use of methane as a sole carbon source for wastewater denitrification. Water Res. 31, 55–60. doi: 10.1016/S0043-1354(96)00228-X
Waki, M., Suzuki, K., Osada, T., and Tanaka, Y. (2005). Methane-dependent denitrification by a semi-partitioned reactor supplied separately with methane and oxygen. Bioresour. Technol. 96, 921–927. doi: 10.1016/j.biortech.2004.08.016
Waki, M., Suzuki, K., Osada, T., Tanaka, Y., Ike, M., and Fujita, M. (2004). Microbiological activities contributing to nitrogen removal with methane: effects of methyl fluoride and tungstate. Bioresour. Technol. 94, 339–343. doi: 10.1016/j.biortech.2004.01.010
Ward, B. B., Devol, A. H., Rich, J. J., Chang, B. X., Bulow, S. E., Naik, H., et al. (2009). Denitrification as the dominant nitrogen loss process in the Arabian Sea. Nature 461, 78–81. doi: 10.1038/nature08276
Ward, N., Larsen, Ø., Sakwa, J., Bruseth, L., Khouri, H., Durkin, A. S., et al. (2004). Genomic insights into methanotrophy: the complete genome sequence of Methylococcus capsulatus (Bath). PLoS Biol. 2:e303. doi: 10.1371/journal.pbio.0020303
Weiss, R. F. (1970). The solubility of nitrogen, oxygen and argon in water and seawater. Deep Sea Res. 17, 721–735. doi: 10.1016/0011-7471(70)90037-9
White, D. C., and Ringelberg, D. B. (1998). “Signature lipid biomarker analysis,” in Techniques in Microbial Ecology, eds R. S. Burlage, R. Atlas, D. Stahl, G. Geesey, and G. Sayler (New York. NY: Oxford University Press), 255–272.
Keywords: methane oxidation, denitrification, Baltic Sea, enrichment cultures, methanotrophs
Citation: Jakobs G, Labrenz M, Rehder G, Hietanen S, Kießlich K, Vogts A, Blumenberg M and Schmale O (2016) A Bioreactor Approach to Investigate the Linkage between Methane Oxidation and Nitrate/Nitrite Reduction in the Pelagic Oxic-Anoxic Transition Zone of the Central Baltic Sea. Front. Mar. Sci. 3:145. doi: 10.3389/fmars.2016.00145
Received: 11 May 2016; Accepted: 29 July 2016;
Published: 23 August 2016.
Edited by:
Frank Wenzhöfer, Alfred Wegener Institute for Polar and Marine Research, GermanyReviewed by:
Anna Lichtschlag, National Oceanography Centre, UKStefan Sommer, GEOMAR Helmholtz Centre for Ocean Research Kiel (HZ), Germany
Copyright © 2016 Jakobs, Labrenz, Rehder, Hietanen, Kießlich, Vogts, Blumenberg and Schmale. This is an open-access article distributed under the terms of the Creative Commons Attribution License (CC BY). The use, distribution or reproduction in other forums is permitted, provided the original author(s) or licensor are credited and that the original publication in this journal is cited, in accordance with accepted academic practice. No use, distribution or reproduction is permitted which does not comply with these terms.
*Correspondence: Gunnar Jakobs, gunnar_jakobs@freenet.de
Oliver Schmale, oliver.schmale@io-warnemuende.de
†Present Address: Gunnar Jakobs, Department of Environmental Sciences, University of Helsinki, Helsinki, Finland;
Martin Blumenberg, Federal Institute for Geosciences and Natural Resources (BGR), Hannover, Germany