Ecology and Pathology of Novel Plaque-Like Growth Anomalies Affecting a Reef-Building Coral on the Great Barrier Reef
 Lisa A. Kelly
 Tom Heintz
 Joleah B. Lamb
 Tracy D. Ainsworth
 Bette L. Willis
- 1Marine Biology and Aquaculture, College of Marine and Environmental Sciences, James Cook University, Townsville, QLD, Australia
- 2Australian Research Council Centre of Excellence for Coral Reef Studies, James Cook University, Townsville, QLD, Australia
- 3Australian Institute of Marine Science at James Cook University, Townsville, QLD, Australia
- 4Department of Ecology and Evolutionary Biology, Cornell University, Ithaca, NY, USA
Here we identify ecological and structural characteristics of a novel plaque-like growth anomaly (GA) at outbreak levels in a population of the staghorn coral, Acropora muricata, on the Great Barrier Reef. The smooth appearance of the plaques results from thickening of skeletal structures comprising the coenosteum, leading to infilling of spaces between corallites, and was associated with hyperplasia and hypertrophy of calicodermal cells. This resulted in a two-fold reduction in corallite height, a 1.6-fold increase in corallite width, and a 2.3-fold increase in the thickness of the calicodermal layer compared to healthy corallites. Plaque-like GAs affected ~67% of corals surveyed, and on average, encased 50% of the surface area of diseased branches. Progression rates along branches averaged 0.22 mm day−1 over a 2.5-month period. GAs spread throughout colonies but their presence did not affect the linear extension rates of branches. Reproductive products were absent in 55% of GA tissues, and when present, mean oocyte and spermary numbers were reduced by 50%. However, when present, mean sizes of oocytes and spermaries did not differ between healthy and GA tissues. Symbiodinium densities were also reduced by 50% in polyps within GA tissues, which were characterized by an absence of polyp structure and chaotic arrangement of gastrovascular canals, compromising host nutrition. A three-fold increase in stores of the immune-related precursor, prophenoloxidase, within GA tissues compared to healthy tissue suggests a primed immune response. Concomitantly, only 35% of prophenoloxidase was converted to the active enzyme phenoloxidase compared to 81% in healthy tissues, consistent with inhibition of immune-related enzymatic reactions by an unknown causative agent. The increasing frequency of emerging disease hotspots highlights the importance of understanding sublethal effects of diseases that have important implications for the fitness and long-term resilience of coral populations.
Introduction
Coral diseases are widespread on Indo-Pacific reefs, however disease prevalence is typically low (Harvell et al., 1999, 2002; Willis et al., 2004; Aeby et al., 2011a), unlike other regions, particularly the Caribbean, where coral disease is recognized as a significant factor inducing high levels of mortality (Aronson and Precht, 2001). Despite low overall disease prevalence, disease “hotspots” have been identified on Indo-Pacific reefs and linked to locally increased anthropogenic impacts (Kaczmarsky, 2006; Kaczmarsky and Richardson, 2007; Haapkyla et al., 2009; Aeby et al., 2011a; Lamb et al., 2014, 2015; Pollock et al., 2014). The increasing frequency of localized disease events highlights the need to understand the underlying causes and consequences of coral diseases if further outbreaks are to be effectively managed and prevented.
Growth anomalies (GAs) affect corals from all reef regions globally (Coles and Seapy, 1998; Work and Rameyer, 2005; Work and Aeby, 2006; Work et al., 2008; McClanahan et al., 2009; Aeby et al., 2011a; Irikawa et al., 2011; Stimson, 2011). GAs are considered to be a chronic disease, with slow onset and typically low levels of whole-colony mortality (Stimson, 2011), however GAs generally have a negative effect on coral fitness, and thus may affect long-term resilience of coral populations (Yamashiro et al., 2000, 2001; Domart-Coulon et al., 2006; Stimson, 2011; Yasuda et al., 2012). Currently, the etiology, pathogenesis, and transmissibility of GAs are unknown (Kaczmarsky and Richardson, 2007), although hypotheses about their potential causes are wide-ranging, including fungal infections (McClanahan et al., 2009), microbial pathogens (Kaczmarsky and Richardson, 2007), age-related cellular degradation (Irikawa et al., 2011), UV light (Coles and Seapy, 1998), and anthropogenic effects (Coles and Seapy, 1998; Breitbart et al., 2005; McClanahan et al., 2009; Aeby et al., 2011a; Irikawa et al., 2011). Several studies have documented the presence of GAs in areas where extreme environmental conditions occur (Loya et al., 1984; McClanahan et al., 2009; e.g., extremes of turbidity and temperature) or where anthropogenic stress is heightened (Aeby et al., 2011a), leading to speculation that stress may facilitate the initiation of GAs. However, different causative agents are potentially involved in the onset and development of GAs under differing scenarios.
Numerous forms of GAs have been described, based on differences in morphological and histological patterns, and reported under a variety of names (including neoplasia, hyperplasia, calicoblastic epithelioma, tumors, or skeletal tissue anomalies) depending on the researcher, the reef location, and coral species (Work and Aeby, 2006). Typically, GAs are readily recognizable as distinct protuberances on a coral colony. Protuberances are generally characterized by chaotic skeletal and polyp abnormalities, as well as proliferation of the coenosteum, i.e., the collective skeletal elements between corallites (Irikawa et al., 2011; Yasuda et al., 2012). Proliferation of the basal body wall, particularly the calicodermal layer (the epidermal layer involved in deposition of the skeleton), is also characteristic of raised GAs and is presumed to cause proliferation of coenosteal skeletal elements (Domart-Coulon et al., 2006; Work et al., 2008; Burns and Takabayashi, 2011; Yasuda and Hidaka, 2012). Apoptotic pathways were found to be suppressed and cell proliferation stimulated in oral gastrodermal and calicodermal layers within GAs compared to healthy regions of Porites australiensis and Montipora informis (Yasuda and Hidaka, 2012). Such altered cellular kinetics in calicodermal cells may be a contributing factor to hyperplastic basal body walls found in association with skeletal anomalies (Yasuda and Hidaka, 2012). Skeletal density is typically reduced in raised GAs as a consequence of more rapid rates of linear extension of skeletal elements but comparatively slower rates of infilling in areas of anomalous tissues (Bak, 1983; Domart-Coulon et al., 2006; Burns and Takabayashi, 2011). Interestingly, GAs occur most commonly within the coral family Acroporidae, possibly because of their fast growth rates (Bak, 1983; Coles and Seapy, 1998; Yamashiro et al., 2000; Work et al., 2008; Aeby et al., 2011a; Burns and Takabayashi, 2011).
Other characteristic changes in tissues affected by GAs include reductions in Symbiodinium densities (Peters et al., 1986; Yamashiro et al., 2000; Gateno et al., 2003; Domart-Coulon et al., 2006; Work et al., 2008; Burns and Takabayashi, 2011; Stimson, 2011; Burns et al., 2013), increased mucus production (Breitbart et al., 2005) and the presence of bacterial aggregates (Breitbart et al., 2005; Domart-Coulon et al., 2006). Moreover, GAs potentially affect coral fecundity, as GA formation and growth may compete for resources typically allocated to the development of gametes (Domart-Coulon et al., 2006; Yasuda et al., 2012). Reductions in polyp fecundity in GA compared to healthy tissues in studies of corals on reefs in Japan (Yamashiro et al., 2000; Irikawa et al., 2011; Yasuda et al., 2012) and Hawaii (Domart-Coulon et al., 2006; Work et al., 2008) support this hypothesis. Chromophore cells, which are pigmented cells forming part of the innate immune response of invertebrates (Nappi and Christensen, 2005), have also been shown to infiltrate the calicodermis in coral GAs (Domart-Coulon et al., 2006; Yasuda and Hidaka, 2012).
The melanization cascade, also known as the prophenoloxidase-activating system, involves the conversion of prophenoloxidase to phenoloxidase (PO), resulting in the deposition of melanin at sites of injury or where pathogens are detected (Cerenius et al., 2008). Melanin acts to barricade or encapsulate foreign material, which is then engulfed and phagocytized by amoebocytes (Nappi and Christensen, 2005; Cerenius et al., 2008). In the Anthozoa, these cells may contain melanin granules, and are present in the mesoglea of both sea fans and some hard corals (Mydlarz et al., 2008, 2010; Palmer et al., 2008, 2010). An assay for measuring enzymes involved in the PPO-cascade (i.e., PPO and PO) has recently been adapted for corals (Mydlarz et al., 2008; Palmer et al., 2008, 2010, 2011a,b; Mydlarz and Palmer, 2011). Patterns in enzyme activity among representative species from a range of coral families have been correlated with empirical patterns of disease prevalence to provide further support for the notion that the PPO assay is a useful indicator of disease susceptibility (Palmer et al., 2010). The PPO-cascade has been looked at in corals with yellow band disease, white syndrome and bleaching (Mydlarz et al., 2009; Palmer et al., 2011a), but never before in corals containing skeletal GAs.
The increasing number and intensity of stressors affecting corals within the Great Barrier Reef (GBR) highlight the need for greater understanding of disease resistance, immune responses, and disease etiology in corals. However, there has been very little research on the morphological characteristics or physiological impacts of GAs on corals within the GBR region. The discovery of a localized outbreak of GAs on a mid-shelf reef within the central GBR provided an important opportunity to study the morphology and physiological impacts of GBR GAs. Here, we characterize GAs affecting the staghorn coral Acropora muricata and their effect on the innate immune system of the host. Specifically, our aims in this study were to: (1) evaluate change in prevalence of GAs over 2 years, (2) compare the prevalence of GAs within this hotspot to other reefs adjacent to our study area, (3) evaluate the impact of GAs on fecundity and growth rates of coral colonies, (4) document characteristic morphological changes in tissues and skeletal structures associated with GAs, and compare these with descriptions from other reef regions, and (5) determine if the innate immune system of host corals is altered in the presence of GAs. Overall, this study enhances current understanding of the sublethal effects GAs have on host physiology on Indo-Pacific reefs.
Materials and Methods
Study Site and Sample Collection
Our study site was located on a mid-shelf reef (Hardy reef: 19°46's, 149°15'E) in the central sector of the Great Barrier Reef Marine Park (GBRMP). A moored pontoon and a smaller secondary pontoon at the site provide facilities for snorkelers, divers and visitors for day and night visits. The study site comprised a patch of reef slope situated next to the secondary pontoon (not in use at the time of our surveys) at a depth of 7 m. Staghorn colonies of the scleractinian coral A. muricata are common on the reef slope, and a stand of this species (~40 m2) located next to the secondary pontoon was particularly impacted by GAs. The study was conducted over 2 consecutive years (September-November 2010 and July 2011). For immunological, histological, and skeletal parameters described in sections below, samples were collected during either Survey 1 (September 2010) or Survey 2 (July 2011). In all cases, sampling involved haphazard selection of colonies or branches, or haphazard placement of transects.
Prevalence and Severity of GAs
To determine the prevalence of GAs within the A. muricata stand, a belt transect (15 × 2 m) was laid along the reef slope parallel to the reef crest. The numbers of healthy and diseased (with at least 1 GA) colonies were recorded in both years to determine if GA prevalence changed through time (September 2010 vs. July 2011). To evaluate if GA prevalence within the A. muricata stand was representative of surrounding reefs, coral disease was also surveyed near the main Hardy Reef pontoon on three occasions encompassing our study period (July 2009, February and August 2011; see methods in Willis et al., 2004). Prevalence was calculated by dividing the number of colonies with one or more GAs by the total number of colonies recorded on the transect.
To quantify GA severity (defined as the proportion of branches encased by GAs), the length of GAs on 3 branches from each of 10 colonies, along with branch length, were measured to the nearest mm (Survey 1) with a flexible measuring tape. The proportion of each branch encased by one or more growth anomalies was calculated and the number of GAs per branch counted.
Progression Rate of GAs
To measure GA progression rate along branches, 3 GAs on each of the 10 colonies used to quantify GA severity were numbered using plastic cable ties and small labels. Each GA (n = 30) was photographed three times from a standard angle at approximately monthly intervals (9/09/2010, 14/10/2010, 17/11/2010; Figure 1). In each photograph, the linear distance the GA extended along the host branch was calculated in ImageJ(™) (National Institute of Mental Health, Bethesda, Maryland, USA), using the standard width of the cable tie in each image as a scale (width = 5.0 mm). GA progression rate along a branch was calculated as the difference between two linear distances divided by the number of days elapsed between sampling times.
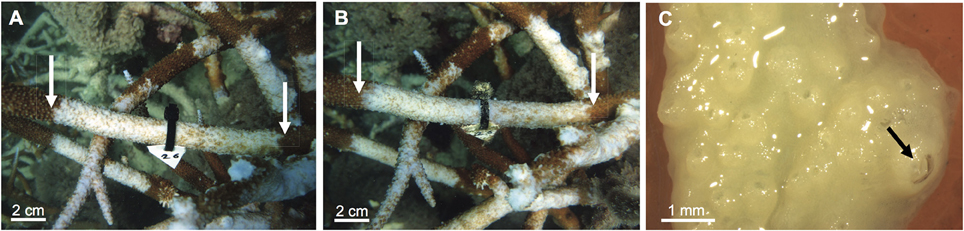
Figure 1. Field photographs to quantify the progression rate of a tagged plaque-like growth anomaly on a colony of Acropora muricata between (A) September 2010 and (B) October 2010. White arrows denote the linear extent of the growth anomaly lesion. (C) Microscopic image of decalcified tissues of A. muricata showing the presence of a barnacle causing further tissue deformation (arrow) within a growth anomaly.
Influence of GAs on Colony Growth Rate
Linear growth rates of A. muricata branches with and without GAs were measured by tagging 3 branch tips on each of 4 healthy colonies and 4 diseased colonies (n = 12 healthy and 12 diseased branches in total). Plastic cable ties were fastened around each branch approximately 10 cm from the tip, and the distance to the tip measured to the closest millimeter using a flexible measuring tape at time 0 (14/10/2010) and 1 month later (17/11/2010). Linear extension rates were calculated as the difference in the two distances divided by the number of days elapsed.
Influence of GAs on Fecundity
Polyp fecundity was compared among branches in the following 3 health states: (1) healthy branches from colonies without GAs (healthy), (2) healthy areas of branches immediately adjacent to a GA (unaffected), and (3) lesion areas of branches with GAs (GA). Nine samples, each 5 cm long and from a different colony, were collected per health state, where GA and unaffected samples were paired from the same branches. All samples were collected at a minimum distance of 5 cm from branch tips to avoid reproductively sterile zones (survey 1 collection). Samples were preserved in 10% formalin seawater solution until decalcification. Following decalcification, 5 haphazardly-selected polyps from each sample were dissected and examined under a dissecting microscope (i.e., n = 45 polyps per health state). The numbers of oocytes and spermaries in each polyp were counted, and the sizes of 3 haphazardly selected eggs and spermaries from each polyp were measured using the image analyzing software Canvas 14 (ACD Systems of America, Miami, FL, USA). The area of each egg and spermary was calculated from images taken on an Olympus photomicroscope (New York, USA) and analyzed using the software QCapture Pro (Q Imaging, British Columbia, Canada).
Histopathological Characterization
Histological Preparation
Samples for quantification of Symbiodinium densities were collected in seawater-4% paraformaldehyde (4:1) solution, decalcified in 5% formic acid solution, and stored in 70% ethanol (survey 1 collection). Samples for evaluating calicodermal thickness were fixed in a seawater-4% paraformaldehyde (4:1) solution, decalcified using 20% ethylenediaminetetraacetic acid (EDTA) over several weeks, and then stored in 70% ethanol (survey 2 collection). Tissue samples were processed overnight using an automated histological tissue processor [wash protocol: 70% EtOH (1 h), 70% EtOH (1 h), 80% EtOH (1 h), 90% EtOH (1 h), 95% EtOH (1 h), absolute EtOH (1 h), absolute EtOH (1 h), absolute EtOH (1 h), xylene (1 h), and xylene (1 h)]. After processing, tissues were embedded in molten paraffin wax at 60°C under vacuum for 4 h. Five-micrometer thick longitudinal and transverse sections were mounted onto glass slides and stained using Mayer's haematoxylin and Young's eosin-erythrosin stain and then a Martius Scarlet Blue (MSB) trichrome stain (procedures modified from Bancroft and Gamble, 2008).
Quantifying Symbiodinium Densities
Symbiodinium densities were quantified microscopically from histological sections of: Healthy tissues from healthy colonies, and paired lesion and adjacent healthy tissue from GA branches (n = 5 samples per health state, each from a different colony; survey 1 collection). Slides were examined using an Olympus photomicroscope (New York, USA) at 4X–100X magnification, and the number of Symbiodinium cells enumerated along 3 histological transects (each 1 mm long) placed parallel to the gastrodermal layer within the coenosarc region (i.e., tissue between polyps).
Calicodermal Layer Thickness
To compare cellular characteristics of healthy and GA tissues, histological sections were stained with MSB, which stains the mesoglea blue thereby differentiating calicodermal and gastrodermal layers (n = 3 colonies sampled per health state; survey 2 collection). The calicodermal layer was photographed using an Olympus photomicroscope (40X magnification), and the software program Canvas 14 (ACD Systems of America, Miami, FL, USA) was used to measure thickness of the calicodermal layer along 5 histological transects, each 20 μm in length and parallel to the mesoglea, in each of three histological sections per health state. The outline of cells comprising the calicodermal layer was traced, giving the area of the layer adjacent to each 20 μm transect. This area was divided by the transect length (20 μm) to give the average calicodermal layer thickness. In addition, the number of calicoderm cells within a 250 μm2 area was counted for all transects.
Skeletal Characterization
Scanning Electron Microscopy
Samples for SEM analyses were fixed in a seawater-4% paraformaldehyde (4:1) solution, then coral skeletons (survey 2 collection) were bleached to remove all soft tissue using a 1:1 ratio of chlorine bleach to tap water. Subsamples of skeletons from branches with and without GAs were then mounted using the plastic conductive carbon cement Leit-C-Plast (ProSciTech, Australia™) and sprayed with gold. Samples were viewed and photographed using a scanning electron microscope (SEM; JEOL, Tokyo, Japan, model JSM5410LV) to compare topographical features of skeletons with and without GAs.
To determine if GAs affected porosity of the coenosteum (collective skeletal structures deposited between corallites), SEM micrographs were taken of healthy and GA skeletons (n = 3 skeletal samples, each from a different colony, per health state). Five replicate 1000 μm2 boxes (standardized to a 500 μm scale bar) were drawn on each photo, and the tracing tool in the software program Canvas 14 was used to trace the area of all perforations within the coenosteal network enclosed by these boxes. The summed area of all perforations within each box was then subtracted from the total area of the box, giving the area of coenosteum.
Corallite Measurements
Corallite dimensions were measured on skeletal samples under a stereomicroscope (Leica M3Z,) at 9X magnification. Five corallites were haphazardly selected from each of 8 healthy and 11 GA regions of branches (each branch from a different colony; survey 2 collection), and their widths and heights measured.
Immunological Characterization
To measure immune activity, tissue samples from 8 healthy and 11 diseased colonies were snap-frozen in liquid nitrogen and stored at −80°C until processing (survey 2 collection). Tissues (~4 cm2) were airbrushed into 10 ml extraction buffer (50 mM Tris-HCl, pH 7.8 with 50 mM dithiothreitol) over ice, homogenized for 45 s (IKA T10 Basic homogenizer, Malaysia) and centrifuged for 5 min at 3500 rpm. 1.5 ml of homogenate was then extracted and stored at −30°C until further processing. All assays were performed using a Spectromax M2 spectrophotometer (Molecular Devices, Sunnyvale, CA, USA).
Total Protein Assays
To determine the total amount of protein within each tissue sample, protein concentrations were determined using Bio-Rad DC™ bovine serum albumin (BSA) Kit II (Bio-Rad, Hercules, CA, USA; catalog number 500–0112). The assay was held at room temperature for 20 min to allow sufficient time for the reaction to take place, and then the endpoint absorbance at 750 nm was recorded (van de Water et al., 2015).
Phenoloxidase (PO) and Total Potential Phenoloxidase (tpPO) Assays
To measure PO activity, 20 μl of buffered tissue extraction from each sample was loaded into the wells of a 96-well microtiter plate in triplicate, followed by 40 μl of Tris buffer (50 mM, pH 7.8) and 25 μl of double distilled water (ddH20). After 20 min at room temperature, 30 μl of dopamine hydrochloride (10 mM, Sigma-Aldrich, St. Louis, MO, USA) was added. Controls (n = 6) comprised 20 μl of extraction buffer, 40 μl Tris buffer, 25 μl ddH20, and 30 μl dopamine (10 mM). Kinetic absorbance at 490 nm was determined at 5-min intervals for 45 min using the Spectramax M2 (Palmer et al., 2011a; van de Water et al., 2015). Enzymatic activity was calculated as change in absorbance using the linear portion of the 45 min reaction curve and standardized to each samples' total protein content (3 measures of enzymatic activity per sample).
Total potential phenoloxidase activity (tpPO) stored as the proenzyme PPO (van de Water et al., 2015) was measured identically, except that the 25 μl of double distilled water (ddH20) was replaced with 25 μl Trypsin [i.e., 1 ml of trypsin aliquot (Sigma-Aldrich, St. Louis, MO, USA) mixed with 39 ml ddH20]. For control samples, the 40 μl Tris buffer was replaced with 40 μl Trypsin.
Chromoprotein
Concentrations of compounds absorbing light at 588 nm, primarily non-fluorescent chromoproteins (Alieva et al., 2008), were quantified in healthy vs. GA tissues by placing 20 μl of buffered tissue extractions in triplicate in a 384 well black/clear microplate (Corning, USA, catalog number 3764). Three controls (9 wells) containing 20 μl of extraction buffer were also plated. The plate was read using the Spectramax M2, with the endpoint absorbance set at 588 nm (Alieva et al., 2008). Chromoprotein levels were standardized and calculated from each samples' total protein content.
Data Analyses
Mean number of eggs and spermaries per polyp and the mean diameter of eggs and spermaries were compared among the three health states (GA, unaffected, healthy) using one-way analyses of variance (ANOVA) on ranks (Kruskal–Wallis), as data did not meet assumptions of homogeneity of variances (Levene's test: p < 0.05). Differences in the mean growth rate of branches between the two health states (GA vs. Healthy) were compared using a two-factor nested ANOVA, where colonies were nested within their respective health states. Data were square-root transformed to meet assumptions of normality and homogeneity of variances. Post-hoc comparisons of group means were conducted using a Steel-Dwass test for a non-parametric ANOVA, and using a Tukey-Kramer's Honestly Significant Difference (HSD) test for parametric ANOVAs. Differences in mean calicodermal layer thickness, mean density of calicoderm cells per 250 μm2, mean corallite height and width, mean coenosteal surface area, mean enzymatic activity of phenoloxidase and prophenoloxidase, and mean levels of chromoprotein were all compared between GA and healthy samples using t-tests. All statistical analyses were conducted using Statistica 10 (Statsoft, Tulsa, OK, USA). All means are presented with standard errors of the means (SE).
Results
Macroscopic Description of Plaque-Like GAs
GAs found on the branching coral A. muricata at our study site were characterized as multifocal, colony-wide growths with distinct edges and undulating margins (as per terminology recommended by Work and Aeby, 2006). They consisted of smooth white patches of undifferentiated tissue and skeleton that had irregular shapes and sizes and encased coral polyps. Although raised GAs have a similar smooth appearance, their protuberant profile differs from the flatter, branch-enveloping GAs observed in our study, which have not been reported previously on the GBR. Macroscopically, GAs on A. muricata appear as smooth white tissue and skeleton overlying coral polyps, which remain present (Figures 1A,B) but are morphologically less distinct than normal polyps because of infilling of tissue and skeleton between polyps and corallites. In decalcified sections, the polyp shape was less apparent, because infilling by unstructured coenosarc tissues obscured polyp calices (Figure 1C).
Prevalence and Severity of GAs
The prevalence of GAs on A. muricata at our study site near a secondary, unused tourist platform was similar in the 2 years, i.e., 64.7% in 2010 and 68.8% in 2011 (n = 419 and 336 colonies surveyed, respectively). In contrast, GA prevalence on nearby parts of the reef was dramatically lower, between 0 and 0.2% in 3 surveys spanning our study period (n = 1113 corals surveyed in July 2009; n = 1031 corals surveyed in February 2011; n = 606 corals surveyed in August 2011; JL, unpubl. data). Typically, most corals located within 3 meters of the diseased patch of A. muricata were completely healthy in appearance.
Mean proportion of branch surface area encased by GAs within a colony ranged from 13.5% (±2.9%) to 75.4% (±12.0%). For diseased branches, the mean linear proportion of branch surface area encased by GAs was 50.8% (±4.9%). The abundance of GAs ranged among colonies from 1 to 3 per branch (1.4 ± 0.1 GAs per branch). On average, GAs were 13.5 cm (±1.8 cm) long, and there was no association between total branch length and either percent coverage (r = −0.11, p = 0.55) or number of GAs (r = −0.33, p = 0.86) per branch.
Progression Rate of GAs
Mean linear progression rate of GAs was 0.22 (±0.06) mm day−1 in 2010 (Survey 1: 69 days), ranging from 0.19 (±0.03) to 0.26 (±0.10) mm day−1 in September and November 2010. The maximum progression rate of 2.77 mm day−1 occurred when two GAs separated by healthy tissues in September 2010 fused to create one continuous GA in November 2010; this was a unique case. No association was found between the initial size of GAs and progression rate (r = 0.05; p = 0.776).
Influence of GAs on Colony Growth Rate
For diseased colonies of A. muricata, the presence of GAs on a branch had no effect on linear extension over the 33 days they were monitored (F = 0.38, df = 1, p = 0.555), although on average, mean linear growth rate of healthy branches (0.21 ± 0.06 mm day−1) was slightly higher than that of diseased branches (0.19 ± 0.09 mm day−1). Similarly, linear extension rates did not differ significantly between diseased vs. healthy colonies in general (F = 0.57, df = 7, p = 0.770).
Influence of GAs on Fecundity
Oocytes and spermaries were absent in all polyps in 55% of GA tissues examined (n = 45 polyps). In comparison, oocytes were present in 100% of polyps in both healthy colonies and healthy regions adjacent to GAs (n = 45 polyps in each health state). Spermaries were absent in only one polyp of a healthy colony and two polyps in healthy regions adjacent to GAs. Mean number of oocytes per polyp was significantly higher in both healthy branches and healthy regions adjacent to GAs (7.2 ± 0.3 and 7.5 ± 0.3 eggs per polyp, respectively) than in GA tissues (2.8 ± 0.5 eggs per polyp; H = 41.39, p < 0.001; Figure 2A). The number of spermaries was also greater in healthy branches and healthy regions adjacent to GAs (2.2 ± 0.1 and 2.6 ± 0.2 spermaries per polyp, respectively) compared to GA tissues (1.1 ± 0.2 spermaries per polyp; H = 26.09, p < 0.001; Figure 2A).
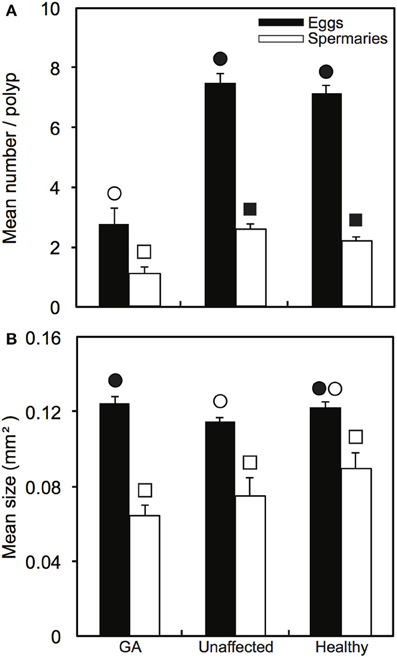
Figure 2. Comparison of reproductive parameters (means ± SE) among healthy and diseased colonies, including paired growth anomaly (GA) and adjacent unaffected regions: (A) number of oocytes and spermaries produced per polyp (n = 45 polyps per health state); and (B) sizes of oocytes (n = 33, 53, 48 respectively) and spermaries (n = 42, 75, 75, respectively). Symbols of the same shape indicate statistical comparisons. Significant comparisons are indicated by differences in symbol colors.
When present, mean oocyte size in GA-affected polyps (0.125 ± 0.064 mm2) was significantly greater than in polyps from healthy regions adjacent to GAs (0.114 ± 0.075 mm2; H = 9.13, p < 0.05; Figure 2B), but did not differ from mean oocyte size in healthy branches (0.122 ± 0.089 mm2, H = 9.13, p > 0.05). Spermary size did not differ among health states (H = 5.34, p > 0.05), although mean spermary size was slightly smaller in GA-affected polyps (0.064 ± 0.005 mm2) than healthy polyps (0.089 ± 0.008 mm2; Figure 2B).
Quantifying Symbiodinium Densities
Symbiodinium densities (cells mm−1) were two-fold lower in polyps within GA tissues (100 ± 32) than in healthy polyps, either from healthy branches or healthy regions next to GAs (190 ± 49 and 197 ± 53, respectively). No Symbiodinium cells were detected in two polyps associated with GAs from two different branches (Figure 3A), whereas typical Symbiodinium densities were detected in both healthy branches and healthy tissues from diseased branches (Figure 3B).
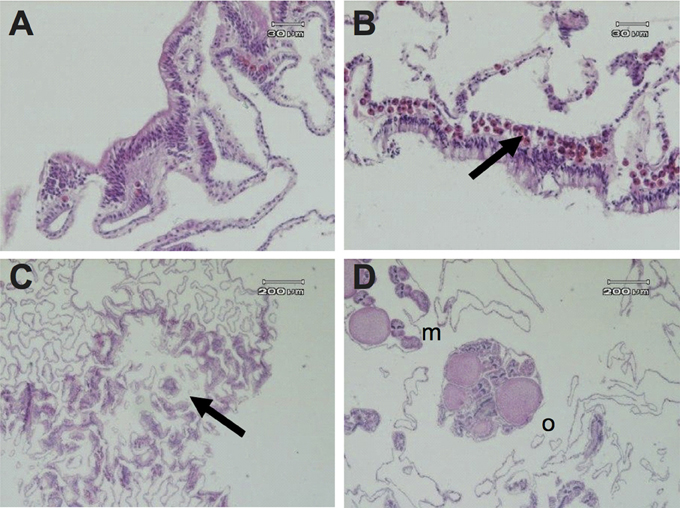
Figure 3. Histological micrographs of A. muricata tissues depicting: (A) absence of Symbiodinium cells in the gastrodermis of a colony with a growth anomaly; (B) presence of Symbiodinium cells in the gastrodermis of a healthy colony; (C) deficiency of polyp structure (arrow) and chaotic arrangement of gastrovascular canals in GA tissue; (D) healthy tissue with eggs (o) and mesenteries (m) in a colony with a GA.
Microscopic Description
Histological studies confirmed that plaque-like GAs induce substantial reductions in polyp structures, including the absence of mesenteries, oocytes, and spermaries (Figure 3C). Moreover, chaotic arrangement of mesenteries and increased complexity of the gastrovascular canal network as a consequence of hyperplasia of the basal body wall were observed in the majority of GA tissues, in comparison to healthy tissues from either diseased branches or healthy colonies (Figure 3C). However, polyps in four GA samples (27%, n = 15 polyps) were found to have normal morphologies (Figure 3D).
Calicodermal Layer Thickness
Hypertrophy of cells (an increase in the thickness of cells; see Supplementary Figure) was observed within the calicodermal layer, the polyp's aboral epidermal layer associated with the production of its external skeleton. The mean thickness (±SE) of the calicodermal layer was more than two-fold greater in GA tissues (5.59 ± 0.39 μm) compared to healthy tissues [2.38 ± 0.16 μm; t(28) = 7.54, p < 0.001; Figure 4A]. Hyperplasia (an increase in the number of cells per transect) was also observed, reflecting a change in calicodermal cell shape from squamous to more columnar-like; mean number of cells was 3.6-fold greater in GA tissues (2.76 ± 0.21) compared to healthy tissues (0.76 ± 0.10; Figure 4B).
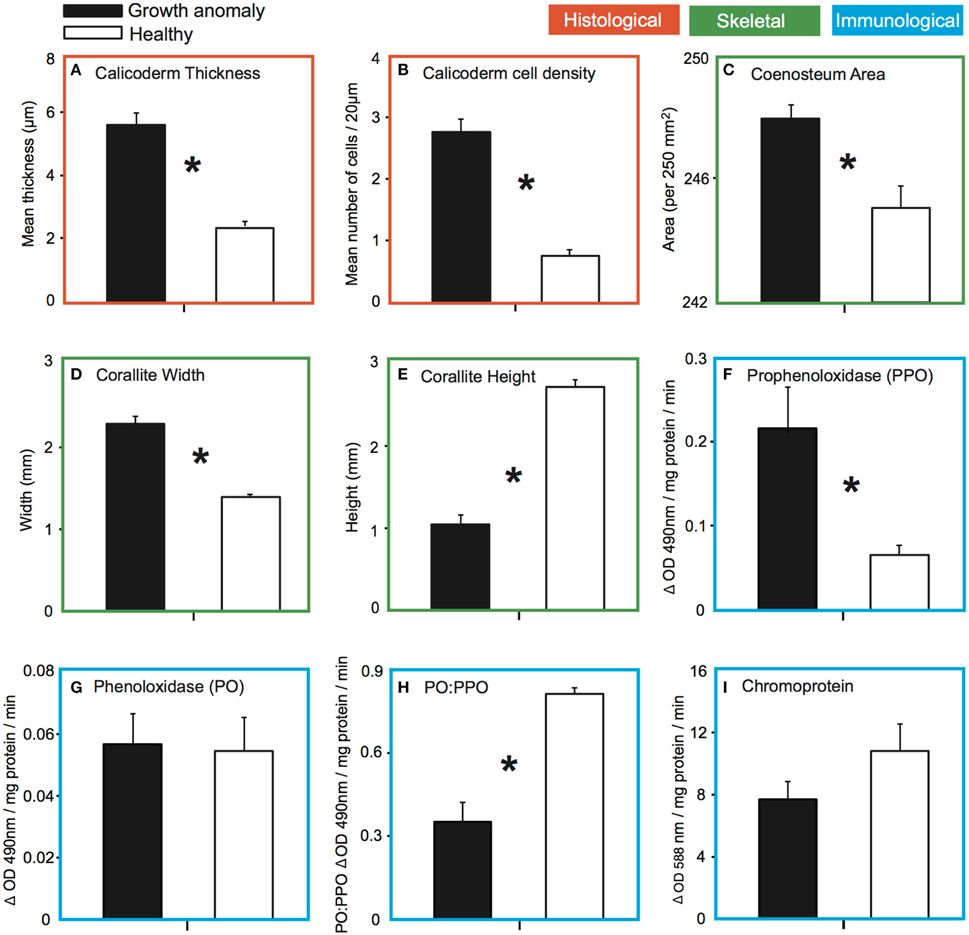
Figure 4. Comparison of the mean (±SE) for: (A) thickness of the calicodermal layer of growth anomaly (n = 15) and healthy tissue (n = 15); (B) density of calicodermal cells within the calicodermal layer of growth anomaly (n = 15) and healthy tissues (n = 15); (C) surface area of the coenosteum per 250 mm2 from skeletal regions with growth anomalies (n = 15) vs. healthy regions (n = 15); (D) corallite width and (E) height in skeletal regions of branches with growth anomalies (n = 11) vs. without growth anomalies (n = 8); (F) change in enzymatic prophenoloxidase and (G) phenoloxidase activity per mg of protein of tissues with growth anomalies (n = 11) vs. healthy tissues (n = 8); (H) conversion (ratio) of prophenoloxidase to phenoloxidase between growth anomaly (n = 11) and healthy (n = 8) tissue; and the (I) amount of chromoprotein in growth anomaly (n = 11) and healthy (n = 8) tissue samples of A. muricata. Asterisks indicate significant differences for α = 0.05.
Skeletal Characterization
Septa of corallites were typically thickened in GA samples (Figure 5A) compared to healthy samples (Figure 5B). GA skeletons were also characterized by: (1) a more solid-looking coenosteum due to thickening of the elements forming the coenosteal network, which concomitantly resulted in infilling of spaces within the network (Figure 5C); (2) thickened corallite walls (Figure 5E); and (3) development of elaborate, thickened spinules on the surface of the coenosteal network, creating a reticulate pattern (Figures 5C,E), in contrast to the comparatively linear costate ridges characteristic of skeletons from healthy branches (Figures 5D,F). The surface area of skeleton comprising the coenosteal network was significantly greater in GA skeletons (247.95 ± 0.39 mm2) compared to healthy skeletons [244.98 ± 0.68 mm2; t(28) = 3.77, p < 0.001; Figure 4C].
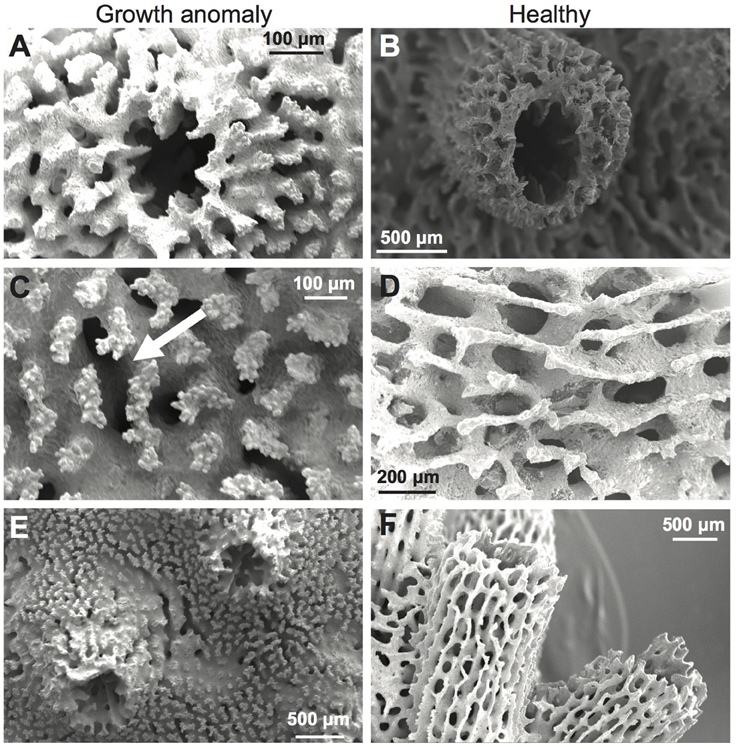
Figure 5. Scanning electron micrographs (SEMs) of A. muricata skeletons with (A,C) and without (B,D) growth anomalies. (A,B) Septa, corallite walls, and coenosteal networks; note raised wall in normal skeleton. (C,D) Coenosteum; in GA, note thickened coenosteum with elaborate thickened spinules (arrow), compared to linear costate ridges in healthy skeleton. (E,F) Overall coenosteum and corallite appearance.
Greater deposition of CaCO3 on microstructures comprising the outer corallite walls (i.e., synapticulae; Wallace, 1999) was observed in GA skeletons compared to healthy regions of branches (Figure 5C vs. Figure 5D). Correspondingly, mean outer diameter (width) of corallites was significantly greater in GAs (2.30 ± 0.08 mm) than in skeletons of healthy regions [1.39 ± 0.11 mm; t(17) = 3.71, p = 0.001; Figure 4D]. In contrast, greater CaCO3 deposition on coenosteal structures filled in spaces between corallites, resulting in a two-fold decrease in mean corallite height above the surrounding coenosteum within GAs (1.04 ± 0.03 mm; Figure 4E) compared to healthy regions [2.71 ± 0.08 mm; t(17) = −3.73, p = 0.001].
Immunological Characterization
Mean levels of PO activity (standardized per mg protein) did not differ significantly between GAs (0.056 ± 0.010) and healthy tissues [0.055 ± 0.011; t(17) = −0.164, p = 0.871; Figure 4G]. However, total potential PO activity (tpPO), as measured by converting the inactive PPO zymogen to the active PO form (van de Water et al., 2015), was significantly greater in GA tissue (0.215 ± 0.055) compared to healthy tissue [0.066 ± 0.011; t(17) = −2.30, p = 0.034; Figure 4F]. Correspondingly, the ratio of PO activity to tpPO activity (an indicator of how much of the PPO in the sample has been converted to PO) differed between health states; approximately 81% (±2.0% SE) of the total potential PO activity had been converted to PO in healthy samples compared to only approximately 35% (±7.0% SE) in GA samples (Figure 4H).
Chromoprotein activity (standardized per mg protein) did not differ significantly between GA (7.71 ± 1.10) and healthy tissue [10.82 ± 1.74; t(17) = −1.57, P = 0.133; Figure 4I], consistent with the lack of a pigmentation response in macroscopic observations of coral samples at the time of collection.
Discussion
Here we provide the first detailed characterization of a novel type of GA and its effects on the physiology of the branching coral A. muricata. Smooth, plaque-like GAs have not been recorded previously on the GBR, suggesting that it may represent a new type of anomalous growth on corals. Contrary to previous studies, which reported low (< 1%) prevalence of GAs on reefs throughout the Indo-Pacific (Aeby et al., 2011a) and minimal impact on coral health in comparison to more virulent diseases like black band disease and white syndromes, we found that the prevalence of plaque-like GAs can be exceptionally high (65–68%) at localized scales. Moreover, the presence of up to three GAs per branch, each with a mean linear length of 13.5 cm (±1.8 SE), typically encased more than 50% of the length of branches.
Although the prevalence of GAs on A. muricata was remarkably high, their rates of progression were slow (0.22 mm day−1 ± 0.06 SE) compared to other coral diseases. Nevertheless, progression rates of these plaque-like GAs are much greater than the extremely slow progression rates (0.006–0.12 mm day−1) reported for spherical growth anomalies from the Gulf of Oman, Indian Ocean (Coles and Seapy, 1998), and Key Largo, Florida (Peters et al., 1986), as well as for GAs on Porites compressa in Hawaii (0.03 mm day−1) (Stimson, 2011), and on P. australiensis (including dead areas) in Okinawa, Japan (5.3 ± 2.9 cm2yr−1) (Yasuda et al., 2012). Despite their extensive development, the presence of plaque-like GAs on A. muricata had no overall effect on linear extension of branches, a finding consistent with studies of the effects of other types of GAs on the growth rates of acroporid corals at Lizard Island, Australia (Page, 2009), and at Amuro Island, Okinawa, Japan (Irikawa et al., 2011). In contrast, the presence of tumors significantly suppressed the growth of Acropora sp. in Guam (Cheney, 1975), and the proximity of neoplasias to branch tips reduced linear growth of Acropora palmata (Bak, 1983). Similarly, growth rates of healthy branches of Porites that had tissues continuous with branches infected with GAs were reduced by 50% compared to healthy branches not in continuous tissue contact with GA-infected branches (Stimson, 2011). Overall, although rates of progression appear to be universally slow, the impact of different GA types on colony growth varies among species.
We found that the presence of GAs significantly reduced the reproductive output of A. muricata, completely inhibiting the development of eggs and spermaries in polyps associated with GA tissues in 55% of branches examined (n = 9 branches). In comparison, eggs were present in all polyps and spermaries in all but a few polyps examined in healthy colonies and in healthy regions adjacent to GAs. Our finding that GAs suppress reproduction is corroborated by other studies, which have reported that oocytes were absent in most tumorous polyps in M. informis and Acropora cytherea in Japan (Yamashiro et al., 2000; Irikawa et al., 2011), gonads were significantly fewer in number in Acropora GAs in Hawaii and American Samoa (Work et al., 2008), and oocytes were completely absent in both GA tissues and healthy tissues adjacent to GAs in A. muricata in the Northern GBR (Page, 2009). While no difference in spermary size was observed in the current study when spermaries were present, the maximum diameter of spermaries in polyps of P. australiensis within GAs was significantly smaller than in healthy polyps on Okinawan reefs in Japan (Yasuda et al., 2012). The variable impact of GAs on reproductive output found in these studies confirms that GAs may differ in characteristics influencing resource allocation in different coral species.
The formation of GAs on branches of A. muricata involved accretion of skeleton that infilled the normally porous coenosteal network between corallites to produce the macroscopically smooth, plaque-like appearance of GAs at our study location. SEM imaging also revealed the presence of elaborate spinules built up on coenosteal ridges of GAs. The resulting reticulate appearance differs markedly from the typical costate ridges of coenosteum laid down by healthy tissues. Infilling of spaces within the coenosteal network and the development of coenosteal spines were also observed for protuberant GAs in Okinawa, Japan (Irikawa et al., 2011), suggesting that the calcification process may be similarly modified in both plaque-like and protuberant GAs. In our study, the accumulation of coenosteum in GAs resulted in corallites becoming engulfed and obscured. As a consequence, the height of corallites above the coenosteum was reduced and their outer diameter was significantly increased compared to corallites of healthy polyps. In a study on Okinawan reefs, numerous changes in the skeletal architecture of P. australiensis, including the enlargement of both calices and the coenosteum, and the deformation of corallite structures, changed the skeletal pattern from cerioid (shared corallite walls) to plocoid (corallites separated by coenosteum; Yasuda et al., 2012). Other studies have also found changed corallite and calice dimensions as a consequence of proliferating coenosteum, as well as fused coenosteal structures (Burns and Takabayashi, 2011; Irikawa et al., 2011; Yasuda et al., 2012).
Histological examination of plaque-like GAs in the current study revealed evidence of both hypertrophy (increased size of cells) and hyperplasia (increased number of cells) of calicodermal cells. As the calicodermal layer is associated with the deposition of the external skeleton of corals, increases in the number and size of cells may lead to increased deposition of skeleton, which would explain the proliferating coenosteum observed in GAs. Thickening of the aboral tissue layer was also observed in GAs associated with P. compressa and attributed to a shift from flattened to cuboidal cells in the calicodermal layer (Domart-Coulon et al., 2006). Importantly, hyperplasia of the basal body wall and increased complexity of the gastrovascular canal network, as found for GAs in P. compressa and in Indo-Pacific Acropora (Work et al., 2008), may increase the flow of energy to GA polyps from polyps in adjacent healthy tissue, thereby supporting enhanced calcification in GA regions (Domart-Coulon et al., 2006). Such enhanced energy flow could underlie a trade-off between increased calcification and reduced polyp fecundity within GA tissues when energy budgets are limited, particularly given the two-fold reduction in Symbiodinium cells found in GA tissues.
Histological observations confirm that the impacts of GAs on polyp structure are variable, with some polyps lacking structure, whereas others appear apparently normal. In contrast, two-fold depletion of Symbiodinium cells in the gastrodermis of GA tissues associated with A. muricata appears to be a common characteristic of coral GAs (Domart-Coulon et al., 2006; Work et al., 2008; Irikawa et al., 2011). Increased complexity and chaotic arrangement of the gastrovascular canal network, combined with the absence of polyp structure, are features previously observed on Acropora sp. affected with GAs (Work and Rameyer, 2005).
We hypothesized that differences in the presence of enzymes associated with the PPO-activating cascade, an important component of invertebrate innate immune responses (Cerenius et al., 2008), might shed light on whether or not a causative agent is associated with GA formation. Although we found no significant difference in levels of the active enzyme PO, levels of the zymogen (i.e., the inactive enzyme precursor) PPO were elevated in GA tissues compared to healthy tissues. Elevated levels of PPO have also been observed in bleached colonies of Montastraea faveolata, and were speculated to reflect either stimulation by calcium as a consequence of the down-regulation of genes that regulate calcium levels in bleached tissues, or suppression of host immune responses by Symbiodinium to enable their persistence in host tissues undergoing bleaching (Mydlarz et al., 2009). In either case, the three-fold greater stores of PPO detected in GA tissues in our study indicate the presence of a primed immune response. Further study into factors causing this primed immune response would be valuable in helping to define the etiology of this disease.
The continuous presence of large numbers of nesting seabirds concentrated on tourism platforms, such as the unused pontoon at our study site, has been hypothesized to cause nitrogen and phosphorus enrichment at local scales from solution of bird guano deposits (Lamb and Willis, 2011), similar to enrichment found at remote Arctic sites as a consequence of transport of nutrient sources by sea birds (Blais et al., 2005). Nutrient enrichment has been shown to increase coral disease prevalence (Bruno et al., 2003; Williams et al., 2010; Aeby et al., 2011b; Kaczmarsky and Richardson, 2011), potentially by increasing the virulence of pathogenic microorganisms when corals are immunocompromised (Bruno et al., 2003). An Indo-Pacific-wide analysis of GA prevalence in relation to different environmental parameters recently found that human population size (a proxy for degraded water quality) was a major driver of Porites GAs, along with high host density (Aeby et al., 2011a). While anthropogenic stressors were not specifically evaluated in the course of this study, the presence of a tourist pontoon directly adjacent to this hotspot of growth anomalies warrants further investigation. To date, a laboratory study has found that GAs are transmissible between coral colonies, both through direct contact and through the water column, suggesting that an unknown infectious agent is driving morphological changes observed in coral hosts (Kaczmarsky and Richardson, 2007). However, the transmissibility of GAs is debatable; another study has shown that after 2 years, in situ isogeneic and allogeneic contacts between healthy and tumor fragments did not result in tumor development on healthy fragments (Gateno et al., 2003).
In conclusion, the high prevalence and year-long persistence of GAs on A. muricata are indicative of a chronic disease on the GBR. The characteristically plaque-like GAs we report result from proliferation of the coenosteum, in association with hyperplasia and hypertrophy of the calicodermis. Factor(s) stimulating the calicodermal layer in GAs are unknown, but an upregulation of the zymogen PPO suggests an innate immune response to a causative agent of unknown nature.
Author Contributions
BW and JL conceived the project. LK, TH, and JL performed surveys, sample collection, and laboratory characterization. LK and TH drafted the manuscript and performed data analyses. All authors designed components of the study and contributed to writing the manuscript.
Funding
Funding was provided by the ARC Centre of Excellence for Coral Reef Studies to BW and an AIMS@JCU research award to JL. Samples were collected on permit numbers G07/23617.1 in 2010 and G11/34003.1 in 2011, issued by the Great Barrier Reef Marine Park Authority.
Conflict of Interest Statement
The authors declare that the research was conducted in the absence of any commercial or financial relationships that could be construed as a potential conflict of interest.
Acknowledgments
We thank the staff and crew of the tourism operations on the Great Barrier Reef for their partnership and support. We also thank: Y. Sato, J. van de Water, and N. Gardiner for support in the lab and for statistical analyses; S. Reilly for histological support; and the Advanced Analytical Centre at JCU for direction and use of the scanning electron microscope.
Supplementary Material
The Supplementary Material for this article can be found online at: https://www.frontiersin.org/article/10.3389/fmars.2016.00151
References
Aeby, G. S., Williams, G. J., Franklin, E. C., Haapkyla, J., Harvell, C. D., Neale, S., et al. (2011a). Growth anomalies on the coral genera Acropora and Porites are strongly associated with host density and human population size across the Indo-Pacific. PLoS ONE 6:e16887. doi: 10.1371/journal.pone.0016887
Aeby, G. S., Williams, G. J., Franklin, E. C., Kenyon, J., Cox, E. F., Coles, S., et al. (2011b). Patterns of coral disease across the Hawaiian archipelago: relating disease to environment. PLoS ONE 6:e20370. doi: 10.1371/journal.pone.0020370
Alieva, N. O., Konzen, K. A., Field, S. F., Meleshkevitch, E. A., Hunt, M. E., Beltran-Ramirez, V., et al. (2008). Diversity and evolution of coral fluorescent proteins. PLoS ONE 3:e2680. doi: 10.1371/journal.pone.0002680
Aronson, R. B., and Precht, W. F. (2001). White-band disease and the changing face of Caribbean coral reefs. Hydrobiologia 460, 25–38. doi: 10.1023/A:1013103928980
Bak, R. P. M. (1983). Neoplasia, regeneration and growth in the reef-building coral Acropora palmata. Mar. Biol. 77, 221–227.
Bancroft, J. D., and Gamble, M. (2008). Theory and Practice of Histological Techniques. Philadelphia, PA: Elsevier Health Sciences.
Blais, J. M., Kimpe, L. E., McMahon, D., Keatley, B. E., Mallory, M. L., Douglas, M. S. V., et al. (2005). Arctic seabirds transport marine-derived contaminants. Science 309, 445. doi: 10.1126/science.1112658
Breitbart, M., Bhagooli, R., Griffin, S., Johnston, I., and Rohwer, F. (2005). Microbial communities associated with skeletal tumors on Porites compressa. FEMS Microbiol. Lett. 243, 431–436. doi: 10.1016/j.femsle.2005.01.004
Bruno, J. F., Petes, L. E., Harvell, D., and Hettinger, A. (2003). Nutrient enrichment can increase the severity of coral diseases. Ecol. Lett. 6, 1056–1061. doi: 10.1046/j.1461-0248.2003.00544.x
Burns, J. H. R., Gregg, T. M., and Takabayashi, M. (2013). Does coral disease affect symbiodinium? Investigating the impacts of growth anomaly on symbiont photophysiology. PLoS ONE 8:e72466. doi: 10.1371/journal.pone.0072466
Burns, J. H. R., and Takabayashi, M. (2011). Histopathology of growth anomaly affecting the coral, Montipora capitata: implications on biological functions and population viability. PLoS ONE 6:e28854. doi: 10.1371/journal.pone.0028854
Cerenius, L., Lee, B. L., and Söderhäll, K. (2008). The proPO-system: pros and cons for its role in invertebrate immunity. Trends Immunol. 29, 263–271. doi: 10.1016/j.it.2008.02.009
Coles, S. L., and Seapy, D. G. (1998). Ultra-violet absorbing compounds and tumorous growths on acroporid corals from Bandar Khayran, Gulf of Oman, Indian Ocean. Coral Reefs 17, 195–198.
Domart-Coulon, I., Traylor-Knowles, N., Peters, E., Elbert, D., Downs, C., Price, K., et al. (2006). Comprehensive characterization of skeletal tissue growth anomalies of the finger coral Porites compressa. Coral Reefs 25, 531–543. doi: 10.1007/s00338-006-0133-6
Gateno, D., Leon, A., Barki, Y., Cortes, J., and Rinkevich, B. (2003). Skeletal tumor formations in the massive coral Pavona clavus. Mar. Ecol. Prog. Ser. 258, 97–108. doi: 10.3354/meps258097
Haapkylä, J., Unsworth, R. K. F., Seymour, A. S., Melbourne-Thomas, J., Flavell, M., Willis, B. L., et al. (2009). Spatio-temporal coral disease dynamics in the Wakatobi Marine National Park, South-East Sulawesi, Indonesia. Dis. Aquat. Organ. 87, 105–115. doi: 10.3354/dao02160
Harvell, C. D., Kim, K., Burkholder, J. M., Colwell, R. R., Epstein, P. R., Grimes, D. J., et al. (1999). Emerging marine diseases-climate links and anthropogenic factors. Science 285, 1505–1510.
Harvell, C. D., Mitchell, C. E., Ward, J. R., Altizer, S., Dobson, A. P., Ostfeld, R. S., et al. (2002). Climate warming and disease risks for terrestrial and marine biota. Science 296, 2158–2162. doi: 10.1126/science.1063699
Irikawa, A., Casareto, B. E., Suzuki, Y., Agostini, S., Hidaka, M., and Van Woesik, R. (2011). Growth anomalies on Acropora cytherea corals. Mar. Pollut. Bull. 62, 1702–1707. doi: 10.1016/j.marpolbul.2011.05.033
Kaczmarsky, L., and Richardson, L. L. (2007). Transmission of growth anomalies between Indo-Pacific Porites corals. J. Invertebr. Pathol. 94, 218–221. doi: 10.1016/j.jip.2006.11.007
Kaczmarsky, L., and Richardson, L. L. (2011). Do elevated nutrients and organic carbon on Philippine reefs increase the prevalence of coral disease? Coral Reefs 30, 253–257. doi: 10.1007/s00338-010-0686-2
Kaczmarsky, L. T. (2006). Coral disease dynamics in the central Philippines. Dis. Aquat. Organ. 69, 9–21. doi: 10.3354/dao069009
Lamb, J. B., True, J. D., Piromvaragorn, S., and Willis, B. L. (2014). Scuba diving damage and intensity of tourist activities increases coral disease prevalence. Biol. Conserv. 178, 88–96. doi: 10.1016/j.biocon.2014.06.027
Lamb, J. B., Williamson, D. H., Russ, G. R., and Willis, B. L. (2015). Protected areas mitigate diseases of reef-building corals by reducing damage from fishing. Ecology 96, 2555–2567. doi: 10.1890/14-1952.1
Lamb, J. B., and Willis, B. L. (2011). Using coral disease prevalence to assess the effects of concentrating tourism activities on offshore reefs in a tropical marine park. Conserv. Biol. 25, 1044–1052. doi: 10.1111/j.1523-1739.2011.01724.x
Loya, Y., Bull, G., and Pichon, M. (1984). Tumor formations in scleractinian corals. Helgolander Meeresun. 37, 99–112.
McClanahan, T. R., Weil, E., and Maina, J. (2009). Strong relationship between coral bleaching and growth anomalies in massive Porites. Glob. Change Biol. 15, 1804–1816. doi: 10.1111/j.1365-2486.2008.01799.x
Mydlarz, L. D., Couch, C. S., Weil, E., Smith, G., and Harvell, C. D. (2009). Immune defenses of healthy, bleached and diseased Montastraea faveolata during a natural bleaching event. Dis. Aquat. Organ. 87, 67–78. doi: 10.3354/dao02088
Mydlarz, L. D., Holthouse, S. F., Peters, E. C., and Harvell, C. D. (2008). Cellular responses in sea fan corals: granular amoebocytes react to pathogen and climate stressors. PLoS ONE 3:e1811. doi: 10.1371/journal.pone.0001811
Mydlarz, L. D., McGinty, E. S., and Harvell, C. D. (2010). What are the physiological and immunological responses of coral to climate warming and disease? J. Exp. Biol. 213, 934–945. doi: 10.1242/jeb.037580
Mydlarz, L. D., and Palmer, C. V. (2011). The presence of multiple phenoloxidases in Caribbean reef-building corals. Comp. Biochem. Physiol. A Mol. Integr. Physiol. 159, 372–378. doi: 10.1016/j.cbpa.2011.03.029
Nappi, A. J., and Christensen, B. M. (2005). Melanogenesis and associated cytotoxic reactions: applications to insect innate immunity. Insect Biochem. Mol. Biol. 35, 443–459. doi: 10.1016/j.ibmb.2005.01.014
Page, C. (2009). Ecology and Biology of Coral Disease on the Great Barrier Reef. Ph.D. thesis, James Cook University, Townsville, QLD.
Palmer, C. V., Bythell, J. C., and Willis, B. L. (2010). Levels of immunity parameters underpin bleaching and disease susceptibility of reef corals. FASEB J. 24, 1935–1946. doi: 10.1096/fj.09-152447
Palmer, C. V., Bythell, J. C., and Willis, B. L. (2011a). A comparative study of phenoloxidase activity in diseased and bleached colonies of the coral Acropora millepora. Dev. Comp. Immunol. 35, 1098–1101. doi: 10.1016/j.dci.2011.04.001
Palmer, C. V., Mydlarz, L. D., and Willis, B. L. (2008). Evidence of an inflammatory-like response in non-normally pigmented tissues of two scleractinian corals. Proc. Biol. Sci. 275, 2687–2693. doi: 10.1098/rspb.2008.0335
Palmer, C. V., Traylor-Knowles, N. G., Willis, B. L., and Bythell, J. C. (2011b). Corals use similar immune cells and wound-healing processes as those of higher organisms. PLoS ONE 6:e23992. doi: 10.1371/journal.pone.0023992
Peters, E. C., Halas, J. C., and McCarty, H. B. (1986). Calicoblastic neoplasms in Acropora palmata, with a review of reports on anomalies of growth and form in corals. J. Natl. Cancer Inst. 76, 895–912.
Pollock, F. J., Lamb, J. B., Field, S. N., Heron, S. F., Schaffelke, B., Shedrawi, G., et al. (2014). Sediment and turbidity associated with offshore dredging increase coral disease prevalence on nearby reefs. PLoS ONE 9:e102498. doi: 10.1371/journal.pone.0102498
Stimson, J. (2011). Ecological characterization of coral growth anomalies on Porites compressa in Hawai‘i. Coral Reefs 30, 133–142. doi: 10.1007/s00338-010-0672-8
van de Water, J. A. J. M., Ainsworth, T. D., Leggat, W., Bourne, D. G., Willis, B. L., and van Oppen, M. J. H. (2015). The coral immune response facilitates protection against microbes during tissue regeneration. Mol. Ecol. 24, 3390–3404. doi: 10.1111/mec.13257
Wallace, C. (1999). Staghorn Corals of the World: A Revision of the Genus Acropora (Scleractinia; Astrocoenina; Acroporidae) Worldwide, with Emphasis on Morphology, Phylogeny and Biogeography. Collingwood: CSIRO Publishing.
Williams, G. J., Aeby, G. S., Cowie, R. O. M., and Davy, S. K. (2010). Predictive modeling of coral disease distribution within a reef system. PLoS ONE 5:e9264. doi: 10.1371/journal.pone.0009264
Willis, B. L., Page, C. A., and Dinsdale, E. A. (2004). “Coral disease on the Great Barrier Reef,” in Coral Health and Disease, eds E. Rosenberg and Y. Loya (Heidelberg: Springer), 69–104.
Work, T. M., and Aeby, G. A. (2006). Systematically describing gross lesions in corals. Dis. Aquat. Organ. 70, 155–160. doi: 10.3354/dao070155
Work, T. M., Aeby, G. S., and Coles, S. L. (2008). Distribution and morphology of growth anomalies in Acropora from the Indo-Pacific. Dis. Aquat. Organ. 78, 255–264. doi: 10.3354/dao01881
Work, T. M., and Rameyer, R. A. (2005). Characterizing lesions in corals from American Samoa. Coral Reefs 24, 384–390. doi: 10.1007/s00338-005-0018-0
Yamashiro, H., Oku, H., Onaga, K., Iwasaki, H., and Takara, K. (2001). Coral tumors store reduced level of lipids. J. Exp. Mar. Biol. Ecol. 265, 171–179. doi: 10.1016/S0022-0981(01)00333-1
Yamashiro, H., Yamamoto, M., and Van Woesik, R. (2000). Tumor formation on the coral Montipora informis. Dis. Aquat. Organ. 41, 211–217. doi: 10.3354/dao041211
Yasuda, N., and Hidaka, M. (2012). Cellular kinetics in growth anomalies of the scleractinian corals Porites australiensis and Montipora informis. Dis. Aquat. Organ. 102, 1–11. doi: 10.3354/dao02530
Keywords: Acropora, coral disease, Great Barrier Reef, growth anomalies, ecology, pathology, innate immune system
Citation: Kelly LA, Heintz T, Lamb JB, Ainsworth TD and Willis BL (2016) Ecology and Pathology of Novel Plaque-Like Growth Anomalies Affecting a Reef-Building Coral on the Great Barrier Reef. Front. Mar. Sci. 3:151. doi: 10.3389/fmars.2016.00151
Received: 14 May 2016; Accepted: 05 August 2016;
Published: 23 August 2016.
Edited by:
Hajime Kayanne, University of Tokyo, JapanReviewed by:
Aldo Cróquer, Simón Bolívar University, VenezuelaThierry Work, United States Geological Survey, USA
Copyright © 2016 Kelly, Heintz, Lamb, Ainsworth and Willis. This is an open-access article distributed under the terms of the Creative Commons Attribution License (CC BY). The use, distribution or reproduction in other forums is permitted, provided the original author(s) or licensor are credited and that the original publication in this journal is cited, in accordance with accepted academic practice. No use, distribution or reproduction is permitted which does not comply with these terms.
*Correspondence: Lisa A. Kelly, lisakelly.lak@gmail.com
†Present Address: Tom Heintz, SOPRONER, Nouméa, New Caledonia
‡These authors have contributed equally to this work.