Fish Species in a Changing World: The Route and Timing of Species Migration between Tropical and Temperate Ecosystems in Eastern Atlantic
 Awaluddin H. Kaimuddin
 Raymond Laë
 Luis Tito De Morais
- Laboratoire des Sciences de l'Environnement Marin, Université de Bretagne Occidentale, Centre National de la Recherche Scientifique, IRD, Ifremer, Institut Universitaire Européen de la Mer, Plouzané, France
The presence of tropical species has been reported in Atlantic-European waters with increasing frequency in recent years. Unfortunately, the history of their migrations is not well understood. In this study, we examined the routes and timing of fish migrations in several ecosystems of the East Atlantic Ocean, combining several publicly available and unpublicized datasets on species occurrences. The species studied were those noted as exotic or rare outside their previous known area of distribution. We used sea surface temperature (SST) data obtained from 30 years of satellite observation to define three distinct time periods. Within these periods, temperature trends were studied in six ecosystems: the North Sea, the Celtic Sea, the South European Atlantic Waters, the Mediterranean Sea, the Canary Current, and the Guinea Current. We also incorporated bathymetry data to describe the distribution of species. Measurement across a relatively large spatial extent was made possible by incorporating the capabilities of GIS. While SST increased consistently over time in all of the ecosystems observed, the change in number of species differed among ecosystems. The number of species in the middle regions, such as the South European Atlantic Shelf and the Western Mediterranean Sea, tended to increase over time. These regions received numbers of species from the lower or the upper latitudes according to season. Of all of the species observed in the recent period, seven species from the Canary Current tended to be found in the Western Mediterranean Sea, and six species from these two regions extended their distributions to the South European Atlantic Shelf. Twelve species from the Canary Current moved seasonally to the Guinea Current. In the northern regions, 13 species moved seasonally in the North Sea and the Celtic Seas, and 12 of these species reached the South European Atlantic Shelf. This study presents a picture of routes and timing of species migration at the biogeographical scale. It shows how species have shifted their area of distribution (mostly northward) along the Eastern Atlantic ecosystems or have increased their depth ranges probably to remain within their preferred temperature range in response to long-term and seasonal environmental changes.
Introduction
The presence of tropical fish species has been reported in Atlantic-European waters since the 1960s (Quero et al., 1997). Although such incidences have become much more common in recent years and have involved a large number of pelagic, demersal, and deep-water fish species (Bañón, 2004), the histories of their distributions are not well understood (Summerson et al., 2007). Moreover, the routes and timing of their migrations are not well documented (Johnston and Purkis, 2011).
Global change has facilitated the introduction of organisms to areas outside their natural range. Some of these organisms have been able to establish a viable population (Secretariat of NOBANIS, 2012), e.g., Seriola fasciata, a species of Atlantic-origin that is now established in the Mediterranean Sea (Deidun et al., 2011). These new species as they may become invasive, threaten the native community. Invasive species are considered the second cause of biodiversity loss after habitat destruction, accelerating the decline of native communities already under environmental stress (Streftaris and Zenetos, 2006) as well as changing local and/or regional species composition (Hiddink and Hofstede, 2008).
Growing awareness of the necessity to protect marine environments and marine resources has highlighted the need for ecosystem baseline information for long-term monitoring and for estimating the geographic extent of critical habitats (Lundblad et al., 2006). Furthermore, the acceleration of biodiversity loss has spurred the development of techniques to assess and monitor biodiversity toward addressing large-scale ecological questions (Chiarucci et al., 2011).
The impact of global change on a species' distribution differs geographically and seasonally depending on environmental conditions as well as the biological characteristics and/or sensitivity of the species (Margules and Pressey, 2000). Measuring this impact to promote effective conservation requires detailed knowledge of species' spatial distributions (Kaschner et al., 2006). At large spatial scales, the measurement, and monitoring techniques become challenging (Chiarucci et al., 2011). Aquatic species are not as easily spotted and monitored as terrestrial species (Johnston and Purkis, 2011). For marine species, measurement is costly, especially for highly mobile species with large ranges (Tittensor et al., 2010).
Several studies of climate change effects on marine biodiversity within specific regions have been performed (Perry et al., 2005; Edwards et al., 2013; Auber et al., 2015). Many of those studies used a smaller-scale observation data. Thus, their analyses dealt with limited taxa and focus only on a regional scale in the temperate waters of North Atlantic where most data are available (Montero-Serra et al., 2015; Poloczanska et al., 2016). Studies at the global scale have also been performed (Sorte et al., 2010; Kaschner et al., 2011; Przeslawski et al., 2012; Powell and Xu, 2015) but many of those study are theoretical or a prediction using a global model. Thus, the effect of climate change on shifting species distribution among ecosystems is still not clear due to a very low spatial resolution. In contrast, there have been few studies of linked regions that together encompass a wide latitudinal range of species distributions from tropical to temperate waters, and including transition zones where many species have their northern or southern distribution limits. In addition, this paper shows the shift of species distribution in time and space due to environmental change through observational data at biogeographic scales in areas where the data are rarely publicly available (as in the Canary Current and the South European Atlantic Shelf). The acceleration of biodiversity changes makes the development of techniques to assess and monitor species distribution an urgent issue if large-scale ecological questions are to be addressed (Chiarucci et al., 2011).
In this paper, we examine the pattern of species distribution and numbers of species in several ecosystems in the Eastern Atlantic during the period 1983–2012. The species studied are the fish species that have been observed outside their known natural distributions. We inspect the routes and timing of their migrations using an innovative, large dataset assembled from various widely used sources and personal data. We use Sea Surface Temperature (SST) data obtained from 30 years satellite observation to define three distinct time periods studies and trends in the study area. We also incorporated bathymetry data from the General Bathymetric Chart of the Oceans (GEBCO) to describe the distribution of species.
Materials and Methods
Study Area
The study area extends from the northern coast of the UK to the coast of the Republic of the Congo. It covers six marine ecosystems: the North Sea, the Celtic Seas, the South European Atlantic Shelf, the Western Mediterranean Sea, the Canary Current, and the Guinea Current (Figure 1A). Boundaries of the northern ecosystems in European waters were defined by ICES/International Council for the Exploration of the Sea (Nathalie, 2015). The recent modification of the northern ecosystem boundaries by ICES in 2015 was not applied in this study. The boundaries of the southern ecosystems in the African waters were based upon the LME/Large Marine Ecosystems (Sherman and Hempel, 2009; O'Reilly, 2013).
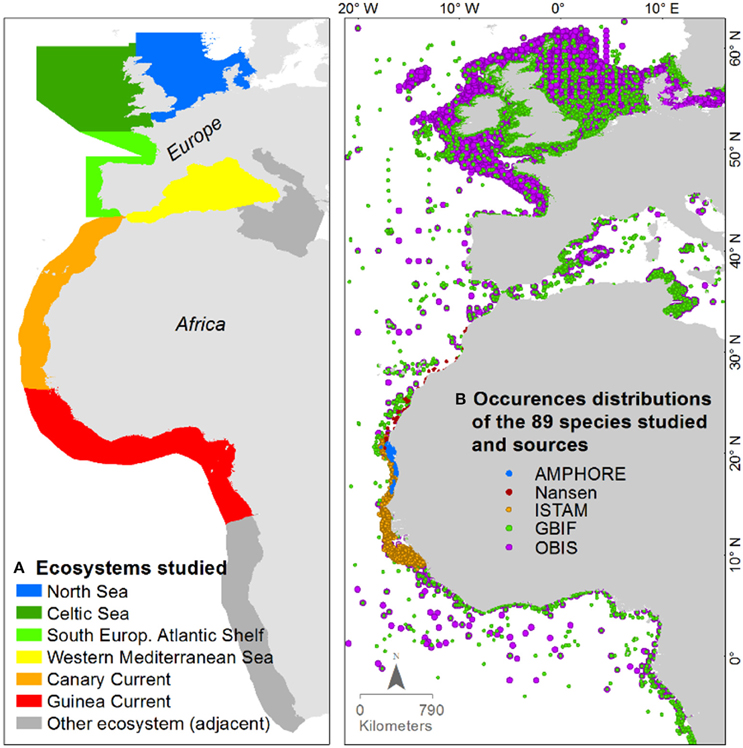
Figure 1. (A) Ecosystems studied; and (B) distributions of species occurrence records in the area of interest by their data sources.
The zoogeographic importance of these latitudinal areas, especially the regions in the middle, has long been recognized, for they represent the transition zone between the warm-temperate north-eastern Atlantic and the cold-temperate regions (Gomes, 2001). Many species have their southern or northern distribution limits in the central region, which makes the zone an area of great sensitivity for the detection of climate change (Teixeira et al., 2014). This is one of the reasons this area was selected. Despite the migration of several marine fish species into these regions, studies of species distribution in these areas are rare compared to adjacent areas, such as the relatively closed water body of the Mediterranean Sea.
Period of Study
A preliminary study on the evolution of SST in the area of interest showed a decadal trend of SST rise. Thus, numbers of species were calculated over three decadal periods from 1982 to 2012, based on the availability of SST data obtained from satellite observation: 1983–1992 (Period I), 1993–2002 (Period II), and 2003–2012 (Period III).
Species Studied and Occurrence Records
Species Studied
This work focuses on studying fish species that have been observed outside their known natural range. These species were noted as exotic or rare outside their previous known area of distribution by various sources. In the Mediterranean for instance Acanthurus monroviae, a species with tropical origin, was noted as exotic in 2002 by the CIESM (2002), and this species is now well established in the Mediterranean Sea (Zenetos et al., 2005). Another example is Arius parkii, considered alien by CIESM (2002) in the Mediterranean Sea. In the Atlantic-European waters, two species also of tropical-Atlantic origin, Anthias anthias, and Solea senegalensis, are now observed with high biomass in the Galician waters (NW Spain) of the South European Atlantic Shelf (Bañón et al., 2010).
Overall, in the middle zone of the study area, 465 species were identified as rare outside their previous known area of distribution from 1982 to 2012 (Quero et al., 1986, 1991, 1994, 1999, 2000, 2003, 2004, 2005, 2009; Peristeraki et al., 2006; Bilecenoglu et al., 2009; Oral, 2010; Brito et al., 2011). These are species of temperate or tropical origin. Eighty-nine species were selected based on the availability of occurrence records (the threshold value was 80 occurrences). A checklist of the selected species along with the information of affinity, number of occurrences per ecosystem, and sources of articles used for species identification are available in Supplementary Table 1. Box-plots of the latitudinal distribution of the 89 species studied are presented in Figure 2.
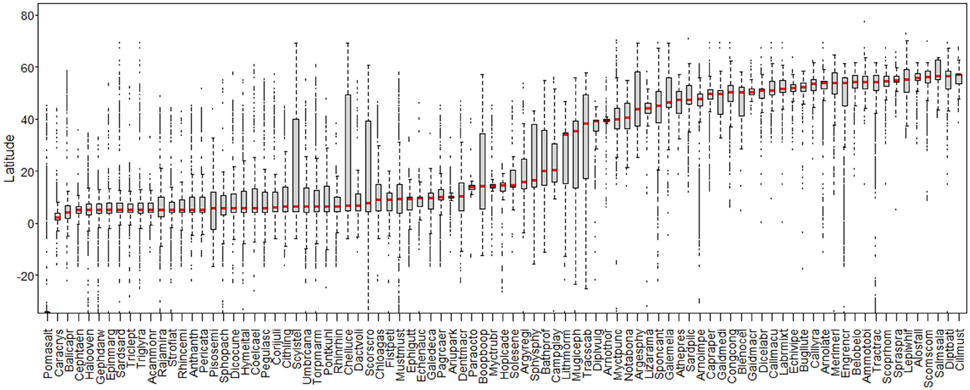
Figure 2. Latitudinal distribution of the 89 species studied (ordered by median/stripe in box-plot). Each box-plot represents one species. Labels on abscissa: species' scientific names abbreviated to eight characters (see Supplementary Table 1).
Species Occurrence
The species occurrence records in this study were derived mostly from OBIS/Ocean biogeographic information system (http://www.iobis.org) and GBIF/Global biodiversity information facility (http://www.gbif.org). In these databases, the data density in well-financed or more economically developed countries (i.e., surveys conducted in European waters) was much higher than for the developing countries. Hence, for the areas with less-available occurrence records, such as the Canary Current and the Guinea Current, we added data from three additional surveys: the ISTAM Project/Improve scientific and technical advices for fisheries management (http://halieut.roazhon.inra.fr/istam), the AMPHORE Project/Marine Protected Areas and fisheries management by optimization of Resources and Ecosystems (http://www.ird.fr), and the Nansen survey (Sætersdal et al., 1999), see Figure 1B. Thus, these incorporated data sources have mutually complementary coverage.
Neither information on sampling techniques nor sampling effort was uniform in these databases. Analyses on abundance and biomass therefore, could not be conducted. From the variety of biodiversity indices available, only number of species could be calculated. This study used presence/absence data within large areas, and analyses were conducted qualitatively.
Heterogeneous data sources at this biogeographic extent show varying degrees of confidence. Hence, maintaining data quality required detailed investigation. Suspicious occurrences with absent or false coordinate or that showed species misidentifications were removed from the database (see Supplementary Figure 1). Occurrences without time of observation were also excluded from the analysis.
The spatial selection process of species occurrence was based on the ecosystem polygons, with addition of inland water areas in all study area to include occurrences observed in estuarine waters (Supplementary Figure 2). The inland water shapefiles was obtained from DIVA-GIS program (http://www.diva-gis.org). Buffer zones of 10 km on the boundaries of the study area were constructed to include points of occurrence in the vicinity, anticipating the different scales of data sources. The occurrence counts within these buffered zones are given in Table 1.
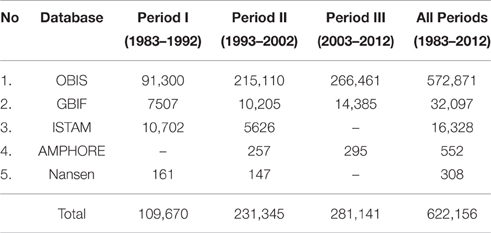
Table 1. Number of occurrence records of the 89 species selected.
From the various databases mentioned previously, we gathered information on species name, location expressed in latitude and longitude, and the date of observation (month and year). The data were combined into a single.csv file. The rows with latitudinal and longitudinal information were converted into point features of the common GIS format shapefile (see flowchart in Figure 3).
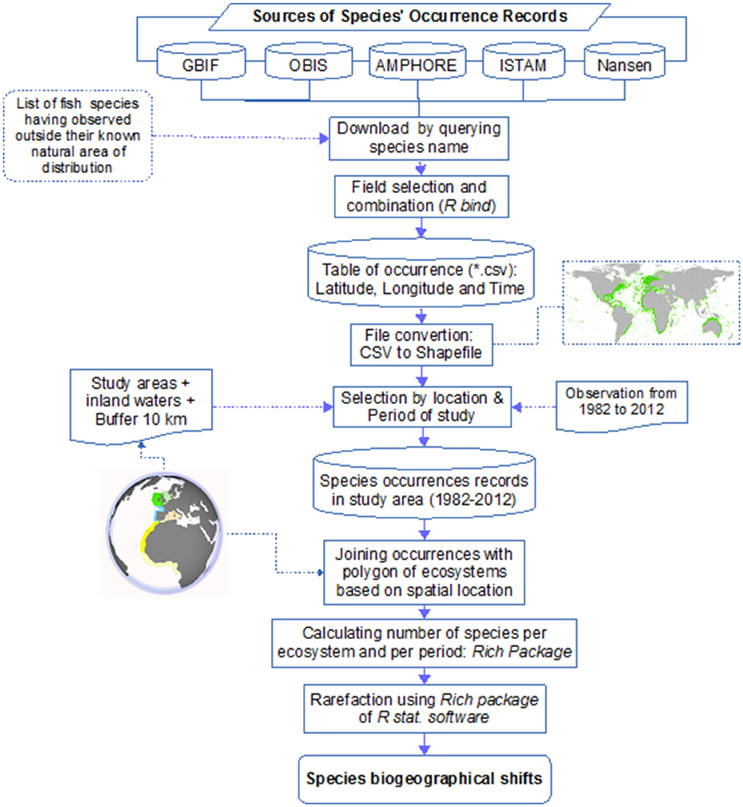
Figure 3. Flowchart summarizing the procedure for occurrence collection and calculation of the number of species.
Number of Species and ID of Species Migration
The number of species per ecosystem was obtained by joining the points of occurrence with the ecosystem polygons based on spatial location. The tool used was the ArcGIS™ Join-Data tool. Joining data based on spatial location means that the information of each ecosystem (the id/name of the ecosystem) is appended to each point of occurrence based on the location of the occurrence. The number of species was then calculated based on the id/name of ecosystem using the Rich package (Rossi, 2011) of the R statistical software framework. This calculation was repeated for the three periods studied and for each ecosystem (Figure 3).
• The directions of species migration were symbolized using the following IDs:
• C = G: ID for species found both in the Canary Current and the Guinea Current.
• C = W: ID for species found both in the Canary Current and the Western Mediterranean Sea. These species are not among the species noted as exotic in the Mediterranean Sea (CIESM, 2002).
• CW: ID for Atlantic-origin species (the Canary Current) found in the Western Mediterranean Sea in recent years. Most of the occurrences of these species were excluded in this study due to the strict selection criteria applied to occurrence records. These species are noted alien in the Mediterranean Sea by CIESM (2002).
• CWS: ID for species found in the Canary Current and the Western Mediterranean Sea, and recently found in the South European Atlantic Shelf.
• NCS: ID for species found seasonally in the North Sea, the Celtic Seas and the South European Atlantic Shelf.
• C = N: ID for species found in both the Celtic Seas and the North Sea.
• ALL: ID for species found in all areas (temperate, subtropical and tropical waters).
• D (stands for doubtful): ID for species with low occurrences.
Rarefaction and Jaccard Similarity
The number of species could be strongly dependent on sampling intensity, both for sample size and individual density. For standardization, a rarefaction procedure was applied to analyze the number of species in each ecosystem and period. This procedure consists in plotting randomized species number against the sampling intensity to estimate the number of species in an ecosystem. Rarefaction curves report the average values of randomized species number derived from re-sampling without replacement (Rossi, 2011). These curves were used to determine possible ranges in species richness. When the rarefaction curve did not stabilize, the sampled occurrences were considered not representative of true species richness and that curve was excluded from the analysis. The Rich package from R was used to perform this analysis. Further details about the rarefaction procedure can be found in Rossi (2011).
Some species were present in several ecosystems studied. Jaccard similarity analysis was performed to obtain initial information of the closeness of the ecosystems. Jaccard similarity summarizes the number of species shared between ecosystems divided by the total number of species found in the ecosystems. The tool used was Vegdist function from the Vegan package in R.
Environmental Data
Numerous environmental parameters influence the range of species distribution, such as temperature, bathymetry, salinity, substrate, coastline exposure, ocean circulation, nutrient availability, and disturbance by human activity. The impacts of these parameters differ in degree, from low to critical. Accounting for all of these parameters is beyond the scope of this study, and the data are not available at the scale of this study. Direct observation through fieldwork is costly and limited to relatively shallow waters. Temperature and bathymetry are generally regarded the main drivers of species distribution (Summerson et al., 2007; Zenetos et al., 2010) and the data for these factors are available at the spatial and temporal scale of this study. Thus, in this study, we limited our analyses to these two limiting factors. The effects of the other environmental parameters will be addressed in the discussion section.
Comprehensive and consistent time series data are necessary to elucidate the effects of continuously changing environmental conditions on species distributions. The only sources of data so comprehensive are satellite sensors.
Sea Surface Temperature (SST)
Among many modern satellite sensors available today, only AVHRR (the Advanced Very High Resolution Radiometer), on-board the NOAA polar-orbiting satellites, has produced a successful long-term global SST dataset from the same class of instrument (Casey et al., 2010).
We observed the changes of the SST in each ecosystem using the most recent version of the AVHRR SST dataset (Pathfinder version 5.2) from the NOAA polar-orbiting satellite (available from 1982 to 2012). These data are accessible and downloadable through FTP access http://data.nodc.noaa.gov/pathfinder/Version5.2.
The AVHRR SST files were stored in NetCDF. Each file contains one global daily image, from day 304 (first of November) 1981 to day 365 of December 2012. These daily files were combined into a mean monthly file. The format of the files was converted into a common GIS format file, GeoTIFF, to facilitate working with the GIS software. The SST unit in the original dataset was converted from Kelvin into Celsius. The areas with no data attached, such as terrestrial values or areas covered by clouds during acquisition were set to NULL or −9999.
Mean monthly SST values were obtained for each ecosystem using the Zonal statistics as table tool in ArcGIS™ software. The tool works by summarizing the raster statistics of a given zone in a shapefile. Statistics, such as the mean value, minimum, maximum, standard deviation and number of pixels, were calculated for each ecosystem polygon. A script written in Python was used to automate the process for all SST files. The Python code listed all of the monthly SST rasters, took each raster for calculation, and put the result in a DBF-formatted file. This process was conducted for the first raster of the first month (January 1982) to the last raster of the last month (December 2012). The DBF files resulting from this process were then opened in R for further analysis. The SST in each ecosystem was analyzed seasonally. The slopes of the seasonal SST trends were calculated and tested using the lm() function in R for using linear regression. The flowchart of the SST data processing is shown in Supplementary Figure 3.
Bathymetry
Water depth is a critical factor for species distribution, especially on the continental shelf and coastal zones, although it is not as vital as water temperature (Galil and Zenetos, 2002). The bathymetry data we used came from the SRTM30_PLUS V9.0 dataset as SRTM-formatted file. The data were available online at http://topex.ucsd.edu/WWW_html/srtm30_plus.html. The SRTM30_PLUS data consisted of (1) land and ice topography coming from the SRTM30 and ICESat topography, and (2) ocean bathymetry based on a new satellite-gravity model where the gravity-to-topography ratio was calibrated using 298 million edited soundings (Becker et al., 2009). In the SRTM30_PLUS data structure, the area of interest lies on four tiles: w020s10, w020n40, w020n90, and w060n40 (Supplementary Figure 4). These files were merged (mosaicked) and then converted to GeoTiff format to facilitate working with the GIS software. The land values included in the data were set to NULL or −9999. The bathymetry value was extracted at the location of each species' occurrence. The flowchart of the bathymetry extraction process is shown in Supplementary Figure 3.
The use of a Geographic Information System (GIS) in this study allowed us to work with a large quantity of spatial and temporal data, as well as both species occurrence records and environmental data. This technique is especially useful in mapping and studying species distribution patterns over time, or identifying the geographical areas occupied by potential targets for conservation.
Results
Number of Species by Period by Ecosystem
Analyses of number of species over time in the study area are presented in Figure 4 (see Supplementary Table 2 for details).
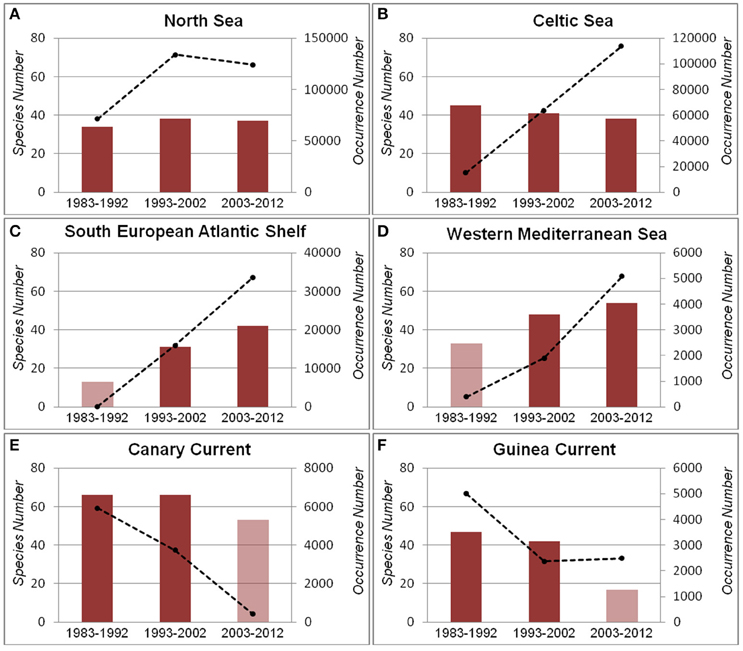
Figure 4. Number of species (bars) and number of occurrences (dotted lines) by period in each ecosystem. (A) North Sea; (B) Celtic Sea; (C) South European Atlantic Shelf; (D) Western Mediterranean Sea; (E) Canary Current; (F) Guinea Current. Transparent bars represent periods with insufficient data (details are in Supplementary Table 2).
In the North Sea, the number of species increased slightly from the first period to the second period following an increase of occurrence records (Figure 4A). In the recent period of 2003–2012, number of species in this region decreased slightly, following a slight decrease of occurrences.
In the Celtic Seas, the number of species decreased over time despite an increase in the number of occurrence records (Figure 4B). This implies there were more individuals of less species.
In the South European Atlantic Shelf, the number of species increased considerably over time following an increasing number of occurrence records (Figure 4C). Similarly, in the Western Mediterranean Sea, the number of species increased over time along with the increase of occurrences (Figure 4D). In the first period, the numbers of occurrences for both ecosystems were insufficient for rarefaction analysis (see rarefaction curves in Supplementary Table 3).
In the Canary Current, although the number of occurrences decreased considerably over time, the number of species decreased only slightly (Figure 4E). A similar pattern was observed in the Guinea Current (Figure 4F). In the third period, the numbers of occurrences for both ecosystems were insufficient for rarefaction analysis (see rarefaction curves in Supplementary Table 3).
In the northernmost ecosystems (North Sea and Celtic Seas) species occurrences seem to increase over the time periods and this is accompanied by stable or slightly decreasing numbers of species. The central-most region (South European Atlantic Shelf and Western Mediterranean), on the other hand, appears to be characterized by marked increases in both the number of occurrences and the number of species over time. Finally, the southernmost region (Guinea current and Canary current) exhibits a decrease in both occurrences and the number of species. These results seem to point to an overall enhancement in the biodiversity and biomass in the central region to the detriment of the southernmost region.
The cases of S. senegalensis, Diplodus vulgaris and A. tobianus are presented for further analysis on observational history of species migration. S. senegalensis and D. vulgaris are presented as examples of species with a northward migration pattern, whilst A. tobianus is presented as an example of species with a distribution pattern likely related to seasonal migrations and possibly extending its depth range. In addition, these species have a high commercial value and are therefore, well studied.
In the first and second period of study, S. senegalensis and D. vulgaris were only observed in the Canary Current and the Western Mediterranean Sea (green and yellow points on maps in Figure 5). These species were recently observed in the third period of study in the South European Atlantic Shelf (red points on maps in Figure 5).
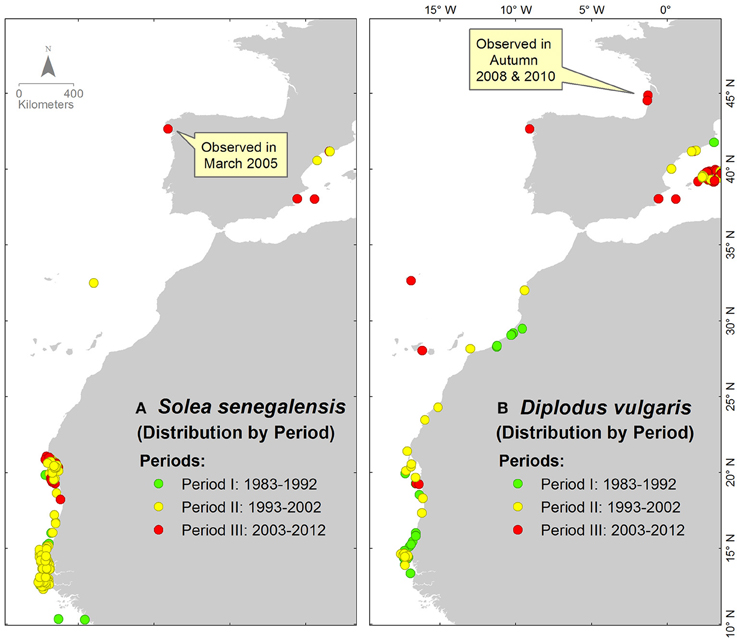
Figure 5. Occurrence distributions of (A) S. senegalensis and (B) D. vulgaris. The colors of each point indicate the decadal period of observation.
Ammodytes tobianus was mostly found in the North Sea during winter (green points on map in Figure 6). In spring and summer, this species could be found both in the Celtic Seas and the North Sea. In autumn, it could be observed in the lower latitudes of the Bay of Biscay in the South European Atlantic Shelf (purple points on map in Figure 6).
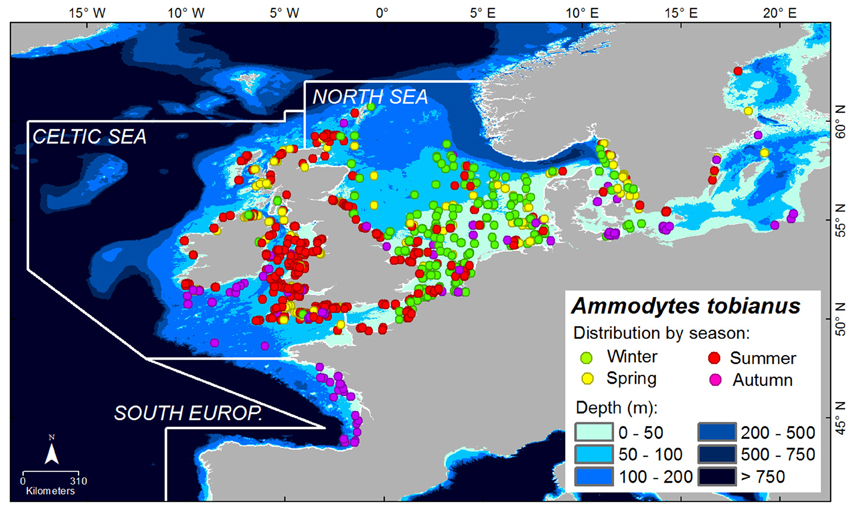
Figure 6. Distribution of A. tobianus. The points are the species' occurrences with colors representing season accordingly. Depth is indicated by degradation of blue color.
In the first three seasons, A. tobianus was generally found in areas between 2 and 100 m deep (Figure 7). Fifty percent of its occurrences were found in areas between 20 and 52 m deep, indicating its preferred depth range. In autumn, this species can be found in areas up to 150 m deep.
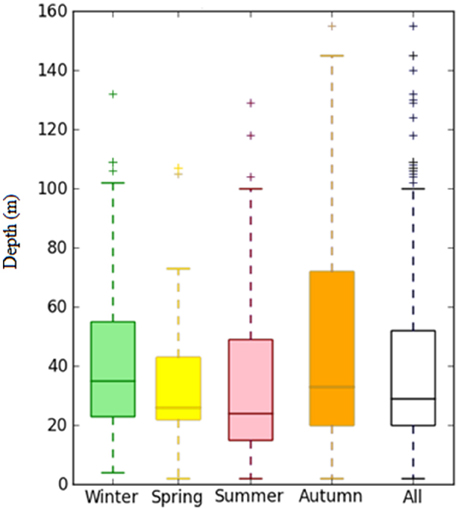
Figure 7. Distribution of depth of A. tobianus by season.
Evolution of SST and Similarity of Ecosystems
Figure 8 presents the movement of mean seasonal SST in all of the studied ecosystems from 1982 to 2012. The monthly SST values in each ecosystem are available in Supplementary Tables 4–6.
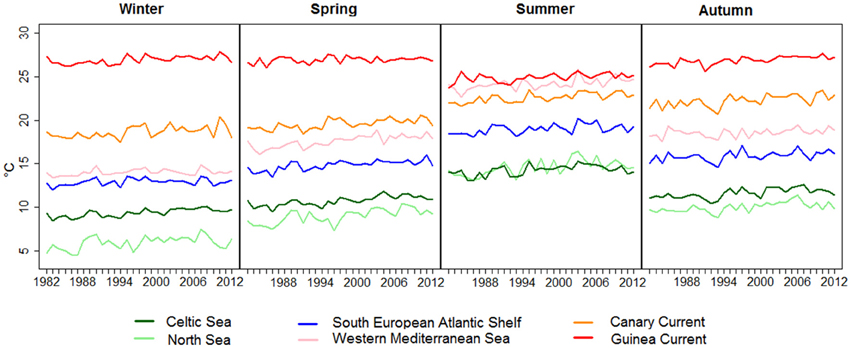
Figure 8. Mean seasonal SST in each ecosystem over time (colored lines). The slope and P-values are given in Table 2.
In winter, large differences of mean SST were observed among ecosystems, except between the South European Atlantic Shelf and the Western Mediterranean Sea. These two ecosystems both have mean SSTs that range from 12.9 to 14.01°C (detail in Table 2).
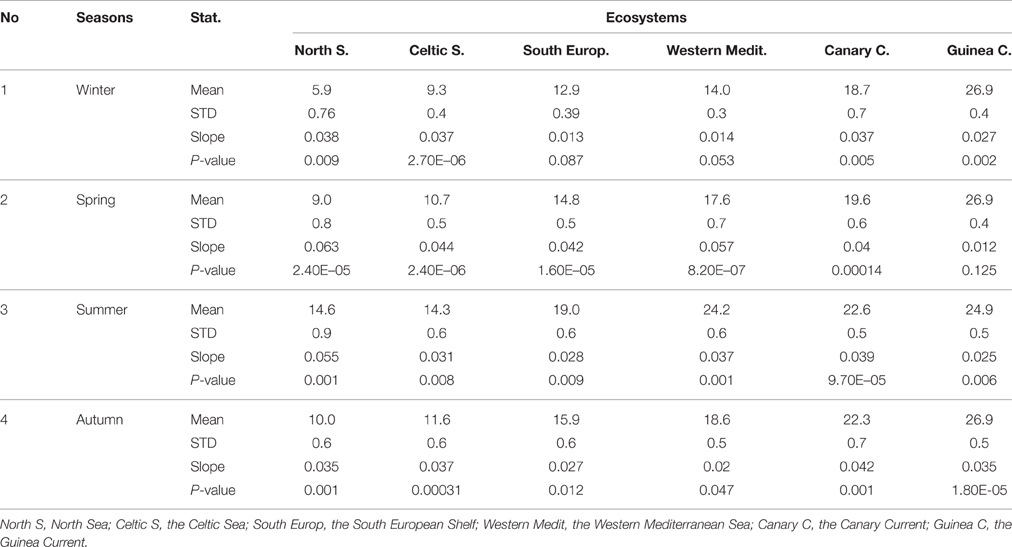
Table 2. SST statistics by season in each ecosystem (1982–2012). Value of alpha = 0.05.
In spring, the temperature of the North Sea was close to that of the Celtic Seas. The temperature in the South European Atlantic Shelf reached the range of the winter temperature of the Western Mediterranean Sea. The mean SST of the Western Mediterranean Sea during this season was close to that of the Canary Current.
In summer, the temperature increased in all ecosystems except for the Guinea Current, which showed an opposite trend. The mean SST in the South European Atlantic Shelf was in the range of spring temperatures of the Canary Current and of the Western Mediterranean Sea.
In autumn, the mean SST decreased slowly in almost all ecosystems. The temperature in the South European Atlantic Shelf during this season was in the range of summer temperatures of the North Sea and of the Celtic Seas.
The analysis of Jaccard similarities between ecosystems distinguished two general groups of ecosystems: one including the South European Atlantic Shelf, the North Sea and the Celtic Sea, the other including the Guinea Current, the Canary Current and the Western Mediterranean Sea (Figure 9).
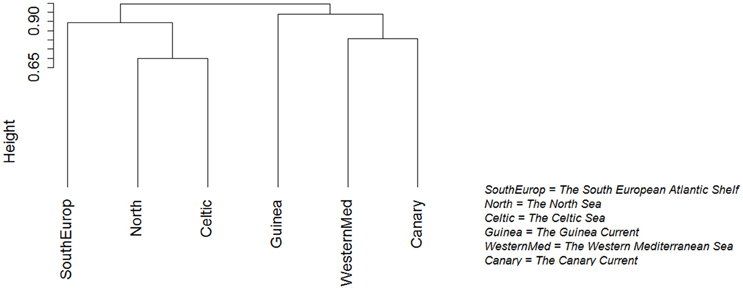
Figure 9. Ecosystems clustered by Jaccard similarity. Ecosystems with very similar species compositions are grouped together.
In the northern part of the study area, the North Sea shares many species with the Celtic Seas (Figure 9). Some of these species reach the South European Atlantic Shelf, such as Salmo salar and A. tobianus. In the southern part of the study area, the Canary Current shares many species with the Western Mediterranean, such as Coris julis and Pomatomus saltatrix. The Canary Current also shared many species with the Guinea Current, such as A. parkii and Caranx crysos.
Migration Routes
Out of the 89 selected species, we found 13 species that extended their area of distribution northward. Among these species, approximately seven species that were initially found in the Canary Current were recently found with marked records in the Western Mediterranean Sea (ID: CW in Figure 10A, Table 3). Six species that were initially in both the Canary Current and the Western Mediterranean Sea were recently found in the South European Atlantic Shelf (ID: CWS).
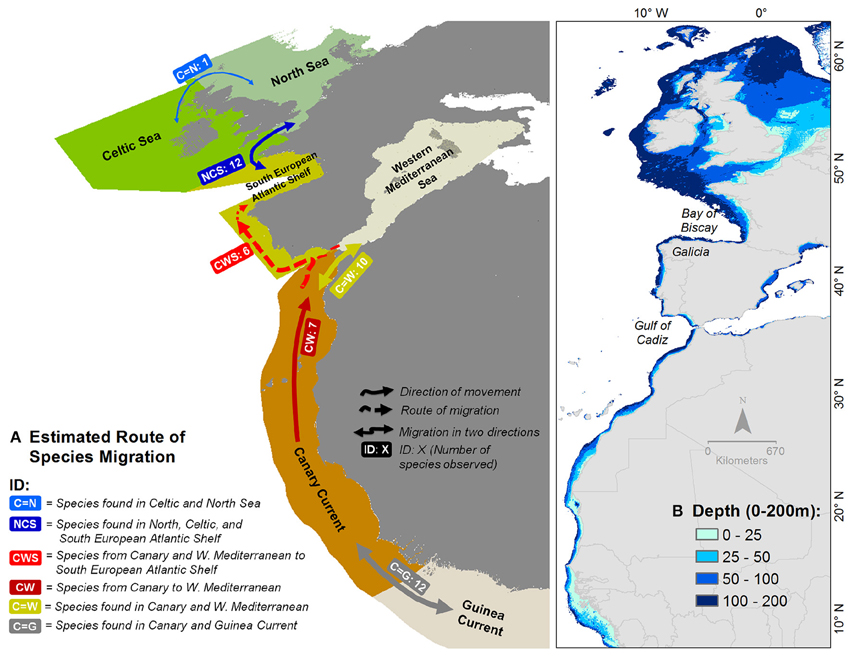
Figure 10. (A) Species movement flow in the study area. The arrows indicate the direction(s) of movement/migration. IDs and numbers in rounded rectangles indicate the number of moving/migrating species of that type; see Table 3 for details. (B) Depth distribution. Most of the species studied were found in the area with depth less than 200 m (see also Figure 11).
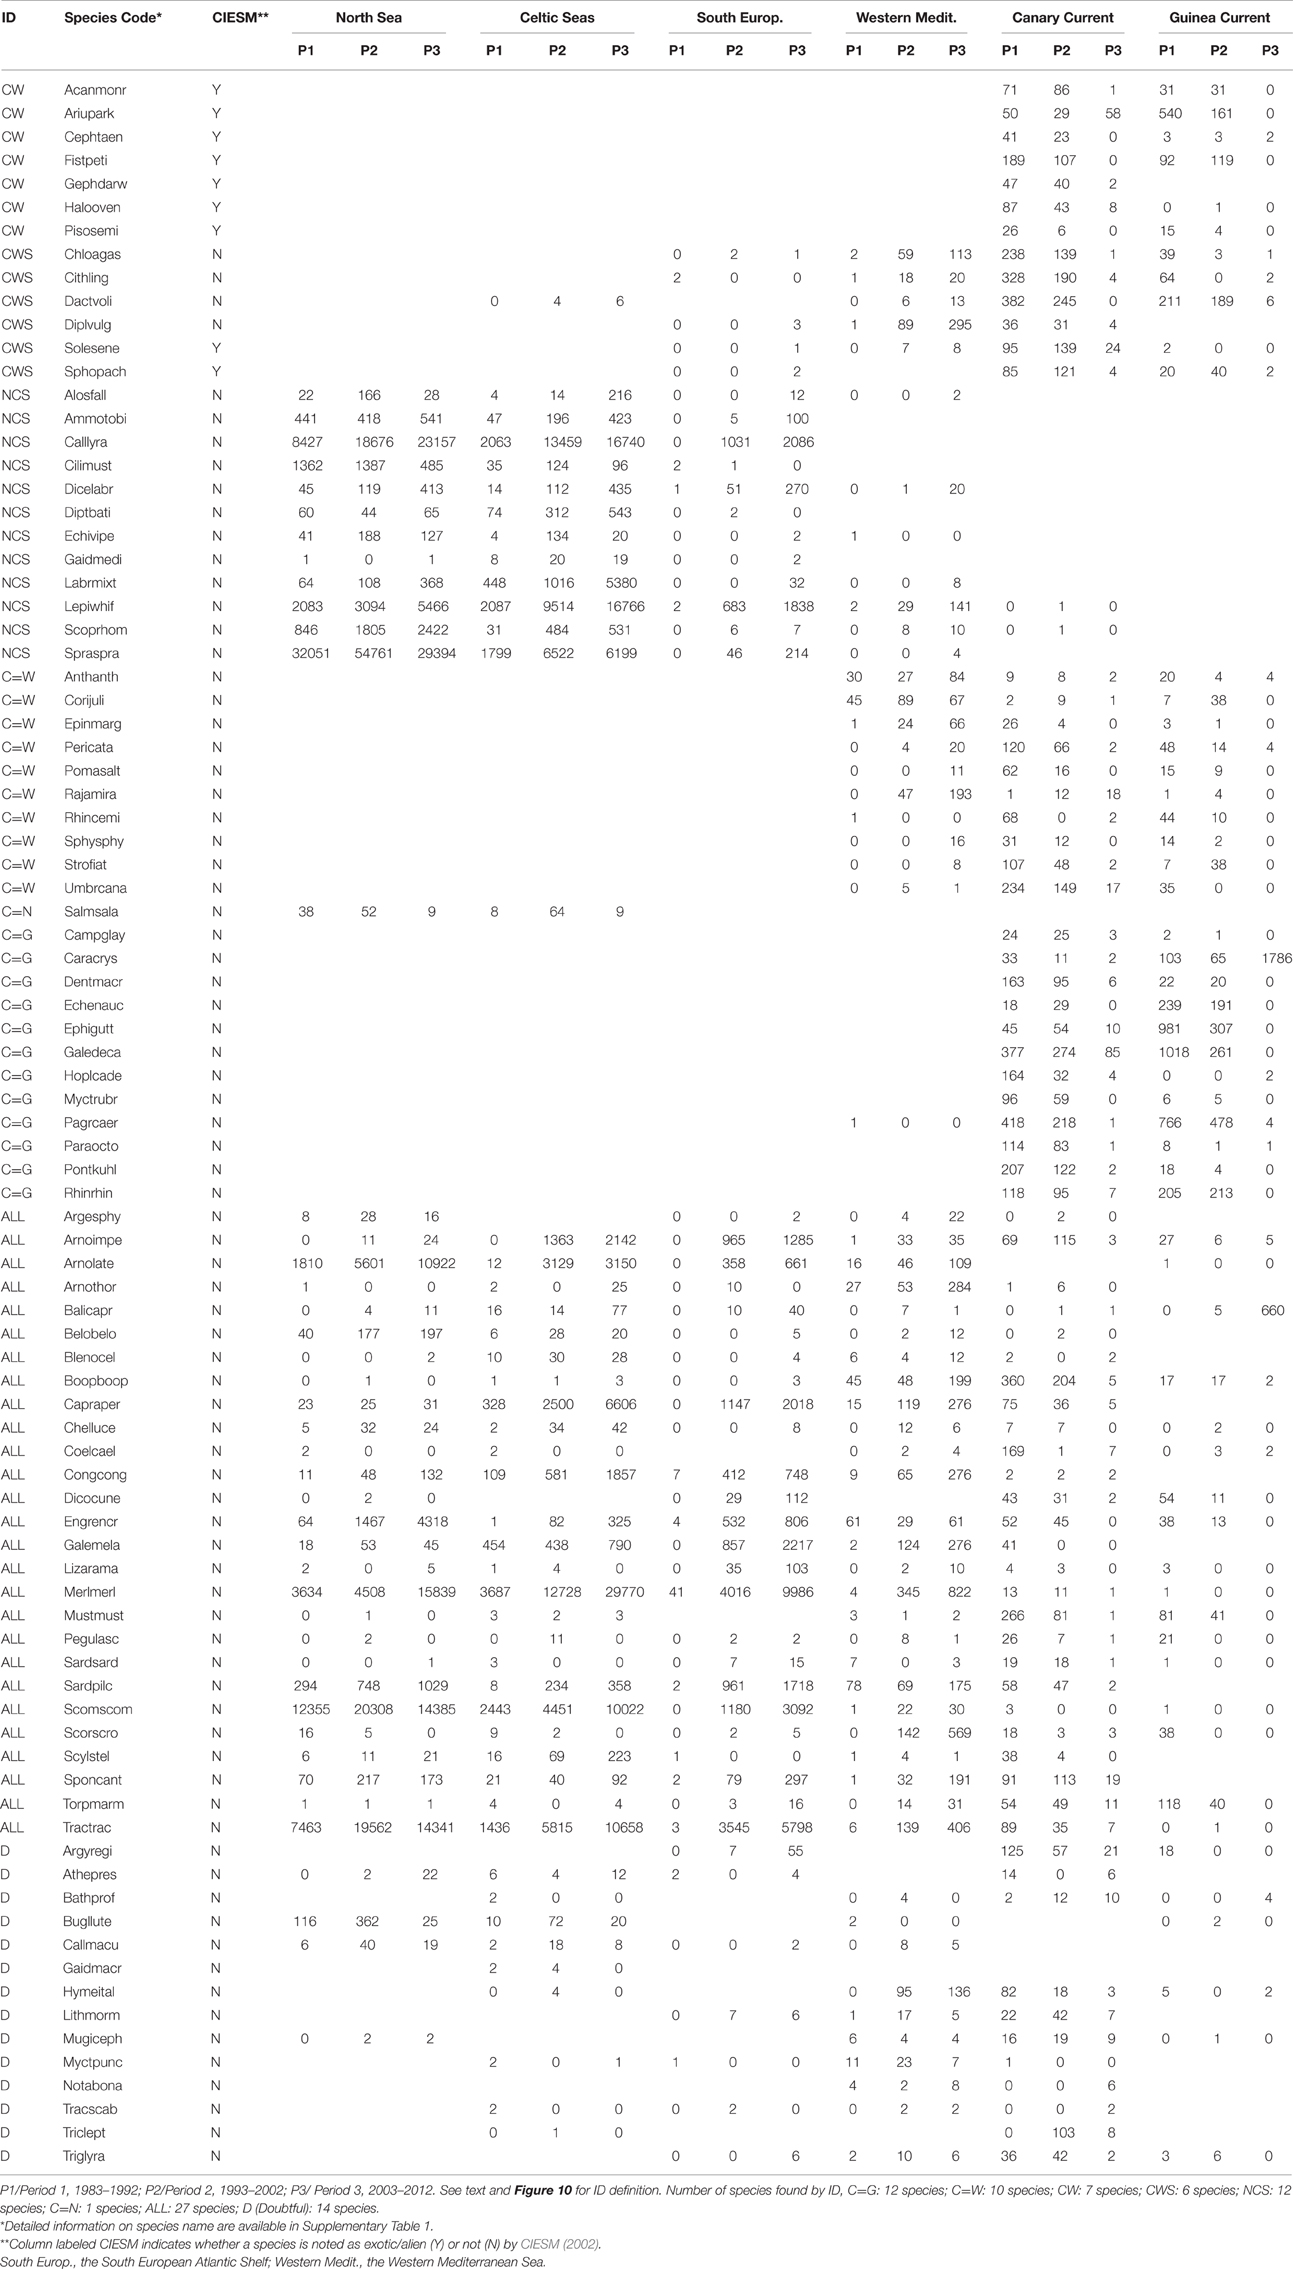
Table 3. Number of species' occurrence by ecosystem in each decadal period.
Thirty-five species shared their area of distribution with the adjacent ecosystem or moved among ecosystems according to season. Among these species, 10 species were always found in both the Canary Current and the Western Mediterranean Sea (ID: C = W). Twelve species from the Canary Current had ranges that included the Guinea Current (ID: C = G). Thirteen species were present in both the Celtic Seas and the North Sea (ID: C = N), and among those 13 species, 12 also reached the South European Atlantic Shelf (ID: NCS) (Table 3).
Regarding the last 41 species studied, it was unclear whether they are moving or not. Among these species, 27 were always present in all ecosystems and at all periods of the study (ID: ALL in Table 3), and 14 species were present with very low occurrence records (ID: D in Table 3).
The species of Atlantic-origin that have been observed in Mediterranean waters in the last period are among the species listed as exotic for the Mediterranean Sea by the CIESM (2002) (ID: CW in Table 3). Six species originated from the Canary Current and the Mediterranean Sea have been recently found in the South European waters: Chlorophthalmus agassizi, Citharus linguatula, Dactylopterus volitans, D. vulgaris, S. senegalensis, and Sphoeroides pachygaster. These findings highlighted the importance of the South European Atlantic Shelf as a transition zone and as a target zone for southern species when water temperature rises.
All of the species studied were mostly found in the area less than 200 m deep (Figures 10B, 11). The values of depth presented here are the depths of the area where the species was observed. A total of 1801 occurrences with unique depth values were recorded. Ninety percent of these occurrences were found in area less than 166 m deep.
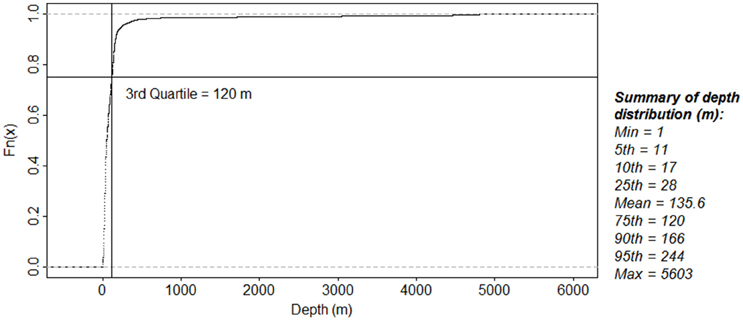
Figure 11. Distribution of depth area of all species studied in all seasons. 75% of the total 1801 unique depth occurrences were found in areas less than 120 m.
Discussion
The results of our study present the effect of climate change on fish species distributions. It confirms and shows how species respond to climate change by shifting their area of distribution and increasing their depth range. Many southern species extended their area of distribution into the middle region of the South European Atlantic Shelf and the Western Mediterranean Sea (Figure 5), highlighting the importance of these areas as a transition zones. Among the species studied, at least seven species from the Canary Current tended to be found in the Western Mediterranean Sea, and six species from these two regions extended their area of distribution to the South European Atlantic Shelf when the temperature become suitable. As for the northern species, the response to the environmental changes noticeable through the extension of their depth area range (see Figures 6, 7 for the case of A. tobianus). Other species move among ecosystems according to seasons.
Number of Species
The number of species varies and decreases with increasing latitude, the tropical area being often several times richer in species than temperate ones (Gaston, 2000), and the causes being still under debate (Clarke and Gaston, 2006).
The increasing number of species in an ecosystem was generally followed by the decreasing number of species in the adjacent region. For example, in the Celtic Seas, despite the increase of occurrence records over time, the number of species showed a decreasing trend (Figure 4B); in contrast, the number of species was increasing in the South European Atlantic Shelf, and stable in the North Sea even though the number of occurrences in the last period was decreasing. The studies conducted by Hiddink and Hofstede (2008) in the latter region found that the species richness in the northern part of the North Sea increased over time. This result was also confirmed by Cheung et al. (2009).
Information is sometimes insufficient for political and/or financial reasons in some areas, as is the case for Portugal and Moroccan waters in our study. In contrast, many observed occurrences are available from well-financed, data-sharing countries, even if the real densities may be higher elsewhere (Beck et al., 2014). Our study covers a wide latitudinal area (tropical, subtropical, and temperate waters) to obtain a complete picture of species distribution. Despite the high number of occurrences (above 100,000 records) coming from numerous scientific expeditions in the temperate regions (the North Sea and the Celtic Seas), species diversity is lower than that observed in the tropical regions, where scientific observations are rare and we consequently have fewer than 7000 recorded occurrences: see again Figure 4.
Bias in species occurrences could lead to a distorted view of the pattern of species distributions (Yang et al., 2013). Several factors can cause such biases, such as spatial scale, survey location, sampling techniques, misidentification, and species mobility. The quality issues of some data sources, such as their lack of transparency, have been noted by many authors and publicly criticized (Soberón et al., 2002; Graham et al., 2007; Yesson et al., 2007), especially for records coming from the natural history museums that are rarely collected optimally. Negotiating access to several biodiversity databases that are not yet publicly available is a near-future task, as stressed by Yesson et al. (2007). Thus, data gaps in certain areas could be filled. Nevertheless, many improvements have been achieved and large amounts of good-quality data are already available, are increasingly used and encourage research in many applications.
In the middle and southern ecosystems of the study area, our data in the last period were insufficient for analysis of species richness (Figures 4E,F). Nevertheless, the middle regions of the study area (the South European Atlantic Shelf and the Mediterranean Sea) received many tropical species from the lower latitudes that furthermore change the pattern of species distribution as well as species richness in this area. Zenetos et al. (2010) stated that the presence of tropical-Atlantic species in the central region confirms the phenomenon of “tropicalisation” of both pelagic and demersal species. Although the increasing numbers of species in the South European Atlantic Shelf and the Western Mediterranean Sea was influenced by the increasing number of occurrence records, many studies confirm the increasing frequency and biomass of tropical species in these areas (i.e., Deidun et al., 2011). Bañón et al. (2010) suggested that the presence of tropical species of African origin in the central region of the study area reflects actual natural changes rather than increased sampling effort. The recent observations of tropical-Atlantic species, such as S. senegalensis and D. vulgaris, in the central study area during autumn suggest that these species' ranges have expanded northwards. Borges et al. (2004) and Bañón et al. (2010) opined that these phenomena were probably linked to global warming.
Evolution of Temperature and Similarity of Ecosystems
Many studies have identified temperature as the dominant environmental factor limiting species distributions (Santos, 2001; Borges et al., 2003). The vast majority of fish species do not have the capability to regulate body temperature, thus their ability to avoid or select environmental temperature is one of the critical components of their behavioral repertoire. Temperature controls reproduction, growth and the availability of food (Summerson et al., 2007). Although temperature is not the only forcing parameter, Cheung et al. (2009) stated that the response of marine species to environmental change, such as ocean warming, is expressed by a shifting of their latitudinal or depth range and changes in the pattern of species richness.
In the southern part of the study area, newly recorded tropical species in the South European Atlantic Shelf (ID CWS in Figure 10) could confirm the effect of climate change in shifting species distributions. Six species originating from the Canary Current and the Western Mediterranean Sea extend their distributions to this area (Figures 8, 10). Bañón et al. (2010) stated that the arrival of numerous tropical fish in this region seems to have altered the traditional species distribution patterns in the area, and they have argued that this is probably linked to global warming. Although temperature is not the only parameter influencing species distribution, the difference of mean SST between the middle and the southern ecosystems during summer was reduced (3.6°, see Table 2). This condition could allow the southern tropical species to migrate to the central region (other limiting factors not considered). However, the absence of survey data or low records of species occurrences in the earlier period in this region limit our view and prevent us from definitively attributing this phenomenon to ocean warming. Nevertheless, many studies suggested that increasing temperatures were the major cause of the presence of tropical species, as mentioned previously. Moreover, the steady increase of SST observed in all regions (Supplementary Figure 5) may promote species emigration, especially in the intermediate regions. Thus, their distribution range is expectedly expanding, as stated also by Kaschner et al. (2011).
In the northern part of the study area, the movements of species distribution seem to be strongly correlated with seasonal environmental change. Hiddink and Hofstede (2008) stated that biodiversity at high latitudes in the subtropical and temperate waters seem to be highly sensitive to climate change. A. tobianus is mostly found in the South European Atlantic Shelf during autumn, while in spring and summer, it can be found both in the North Sea and the Celtic Seas. The mean autumnal temperature in the South European Atlantic Shelf was close to summer temperatures in the Celtic Seas and the North Sea (Table 2). The mean SSTs during spring and summer of the North Sea and the Celtic Seas are close to each other (see also Figure 8).
Migration Routes
Our study suggests a generally northward route of species migration. We are somewhat confident of the records of tropical-Atlantic species' presence in the middle region of the study area. In this study, seven species from the Canary Current were found in the Western Mediterranean Sea. Zenetos et al. (2010) noted the increasing number of alien fish species in this region, with a parallel increase in the number of the Atlantic migrant fish species. Deidun et al. (2011) noted 33 exotic fish of Atlantic origin present in the Mediterranean Sea. Many of these species have already become well established and expanded their distribution into the entire basin, suggesting also an eastward movement (CIESM, 2002).
Our study showed also that species' preferential depth and seasonal variation are important factors on species movement. Some species could be observed more in the North Sea in certain seasons, while in the other seasons; they would be more observed in the Celtic Seas or in the South European Atlantic Shelf (Figure 6). The northernmost area of the North Sea has deeper waters than the southern area. As a consequence, species with a preferential depth of 100–200 m, such as Lepidorhombus whiffiagonis, are more comfortable in the northern part of the region, while species with preferential depth less than 50 m, such as A. tobianus, are much more often present in the southern part of the region. Hence, if the winter or spring temperature increases, L. whiffiagonis would migrate northwards, while A. tobianus can migrate eastwards rather than northwards considering its preferential depth range (Figure 6). Bakun (2006) mentioned that the success of fish recruitment is strongly influenced by three categories (known as the fundamental triad) of oceanographic processes: enrichment (such as upwelling and river run-off), concentration (occurs in areas such as fronts and river plumes) and retention (such as fronts, currents, and circulation patterns).
Fronts are narrow boundary zones that separate water masses (Mason et al., 2005). Fronts have stronger gradients of many water properties and are more productive, with increased nutrient and plankton concentrations. These environments may benefit adult fish as well as larvae and eggs. Fronts are ubiquitous features in the South European Atlantic Shelf or in eastern ocean boundaries that act as barriers and reduce the export of particles from coastal waters to the continental shelf (Bakun, 2006). Thus, they act also as potential barriers to planktonic dispersal and adult migration (Figure 12): see Mason et al. (2005) for details.
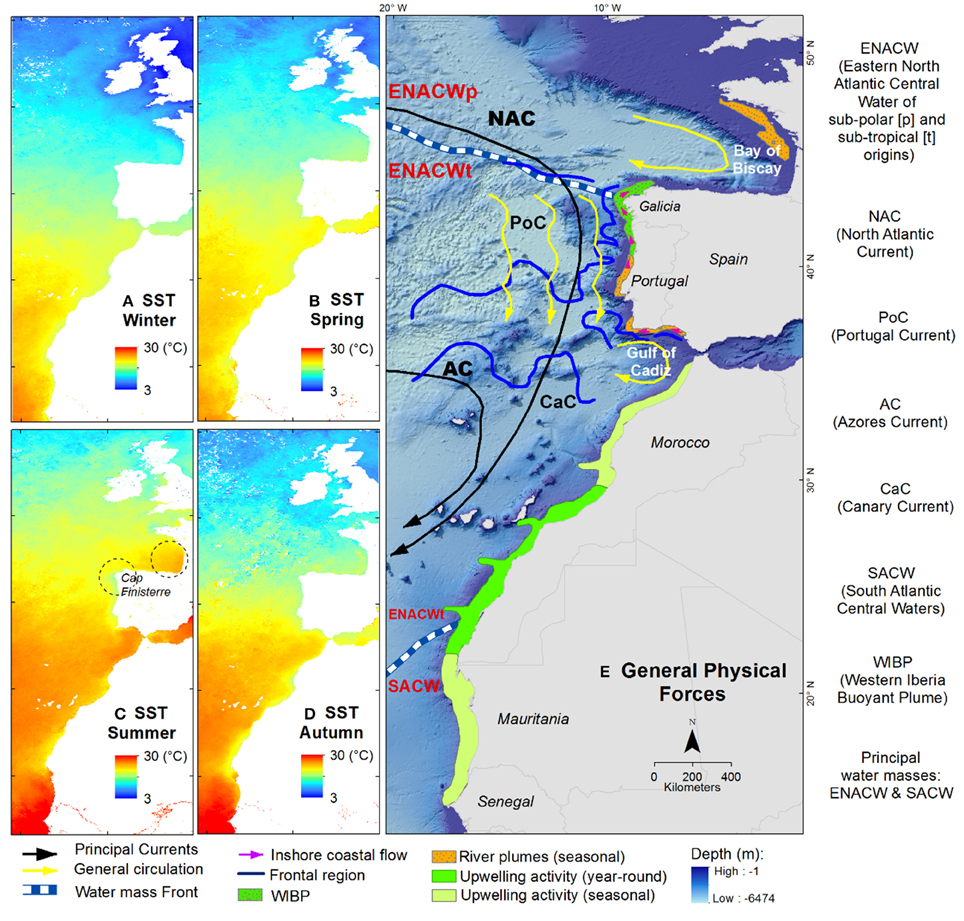
Figure 12. Mean SST seasonal climatology of the study area, 1982–2012. (A) Winter; (B) spring; (C) summer; (D) autumn; (E) main hydrological structures (Koutsikopoulos and Le Cann, 1996; Peliz et al., 2002, 2005; Mason et al., 2005).
Nutrient availability, salinity, dispersal rates, the seafloor profile, and oceanographic force can also influence the patterns of species distribution and species composition. All of these combined factors can lead to fish migrations, especially of highly tolerant and naturally adaptable invasive species (Hiddink and Hofstede, 2008).
The upwelling zones (off the Portuguese coast in the South European Shelf and off the Moroccan and Mauritanian coast in the Canary Current) with nutrient-rich water increase primary production and in turn food for higher trophic levels, hence supporting high fish production (Aggrey-Fynn, 2007). During summer, from June to October, Borges et al. (2004) mentioned that the upwelling system of the Canary Current ecosystem reach Portugal waters and brings colder and nutrient-rich waters to the surface. This could be one of the reasons of the presence of tropical Atlantic waters in the area. Furthermore, Borges et al. (2004) also mentioned that the presence of denser, more saline Mediterranean waters in this transitional zone bring a number of Mediterranean species to the region. Bañón et al. (2010) explains that upwelling off Cape Finisterre from March to October (Figure 12C) is probably the reason for the presence of cool-water species in this area, while they are absent or scarce in the Bay of Biscay. The water in Cape Finisterre is noticeably colder than in the northern Galician coast and the Bay of Biscay. In contrast, warm-water species are present in the Bay of Biscay and absent or scarce off Cape Finisterre.
The sharp north-to-south temperature gradient in the South European Atlantic Shelf, the bathymetry with a narrow continental shelf, and the condition oceanographic in the area mentioned above could restrict the distribution of many species (Borges et al., 2004; Bañón et al., 2010; Figure 12). Other limiting factors such as over-exploitation and habitat loss are also important influencing species diversity pattern (Hiddink and Hofstede, 2008). Disturbance from fishing activities may influence species distributions by reorganizing the fish assemblage (Summerson et al., 2007). Garrison and Jason (2000) stated that the spatial differences in exploitation rates can modify the pattern of species distribution. Fishing activities remove and reduce the regional abundance of predator species, which cascades to lower trophic levels (Martins et al., 2012). If the abundance of the less exploited or less predated species increases, expansion of their distribution as an indirect impact is then possible (Martins et al., 2012). An FAO statistics report (FIGIS, 2016) showed a diminishing trend of catches in European Atlantic regions, whereas an increase of captures was observed in the Eastern Central Atlantic (Supplementary Figure 6) which is the potential source of our migrating species. In the central region of the South European Atlantic Shelf, Borges et al. (2004) and Teixeira et al. (2014) mentioned that the catch of colder marine species has decreased in recent decades, while the catch for warm marine species has increased considerably. Although fishing activities could be important in determining species distribution patterns, fishing effects were not considered the major driver in this study.
In this study, we incorporated several data sources including publicly available databases as well as unpublished databases. We took several measures to minimize the risk of bias, including using recent records (after 1982 only), excluding occurrences lacking time of observation, performing a strict selection of species studied by number of occurrence, and removing suspicious occurrences. These databases enabled the investigation of patterns of species distributions at large spatial and temporal scales to better understand how species extend their area of distribution (mostly northward in the Atlantic European waters and also eastward in the Mediterranean basin in response to environmental change. Further study is needed to gain additional insights on species seasonal movements and depth range across this large spatial extent. Species distribution modeling based on species environmental niches is promising, as results could be used to predict species ranges and species richness. The use of such models could be an alternative or a complementary approach to the limitation in availability of data at large scale, and would lead to a better understanding of species distribution and biodiversity changes, and enable the identification of present and future high-biodiversity areas.
Author Contributions
The first author wrote the scripts and adapted GIS software to analyze data. All authors listed, have made substantial, direct and intellectual contribution to the work, and approved it for publication.
Conflict of Interest Statement
The authors declare that the research was conducted in the absence of any commercial or financial relationships that could be construed as a potential conflict of interest.
Acknowledgments
The financial support for this research was provided by DIKTI (Ministry of Higher Education of the Republic of Indonesia) and ANR (The French National Research Agency) EPURE project (grant ANR-11-CEPL-0005, http://anr-epure.net), to which the first author is grateful. We thank LEMAR (Marine Environmental Sciences Laboratory) and IRD (Institute of Research for Development, France) for their laboratories' welcoming hospitality, collegiality and support during the research process at the University of Brest, France. The authors are also thankful to all of the projects that provided the data used for this study (The AMPHORE Project, The Nansen Survey, The ISTAM Project), as well as to all the institutions that have shared their data in GBIF and OBIS.
The authors are also grateful to the many contributors to the free software QGIS (http://qgis.org/en/site/), Beam VISAT (http://www.brockmann-consult.de/cms/web/beam/) and the R statistical language (R Core Team 2015: http://R-project.org), which are all invaluable tools for the whole scientific community.
Supplementary Material
The Supplementary Material for this article can be found online at: https://www.frontiersin.org/article/10.3389/fmars.2016.00162
References
Aggrey-Fynn, J. (2007). The Fishery of Balistes capriscus (Balistidae) in Ghana and Possible Reasons for its Collapse. Dissertation, University of Bremen, Bremen.
Auber, A., Travers-Trolet, M., Villanueva, M. C., and Ernande, B. (2015). Regime shift in an exploited fish community related to natural climate oscillations. PLoS ONE 10:e0129883. doi: 10.1371/journal.pone.0129883
Bakun, A. (2006). Fronts and eddies as key structures in the habitat of marine fish larvae: opportunity, adaptive response and competitive advantage. Sci. Mar. 70, 105–122. doi: 10.3989/scimar.2006.70s2105
Bañón, R. (2004). New records of two southern fish in galician waters (NW Spain). Cybium 28, 367–368. Available online at: http://digital.csic.es/handle/10261/48698
Bañón, R., Villegas-Rios, D., Serrano, A., Mucientes, G., and Arronte, J. C. (2010). Marine fish from Galicia (NW Spain): an update checklist. Zootaxa 2667, 1–27.
Becker, J. J., Sandwell, D. T., Smith, W. H. F., Braud, J., Binder, B., Depner, J., et al. (2009). Global bathymetry and elevation data at 30 arc seconds resolution: SRTM30_PLUS. Mar. Geod. 32, 355–371. doi: 10.1080/01490410903297766
Beck, J., Böller, M., Erhardt, A., and Schwanghart, W. (2014). Spatial bias in the GBIF database and its effect on modeling species' geographic distributions. Ecol. Inform. 19, 10–15. doi: 10.1016/j.ecoinf.2013.11.002
Bilecenoglu, M., Kaya, M., and Eryigit, A. (2009). New data on the occurrence of two alien fishes, Pisodonophis semicinctus and Pomadasys stridens, from the Eastern Mediterranean Sea. Mediterr. Mar. Sci. 10, 151–155. doi: 10.12681/mms.117
Borges, M. F., Hill, L., Mendes, H., Santos, A. M., and Salgado, M. (2004). “Regime shift effects on fish community metrics measured in the West Portugal upwelling area,” in ICES Conference and Meetings 2004/M11 (Copenhagen).
Borges, M. F., Santos, A. M. P., Crato, N., Mendes, H., and Mota, B. (2003). Sardine regime shifts off Portugal: a time series analysis of catches and wind conditions. Sci. Mar. 67, 235–244. doi: 10.3989/scimar.2003.67s1235
Brito, A., Clemente, S., and Herrera, R. (2011). On the occurrence of the African hind, Cephalopholis taeniops, in the Canary Islands (eastern subtropical Atlantic): introduction of large-sized demersal littoral fishes in ballast water of oil platforms? Biol. Invas. 13, 2185–2189. doi: 10.1007/s10530-011-0049-0
Casey, K. S., Brandon, T. B., Cornillon, P., and Evans, R. (2010). “The Past, Present, and Future of the AVHRR Pathfinder SST Program,” in Oceanography from Space, eds V. Barale, J. F. R. Gower, and L. Alberotanza (Dordrecht: Springer Netherlands), 273–287.
Cheung, W. W. L., Lam, V. W. Y., Sarmiento, J. L., Kearney, K., Watson, R., and Pauly, D. (2009). Projecting global marine biodiversity impacts under climate change scenarios. Fish Fish. 10, 235–251. doi: 10.1111/j.1467-2979.2008.00315.x
Chiarucci, A., Bacaro, G., and Scheiner, S. M. (2011). Old and new challenges in using species diversity for assessing biodiversity. Philos. Trans. R. Soc. B Biol. Sci. 366, 2426–2437. doi: 10.1098/rstb.2011.0065
CIESM (2002). CIESM Atlas of Exotic Fishes in the Mediterranean Sea. Available online at: http://www.ciesm.org/atlas/appendix1.html (Accessed August 3, 2015).
Clarke, A., and Gaston, K. J. (2006). Climate, energy and diversity. Proc. R. Soc. B Biol. Sci. 273, 2257–2266. doi: 10.1098/rspb.2006.3545
Deidun, A., Castriota, L., and Arrigo, S. (2011). A tale of two Atlantic fish migrants: records of the lesser amberjack Seriola fasciata and the African hind Cephalopholis taeniops from the Maltese Islands. J. Black Sea Mediterr. Environ. 17, 223–233.
Edwards, M., Beaugrand, G., Helaouët, P., Alheit, J., and Coombs, S. (2013). Marine Ecosystem Response to the Atlantic Multidecadal Oscillation. PLoS ONE 8:e57212. doi: 10.1371/journal.pone0057212
FIGIS (2016). FAO Fisheries & Aquaculture - Fishery Statistical Collections - Global Capture Production. Available online at: http://www.fao.org/fishery/statistics/global-capture-production/en (Accessed March 14, 2016).
Galil, B. S., and Zenetos, A. (2002). “A sea change. Exotics in the Eastern Mediterranean,” in Invasive Aquatic Species of Europe: Distribution, Impacts and Management, eds E. Leppäkoski, S. Gollasch, and S. Olenin (Dordrecht: Kluwer Academic Publishers), 325–336.
Garrison, L., and Jason, S. L. (2000). Fishing effects on spatial distribution and trophic guild structure of the fish community in the Georges Bank region. ICES J. Mar. Sci. 57, 723–730. doi: 10.1006/jmsc.2000.0713
Gomes, M. (2001). Spatial patterns of groundfish assemblages on the continental shelf of Portugal. ICES J. Mar. Sci. 58, 633–647. doi: 10.1006/jmsc.2001.1052
Graham, C. H., Elith, J., Hijmans, R. J., Guisan, A., Townsend Peterson, A., Loiselle, B. A., et al. (2007). The influence of spatial errors in species occurrence data used in distribution models: spatial error in occurrence data for predictive modelling. J. Appl. Ecol. 45, 239–247. doi: 10.1111/j.1365-2664.2007.01408.x
Hiddink, J. G., and Hofstede, R. T. (2008). Climate induced increases in species richness of marine fishes. Glob. Change Biol. 14, 453–460. doi: 10.1111/j.1365-2486.2007.01518.x
Johnston, M. W., and Purkis, S. J. (2011). Spatial analysis of the invasion of lionfish in the western Atlantic and Caribbean. Mar. Pollut. Bull. 62, 1218–1226. doi: 10.1016/j.marpolbul.2011.03.028
Kaschner, K., Tittensor, D. P., Ready, J., Gerrodette, T., and Worm, B. (2011). Current and future patterns of global marine mammal biodiversity. PLoS ONE 6:e19653. doi: 10.1371/journal.pone.0019653
Kaschner, K., Watson, R., Trites, A. W., and Pauly, D. (2006). Mapping world-wide distributions of marine mammal species using a relative environmental suitability (RES) model. Mar. Ecol. Prog. Ser. 316, 285–310. doi: 10.3354/meps316285
Koutsikopoulos, C., and Le Cann, B. (1996). Physical processes and hydrological structures related to the Bay of Biscay anchovy. Sci. Mar. 60, 9–19.
Lundblad, E. R., Wright, D. J., Miller, J., Larkin, E. M., Rinehart, R., Naar, D. F., et al. (2006). A benthic terrain classification scheme for American samoa. Mar. Geod. 29, 89–111. doi: 10.1080/01490410600738021
Margules, C. R., and Pressey, R. L. (2000). Systematic conservation planning. Nature 405, 243–253. doi: 10.1038/35012251
Martins, G. M., Arenas, F., Neto, A. I., and Jenkins, S. R. (2012). Effects of fishing and regional species pool on the functional diversity of fish communities. PLoS ONE 7:e44297. doi: 10.1371/journal.pone.0044297
Mason, E., Coombs, S., and Oliveira, P. B. (2005). An Overview of the Literature Concerning the Oceanography of the Eastern North Atlantic Region. Relatorios Cientificos e Tecnicos IPIMAR Serie Digital, Lisboa 33, 58.
Montero-Serra, I., Edwards, M., and Genner, M. J. (2015). Warming shelf seas drive the subtropicalization of European pelagic fish communities. Glob. Chang. Biol. 21, 144–153. doi: 10.1111/gcb.12747
Nathalie, H. (2015). ICES Ecoregions (2015). Available online at: http://www.marineregions.org/gazetteer.php?p=image&pic=106896 (Accessed February 6, 2016).
Oral, M. (2010). Alien fish species in the Mediterranean–Black Sea Basin Akdeniz Havzası'nda Görülen Yabancı Balık Türleri. Mediterr. Environ. 16, 87–132.
O'Reilly, J. E. (2013). Introduction Large Marine Ecosystems of the World. Available online at: http://www.lme.noaa.gov/index.php?option=com_content&view=article&id=108:animation-methods&catid=23&Itemid=101 (Accessed 31 October 2013).
Peliz, Á., Dubert, J., Santos, A. M. P., Oliveira, P. B., and Le Cann, B. (2005). Winter upper ocean circulation in the Western Iberian Basin—Fronts, Eddies and Poleward Flows: an overview. Deep Sea Res. Part I Oceanogr. Res. Pap. 52, 621–646. doi: 10.1016/j.dsr.2004.11.005
Peliz, Á., Rosa, T. L., Santos, A. M. P., and Pissarra, J. L. (2002). Fronts, jets, and counter-flows in the Western Iberian upwelling system. J. Mar. Syst. 35, 61–77. doi: 10.1016/S0924-7963(02)00076-3
Peristeraki, P., Lazarakis, G., Skarvelis, C., Georgiadis, M., and Tserpes, G. (2006). Additional records on the occurrence of alien fish species in the eastern Mediterranean Sea. Mediterr. Mar. Sci. 7, 61–66. doi: 10.12681/mms.170
Perry, A. L., Low, P. J., Ellis, J. R., and Reynolds, J. D. (2005). Climate change and distribution shifts in marine fishes. Science 308, 1912–1915. doi: 10.1126/science.1111322
Poloczanska, E. S., Burrows, M. T., Brown, C. J., Molinos, J. G., Halpern, B. S., Hoegh-Guldberg, O., et al. (2016). Responses of marine organisms to climate change across oceans. Front. Mar. Sci. 3:62. doi: 10.3389/fmars.2016.00062
Powell, A. M., and Xu, J. (2015). Decadal regime shift linkage between global marine fish landings and atmospheric planetary wave forcing. Earth Syst. Dyn. 6, 125–146. doi: 10.5194/esd-6-125-2015
Przeslawski, R., Falkner, I., Ashcroft, M. B., and Hutchings, P. (2012). Using rigorous selection criteria to investigate marine range shifts. Estuar. Coast. Shelf Sci. 113, 205–212. doi: 10.1016/j.ecss.2012.08.005
Quero, J. C., Bellail, R., De Casamajor, M. N., Leaute, J. P., Morandeau, G., Moriniere, P., et al. (2005). Observations ichtyologiques effectuées en 2004. 9, 483–490.
Quero, J. C., Bellail, R., and Spitz, J. (2004). Observations ichtyologiques effectuées en 2003. 9, 367–370.
Quero, J. C., Delmas, G., Du Buit, M. H., Fonteneau, J., and Lafon, A. (1986). Observations ichtyologiques effectuées en 1985. 7, 493–498.
Quero, J. C., Du Buit, M. H., Bernard, K., Laborde, J. L., and Fabien, M. (1991). Observations ichtyologiques effectuées en 1990. 7, 1065–1071.
Quero, J. C., Du Buit, M. H., Caill, N., De Casamajor, M. N., Cazeils, N., Dewez, A., et al. (1999). Observations ichtyologiques effectuées en 1998. 8, 925–934.
Quero, J. C., Du Buit, M. H., Fonteneau, J., Laborde, J. L., Morandeau, G., and Vayne, J. J. (1994). Observations ichtyologiques effectuées en 1993. 8, 359–369.
Quero, J. C., Du Buit, M. H., and Vayne, J. J. (1997). Les captures de poissons à affinités tropicales le long des côtes atlantiques européennes. Ann. de la Société des Sci. Naturelles de la Charente-Maritime 8, 651–673.
Quero, J. C., Lorance, P., and Tardy, J. (2000). Observations ichtyologiques effectuées en 1999 à bord du navire de recherche “Thalassa.” Annal. Soc. Sci. Nat. Charente-Maritime 8, 1047–1058.
Quero, J. C., Spitz, J., and Vayne, J. J. (2003). Observations ichtyologiques effectuées en 2002. Annal. Soc. Sci. Nat. Charente-Maritime 9, 275–279.
Quero, J. C., Spitz, J., Vayne, J. J., Auby, I., De Casamajor, M. N., Leaute, J. P., et al. (2009). Observations ichtyologiques effectuées en 2008. Annal. Soc. Sci. Nat. Charente-Maritime 9, 932–940.
Rossi, J.-P. (2011). Rich: an r package to analyse species richness. Diversity 3, 112–120. doi: 10.3390/d3010112
Santos, A. (2001). Sardine and horse mackerel recruitment and upwelling off Portugal. ICES J. Mar. Sci. 58, 589–596. doi: 10.1006/jmsc.2001.1060
Sætersdal, G., Bianchi, G., Strømme, T., and Venema, S. C. (1999). The Dr. Fridtjof Nansen programme 1975–1993. Investigations of Fishery Resources in Developing Regions. History of the Programme and Review of Results. Rome: Food and Agriculture Org.
Secretariat of NOBANIS, (2012). Risk-Mapping for 100 non-native Species in Europe. Copenhagen: Secretariat of NOBANIS.
Sherman, K., and Hempel, G. (eds.). (2009). The UNEP Large Marine Ecosystem Report: A Perspective on Changing Conditions in LMEs of the World's Regional Seas. UNEP Regional Seas Report and Studies No. 182. United Nations Environment Programme.
Soberón, J., Arriaga, L., and Lara, L. (2002). “Issues of quality control in large, mixed-origin entomological databases,” in Towards a Global Biological Information Infrastructure, eds H. Saarenmaa and E. S. Nielsen (Copenhagen: European Environment Agency), 15–22.
Sorte, C. J. B., Williams, S. L., and Carlton, J. T. (2010). Marine range shifts and species introductions: comparative spread rates and community impacts: range shifts and non-native species introductions. Glob. Ecol. Biogeogr. 19, 303–316. doi: 10.1111/j.1466-8238.2009.00519.x
Streftaris, N., and Zenetos, A. (2006). Alien marine species in the Mediterranean-the 100 “Worst Invasives” and their impact. Mediterr. Mar. Sci. 7, 87–118. doi: 10.12681/mms.180
Summerson, R., Darbyshire, R., and Lawrence, E. (2007). Invasive Marine Species Range Mapping. Canberra, ACT: Australian Governement, Bureau of Rural Sciences.
Teixeira, C. M., Gamito, R., Leitão, F., Cabral, H. N., Erzini, K., and Costa, M. J. (2014). Trends in landings of fish species potentially affected by climate change in Portuguese fisheries. Reg. Environ. Change 14, 657–669. doi: 10.1007/s10113-013-0524-5
Tittensor, D. P., Mora, C., Jetz, W., Lotze, H. K., Ricard, D., Berghe, E. V., et al. (2010). Global patterns and predictors of marine biodiversity across taxa. Nature 466, 1098–1101. doi: 10.1038/nature09329
Yang, W., Ma, K., and Kreft, H. (2013). Geographical sampling bias in a large distributional database and its effects on species richness-environment models. J. Biogeogr. 40, 1415–1426. doi: 10.1111/jbi.12108
Yesson, C., Brewer, P. W., Sutton, T., Caithness, N., Pahwa, J. S., Burgess, M., et al. (2007). How global is the global biodiversity information facility? PLoS ONE 2:e1124. doi: 10.1371/journal.pone.0001124
Zenetos, A., Gofas, S., Verlaque, M., Çinar, M. E., Garcia Raso, J. E., Bianchi, C. N., et al. (2010). Alien species in the Mediterranean Sea by 2010. A contribution to the application of European Union's Marine Strategy Framework Directive (MSFD). Part I. Spatial distribution. Mediterr. Mar. Sci. 11, 381–493. doi: 10.12681/mms.87
Keywords: species migration, atlantic-european waters, biogeographic, SST, bathymetry, GIS
Citation: Kaimuddin AH, Laë R and Tito De Morais L (2016) Fish Species in a Changing World: The Route and Timing of Species Migration between Tropical and Temperate Ecosystems in Eastern Atlantic. Front. Mar. Sci. 3:162. doi: 10.3389/fmars.2016.00162
Received: 08 June 2016; Accepted: 24 August 2016;
Published: 09 September 2016.
Edited by:
Carlos M. Duarte, King Abdullah University of Science and Technology, Saudi ArabiaReviewed by:
Andrés M. Cisneros-Montemayor, University of British Columbia, CanadaElisabetta Betulla Morello, National Research Council, Italy
Copyright © 2016 Kaimuddin, Laë and Tito De Morais. This is an open-access article distributed under the terms of the Creative Commons Attribution License (CC BY). The use, distribution or reproduction in other forums is permitted, provided the original author(s) or licensor are credited and that the original publication in this journal is cited, in accordance with accepted academic practice. No use, distribution or reproduction is permitted which does not comply with these terms.
*Correspondence: Awaluddin H. Kaimuddin, awal_buton@yahoo.co.id orcid.org/0000-0002-1290-4205