Shifts in Microbial Community Structure and Activity in the Ultra-Oligotrophic Eastern Mediterranean Sea Driven by the Deposition of Saharan Dust and European Aerosols
 Cui Guo1
  Xiaomin Xia1
  Paraskevi Pitta2
  Barak Herut3
  Eyal Rahav3
  Ilana Berman-Frank4
  Antonia Giannakourou5
  Anastasia Tsiola2
  Tatiana M. Tsagaraki2
  Hongbin Liu1*
- 1Division of Life Science, Hong Kong University of Science and Technology, Hong Kong, China
- 2Hellenic Centre for Marine Research, Institute of Oceanography, Heraklion, Greece
- 3Israel Oceanographic and Limnological Research, National Institute of Oceanography, Haifa, Israel
- 4Mina and Everard Goodman Faculty of Life Sciences, Bar-Ilan University, Ramat Gan, Israel
- 5Hellenic Centre for Marine Research, Institute of Oceanography, Anavyssos, Greece
The atmospheric deposition of gases and particulates from the Sahara Desert and European landmass is an important source of nutrients for the Mediterranean Sea. In this study, we investigated how such atmospheric input might affect bacterial metabolic activities and community dynamics in the ultra-oligotrophic Eastern Mediterranean Sea. Thus, a mesocosm simulation experiment was conducted using “pure” Saharan dust (SD) and mixed aerosols (A, polluted and desert origin). The cell specific bacterial production (BP) was stimulated soon after the addition of SD and A, with a higher degree of stimulation being observed in the activity of Alphaproteobacteria than in Gammaproteobacteria, and this lead to significant increases in community BP. Subsequently, a shift between these two dominating classes was observed (such that the proportion of Gammaproteobacteria increased while that of Alphaproteobacteria decreased), along with significant increases in bacterial abundance and chlorophyll a concentration. After a few days, although the abundance of bacteria was still significantly higher in the SD- or A-treated groups, differences in the active community composition between the treatment and control groups were reduced. The altered activity of the two dominating Proteobacteria classes observed, might reflect their different strategies in responding to external nutrient input: with Alphaproteobacteria being more responsive to the direct dust input, whereas Gammaproteobacteria seemed to benefit more from the increase in phytoplankton biomass. In addition, the input of A had a stronger immediate effect and longer lasting influence on changing the active bacterial community composition than did that of SD. Our findings show that episodic atmospheric deposition events might affect the microbial community with regards to their abundance, activity and composition over a short period of time, and thus regulate the function of the microbial community and carbon cycling in oligotrophic waters.
Introduction
The Mediterranean Sea (and particularly the eastern basin of the sea), is one of the most oligotrophic bodies of water in the world and is known as a low-nutrient-low-chlorophyll (LNLC) system with the biological production limited by phosphate (Krom et al., 1991; Pitta et al., 2005; Thingstad et al., 2005). However, the Mediterranean region receives a significant amount of aeolian material deposition, including both strong pulses of mineral dust and continuous deposition of anthropogenic aerosols (Guerzoni et al., 1999; Koçak et al., 2005). Each year, a high flux of dust from the Sahara, which is known to contain variable amounts of inorganic nutrients (especially phosphorus), is transported northeast to the adjacent Mediterranean Sea, with the highest loading being observed in the central and eastern basins during the spring (Moulin et al., 1997; Herut et al., 1999, 2002). The Mediterranean Sea also continually receives polluted air masses from populated areas of Europe; these contain high concentrations of nitrate and nitrite (NOx) as well as NH3 (Herut et al., 1999; Markaki et al., 2010). The ultra-oligotrophic conditions and high dust input make the Mediterranean Sea an ideal place to study the biogeochemical effects of atmospheric deposition.
Bacteria drive a wide range of biogeochemical processes that are important for the carbon and nutrient cycles in the ocean (Azam et al., 1983). They are an especially important component of oligotrophic ecosystems in which carbon flows mainly through the microbial food web. In ultra-oligotrophic systems, such as the Eastern Mediterranean Sea, bacterial growth is severely constrained by the bioavailable nutrients. Therefore, dust might be an important source of nutrients, which can strongly stimulate bacterial growth and significantly change bacterial assemblages. Indeed, in some cases, the bacterial community might be more responsive than large phytoplankton to dust due to their superior ability of taking up nutrients in oligotrophic waters (Pulido-Villena et al., 2008; Marañón et al., 2010). Several studies have been conducted to assess the effect of Saharan dust or European aerosols on the biogeochemical processes in the eastern Mediterranean (Herut et al., 2005), the western Mediterranean (Bonnet et al., 2005; Pulido-Villena et al., 2008; Lekunberri et al., 2010; Laghdass et al., 2011; Romero et al., 2011), and the Atlantic Ocean (Blain et al., 2004; Mills et al., 2004; Marañón et al., 2010). For example, previous dust addition experiments showed either increased (Herut et al., 2005; Pulido-Villena et al., 2008; Reche et al., 2009; Lekunberri et al., 2010), or unchanged bacterial abundance (Marañón et al., 2010; Laghdass et al., 2011) after the addition of Saharan dust. On the other hand, the stimulation of bacterial production (BP) was observed by almost all the studies that measured this parameter (Herut et al., 2005; Reche et al., 2009; Lekunberri et al., 2010; Marañón et al., 2010). Molecular techniques, such as denaturing gradient gel electrophoresis (DGGE) and fluorescence in situ hybridization (FISH), have been used to investigate the effect of Saharan dust on the composition of bacterial communities (Reche et al., 2009; Lekunberri et al., 2010; Marañón et al., 2010; Laghdass et al., 2011). The results to date, are inconclusive, as apparent changes in the bacterial assemblages were observed in some studies (Hill et al., 2010; Marañón et al., 2010; Laghdass et al., 2011), but in others, no direct effect of dust on bacterial community composition was demonstrated (Reche et al., 2009). However, there are several caveats and shortfalls in the above mentioned studies. First, few of the studies mimicked the scenario of a real natural dust deposition process from the perspective of the dust type (e.g., dust analog vs. “real” dust), the amendment concentration and the affecting season. Second, the response of active bacterial communities to atmospheric input was not well documented; for example, a time series investigation and high taxonomic resolution were lacking.
In this study, a mesocosm experiment was conducted by seeding natural Saharan dust (SD) and mixed aerosol (A) to investigate if the frequently occurring atmospheric deposition events might influence the activity and composition of microbes in the LNLC waters of the Eastern Mediterranean. In order to identify the composition of the active community alone, i.e., including the metabolically active and growing taxa, without interference from the senescent members of the community, we conducted phylogenetic profiling that was based solely on expressed 16S rRNA transcripts derived from cDNA, rather than on the more traditional 16S rRNA genes that may or may not be expressed. By evaluating the bacterial community at both the physiological and molecular levels, we aimed to answer the following questions: (1) Is there a fluctuation in the activities of different bacterial groups following input of SD or A? (2) Are there any differences between the effects induced by SD or A? (3) Is there any interaction between bacterial abundance, production, and active community composition in response to SD or A deposition? (4) Do heterotrophic bacteria respond directly to the addition of dust or do they respond to an increase in the activity of phytoplankton, (or do they respond to both)?
Methods
Mesocosm Experiment Setup
Surface seawater was pumped from a depth of 10 m using a submersible centrifugal water pump into acid-cleaned high-density polyethylene (HDPE) containers at a station about 5 nautical miles north of Heraklion (Crete, Greece, 35° 24.957 N, 25° 14.441 E) in the Eastern Mediterranean Sea (EMS) on May 9–10 2012. After seawater collection, the containers were immediately transported to the Hellenic Centre for Marine Research (HCMR) where the seawater was evenly distributed among nine 2.8–3 m3 mesocosms immersed in a large pool with water at an in situ temperature (19.5°C). Air bubbled through an airlift pipe gently mixed the water in the mesocosms. A transparent lid was used to protect the mesocosms from atmospheric aerosols and a layer of mesh was attached on the lid to mimic the light conditions at a 10 m-depth.
SD were collected from Heraklion and Sambas (Crete) as well as Beit Yannay (Isreal) during Saharan dust events, and A, which contained a natural mixture of desert dust and polluted European particles, were collected in Heraklion (Crete) and Haifa (Israel). The two amendment sources (i.e., SD and A) were added each to triplicate mesocosms at final concentrations of ~1.6 and ~1 mg L−1, respectively (Table 1). Triplicate mixtures of SD/A with 0.2 μm-filtered seawater were prepared in the acid-washed 100 mL polyethylene bottles before the experiment, and each of the concentrated mixture was then poured into the corresponding mesocosm bag at the beginning of the experiment. Three unamended mesocosms were kept as controls (C). The detailed dust collection and experimental setup protocols have been described in Herut et al. (this issue).
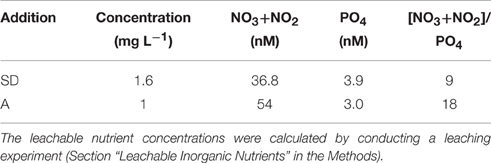
Table 1. The concentration of Sahara dust (SD) and mixed aerosol (A) added to the mesocosms, and leachable nutrient concentrations (nM) derived from these amendments.
The mesocosm experiment lasted for 9 days. The time of the SD/A addition was considered to be the first time point. After the addition of SD or A, samples were taken at 3 h and then daily (i.e., at day 1–9) throughout the course of the experiment.
Leachable Inorganic Nutrients
Leaching experiments were performed by two different methodologies using sterile surface seawater from different origins, in the nutrient laboratories of the Israel Oceanographic and Limnological Research (Haifa) (Herut et al., this issue) and at the University of Leeds (Krom et al., 2016).
Bacterial Production
BP was estimated by the 3H-leucine method (Kirchman, 1993). For each mesocosm, duplicate SD, A and control samples were incubated with a mixture of L-[4,5 3H]-leucine and non-radioactive leucine to a final concentration of 20 nM. Samples were incubated in the dark, at the in situ temperature, after which they were fixed and treated following the micro-centrifugation protocol (Smith and Azam, 1992), as described in detail by Van Wambeke et al. (2008). In brief, incubations were terminated after 2 h by the addition of trichloroacetic acid (TCA), samples were then centrifuged at 16 000 × g and the resulting cell pellet was washed twice with 5% TCA and twice with 80% ethanol. Incorporation of 3H-leucine into the TCA-insoluble fraction was measured by liquid scintillation counting after resuspension of the cell pellet in scintillation cocktail. Duplicate incubations had an analytical error < 10%. The optimal incubation time was determined with a time series experiment (i.e., from 1 to 8 h). Concentration kinetics optimization was also performed to ensure that the bacterial growth was not limited by the concentration of leucine.
Prokaryotic Abundance
The abundance of bacteria and autotrophic cyanobacteria (mainly Synechococcus spp.) was obtained by flow cytometric analysis using a FACSCalibur cell analyser, equipped with an air-cooled laser at 488 nm and standard filters (Becton Dickinson). Milli-Q water was used as the sheath fluid. For bacterial counts, samples were run at high speed for 1 min, whereas for autotrophic cyanobacterial counts, samples were run for 3 min. The exact flow rate of the high-speed FACS system was measured on a daily basis, and the abundance was calculated using the acquired cell counts and the respective flow rate. All flow cytometry data were acquired with the Cell Quest software and then processed with the Paint-A-Gate software.
To determine the abundance of bacteria, samples were fixed and processed according to Marie et al. (1999). Briefly, fixation was achieved with 0.2 μm pre-filtered 25% glutaraldehyde, to a final concentration of 0.5%. Samples were then kept at 4°C for ~20 min, after which they were deep frozen in liquid nitrogen and then stored at −80°C until enumeration. For the total bacteria counts, samples were thawed at room temperature and incubated with SYBR Green I nucleic acid dye, to a final concentration of 0.0025, for 10 min in the dark. When needed, samples were then diluted in Tris-EDTA buffer (TE, 10mM Tris and 1 mM EDTA, pH = 8), in order to achieve a rate between 100 and 700 events s−1. TE was autoclaved and 0.2 μm filtered immediately prior to dilution. Autotrophic cyanobacteria were identified by their autofluoresence and counted directly without fixation or staining. The abundance of heterotrophic bacteria was calculated by deducting the abundance of the autotrophic cyanobacteria from that of total bacteria.
RNA Collection, Extraction, and cDNA Synthesis
RNA samples were collected at 3 h, day 2 (D2) and day 6 (D6) in all mesocosms. Nine to ten liters of seawater were filtered over a period of 40 min through GF/D glass microfiber filters (2.7 μm, Whatman International Ltd.) and 0.2 μm pore-sized polyethersulfone membrane filters (Supor-200, Pall Corp.), using a peristaltic pump. Filters were immediately immersed in RNAlater (Ambion) in a 2 mL RNase-free tube and stored at −80°C.
Total RNA was extracted from the bacterial biomass between the 0.2 and 2.7 μm size fraction with the TRIzol plus RNA purification kit (Invitrogen, Carlsbad, CA). Before extraction with TRIzol reagent, the RNAlater was removed from the filters according to the procedure described by Xu et al. (2013). The filters containing bacterial biomass were incubated in 1 mL TRIzol reagent for 5 min at room temperature. The bacterial lysate was then shaken thoroughly for 15 s after adding 200 μL chloroform and incubated for 3 min again at room temperature. The filters and the undissolved cell debris were removed by centrifugation at 12,000 g for 15 min at 4°C and the supernatant containing RNA was transferred to a new RNA-free tube. An equal volume of 70% ethanol was mixed with the supernatant and the RNA was then purified and washed with the purification column and finally eluted in 50 μL elution buffer (Invitrogen, Carlsbad, CA). The extracted RNA concentration was measured on a NanoDrop 1000 Spectrophotometer (Thermo Scientific).
The purified RNA was reverse transcribed to cDNA using the SuperScript III first strand cDNA synthesis kit (Invitrogen, Carlsbad, CA). Prior to cDNA synthesis, DNase I (RNase free) was used to digest any residual DNA present in the RNA extracts. RNA of 8 μL was mixed with 1 μL random hexamer (50 ng μl−1), and 1 μL deoxynucleoside triphosphate (10 mM). The mixture was incubated at 65°C for 5 min and then placed on ice for at least 1 min, after which 10 μL cDNA synthesis mix [2 μL RT buffer (10 ×), 4 μL MgCl2 (25 mM), 2 μL dithiothreitol (0.1 M), 1 μL RNaseOUT (40 U μL−1) and 1 μL SuperScript III reverse transcriptase (RT, 200U/μL)], was added to the tube. The RT-PCR conditions were 25°C for 10 min, followed by 50°C for 50 min and finally 85°C for 5 min to terminate the reaction. Residual RNA was removed by the addition of 2 U RNase H at 37°C for 20 min. The transcribed cDNA from triplicate mesocosms were mixed together.
16S rRNA Gene Amplification and 454 Pyrosequencing
Fragments of bacterial 16S rRNA gene were amplified with 454 fusion primers of 16S-341F (5′- adaptor+MID+wordCCTACGGGAGGCAGCAG-3′) and 16S-787R (5′-adaptor+wordCCTATCCCCTGTGTGCCTTGGCAGTC-3′), which target the V3–V4 region of the 16S rRNA gene. The PCR reaction was carried out in 50 μL master mix including 5 μL of 10 × buffer, 2 μL of MgCl2 (25 mM), 4 μL of dNTPs (2.5 mM), 0.2 μL of Taq polymerase (5 U, Invitrogen, Carlsbad, CA), 1 μL of each primer (10 μM), 1 μL of DNA template and 35.8 μL water. The PCR fragments from different samples were identified by the 10-bp multiplex identifier (MID) tags assigned in the forward primers. The PCR for each sample was carried out in triplicate with the following thermal cycles: 95°C for 5 min, followed by 30 cycles of 95°C for 30 s, 55°C for 30 s, and 72°C for 40 s, and a final extension of 72°C for 7 min. The non-template and non-RT controls were always used as PCR negative controls to confirm that there was no contamination in the DNA templates or PCR reagents.
Triplicate PCR products were pooled and then gel-cut purified using the Gel Band Purification kit (GE Healthcare), as described by the manufacturer. The purified PCR products were quantified with the Quant-iT picoGreen dsDNA Assay Kit (Invitrogen, USA). An equal amount of each amplicon was mixed to prepare the amplicon library, and emPCR was performed to produce millions of identical copies of the 16S rRNA amplicon linked to each bead, according to the 454 Pyrosequencing manual (Roche, 454 Life Science). The DNA beads were deposited onto the PicoTiterPlate and sequenced on a GS Junior system according to the manufacturer's instructions (Roche, 454 Life Sciences).
Data Analysis
Sequence processing was performed using MOTHUR (http://www.mothur.org/wiki/) following the standard operating procedure described by Schloss et al. (2009). Low quality sequences tags were first removed to minimize the effect of random sequencing errors. Sequence denoising was carried out using the shhh.seqs command, with a sigma value of 0.01. We eliminated sequences that: (1) contained more than one ambiguous nucleotide (N) or more than 8 homopolymers; (2) were shorter than 300 bp; (3) did not match the primer at the beginning of the read; (4) contained chimeras (Edgar et al., 2011); or (5) were chloroplast-derived sequences. Sequences were classified using the greengenes database (http://greengenes.secondgenome.com/downloads), with a minimum threshold of 60%.
Sequences were clustered into Operational Taxonomic Units (OTUs) at cut-off values of 0.03. Sample coverage was calculated based on OTU assignment. Cluster analysis (based on Bray-Curtis similarity with a cut-off value of 0.03) and SIMPER analysis were performed with PRIMER5 (PRIMER-E Ltd, Plymouth).
Results
Hydrographical Background and Response of Bacterial Abundance and Production
The seawater used to fill the mesocosms exhibited ultra-oligotrophic characteristics, with a total dissolved inorganic nitrogen (DIN) concentration of 301 nM, a phosphate concentration of 9 nM (M. Tsapakis et al., unpubl.), and a chlorophyll a concentration of 0.06 μg L−1 (Herut et al., this issue). The nutrients released to the seawater from the SD and A amendments are shown in Table 1. Overall, 1.6 mg L−1 of SD released 36.8 nM NO3+NO2 and 3.9 nM PO4, whereas 1 mg L−1 of A released 54 nM NO3+NO2 and 3 nM PO4 (Table 1). These additions resulted in a lower leachable N/P ratio in the SD when compared to the A (i.e., 9 vs. 18, respectively; Table 1).
The abundance of the autotrophic cyanobacteria Synechococcus ranged from 1.8 × 10⁴ to 4.1 × 10⁴ cells mL−1, with the maximum abundance in the control and treatments occurring on D2 (Figure 1A). The largest relative increase in the treatments when compared with the control (= [treatment-control]/control × 100%) was ~40% on D2-D3. Overall, the abundance of Synechococcus showed a relative increase of ~15–40% after the addition of SD or A over the entire incubation period, except on D5 when a smaller increase of ~6% in the SD treatment group was observed (Figure 1A).
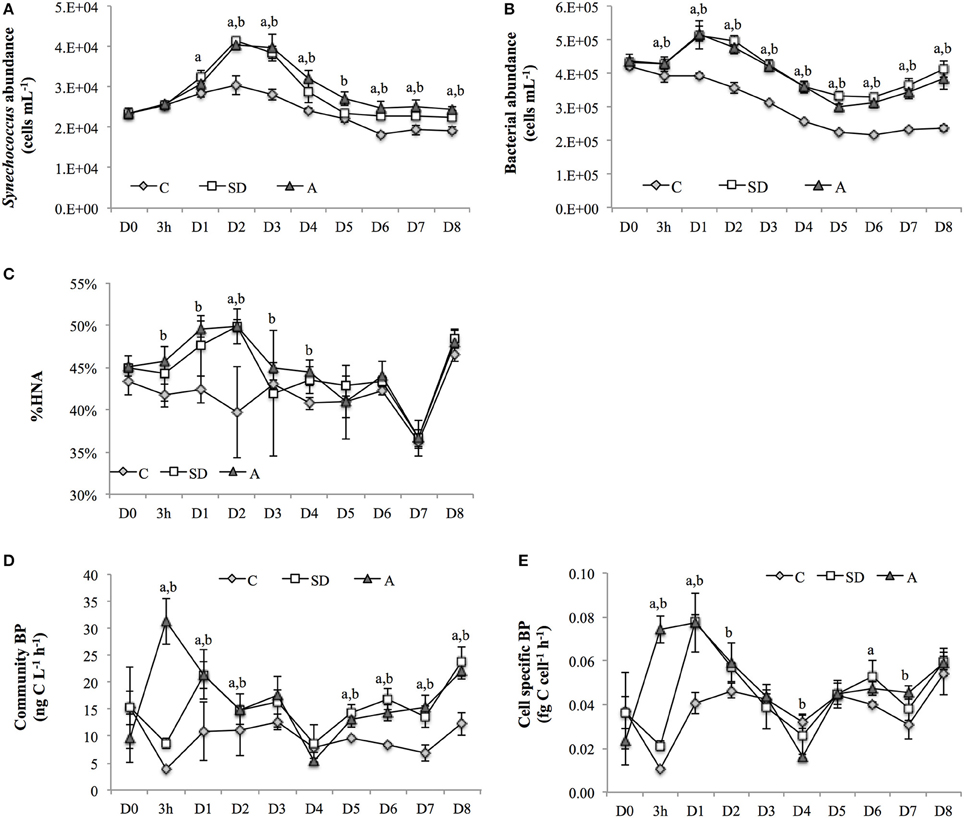
Figure 1. (A) Synechococcus abundance, (B) bacterial abundance, (C) percentage of high nucleic acid bacteria in total bacterial community (HNA%), (D) community bacterial production (BP), and (E) cell specific BP in the control, and SD and A treated groups. Error bars represent the standard deviation of measurements. Letters “a” and “b” indicate statistically significant mean values (p < 0.05) in the SD and A treatment groups, respectively, when compared with the corresponding controls (i.e., on the same day). It should be noted that the x-axis is not linearly scaled. SD, Sahara dust; A, mixed aerosol; C, control.
The abundance of bacteria ranged from 2 × 10⁵ to 5 × 10⁵ cells mL−1 throughout the experiment, with maximum and minimum values observed on D1 and D5, respectively. There were significant increases of 31–75% in the treatment groups when compared with the controls throughout the incubation period (Figure 1B). In addition, high nucleic acid (HNA) bacteria accounted for ~45% of the total heterotrophic bacteria community on D0. The percentage of HNA bacteria then increased in both the SD and A mesocosms at 3h and reached the largest increase on D2 (Figure 1C).
The community BP was immediately stimulated at 3 h after SD and A addition, with relative increases of 154 and 663%, respectively being measured. The significant increases in community BP in the SD and A groups were observed from 3 h to D2 and from D5 to D8 (Figure 1D). A similar response was also observed for the cell specific BP (Figure 1E). The community BP was significantly and positively correlated with the total bacterial abundance, with a correlation coefficient of 0.671 (p < 0.01; Table 2). Moreover, the community BP showed a significant positive correlation with the HNA bacterial abundance, but exhibited no significant relationship with low nucleic acid (LNA) bacteria. Both community and cell specific BP were significantly and positively correlated with the percentage of HNA (Table 2).
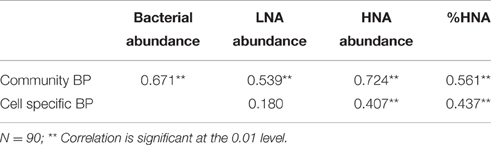
Table 2. Pearson correlations between the abundance of total bacteria, low nucleic acid (LNA) bacteria, high nucleic acid (HNA) bacteria, %HNA, and bacterial production (BP).
Sequencing Statistics and Community Comparison
After removing the low-quality sequences, a total number of 113,204 high quality reads with an average length of ~430 bp were generated for the nine samples. About 98–99% of the estimated richness was covered by the sequencing effort with a cutoff value set at 0.03.
According to the cluster analysis, the largest change in the active members of the bacterial community was observed at 3 h following SD and A amendment. The 3 h-SD and 3 h-A clustered together but were distant from the 3 h-C, which clustered with the D2-C. Similarities of 81.2% and 73.3% were calculated between each of the SD and A treatments and the control, respectively (Figure 2). On D2, the treatments were still distant from the control, with similarities of 79.7 and 81.9% being calculated between SD and the control, and A and control, respectively (Figure 2). On D6, the community differences between SD and control increased (88.5% similarity), whereas the similarity between A and the control remained at 80.9% (Figure 2).
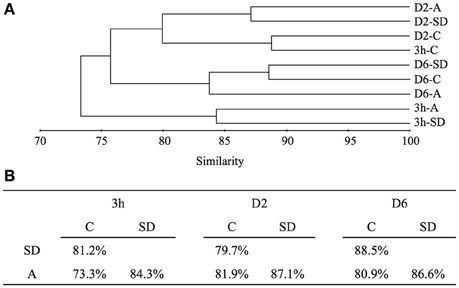
Figure 2. (A) UPGMA trees generated by cluster analysis based on Bray-Curtis similarity with an OTU clustering cut-off value of 0.03, and (B) similarity shared between C, SD and A at each sampling time point. SD, Sahara dust; A, mixed aerosol; C, control.
Phylogenetic Identification and Key OTUs
The majority of the classified sequences were affiliated to bacterial phyla of Proteobacteria, Cyanobacteria, and Bacteroidetes (Figure 3A). 16S rRNA transcripts affiliated to Proteobacteria dominated all libraries, accounting for ~80.3–91.8% of the total sequences, and the proportion only fluctuated slightly during the incubation, with a slight increase in the 3 h-SD group (88.7%) when compared with the 3 h-C group (83.7%); and a slight decrease in the D2-SD (82.2%) and D2-A (80.3%) groups when compared with the D2-C group (87.1%). The proportion of Cyanobacteria was ~5.6–12.8% across the experiment, with higher values in the 3 h-A group (12.2%) than in the 3 h-C group (7.4%); and in the D2-SD (8.6%) and D2-A (12.8%) groups than in the D2-C group (5.8%). 16S rRNA transcripts belonging to Bacteroidetes accounted for 0.9–8.6% across the experiment. The percentage of these transcripts showed a decrease in both treatment groups at 3 h, but increases in the SD input group on D2 and increases in both treatment groups on D6. Within the Proteobacteria phylum, the Alphaproteobacteria and Gammaproteobacteria were the most abundant classes, representing respectively ~28.8–51.3 and ~18.9–42.7% of all the classified sequences (Figure 3A). Within the Alphaproteobacteria, families belonging to the Rhodospirillales (Acetobacteraceae, Rhodospirillaceae), Rickettsiales (AEGEAN_112, Pelagibacteraceae), Rhizobiales (Cohaesibacteraceae, Hyphomicrobiaceae, Phyllobacteriaceae), Rhodobacterales (Rhodobacterales), and Kordiimonadales (Kordiimonadaceae) orders comprised the major fractions (Figure 3B). Gammaproteobacteria were basically composed of 16S rRNA transcripts affiliated to the Alteromonadales and Oceanospirillales orders (Figure 3C).
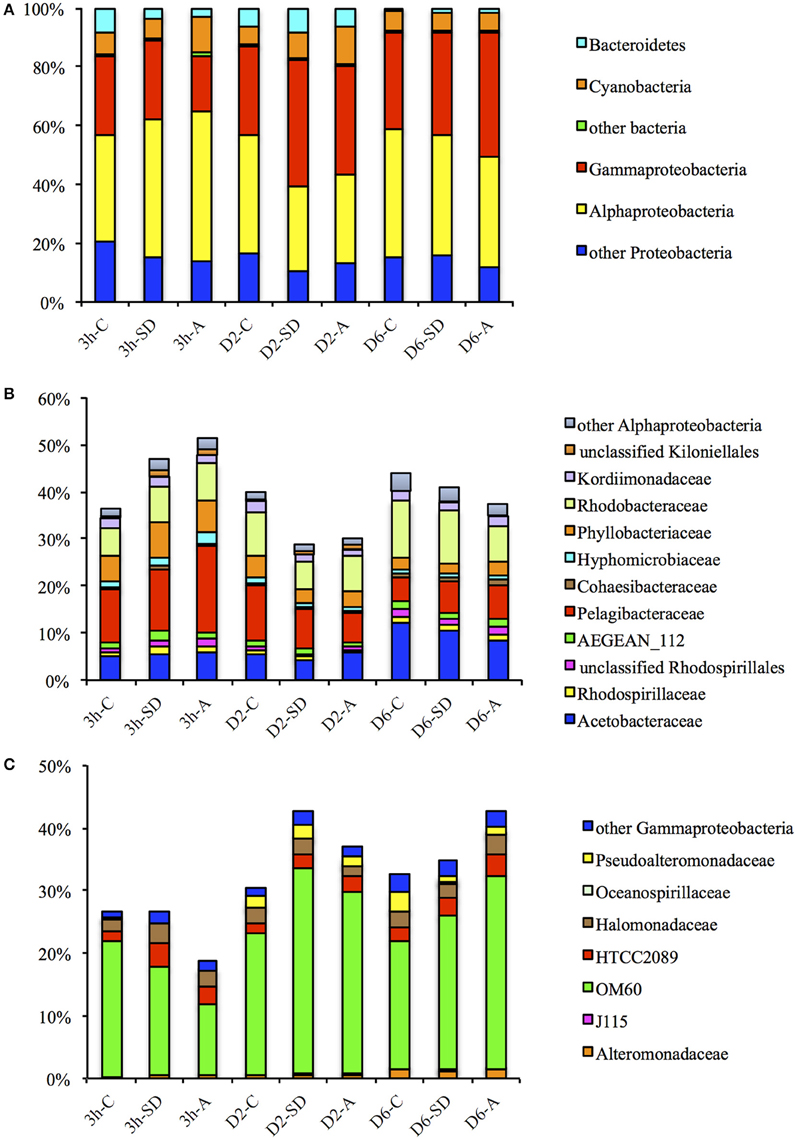
Figure 3. Percentages of (A) bacterial phyla and proteobacterial classes, (B) Alpha- and (C) Gamma-proteobacterial families in total bacterial reads for different samples. SD: Sahara dust; A: mixed aerosol; C: control.
Although the proportion of Proteobacteria did not show large changes in response to SD or A addition, the active members of the two dominant classes within the phylum exhibited clear shifts. At 3 h, the abundance of active Alphaproteobacteria exceeded that of Gammaproteobacteria. The percentage of 16S rRNA transcripts belonging to the Alphaproteobacteria was higher in the SD and A groups (with values of 47.0 and 51.4%, respectively) when compared with the control group (36.4%; Figure 3A). The proportion of active Pelagibacteraceae (the majority of which belonged to Pelagibacter ubique), as the most abundant family in the Alphaproteobacteria class, increased at 3 h in response to both SD and A when compared with the control (i.e., 11.4% in the control, 13.0% in SD, and 18.4% in A; Figure 3B). The share of another abundant family, Rhodobacteraceae (the majority of which belonged to Phaeobacter, Roseovarius, Sediminimonas, Silicibacter, and Thalassococcus), was also higher in the treatment groups at 3 h (i.e., 5.8% in the control, 7.7% in SD, and 8.0% in A; Figure 3B). In contrast, the relative abundance of 16S rRNA transcripts belonging to Gammaproteobacteria was lower in the treatment groups than in the control at 3 h (Figure 3A). OM60, which belongs to Alteromonadales, was the most abundant family of the Gammaproteobacteria and total Proteobacteria, and accounted for 11.3–32.8% of the total bacterial tags. At 3 h, the percentage of 16S rRNA transcripts of OM60 decreased from 21.5% in the control group to 17.1 and 11.3% in the SD and A groups, respectively (Figure 3C). The changes in the percentages of the top 10 OTUs that contributed most to the community variation between samples were obtained by SIMPER analysis (Figure 4). The active community variations between the control and treatment groups at 3 h were mainly caused by a decreased expression of the 16S rRNA genes of OM60 and Flavobacteriaceae and increased expression of the 16S rRNA genes of Pelagibacteraceae, Synchococcaceae, HTCC2089, and Phaeobacter gallaeciensis (Figures 4A,B). The difference between the active bacterial communities in the SD and A groups at 3 h was mainly due to different degrees of changes in OM60, Synechococcaceae, and Pelagibacteraceae (Figure 4C).
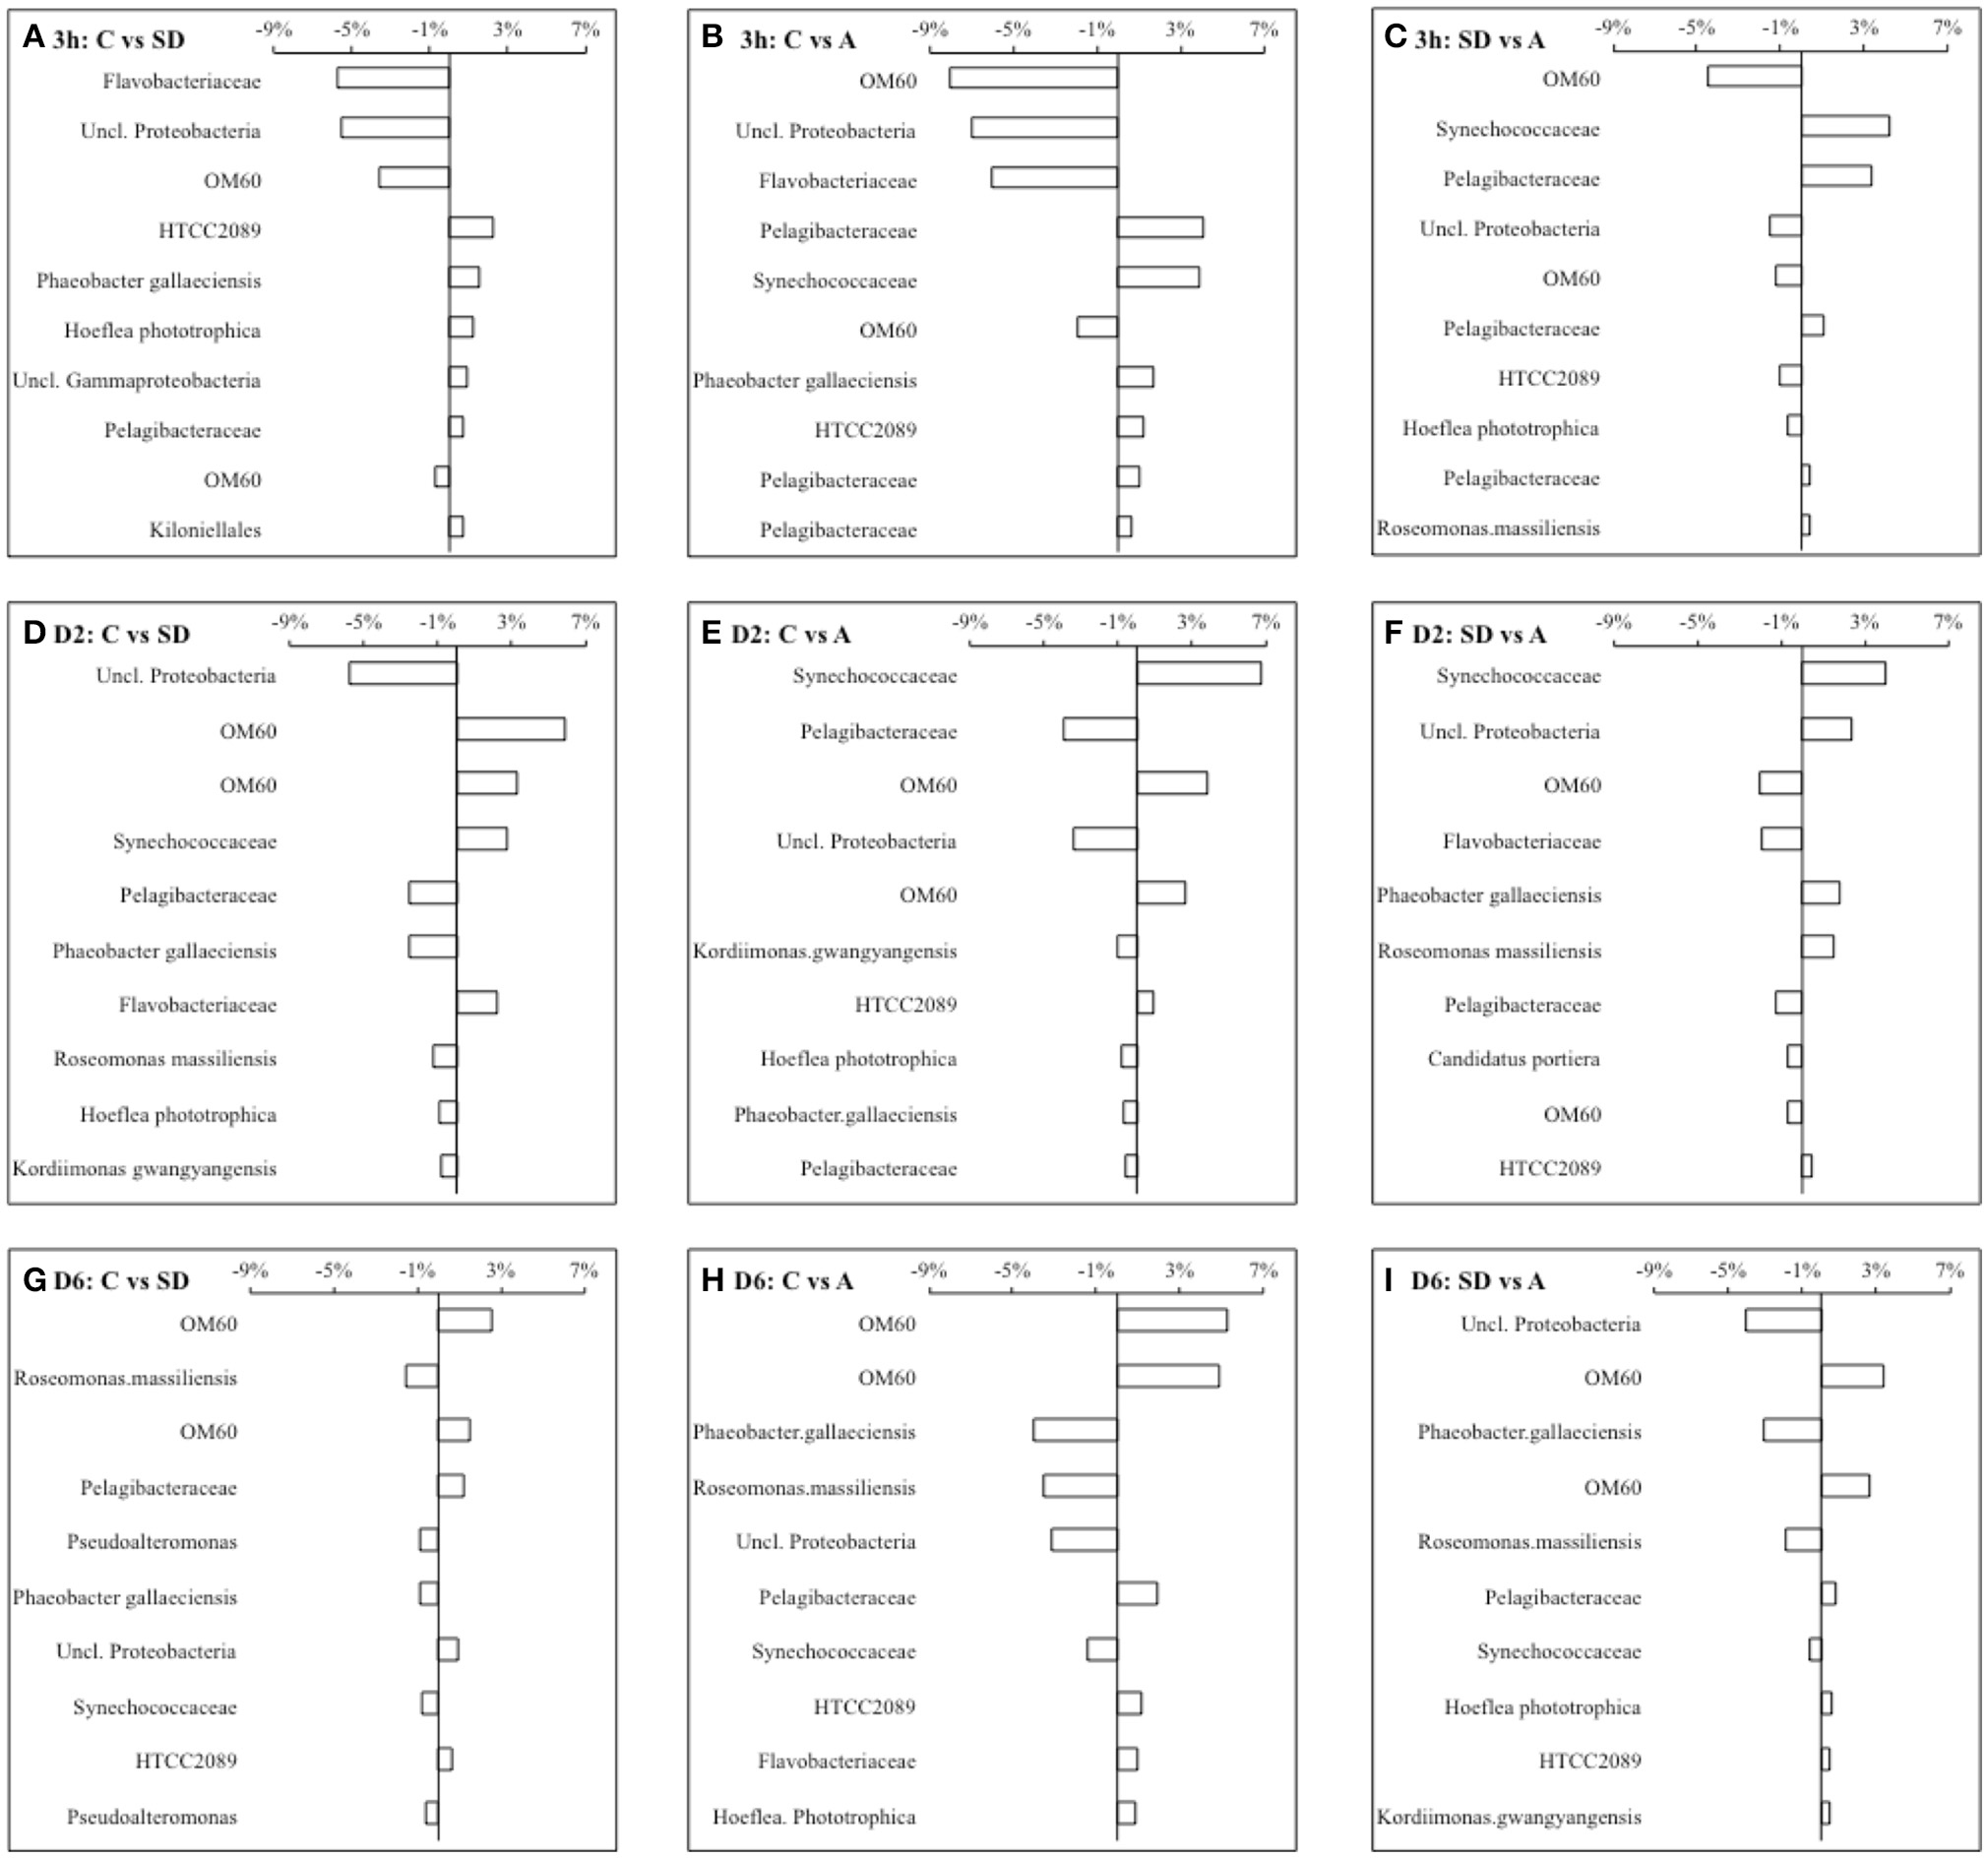
Figure 4. Top-10 OTUs that contribute most to the variations among control, SD and A from SIMPER analysis. The columns are the relative changes (SD-C, A-C, and A-SD) in abundance (%) of each OTU at 3 h (A–C), Day 2 (D–F) Day 2, and Day 6 (G–I).
On D2, a reversal shift between the Alpha- and Gamma-proteobacteria was observed. The proportion of active Alphaproteobacteria was lower in both the treatment groups when compared with the control group (40.0% in control, 28.8% in SD and 30.1% in A; Figure 3A). Lower percentages of 16S rRNA transcripts in the treatment groups were also observed for both Pelagibacteraceae (10.9% in control, 7.5% in SD, 5.8% in A) and Rhodobacteraceae (8.9% in control, 6.0% in SD, 7.7% in A; Figure 3B). In contrast, the percentage of 16S rRNA transcripts belonging to the Gammaproteobacteria was higher in the SD and A groups (with values of 42.7 and 37.0%, respectively) when compared with the control group (30.6%), with most of the increase in transcripts being contributed by OM60 (22.6% in control, 32.8% in SD, 29.2% in A; Figure 3C). In general, the increased 16S rRNA gene expression of OM60 and Synechococcaceae, and decreased 16S rRNA gene expression of Pelagibacteraceae, contributed the most to the community change (Figures 4D,E). The difference between the bacterial communities in SD and A was mainly due to different degrees of changes in active Synechococcaceae, OM60, Flavobacteriaceae, Phaeobacter gallaeciensis, and Roseomonas massiliensis (Figure 4F).
On D6, the difference in the active communities between the treatments and control groups was smaller than that at 3h and D2. Shares of Alphaproteobacteria were lower in the treatment groups (41.0% in SD and 37.4% in A) than that in the control (44.0%), whereas the opposite was observed for Gammaproteobacteria (32.5% in control, 35.0% in SD, 42.7% in A; Figure 3A). Increased 16S rRNA gene expression of OM60 and Pelagibacteraceae and decreased 16S rRNA gene expression of Phaeobacter gallaeciensis and Roseomonas massiliensis contributed most to the community differences between the control and the treatment groups (Figures 4G,H), whereas the difference between bacterial communities in SD and A was mainly due to different degrees of changes in active OM60, Phaeobacter gallaeciensis, Roseomonas massiliensis, and Pelagibacteraceae (Figure 4I).
Discussion
Only a small number of studies to date have addressed the effect of aerosol input on bacteria, and most of these describe the abundance and activity rather than the active community composition and the links between these various aspects. In addition, in these studies, traditional fingerprinting techniques were used to investigate changes in bacterial community composition, and thus the results obtained had relatively low taxonomic resolution (Reche et al., 2009; Lekunberri et al., 2010; Marañón et al., 2010; Laghdass et al., 2011; Guo et al., 2013). In contrast, the 454-pyrosequencing used in this study, allowed for more efficient and deep molecular sampling efforts of the microbial populations and with relatively high throughput (Sogin et al., 2006; Huse et al., 2008; Gilbert et al., 2009). Furthermore, we used the retrieved RNA samples as substitutes for metabolically active cells, and this allowed us to link the activity of different bacterial assemblages at molecular levels with actual bacterial metabolic rates at the community level. This gave us a better understanding of the physiological and ecological responses of bacteria to different atmospheric deposition events.
Quick and Active Response of Bacteria to Atmospheric Input
We observed very quick responses of bacteria to inputs of SD and A. An average N:P ratio of ~34 was obtained in the ambient seawater used to fill the mesocosms; this was >2 times higher than the “typical” Redfield ratio of 16:1. The P turnover time at the beginning of our study was low (i.e., ~1.9 h T. Tanaka et al. unpubl.), which further confirmed that the microbial community was initially P-starved. Under such nutrient-limited conditions, the bacterial community was likely to be strongly bottom-up regulated in the oligotrophic Mediterranean Sea (Pinhassi et al., 2006). Thus, any changes in the quantity or quality of external matter added will likely cause a significant change in the bacterial biomass, activity, and species composition, and consequently in carbon cycling throughout the microbial community. Moreover, in our study, microbes of < 2 μm (including heterotrophic bacteria, autotrophic cyanobacteria, and picoeukaryotes), played a very active role in the P cycling in this area, accounting for >90% of the P uptake (T. Tanaka et al. unpubl.). Because of the smaller cell size and higher surface-to-volume ratios, bacteria can acquire inorganic nutrients more efficiently than phytoplankton when the ambient nutrient concentration is extremely low (Cotner and Biddanda, 2002; Joint et al., 2002). We showed that when compared with phytoplankton biomass (e.g., the concentration of total chlorophyll a and abundance of picophytoplankton), which started to increase from D1 in response to SD and A (Tsagaraki et al. this issue), bacteria responded more quickly in that their abundance started to increase at just 3 h following these two mesocosm amendments. At the same time, the BP increased significantly in the SD and A treatment groups, especially in the A group. This highlights the role of bacteria as active competitors and efficient utilizers for the limited amount of nutrients and dissolved organic matter available in this oligotrophic system. Furthermore, the fact that the shift in active bacterial community composition was immediate (i.e., observed as early as 3 h), which is before a significant increase in phytoplankton biomass occurred, also demonstrates the direct response of bacteria to SD and A input. Such increases in bacterial abundance and metabolic rates in response to dust from the Sahara have also been reported in the western Mediterranean Sea (Pulido-Villena et al., 2008), and in oligotrophic central Atlantic Ocean (Marañón et al., 2010).
The immediate response of bacterial activity to A was much stronger than it was to SD. This was indicated by the dramatically higher increase of BP (i.e., with a relative change of 661 and 118% in A and SD, respectively; Figures 1C,D), as well as the more substantial change of active bacterial community composition (i.e., exhibiting similarities of 73.3 and 81.2% in A and SD, respectively, when compared with the control; Figures 2, 3). Furthermore, the addition of A seemed to have a longer lasting effect on shifting the microbial community composition, with similarities of 88.5 and 80.9% in the SD and A treatment groups, respectively, on D6 when compared with the control (Figure 2B). The different responses of the microbial communities to SD and A might be due to the different chemical compositions of the two atmospheric deposition sources, as the SD in general consisted of mineral particles, whereas A contained more anthropogenic components (such as pollution) and it might therefore contain a higher content of organic material. Indeed, several reports have described significantly different amounts of dissolved organic nitrogen and carbon associated with different sources of European atmospheric deposition and Sahara dust (Cornell et al., 1995; Pulido-Villena et al., 2008).
Changes in BP and HNA%
The BP might be directly stimulated by the nutrients released from the SD and A input. We observed a rapid increase in community BP, with relative increases of 118 and 663% following the addition SD and A, respectively, as quickly as 3 h following their addition. There was a similar level of increase in terms of cell specific BP (with relative increases of 100 and 598% in SD and A, respectively) but only a small increase in the bacterial abundance (with relative increases of 9% for both SD and A). Such decoupling between the BP and abundance suggests that the external dust and aerosol input directly stimulated the metabolic activity of bacterial cells, and that the degree of stimulation was different among the different bacterial groups. This was demonstrated by the strong increase in BP and the shift in active community composition at 3 h. On the other hand, on D2, the relative increase in the community BP (i.e., 73% in SD and 74% in A), was much higher than that of the cell specific BP (with values of 24 and 28% for SD and A, respectively), when compared with those measured in the control mesocosms. At the same time, significant increases of bacterial abundance (with values of 40 and 34% increase in SD and A, respectively, as compared with that in control) were observed. Therefore, the stimulation of community BP on D2 appears to be largely due to the increase of bacterial abundance.
HNA bacteria might also play an important role in BP enhancement. The nucleic acid content of bacterial cells has been suggested to be a good indicator of bacterial metabolic activity, as HNA bacteria were observed to be responsible for the majority of the total BP (Lebaron et al., 2001). In general, the percentage of HNA cells relative to the total bacterial abundance (i.e., %HNA), is considered to be related to variables that track the productivity index of the ecosystem, such as chlorophyll stocks or bacterial production (Corzo et al., 2005; Morán X. A. G. et al., 2007). Interestingly, we observed a significant positive correlation between the %HNA and BP (Table 2). This, together with the significant positive correlation between cell specific BP and HNA bacterial abundance, and the lack of correlation between the abundance of LNA bacteria and the cell specific activity, indicate the importance of HNA bacteria in contributing to the community BP. However, the specific activities of HNA cells vary significantly among bacterial species (Lebaron et al., 2001). Therefore, detailed community composition data is still needed to explain the response of bacterial activity to nutrient input during a dust event.
The Different Responses of the Major Bacterial Groups to Atmospheric Input
Our data indicate that the major components of bacterial communities in the Eastern Mediterranean Sea respond differently to a nutrient pulse deposited via the atmosphere, resulting in clear shifts in the composition of the active bacteria community. Indeed, in response to SD or A, Alphaproteobacteria exhibited an initial more rapid expression of 16S rRNA genes, which was observed at 3 h, when compared to Gammaproteobacteria. At D2, however, the expression of the 16S rRNA genes in Gammaproteobacteria increased, whereas that of Alphaproteobacteria decreased. Such changes in the levels of the dominant bacterial groups in response to SD and A indicate the heterogeneity of nutrient acquisition abilities among the different bacterial taxa, which are likely due to their different cellular demands and metabolism strategies. Our data, which are based on quantifying 16S rRNA gene transcripts, are not consistent with those reported by Fodelianakis et al. (2014), who showed only a minimal effect on the structure of the bacterioplankton community following the addition of P, based on the 16S rRNA gene, although an increase in bacterial abundance and production was measured, at least during the first 72 h of a mesocosm experiment conducted in the same Eastern Mediterranean environment. The differences observed between our results and those reported previously (Fodelianakis et al., 2014), indicate that dust-associated nutrients other than P might play a more important role in regulating the bacterial composition. Our results also highlight the importance of using RNA-based methods rather than DNA-based approaches to study the effect of dust-associated nutrients on the active bacterial community. Indeed, to our knowledge, we are the first to test the immediate effect (i.e., within just a few hours) of adding dust-based nutrients on the composition of the active bacterial community based on expression of the 16S rRNA genes.
We showed that Alphaproteobacteria, dominated by Pelagibacteraceae (mostly Pelagibacter ubique, an abundant member of the SAR11 clade), Rhodobacteraceae (mainly Phaeobacter gallaeciensis, which belongs to the Roseobacter clade), Phyllobacteriaceae (mostly Hoeflea phototrophica), and Acetobacteriaceae, exhibited increased activity at 3 h, suggesting their ability to respond quickly to the SD- and A-derived inorganic and organic nutrients. It has been reported that SAR11 is the most abundant bacterial group in the ocean, and has the smallest “streamlined” genome known for a free-living microorganism, which enables it to survive in nutrient-limited waters (Morris et al., 2002; Giovannoni et al., 2005). As SAR11 bacteria have high-affinity nutrient acquisition systems, low ambient levels of substrates appear to represent a competitive advantage for them (Alonso and Pernthaler, 2006). Our data demonstrated that 3 h following the addition of A, there was a major increase in BP, and this was accompanied by an increased expression of the 16S rRNA gene of Pelagibacteraceae that accounted for ~11.5% of the active composition difference when comparing the effect of the addition of SD and A (SIMPER analysis, Figure 4). We speculate that the increased proportion of SAR11 might make an important early contribution to the community BP enhancement. On D2, however, the proportion of SAR11 in the bacterial communities of SD or A amended mesocosms decreased. This is consistent with previous studies, which also showed that nutrient or dust enrichment had a negative effect on SAR11 after a 1-day incubation (Teira et al., 2008; Hill et al., 2010; Marañón et al., 2010). The cause for such a switch might be that opportunists, such as Gammaproteobacteria, with a larger cell size and higher growth rate, out-compete SAR11 bacteria and maybe other Alphaproteobacteria groups too, when the levels of phytoplankton begin to increase (Simu and Hagstrom, 2004; Teira et al., 2008).
The second most abundant Alphaproteobacteria we found was Roseobacter, which increased its expression of the 16S rRNA gene within the first 3 h of the mesocosm experiment. Roseobacter has been reported to respond positively to both organic and inorganic nutrients (Teira et al., 2010), and analysis of the genomes of this clade suggests that members of the group have multiple mechanisms for sensing and reacting to their environment while acquiring diverse substrates and nutrients for growth (Moran M. A. et al., 2007). Previous nutrient manipulation experiments have also demonstrated the high ability of Roseobacter to adapt to nutrient addition; for example, the proportion of this clade increased after aerosol addition in the South China Sea (Guo et al., 2013). However, in our current study, the clade did not seem to be a successful competitor in response to the addition of SD at D2 and D6, when compared with Gammaproteobacteria. Protist grazing and/or viral attack might contribute to a decrease in the proportion of Roseobacter (Sherr et al., 1992). In addition, different types of bacteria within this clade are known to have diverse life strategies, and for the new species in the clade that are still being identified, the ecological niches and physiological traits are as yet to be characterized.
We showed that Gammaproteobacteira and Bacteroidetes have different responses than Alphaproteobacteria, due to their different life strategies. In contrast to the rapid response of Alphaproteobacteria at 3 h, the responses of both Gammaproteobacteria and Bacteroidetes were lagging at 3h, but exceeded that of Alphaproteobacteria on D2 and D6. The up-regulation of protein synthesis that occurred in Gammaproteobacteria and Bacteroidetes was accompanied by a large increase in both bacterial and phytoplankton abundance. This occurred after D1, which indicates the competitiveness and high growth potential of these groups as well as their possible association with phytoplankton. Several other studies have regarded opportunistic strategy as a conserved feature for some important lineages of Gammaproteobacteria, which showed extraordinarily high growth potential and efficient carbon utilization after nutrient addition (Lebaron et al., 1999; Eilers et al., 2000; Pinhassi and Berman, 2003; Buchan et al., 2005; Fuhrman and Hagström, 2008). Many Gammaproteobacteria species have been observed to actively and positively respond to disturbance events and to organic nutrient addition associated with phytoplankton blooms, and they tend to dominate in nutrient-enriched seawater incubations (Hutchins et al., 2001; Pinhassi and Berman, 2003; Teira et al., 2010; Nogales et al., 2011). Furthermore, it has been suggested that Gammaproteobacteria could highly express transporter genes linked to broad carbon uptake patterns during an in situ phytoplankton bloom (Teeling et al., 2012). The OM60 clade, which account for ~60–80% of Gammaproteobacteria tags and ~11–33% of the total bacterial tags in our study, showed a relatively large increase on D2 and D6. This clade has been reported to coincide with a high chlorophyll a concentration (Yan et al., 2009), and associate with phytoplankton species such as diatoms (Eilers et al., 2001) and Synechococcus (Alonso-Sáez et al., 2007). There is also molecular evidence indicating an apparent increase in the genes involved in polysaccharide degradation and various other biosynthetic processes at the transcriptional level in OM60, in the latter stages of incubation following the addition of organic nutrients (Sharma et al., 2013). This clade is known to include representatives of aerobic anoxygenic phototrophic (AAnP) bacteria that use light as an energy source (Fuchs et al., 2007; Yan et al., 2009), and they play an important role in marine carbon cycling (Kolber et al., 2001).
Bacteroidetes (or CFB; Cytophaga–Flavobacteria–Bacteroides), have also been reported to be especially relevant in the cycling of organic matter during phytoplankton blooms, when they likely profit from complex DOC (Pinhassi et al., 2004; Alderkamp et al., 2006; Teira et al., 2008). In addition, it has been reported that OTUs belonging to Flavobacteria contribute substantially to the incorporation of a Synechococcus exudate (Nelson and Carlson, 2012).
Conclusions
In this study, we used a mesocosm experimental approach to investigate the impact of Saharan dust and mixed European aerosols on microbial biomass, production and active community composition in the Eastern Mediterranean Sea. The patterns we observed can be summarized as follows: (1) Active bacterial community composition shifts were observed in response to the addition of SD and A, with an immediate response being observed in Alphaproteobacteria and a slower but longer lasting response occurring in Gammaproteobacteria. (2) A had a stronger immediate effect and longer lasting influence than SD in changing the composition of the active bacterial community. (3) The SD and A input directly stimulated the bacterial cell specific metabolic activity, as shown by the immediate increase of cell specific BP. In addition, the degree of stimulation was different among the different bacterial groups, as shown by the shift in active bacterial community composition at 3 h, which was revealed by the expressed 16S rRNA genes.
Data Accessibility
All the raw sequences obtained from this study have been deposited in the National Center for Biotechnology Information (NCBI) Sequence Read Archive (SRA) under accession number of SAMN03323713-SAMN03323719.
Author Contributions
CG designed and performed the experiments, analyzed data and wrote the paper; XX analyzed data and edited the paper; PP, BH, TT: designed the mesocosm experiment and edited the paper; ER, IB: helped during experimental sampling and edited the paper; AG, AT: performed flow cytometry and bacterial production analysis respectively and edited the paper; HL: designed the experiment, supervised the analysis and edited the paper.
Conflict of Interest Statement
The authors declare that the research was conducted in the absence of any commercial or financial relationships that could be construed as a potential conflict of interest.
The handling editor declared a shared affiliation, though no other collaboration, with several of the authors PP, AG, AT, TT and states that the process nevertheless met the standards of fair and objective review.
Acknowledgments
This study was funded by an EU project “MESOAQUA: Network of leading MESOcosm facilities to advance the studies of future AQUAtic ecosystems from the Arctic to the Mediterranean” through a grant to CG, BH, and HL. The authors wish to thank Dr. P. Divanach for his valuable advice on technical matters, Dr. M. Krom for his assistance in aerosol leaching experiments, G. Piperakis for his inspired technical assistance throughout the experiment, S. Zivanovic and E. Dafnomili for their assistance with the chemical analyses, D. Podaras and S. Diliberto for their assistance during the experiment and N. Sekeris for his help with constructions and ideas. The captain and the crew of the R/V Philia are also thanked for their assistance during the transportation of water from the sea to the mesocosms. Support from Hong Kong Research Grants Council via General Research Fund (GRF 661912 and 661813) is also acknowledged.
References
Alderkamp, A.-C., Sintes, E., and Herndl, G. J. (2006). Abundance and activity of major groups of prokaryotic plankton in the coastal North Sea during spring and summer. Aquat. Microb. Ecol. 45, 237–246. doi: 10.3354/ame045237
Alonso, C., and Pernthaler, J. (2006). Roseobacter and SAR11 dominate microbial glucose uptake in coastal North Sea waters. Environ. Microbiol. 8, 2022–2030. doi: 10.1111/j.1462-2920.2006.01082.x
Alonso-Sáez, L., Balagué, V., Sà, E. L., Sánchez, O., González, J. M., Pinhassi, J., et al. (2007). Seasonality in bacterial diversity in north-west Mediterranean coastal waters: assessment through clone libraries, fingerprinting and FISH. FEMS Microbiol. Ecol. 60, 98–112. doi: 10.1111/j.1574-6941.2006.00276.x
Azam, F., Fenchel, T., Field, J. G., Gray, J. S., Meyer-Reil, L. A., and Thingstad, F. (1983). The ecological role of water-column microbes in the sea. Mar. Ecol. Prog. Ser. 1, 257–263. doi: 10.3354/meps010257
Blain, S., Guieu, C., Claustre, H., Leblanc, K., Moutin, T., Quéguiner, B., et al. (2004). Availability of iron and major nutrients for phytoplankton in the northeast Atlantic Ocean. Limnol. Oceanogr. 49, 2095–2104. doi: 10.4319/lo.2004.49.6.2095
Bonnet, S., Guieu, C., Chiaverini, J., Ras, J., and Stock, A. (2005). Effect of atmospheric nutrients on the autotrophic communities in a low nutrient, low chlorophyll system. Limnol. Oceanogr. 50, 1810–1819. doi: 10.4319/lo.2005.50.6.1810
Buchan, A., Gonzalez, J. M., and Moran, M. A. (2005). Overview of the Marine Roseobacter Lineage. Appl. Environ. Microbiol. 71, 5665–5677. doi: 10.1128/AEM.71.10.5665-5677.2005
Cornell, S., Rendell, A., and Jickells, T. (1995). Atmospheric inputs of dissolved organic nitrogen to the oceans. Nature 376, 243–246. doi: 10.1038/376243a0
Corzo, A., Rodríguez-Gálvez, S., Lubian, L., Sobrino, C., Sangrá, P., and Martínez, A. (2005). Antarctic marine bacterioplankton subpopulations discriminated by their apparent content of nucleic acids differ in their response to ecological factors. Polar Biol. 29, 27–39. doi: 10.1007/s00300-005-0032-2
Cotner, J. B., and Biddanda, B. A. (2002). Small players, large role: microbial influence on biogeochemical processes in pelagic aquatic ecosystems. Ecosystems 5, 105–121. doi: 10.1007/s10021-001-0059-3
Edgar, R. C., Haas, B. J., Clemente, J. C., Quince, C., and Knight, R. (2011). UCHIME improves sensitivity and speed of chimera detection. Bioinformatics 27, 2194–2200. doi: 10.1093/bioinformatics/btr381
Eilers, H., Pernthaler, J., and Amann, R. (2000). Succession of Pelagic Marine Bacteria during Enrichment: a Close Look at Cultivation-Induced Shifts. Appl. Environ. Microbiol. 66, 4634–4640. doi: 10.1128/AEM.66.11.4634-4640.2000
Eilers, H., Pernthaler, J., Peplies, J., Glockner, F. O., Gerdts, G., and Amann, R. (2001). Isolation of novel pelagic bacteria from the German Bight and their seasonal contributions to surface picoplankton. Appl. Environ. Microbiol. 67, 5134–5142. doi: 10.1128/AEM.67.11.5134-5142.2001
Fodelianakis, S., Pitta, P., Thingstad, T. F., Kasapidis, P., Karakassis, I., and Ladoukakis, E. D. (2014). Phosphate addition has minimal short-term effects on bacterioplankton community structure of the P-starved Eastern Mediterranean. Aquat. Microb. Ecol. 72, 98–104. doi: 10.3354/ame01693
Fuchs, B. M., Spring, S., Teeling, H., Quast, C., Wulf, J., Schattenhofer, M., et al. (2007). Characterization of a marine gammaproteobacterium capable of aerobic anoxygenic photosynthesis. Proc. Natl. Acad. Sci. U.S.A. 104, 2891–2896. doi: 10.1073/pnas.0608046104
Fuhrman, J. A., and Hagström, Å. (2008). “Bacterial and Archaeal Community Structure and its Patterns,” in Microbial Ecology of the Oceans, 2nd Edn, ed D. L. Kirchman (Hoboken, NJ: John Wiley & Sons, Inc.). doi: 10.1002/9780470281840.ch3
Gilbert, J. A., Field, D., Swift, P., Newbold, L., Oliver, A., Smyth, T., et al. (2009). The seasonal structure of microbial communities in the Western English Channel. Environ. Microbiol. 11, 3132–3139. doi: 10.1111/j.1462-2920.2009.02017.x
Giovannoni, S. J., Tripp, H. J., Givan, S., Vergin, K. L., Baptista, D., Bibbs, L., et al. (2005). Genome streamlining in a Cosmopolitan Oceanic Bacterium. Science 309, 1242–1245. doi: 10.1126/science.1114057
Guerzoni, S., Chester, R., Dulac, F., Herut, B., Loýe-Pilot, M.-D., Measures, C., et al. (1999). The role of atmospheric deposition in the biogeochemistry of the Mediterranean Sea. Prog. Oceanogr. 44, 147–190. doi: 10.1016/S0079-6611(99)00024-5
Guo, C., Jing, H., Kong, L., and Liu, H. (2013). Effect of East Asian aerosol enrichment on microbial community composition in the South China Sea. J. Plankton Res. 35, 485–503. doi: 10.1093/plankt/fbt002
Herut, B., Krom, M. D., Pan, G., and Mortimer, R. (1999). Atmospheric input of nitrogen and phosphorus to the Southeast Mediterranean Sources, fluxes, and possible impact. Limnol. Oceanogr. 44, 1683–1692. doi: 10.4319/lo.1999.44.7.1683
Herut, B., Collier, R., and Krom, M. D. (2002). The role of dust in supplying nitrogen and phosphorus to the Southeast Mediterranean. Limnol. Oceanogr. 47, 870–878. doi: 10.4319/lo.2002.47.3.0870
Herut, B., Zohary, T., Krom, M. D., Mantoura, R. F. C., Pitta, P., Psarra, S., et al. (2005). Response of East Mediterranean surface water to Saharan dust: On-board microcosm experiment and field observations. Deep Sea Res. II 52, 3024–3040. doi: 10.1016/j.dsr2.2005.09.003
Hill, P. G., Zubkov, M. V., and Purdie, D. A. (2010). Differential responses of Prochlorococcus and SAR11-dominated bacterioplankton groups to atmospheric dust inputs in the tropical Northeast Atlantic Ocean. FEMS Microbiol. Lett. 306, 82–89. doi: 10.1111/j.1574-6968.2010.01940.x
Huse, S. M., Dethlefsen, L., Huber, J. A., Welch, D. M., Relman, D. A., and Sogin, M. (2008). Exploring Microbial Diversity and Taxonomy Using SSU rRNA Hypervariable Tag Sequencing. PLoS Genet. 4:e1000255. doi: 10.1371/journal.pgen.1000255
Hutchins, D. A., Campbell, B. J., and Cottrell, M. T. (2001). Response of marine bacterial community composition to iron additions in three iron-limited regimes. Limnol. Oceanogr. 46, 1535–1545. doi: 10.4319/lo.2001.46.6.1535
Joint, I., Henriksen, P., Fonnes, G. A., Bourne, D., Thingstad, T. F., and Riemann, B. (2002). Competition for inorganic nutrients between phytoplankton and bacterioplankton in nutrient manipulated mesocosms. Aquat. Microb. Ecol. 29, 145–159. doi: 10.3354/ame029145
Koçak, M., Kubilay, N., Herut, B., and Nimmo, M. (2005). Dry atmospheric fluxes of trace metals (Al, Fe, Mn, Pb, Cd, Zn, Cu) over the Levantine Basin: a refined assessment. Atmos. Environ. 39, 7330–7341. doi: 10.1016/j.atmosenv.2005.09.010
Kolber, Z. S., Plumley, F. G., Lang, A. S., Beatty, J. T., Blankenship, R. E., VanDover, C. L., et al. (2001). Contribution of aerobic photoheterotrophic bacteria to the carbon cycle in the ocean. Science 292, 2492–2495. doi: 10.1126/science.1059707
Krom, M. D., Kress, N., Brenner, S., and Gordon, L. I. (1991). Phosphorus limitation of primary productivity in the eastern Mediterranean Sea. Limnol. Oceanogr. 36, 424–432. doi: 10.4319/lo.1991.36.3.0424
Krom, M. D., Shi, Z., Stockdale, A., Berman-Frank, I., Giannakourou, A., Herut, B., et al. (2016). Response of the Eastern Mediterranean microbial ecosystem to dust and dust affected by acid processing in the atmosphere. Front. Mar. Sci. 3:133. doi: 10.3389/fmars.2016.00133
Kirchman, D. L. (1993). “Leucine incorporation as a measure of biomass production by heterotrophic bacteria,” in: Handbook of Methods in Aquatic Microbial Ecology, eds P. F. Kemp, J. J. Cole, B. F. Sherr, and E. B. Sherr (Lewis, IA: CRC Press), 509–512.
Laghdass, M., Blain, S., Besseling, M., Catala, P., Guieu, C., and Obernosterer, I. (2011). Effects of Saharan dust on the microbial community during a large in situ mesocosm experiment in the NW Mediterranean Sea. Aquat. Microb. Ecol. 62, 201–213. doi: 10.3354/ame01466
Lebaron, P., Servais, P., Agogue, H., Courties, C., and Joux, F. (2001). Does the high nucleic acid content of individual bacterial cells allow us to discriminate between active cells and inactive cells in aquatic systems? Appl. Environ. Microbiol. 67, 1775–1782. doi: 10.1128/AEM.67.4.1775-1782.2001
Lebaron, P., Servais, P., Troussellier, M., Courties, C., Vives-rego, J., Muyzer, G., et al. (1999). Chancres in bacterial community structure in seawater mesocosms differing in their nutrient status. Aquat. Microbiol. Ecol. 19, 255–267. doi: 10.3354/ame019255
Lekunberri, I., Lefort, T., Romero, E., Vazquez-Dominguez, E., Romera-Castillo, C., Marrase, C., et al. (2010). Effects of a dust deposition event on coastal marine microbial abundance and activity, bacterial community structure and ecosystem function. J. Plankton Res. 32, 381–396. doi: 10.1093/plankt/fbp137
Marañón, E., Fernández, A., Mouriño-Carballido, B., Martínez-García, S., Teira, E., Cermeño, P., et al. (2010). Degree of oligotrophy controls the response of microbial plankton to Saharan dust. Limnol. Oceanogr. 55, 2339–2352. doi: 10.4319/lo.2010.55.6.2339
Marie, D., Partensky, F., Vaulot, D., and Brussaard, C. (1999). Enumeration of phytoplankton, bacteria, and viruses in marine samples. Curr. Protoc. Cytometry Chapter 11:Unit 11.11. doi: 10.1002/0471142956.cy1111s10
Markaki, Z., Loýe-Pilot, M. D., Violaki, K., Benyahya, L., and Mihalopoulos, N. (2010). Variability of atmospheric deposition of dissolved nitrogen and phosphorus in the Mediterranean and possible link to the anomalous seawater N/P ratio. Mar. Chem. 120, 187–194. doi: 10.1016/j.marchem.2008.10.005
Mills, M. M., Ridame, C., Davey, M., Roche, J. L., and Geider, R. J. (2004). Iron and phosphorus co-limit nitrogen fixation in the eastern tropical North Atlantic. Nature 429, 292–294. doi: 10.1038/nature02550
Moran, M. A., Belas, R., Schell, M. A., Gonzalez, J. M., Sun, F., Sun, S., et al. (2007). Ecological Genomics of Marine Roseobacters. Appl. Environ. Microbiol. 73, 4559–4569. doi: 10.1128/AEM.02580-06
Morán, X. A. G., Bode, A., Suárez, L. A., and Nogueira, E. (2007). Assessing the relevance of nucleic acid content as an indicator of marine bacterial activity. Aquat. Microbiol. Ecol. 46, 141–152. doi: 10.3354/ame046141
Morris, R. M., Rappe, M. S., Connon, S. A., Vergin, K. L., Siebold, W. A., Carlson, C. A., et al. (2002). SAR11 clade dominates ocean surface bacterioplankton communities. Nature 420, 806–810. doi: 10.1038/nature01240
Moulin, C., Lambert, C. E., Dulac, F., and Dayan, U. (1997). Control of atmospheric export of dust from North Africa by the North Atlantic Oscillation. Nature 387, 691–694. doi: 10.1038/42679
Nelson, C. E., and Carlson, C. A. (2012). Tracking differential incorporation of dissolved organic carbon types among diverse lineages of Sargasso Sea bacterioplankton. Environ. Microbiol. 14, 1500–1516. doi: 10.1111/j.1462-2920.2012.02738.x
Nogales, B., Lanfranconi, M. P., Piña-Villalonga, J. M., and Bosch, R. (2011). Anthropogenic perturbations in marine microbial communities. FEMS Microbiol. Rev. 35, 275–298. doi: 10.1111/j.1574-6976.2010.00248.x
Pinhassi, J., and Berman, T. (2003). Differential growth response of colony-forming α- and γ-proteobacteria in dilution culture and nutrient addition experiments from Lake Kinneret (Israel), the Eastern Mediterranean Sea, and the Gulf of Eilat. Appl. Environ. Microbiol. 69, 199–211. doi: 10.1128/AEM.69.1.199-211.2003
Pinhassi, J., Sala, M. M., Havskum, H., Peters, F., Guadayol, Ò., Malits, A., et al. (2004). Changes in bacterioplankton composition under different phytoplankton regimens. Appl. Environ. Microbiol. 70, 6753–6766. doi: 10.1128/AEM.70.11.6753-6766.2004
Pinhassi, J., Gómez-Consarnau, L., Alonso-Sáez, L., Sala, M. M., Vidal, M., Pedrós-Alió, C., et al. (2006). Seasonal changes in bacterioplankton nutrient imitation and their effects on bacterial community composition in the NW Mediterranean Sea. Aquat. Microbiol. Ecol. 44, 241–252. doi: 10.3354/ame044241
Pitta, P., Stambler, N., Tanaka, T., Zohary, T., Tselepides, A., and Rassoulzadegan, F. (2005). Biological response to P addition in the Eastern Mediterranean Sea. The microbial race against time. Deep Sea Res. Part II: Top. Stud. in Oceanogr. 52, 2961–2974. doi: 10.1016/j.dsr2.2005.08.012
Pulido-Villena, E., Wagener, T., and Guieu, C. (2008). Bacterial response to dust pulses in the western Mediterranean: Implications for carbon cycling in the oligotrophic ocean. Global Biogeochem. Cycles 22, GB1020. doi: 10.1029/2007gb003091
Reche, I., Ortega-Retuerta, E., Romera, O., Pulido-Villena, E., Morales-Baquero, R., and Casamayord, E. O. (2009). Effect of Saharan dust inputs on bacterial activity and community composition in Mediterranean lakes and reservoirs. Limnol. Oceanogr. 54, 869–879. doi: 10.4319/lo.2009.54.3.0869
Romero, E., Peters, F., Marrasé, C., Guadayol, Ò., Gasol, J. M., and Weinbauer, M. G. (2011). Coastal Mediterranean plankton stimulation dynamics through a dust storm event: an experimental simulation. Estuar. Coast. Shelf Sci. 93, 27–39. doi: 10.1016/j.ecss.2011.03.019
Schloss, P. D., Westcott, S. L., Ryabin, T., Hall, J. R., Hartmann, M., Hollister, E. B., et al. (2009). Introducing mothur: open-source, platform-independent, community-supported software for describing and comparing microbial communities. Appl. Environ. Microbiol. 75, 7537–7541. doi: 10.1128/AEM.01541-09
Sharma, A. K., Becker, J. W., Ottesen, E. A., Bryant, J. A., Duhamel, S., Karl, D. M., et al. (2013). Distinct dissolved organic matter sources induce rapid transcriptional responses in coexisting populations of Prochlorococcus, Pelagibacter and the OM60 clade. Environ. Microbiol. 16, 2815–2830. doi: 10.1111/1462-2920.12254
Sherr, B. F., Sherr, E. B., and McDaniel, J. (1992). Effect of protistan grazing on the frequency of dividing cells in bacterioplankton assemblages. Appl. Environ. Microbiol. 58, 2381–2385.
Simu, K., and Hagstrom, A. (2004). Oligotrophic bacterioplankton with a novel single-cell life strategy. Appl. Environ. Microbiol. 70, 2445–2451. doi: 10.1128/AEM.70.4.2445-2451.2004
Smith, D. C., and Azam, F. (1992). A simple, economical method for measuring bacterial protein synthesis rates in seawater using 3H-leucine. Mar. Microb. Food Webs 6, 107–114.
Sogin, M. L., Morrison, H. G., Huber, J. A., Welch, D. M., Huse, S. M., Neal, P. R., et al. (2006). Microbial diversity in the deep sea and the underexplored “rare biosphere.” Proc. Natl. Acad. Sci. U.S.A. 103, 12115–12120. doi: 10.1073/pnas.0605127103
Teeling, H., Fuchs, B. M., Becher, D., Klockow, C., Gardebrecht, A., Bennke, C. M., et al. (2012). Substrate-controlled succession of marine bacterioplankton populations induced by a phytoplankton bloom. Science 336, 608–611. doi: 10.1126/science.1218344
Teira, E., Gasol, J. M., Aranguren-Gassis, M., Fernández, A., González, J., Lekunberri, I., et al. (2008). Linkages between bacterioplankton community composition, heterotrophic carbon cycling and environmental conditions in a highly dynamic coastal ecosystem. Environ. Microbiol. 10, 906–917. doi: 10.1111/j.1462-2920.2007.01509.x
Teira, E., Martínez-García, S., Calvo-Díaz, A., and Morán, X. A. G. (2010). Effects of inorganic and organic nutrient inputs on bacterioplankton community composition along a latitudinal transect in the Atlantic Ocean. Aquat. Microb. Ecol. 60, 299–313. doi: 10.3354/ame01435
Thingstad, T. F., Krom, M. D., Mantoura, R. F. C., Flaten, G. A. F., Groom, S., Herut, B., et al. (2005). Nature of Phosphorus Limitation in the Ultraoligotrophic Eastern Mediterranean. Science 309, 1068–1071. doi: 10.1126/science.1112632
Wambeke, F. V., Obernosterer, I., Moutin, T., Duhamel, S., Ulloa, O., and Claustre, H. (2008). Heterotrophic bacterial production in the eastern South Pacific: longitudinal trends and coupling with primary production. Biogeosciences 5, 157–169. doi: 10.5194/bg-5-157-2008
Xu, J., Jing, H., Kong, L., Sun, M., Harrison, P. J., and Liu, H. (2013). Effect of seawater–sewage cross-transplants on bacterial metabolism and diversity. Microb. Ecol. 66, 60–72. doi: 10.1007/s00248-013-0207-2
Keywords: 16s rRNA, pyrosequencing, saharan dust, atmospheric deposition, bacterial community structure, bacterial production
Citation: Guo C, Xia X, Pitta P, Herut B, Rahav E, Berman-Frank I, Giannakourou A, Tsiola A, Tsagaraki TM and Liu H (2016) Shifts in Microbial Community Structure and Activity in the Ultra-Oligotrophic Eastern Mediterranean Sea Driven by the Deposition of Saharan Dust and European Aerosols. Front. Mar. Sci. 3:170. doi: 10.3389/fmars.2016.00170
Received: 20 May 2016; Accepted: 30 August 2016;
Published: 14 September 2016.
Edited by:
Christos Dimitrios Arvanitidis, Hellenic Centre for Marine Research, GreeceReviewed by:
Gordon T. Taylor, Stony Brook University, USAStephen Techtmann, Michigan Technological University, USA
Copyright © 2016 Guo, Xia, Pitta, Herut, Rahav, Berman-Frank, Giannakourou, Tsiola, Tsagaraki and Liu. This is an open-access article distributed under the terms of the Creative Commons Attribution License (CC BY). The use, distribution or reproduction in other forums is permitted, provided the original author(s) or licensor are credited and that the original publication in this journal is cited, in accordance with accepted academic practice. No use, distribution or reproduction is permitted which does not comply with these terms.
*Correspondence: Hongbin Liu, liuhb@ust.hk