Comparing Chemistry and Census-Based Estimates of Net Ecosystem Calcification on a Rim Reef in Bermuda
 Travis A. Courtney1*
  Andreas J. Andersson1
  Nicholas R. Bates2
  Andrew Collins2
  Tyler Cyronak1 Samantha J. de Putron2 Bradley D. Eyre3 Rebecca Garley2
  Eric J. Hochberg2 Rodney Johnson2 Sylvia Musielewicz4,5
  Tim J. Noyes2 Christopher L. Sabine5
  Adrienne J. Sutton4,5
  Jessy Toncin6
  Aline Tribollet6
- 1Geosciences Research Division, Scripps Institution of Oceanography, University of California, San Diego, La Jolla, CA, USA
- 2Bermuda Institute of Ocean Sciences, St. George's, Bermuda
- 3Center for Coastal Biogeochemistry, School of Environment, Science, and Engineering, Southern Cross University, Lismore, NSW, Australia
- 4Joint Institute for the Study of the Atmosphere and Ocean, University of Washington, Seattle, WA, USA
- 5Pacific Marine Environmental Laboratory, National Oceanic and Atmospheric Administration, Seattle, WA, USA
- 6Institut de Recherche pour le Développement, Institut Pierre Simon Laplace - Laboratoire d'Océanographie et du Climat, Université Pierre-et-Marie-Curie, Paris, France
Coral reef net ecosystem calcification (NEC) has decreased for many Caribbean reefs over recent decades primarily due to changes in benthic community composition. Chemistry-based approaches to calculate NEC utilize the drawdown of seawater total alkalinity (TA) combined with residence time to calculate an instantaneous measurement of NEC. Census-based approaches combine annual growth rates with benthic cover and reef structural complexity to estimate NEC occurring over annual timescales. Here, NEC was calculated for Hog Reef in Bermuda using both chemistry and census-based NEC techniques to compare the mass-balance generated by the two methods and identify the dominant biocalcifiers at Hog Reef. Our findings indicate close agreement between the annual 2011 census-based NEC 2.35 ± 1.01 kg CaCO3•m−2•y−1 and chemistry-based NEC 2.23 ± 1.02 kg CaCO3•m−2•y−1 at Hog Reef. An additional record of Hog Reef TA data calculated from an autonomous CO2 mooring measuring pCO2 and modeled pHtotal every 3-h highlights the dynamic temporal variability in coral reef NEC. This ability for chemistry-based NEC techniques to capture higher frequency variability in coral reef NEC allows the mechanisms driving NEC variability to be explored and tested. Just four coral species, Diploria labyrinthiformis, Pseudodiploria strigosa, Millepora alcicornis, and Orbicella franksi, were identified by the census-based NEC as contributing to 94 ± 19% of the total calcium carbonate production at Hog Reef suggesting these species should be highlighted for conservation to preserve current calcium carbonate production rates at Hog Reef. As coral cover continues to decline globally, the agreement between these NEC estimates suggest that either method, but ideally both methods, may serve as a useful tool for coral reef managers and conservation scientists to monitor the maintenance of coral reef structure and ecosystem services.
Introduction
Coral reefs provide a great multitude of ecosystem goods and services to humanity including renewable food and material resources, shoreline protection, and nutrient cycling (e.g., Smith, 1978; Salvat, 1992; Spurgeon, 1992; Done et al., 1996; Moberg and Folke, 1999; de Groot et al., 2012). However, tropical reef coral cover is currently declining due to a combination of local and global pressures (i.e., overfishing, sedimentation, disease, warming, and acidification) with ~80% declines in coral cover observed across the Caribbean since the mid-1970s (Gardner et al., 2003). These declines in overall Caribbean coral cover are combined with an overall loss of reef structural complexity (Alvarez-Filip et al., 2009) and coral community shifts toward more slowly calcifying and less-structurally complex opportunistic coral species (Alvarez-Filip et al., 2013). Consequently, losses in coral cover, and changes in coral community composition have resulted in decreased net coral reef calcium carbonate (CaCO3) production across the Caribbean (Perry et al., 2013, 2015). While hermatypic scleractinian corals are typically the dominant coral reef CaCO3 producers (Vecsei, 2004), coral reef net ecosystem calcification (NEC) is the sum of gross calcification and gross CaCO3 dissolution (Chave et al., 1972). Coral reef accretion and maintenance of geomorphic structure therefore depends on NEC as well as the net import, export, and erosion of CaCO3 material (e.g., Scoffin, 1992; Milliman, 1993; Kleypas et al., 2001; Perry et al., 2008; Montaggioni and Braithwaite, 2009; Tribollet and Golubic, 2011; Perry et al., 2012).
The topic of spatial scale is of particular importance for the study of ecological phenomenon (Levin, 1992 and references therein) including coral reef calcification (e.g., Kinsey, 1985; Andréfouët and Payri, 2000; Vecsei, 2004; Edmunds et al., 2016). Measurements of coral reef calcification range from organismal to ecosystem and global scales (see discussion in Edmunds et al., 2016). By necessity, measuring CaCO3 production at organism scales (e.g., Bak, 1976; Jokiel et al., 1978) fundamentally utilize different approaches than studies examining entire reef and global scales (e.g., Kinsey, 1979; Milliman, 1993; Kleypas, 1997; Vecsei, 2004). Coral reef CaCO3 production at sub-reef to reef scales has historically been measured via census or accretion-based CaCO3 budget approaches (e.g., Chave et al., 1972 and references therein; Stearn et al., 1977; Hubbard et al., 1990; Eakin, 1996; Harney and Fletcher, 2003; Perry et al., 2012, 2013) and chemistry-based alkalinity anomaly approaches (e.g., Broecker and Takahashi, 1966; Smith and Key, 1975; Smith and Kinsey, 1976; Gattuso et al., 1996; and summarized in Atkinson, 2011; Andersson and Gledhill, 2013).
Census-based budgets utilize bottom-up approaches to sum up the calcification by individual CaCO3 producers whereas chemistry-based budgets provide a top-down integrated measurement of the entire reef NEC. Interestingly, CaCO3 production on coral reefs in the Atlantic has historically been measured using census and accretion based approaches while chemistry-based approaches have been more widely used in the Pacific Ocean (Kinsey, 1981). Montaggioni and Braithwaite (2009) summarized the literature finding that global coral reef calcification estimates range from 1 to 10 kg CaCO3•m2•y−1 using census-based methods and from 0.5 to 10 kg CaCO3•m2•y−1 based on alkalinity anomaly methods thereby concluding that the two methods are generally in close agreement. Measurements of census-based and chemistry-based CaCO3 production at One Tree Island, Great Barrier Reef were scaled to the entire reef using remote sensing with a remarkably small 0.3% difference between the two methods (Hamylton et al., 2013). Thus, a robust comparison of these two methods at the same reef site allows the bottom-up census-based budget of NEC to be weighed against the top-down chemistry-based NEC, resulting in a more thorough understanding of the mechanisms of CaCO3 production and maintenance of structure in coral reef environments.
In this study, NEC was calculated using census-based and chemistry-based budgets from September 2010 to September 2012 for Hog Reef (32°27′26.39″N, 64°50′5.10″W), located on the northwestern rim reef of Bermuda between deeper oceanic waters and shallower sandy back-reef environments (Figure 1). The Bermuda platform is a reef system surrounded by deep oceanic waters located in the North Atlantic sub-tropical gyre and at the current latitudinal limit for tropical coral reef ecosystems (Kleypas et al., 1999; Andersson et al., 2014). The history of Bermuda NEC measurements (e.g., Bates, 2002; Bates et al., 2010) and characterization of Bermuda platform seawater residence times (Venti et al., 2012) further make Hog Reef an ideal location to conduct a chemistry-based NEC study. Briefly, calcifying organism growth rates, microborer CaCO3 dissolution rates, and CaCO3 sand dissolution rates were multiplied by their respective benthic area to produce a census-based NEC budget with seasonal variability at Hog Reef. NEC was calculated using chemistry-based alkalinity anomaly of reef seawater relative to offshore seawater via water samples taken monthly from Hog Reef. Seasonal and diel NEC variability was estimated by TA calculated from seawater measurements taken every 3 h by an autonomous pCO2 mooring at Hog Reef. These estimates of coral reef NEC provide valuable insight into the net balance between calcification and CaCO3 dissolution, thus serving as an important tool for monitoring the maintenance of coral reef structure and ecosystem services as coral reef function and health continue to change globally.
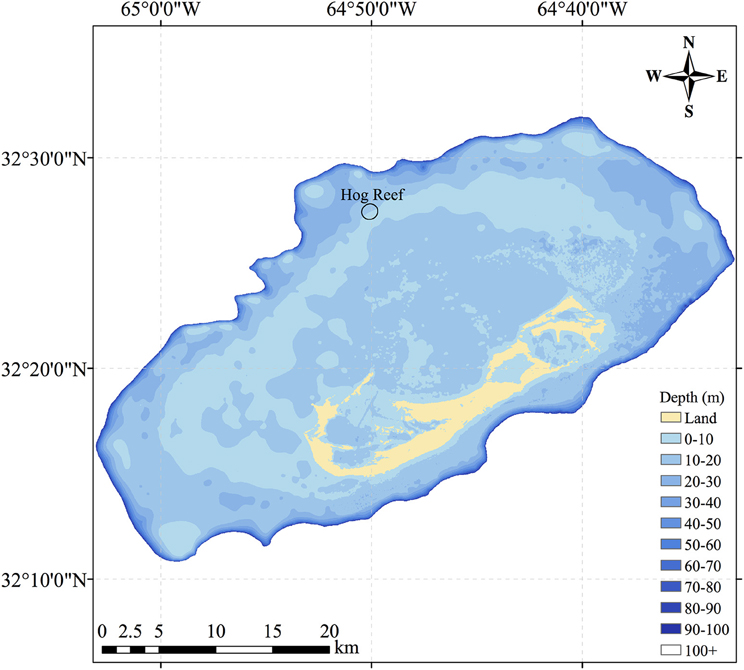
Figure 1. Map of the Bermuda coral reef platform showing Hog Reef, located on the northwestern portion of the rim reef. The black ellipse at Hog Reef represents the estimated effective footprint for the benthic community influence on the overlying seawater chemistry.
Methods
Census Based Budget Formation
Reef Surveys
The census-based budgets were modeled after the standardized methods outlined in the ReefBudget project (Perry et al., 2012). Video transects were conducted in August 2010 at Hog Reef as part of an ecological monitoring project consisting of five permanent 30-m transects stationed at ca. 8 m depth at the reef site. For each transect, a video camera was pointed perpendicular to the benthos at a constant distance to film a 1-m wide band to the left side of each transect generating 5 • 30 m2 transects. Each video transect was analyzed for percent cover by coral species, gorgonian, zoanthid, sponge, sessile invertebrates, macroalgae, turf algae, calcifying algae, dead coral, unknown organisms, rock, rubble, and sand (Figure 2). Notably, mean percent cover (±standard deviation) of hard scleractinian corals at the survey site was 27 ± 5%. Due to the structural complexity of the reef environment, reef rugosity (Spatial Scales I and II in Dahl, 1973) was calculated for each site to determine the total abundance of benthic organisms occupying a given planar area of the reef environment (Dahl, 1973). The Segmented Line and Measure tools in ImageJ were used to calculate reef rugosity from the ratio of reef profile distance and horizontal planar distance for each photograph (n = 12) resulting in a mean (± standard deviation) rugosity of 1.5 ± 0.2. Hog Reef has a very complex three-dimensional structure consisting of many small caves and overhangs that is not currently measurable using traditional rugosity approaches (e.g., Dahl, 1973) and precludes some aspects of the benthos beneath underlying canopies from being surveyed in the planar video transects (Goatley and Bellwood, 2011). This additional structural complexity therefore underestimates this study's survey of benthic foraminifera, coralline algae, cryptic Porifera sponges, cryptic corals, and additional organisms or uncolonized substrate occurring in these unsampled microenvironments.
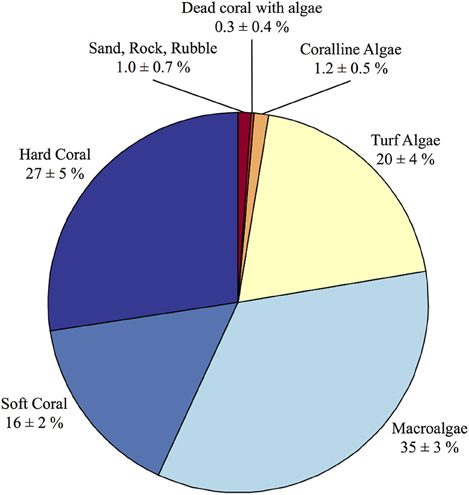
Figure 2. Summary of percent cover (±standard deviation) from the benthic surveys conducted at Hog Reef. The benthic survey percent cover data was used in conjunction with the effective footprint analysis to scale the benthic composition onto larger spatial patterns of rocky reef-dominated (94.9 ± 0.2%) and sand-dominated (5.1 ± 0.2%) substrates at Hog Reef.
In situ Calcification Rates
In situ calcification rates for Diploria labyrinthiformis and Porites astreoides corals and literature reported annual mean calcification rates aggregated in the ReefBudget data analysis sheets (Perry et al., 2012) for all other corals and calcifying algae were used in the formation of the census-based budget. Colonies of D. labyrinthiformis (n = 17) and P. astreoides (n = 14) were collected from Hog Reef and mounted on tiles at Hog Reef from September 2010 to September 2012 to calculate in situ calcification rates for the duration of the experiment. During the growth rate study, each coral was weighed every 2–3 months using the buoyant weight method (Jokiel et al., 1978) with a correction term for seawater density at the time of measurement and subtraction of the weight of the tile and Z-SPAR A-788 epoxy used to mount the coral to the tile. Mean initial coral weights (±standard deviation) were 358 ± 122 g for D. labyrinthiformis and 419 ± 124 g for P. astreoides. Mean calcification rates for each growth interval were calculated as the change in weight (mg) per day over each growth interval. Calcification rates were normalized to surface area using the foil method conducted at the end of the growth rate experiment (Marsh, 1970). Mean (±standard deviation) individual coral colony surface areas in the growth rate experiment were 195 ± 31 cm2 for D. labyrinthiformis and 164 ± 48 cm2 for P. astreoides.
Seasonal Variability in Calcification
Temporal variability in D. labyrinthiformis and P. astreoides growth rates was determined by dividing growth rates at each weight interval by the mean growth rates over the approximately 2-year growth rate experiments to yield standardized growth rate values. These standardized growth rates through time were fit with a single-term Fourier model using the Curve Fitting Tool in MATLAB to model the seasonal variability in growth rates (±95% confidence intervals):
where x is the date in decimal years centered at the year 2010 and f(x) is the proportional, standardized seasonal variation of the mean annual growth rate. This seasonal variability relationship was used to scale the literature-derived annual mean coral and calcifying algal growth rates from the ReefBudget data analysis sheets (Perry et al., 2012) to approximate seasonal variability in the census-based data for comparison to the continuous chemistry-based budgets in this study.
Similarly, the in situ measured growth rates for D. labyrinthiformis and P. astreoides were fit with single-term Fourier models using the Curve Fitting Tool in MATLAB to construct continuous estimations of calcification rates for the duration of the 2-year experiment. The equation for D. labyrinthiformis growth rates (± 95% confidence intervals) is:
where x is the date in decimal years centered at the year 2010 and f(x) is the seasonal variation of the D. labyrinthiformis annual growth rate (kg CaCO3•m−2•y−1). The equation for P. astreoides growth rates (± 95% confidence intervals) is:
where x is the date in decimal years centered at the year 2010 and f(x) is the seasonal variation of the P. astreoides annual growth rate (kg CaCO3•m−2•y−1). The Fourier fitted continuous growth rates for D. labyrinthiformis and P. astreoides were used to model the seasonal-variability of the census-based budget.
Summation of Net Calcification
Calcification rates of each calcifying species were multiplied by reef rugosity and percent cover of each species from the benthic surveys to determine species-level calcification at Hog Reef. These species-level calcification rates were summed to obtain the net calcification (kg CaCO3•m−2•y−1) by the benthic community at Hog Reef. Regrettably, calcification by benthic foraminifera, which could represent up to 50% of the sand composition at Hog Reef (unpublished data), was not included in the budget due to the lack of benthic survey data on these species. Despite large abundance in the sand, Bermuda reef benthic foraminifera CaCO3 production was previously estimated to be 0.080 kg CaCO3•m−2•y−1 (Langer et al., 1997), supporting earlier findings that the contributions by benthic foraminifera on coral reef NEC are an order of magnitude smaller than the CaCO3 produced by non-Acroporid corals (Chave et al., 1972). Calcification by suborder holaxonia sea fans and sea rods (16 ± 2% cover ± standard deviation of the benthic survey data; Figure 2) were also excluded from this analysis due to the high variability of calcified material within individuals (Esford and Lewis, 1990) and a lack of reliable linear extension rate measurements to pair with the percent cover survey data. Of the other dominant biocalcifying components of coral reef environments listed by Montaggioni and Braithwaite (2009), Mollusca were insufficiently surveyed to reliably estimate Mollusca calcification from the benthic survey data.
Net CaCO3 Dissolution
Calcium carbonate dissolution at Hog Reef was measured as the sum of CaCO3 dissolution by sediments, microborers, and sponges. Sediment CaCO3 dissolution at Hog Reef was directly measured over a full diel cycle in summer 2015 (July) via the alkalinity anomaly measured in three independent benthic chambers following methods outlined in Cyronak et al. (2013b). Net sediment CaCO3 dissolution (±standard deviation) for the sand at Hog Reef was −0.39 ± 0.11 kg CaCO3•m−2•yr−1. Given the lack of data for any temporal variability in sediment CaCO3 dissolution at Hog Reef, this rate was assumed to be constant throughout the year and was multiplied by the percent sediment cover from the survey data at Hog Reef. No sponges were recorded in our transect data thereby precluding net CaCO3 dissolution by sponges from the calculation of this budget. Mean (±standard deviation) microborer CaCO3 dissolution rates of −0.21 ±0.09 kg CaCO3•m−2•yr−1 were determined from scanning electron microscopy of subsections from 3 experimental coral blocks cut from a single massive Porites lobata skeleton exposed at Hog Reef between September 2011 and September 2012 following methods outlined in Tribollet et al. (2009). These methods for estimating CaCO3 dissolution differed from the ReefBudget calculations in that this study additionally included sediment dissolution, which is typically absent from census-based budgets (Eyre et al., 2014), while mechanical bioerosion by fish and urchins were omitted from this study. This distinction between mechanical and chemical bioerosion was made such that the census budgets would reflect only the chemical balance of calcification and CaCO3 dissolution to allow for a better comparison between the census-based and chemistry-based budgets outlined in this study.
Effective Reef Footprint and Hydrology
To best compare the census-based and chemistry-based estimates of NEC, an effective reef footprint (i.e., the spatial extent of benthic community influence on water chemistry) was calculated to link the benthos to overlying water column carbonate chemistry. The mean water flow of the tidally driven currents at Hog Reef was integrated over a complete tidal cycle to estimate the spatial area of the benthos that a typical parcel of reefwater travels over a tidal cycle. This calculated area of reef therefore represents the estimated areal footprint over which the NEC carbonate chemistry signal has been integrated in the seawater. The estimated footprint was used with aerial imagery and digital elevation model data to calculate the percent hard reef vs. sandy substrate and an average water depth for calculations of the census based and chemistry based Hog Reef NEC.
A Nortek AS Aquadopp Profiler was mounted at approximately 12 m depth to measure current speeds in 0.5 m depth bins from surface to bottom at a frequency of 1.0 MHz from 18 July 2015 to 26 July 2015. In the absence of continuous current measurements during the ca. 2-year study, this later current profiler deployment was used to record many tidal cycles of the predominately tidally driven flow regime at Hog Reef with the caveat that typical current profiles may vary over longer time scales due to changing wind and storm activity. Calculations using potential changes in flow regime beyond the typically tidal influence have relatively small impacts on measured census-based and chemistry-based NEC due to the correspondingly small changes in percent hard reef substrate and depth of the effective reef footprint. To avoid the tidal influence on the occasional aerial exposure of the uppermost surface current bins, only bins from 0.4 to 10.9 m distance from the profiler were analyzed. Current speeds were converted into u and v components and averaged across depth bins from 0.4 to 10.9 m to yield the average water column velocity for the duration of the deployment. An hourly low-pass Lanczos filter was used on the top-bottom averaged u and v components to filter out higher frequency turbulence from the current data. A principal components analysis was performed on the filtered top-bottom averaged u and v data following procedures outlined in Glover et al. (2011) to identify the primary (PC1) and orthogonal (PC2) principal components of seawater current. PC1 (2.89 cm•s−1 at 335°) therefore represents the mean speed and direction of the dominant current flow and PC2 (2.75 cm•s−1 at 245°) represents the mean speed of the flow 90° to PC1. These components of current velocity were scaled by a tidal period of 12.4167 h to yield a typical distance traveled by a parcel of water over a complete tidal cycle. The tidally scaled magnitudes and directions of these principal components (PC1: 1.29 km 335°; PC2: 1.23 km 245°) were centered at the Hog Reef PMEL MAPCO2 mooring to estimate an elliptical effective footprint (Figure 1) for the benthic community influence on seawater chemistry.
The coordinates for the effective footprint were imported into ArcMap® software and layered onto a Bermuda 1 arc-second sea level digital elevation model (Sutherland et al., 2014) and Bermuda marine aerial imagery (Bermuda Zoological Society, 1997). The ArcMap® Zonal Statistics as Table tool was used to calculate the mean (±standard deviation) depth from the digital elevation model for the elliptical Hog Reef footprint as 10.3 ± 3.3 m. The elliptical footprint was used to crop and export the marine aerial imagery from ArcMap® software to ImageJ (Schneider et al., 2012) for analysis of percent cover by larger-scale reef and sand patches in the effective footprint. The image contrast was enhanced and converted to 8-bit grayscale before applying a black-and-white threshold with additional manual paintbrush tool interpretation of reef composition from the photograph such that areas of reef became black pixels and areas of sand became white pixels. The histogram of the ellipse was analyzed to determine the percent of black and percent of white pixels resulting in 94.9% hard reef and 5.1% sand composition. Because the reef survey data was collected over the dominantly reef section, the census-based budget data was scaled to represent 94.9% of the budget area and sand CaCO3 dissolution rates were applied to the remaining 5.1% sand-covered portion of the effective reef footprint. Notably, this scaling of the transect data to the effective reef footprint resulted in a mean (±uncertainty) of 26 ± 5% hard coral cover for Hog Reef.
Chemistry Based Budget Formation
Carbonate Chemistry Bottle Samples
Hog Reef seawater bottle samples were analyzed for total alkalinity (TA) to calculate the chemistry based NEC in this study. All water samples were collected approximately monthly using a 5-L Niskin bottle at 0.5–1.0 m depth according to best practices (Dickson et al., 2007). Samples were stored using 200 mL-Kimax glass sample bottles, fixed using 100 μL saturated solution of HgCl2, and subsequently analyzed for TA using a VINDTA 3S system and DIC using VINDTA 3C and AIRICA systems (Marianda Inc). The accuracy and precision of TA analyses were verified against certified reference material (CRM) provided by the laboratory of Prof. A. Dickson of Scripps Institution of Oceanography. Analysis of replicate CRMs yielded a typical accuracy and precision of ±2–4 μmol•kg−1 for both TA and DIC. Temperature (accuracy ± 0.15°C) and salinity (accuracy ± 1%) for all samples were measured using a YSI 556 Handheld Multiparameter Instrument. Additional seawater samples were collected for 66% of all bottle samples and analyzed for salinity using an Autosal Salinometer (accuracy < ± 0.002). These salinometer salinity values were preferentially used over the YSI salinity measurements in the analysis for this project.
Offshore seawater bottle samples were collected approximately monthly at the Bermuda Atlantic Time-series Study (BATS; 31°50′N, 64°10′W) and analyzed for temperature, salinity, and TA. BATS is located ~80 km southeast of Bermuda and represents typical surface seawater of the Sargasso Sea making BATS carbonate chemistry samples an ideal offshore reference for calculation of NEC in this study (Bates et al., 2001, 2010; Bates, 2002; Yeakel et al., 2015). BATS TA samples were collected in 200 mL-Kimax glass bottles, fixed with HgCl2, and sealed until analysis at Bermuda Institute of Ocean Sciences (Bates et al., 2012). TA was analyzed by a VINDTA 2S System (Marianda Inc) with typical replicate accuracy and precision of < 0.2% determined daily using CRMs. TA for the Hog Reef and BATS bottle samples were normalized to the mean salinity of 36.59 g•kg−1 measured at Hog Reef. Because the BATS bottle samples were not collected at the same time as the Hog Reef samples, the BATS bottle samples were linearly interpolated to match the monthly Hog Reef seawater sampling dates for analysis of NEC in this study.
Hog Reef MAPCO2 Mooring Carbonate Chemistry
Hog Reef seawater pCO2 and modeled pHtotal were used to calculate TA every 3 h to estimate variability in Hog Reef NEC at higher frequencies than the ca. monthly Hog Reef seawater bottle samples. Seawater pCO2, atmospheric pressure, temperature, and salinity were measured every 3 h by the NOAA PMEL MAPCO2 mooring stationed at Hog Reef (32°27′26.39″N, 64°50′5.10″W). The MAPCO2 mooring utilizes a Battelle Memorial Institute CO2 system to measure CO2 mole fraction and a Sea-Bird 16plus v2 plus to measure seawater temperature and salinity (Sutton et al., 2014). The Sea-Bird sensors failed after a few months during both deployments of the MAPCO2 mooring in this study due to extensive biofouling. Mooring salinity records were thus completed using linearly interpolated salinity data from the monthly Hog Reef seawater samples. Daily averaged temperature from four HOBO loggers (mean standard deviation ± 0.11°C between loggers) deployed at Hog Reef recording temperature every 8-min were used for the duration of this study. An average of the daily temperature values for the day before and the day after a brief, 4-day interval lacking temperature record in mid-July were used to fill that same 4-day interval to maintain a continuous temperature record during the study.
Hog Reef seawater TA and DIC bottle samples were used to calculate seawater pHtotal and pCO2 for each bottle sample. The high correlation between bottle sample pHtotal and pCO2 was used to predict seawater pHtotal from MAPCO2 mooring pCO2. The combination of 3-h temporally resolved MAPCO2 mooring pCO2 and pHtotal allowed Hog Reef TA to be calculated every 3 h at Hog Reef. Hog Reef seawater TA and DIC bottle samples were used to calculate seawater carbonate chemistry using CO2SYS for MATLAB (van Heuven et al., 2011) using temperature and salinity measured at the time of sampling, the pHtotal, K1 and K2 dissociation constants by Mehrbach et al. (1973) refit by Dickson and Millero (1987), KHSO4- by Dickson (1990), and total boron by Uppström (1974). Calculated pHtotal was highly linearly correlated (R2 = 0.998; p < 0.0001) with log(pCO2) resulting in the following equation (± standard error):
The highly linear correlation between log(pCO2) and pHtotal over the range of values in this study allowed us to use the above equation to model pHtotal as a function of the Hog Reef mooring pCO2 data to create a 3-h temporal resolution pHtotal record. The Hog Reef mooring pCO2 and modeled pHtotal data were used to calculate TA with CO2SYS for MATLAB (van Heuven et al., 2011) using the HOBO temperature and interpolated seawater bottle salinity data, and the same set of constants previously described. TA from this output was normalized to the mean salinity of 36.59 measured at Hog Reef to compare with the BATS bottle samples normalized to that same salinity. The BATS bottle samples (collected approximately monthly) were linearly interpolated to match the modeled TA data (calculated every 3-h) for analysis of higher frequency measurements of NEC in this study. We recognize using this modeled TA dataset yields some additional uncertainty relative to direct TA measurements; however, the higher frequency variability captured by this method provides valuable insight on the range of Hog Reef NEC over shorter timescales than would otherwise be possible from traditional bottle samples.
Seawater density for the MAPCO2 mooring and bottle sample data were calculated using the TEOS-10 Gibbs Seawater (GSW) oceanographic toolbox (McDougall and Barker, 2011). For the bottle samples, seawater density was calculated using salinity of the bottles, temperature at the time of bottle sampling, and atmospheric pressure at the time of sampling (from the Bermuda Weather Service (2016) and MAPCO2 mooring). For the MAPCO2 mooring, seawater density was calculated from the MAPCO2 and interpolated seawater bottle salinity data, HOBO logger temperature data, and MAPCO2 pressure sensor data.
Net Ecosystem Calcification
NEC represents the effects of gross calcification and gross CaCO3 dissolution integrated over a water column of given density (ρ), depth (z), and residence time (τ) as per the following equation (Smith and Key, 1975; Langdon et al., 2010):
NEC was calculated for the discrete TA bottle samples and the MAPCO2 mooring TA data relative to interpolated BATS offshore TA data, bottle and MAPCO2 mooring seawater density data, depth of the effective footprint from ArcGIS, and a mean residence time (± standard deviation) of 2.5 ± 0.4 days calculated at the nearby North Rock rim reef site using a multi-tracer approach (Venti et al., 2012). Trapezoidal numerical integration was used to calculate annual NEC for the bottle samples. Regrettably, a full annual cycle was not measured by the MAPCO2 data (0.91 years) for the duration of this study (September 2010–September 2012). Trapezoidal numerical integration was thus applied to the mooring NEC data, bottle sample NEC data, and census-based NEC data over the longest MAPCO2 mooring data record (0.91 year time period from February 2011 to January 2012) to allow for a direct comparison of the methods without temporal bias. The census-based NEC, seawater bottle chemistry-based NEC, and mooring chemistry-based NEC are hereafter referred to as the census NEC, bottle NEC, and mooring NEC throughout the remainder of this manuscript.
Propagation of Uncertainty
Uncertainty for the census, bottle, and mooring NEC budgets was estimated using standard procedures for propagation of uncertainties summarized by Ku (1966). Standard deviations for all measured and calculated data were used to propagate uncertainties with a few exceptions. Uncertainties in species-level growth rates from the literature were not included in this analysis. Uncertainty of measured TA (±4 μmol•kg−1) was obtained from replicate measures of CRMs. An uncertainty of ±21 μmol•kg−1 was used for the uncertainty in MAPCO2 mooring pH-pCO2 predicted TA values. The mean difference between measured bottle TA and corresponding MAPCO2 mooring pH-pCO2 predicted TA at the time of water bottle sampling was 20.5 μmol•kg−1, which is also consistent with an uncertainty of ±21 μmol•kg−1 estimated by Millero (2007) using ship-based pCO2 and pH measurements. Subjective uncertainty for the Hog Reef footprint percent composition of reef and sand was estimated to be ±2% based on repeated ImageJ analysis of Hog Reef benthic composition.
Results
Census Based Budget Formation
The mean census NEC (±uncertainty) for the entire length of the approximately 2-year in situ calcification study was 2.21 ± 1.01 kg CaCO3•m−2•y−1 (Table 1; Figure 3). Calcification (±uncertainty) accounted for 2.53 ± 0.99 kg CaCO3•m−2•y−1 and CaCO3 dissolution (±uncertainty) was −0.32 ± 0.13 kg CaCO3•m−2•y−1 (Tables 1, 2; Figure 4). The percentage (±uncertainty) of total calcification for D. labyrinthiformis (15 ± 3%), Pseudodiploria strigosa (29 ± 10%), Millepora alcicornis (26 ± 12%), and Orbicella franksi (24 ± 9%) show they are the dominant CaCO3 producers (94 ± 19% for all four species) at Hog Reef (Table 1; Figure 4). Although measured rates of sand CaCO3 dissolution were higher than microborer CaCO3 dissolution rates per unit area, the smaller total area of sands resulted in areal CaCO3 dissolution (± uncertainty) being dominated by microborers (93 ± 57%) with sand CaCO3 dissolution (7 ± 4%) making up the remainder (Table 2; Figure 4). Integrated census NEC (±uncertainty) for 2011 was 2.35 ± 1.01 kg CaCO3•m−2•y−1 and from 2011.2 to 2012.1 was 2.28 ± 1.01 kg CaCO3•m−2•y−1 (Table 3).
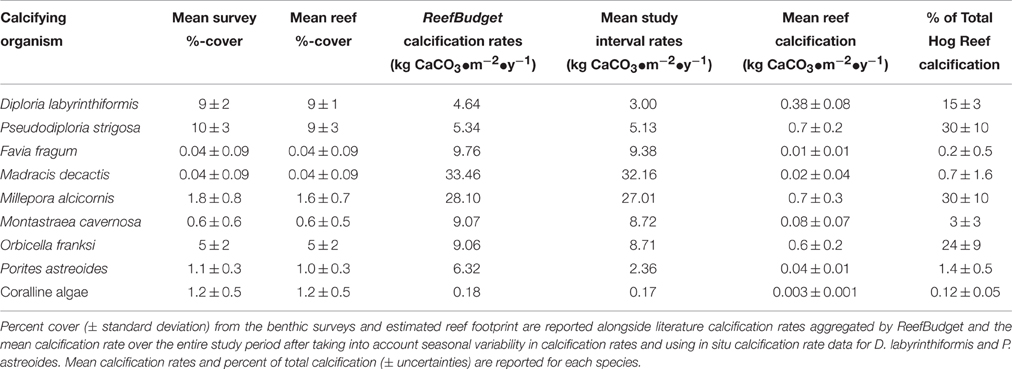
Table 1. Summary table of calcification at Hog Reef.
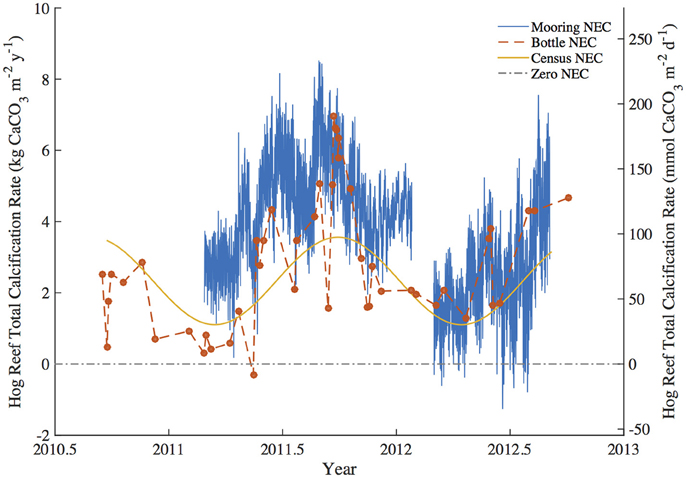
Figure 3. Summary figure of Hog Reef Net Ecosystem Calcification (NEC) using the mooring NEC, bottle NEC, and census NEC approaches for the study period. The dashed zero-NEC line indicates the tipping point between net calcification (above the line) and net CaCO3 dissolution (below the line).
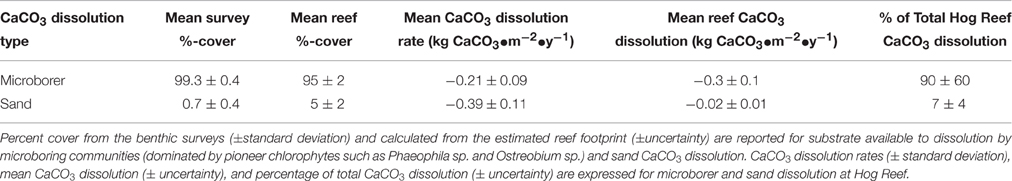
Table 2. Summary table of CaCO3 dissolution at Hog Reef.
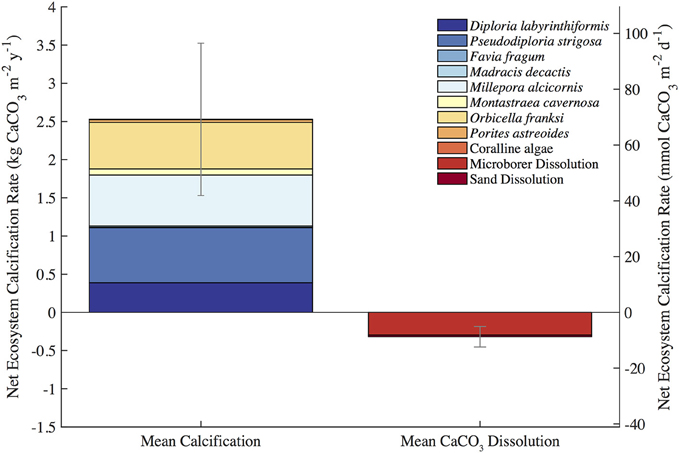
Figure 4. Census-based summary of mean calcification and mean CaCO3 dissolution. D. labyrinthiformis, P. strigosa, M. alcicornis, and O. franksi are the dominant biocalcifiers and microborer activity dominates CaCO3 dissolution at Hog Reef.
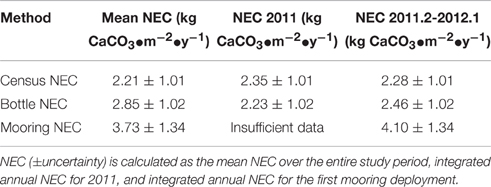
Table 3. NEC summary table for each method.
Chemistry Based Budget Formation
The mean bottle NEC (±uncertainty) for the entire length of the approximately 2-year in situ calcification study was 2.85 ± 1.02 kg CaCO3•m−2•y−1 (Table 3). The integrated bottle NEC for 2011 was 2.23 ± 1.02 kg CaCO3•m−2•y−1 and from 2011.2 to 2012.1 was 2.46 ± 1.02 kg CaCO3•m−2•y−1 (Table 3). Similarly, the mean mooring NEC (±uncertainty) was 3.73 ± 1.34 kg CaCO3•m−2•y−1 (Table 3). There was insufficient data to calculate mooring NEC for 2011 using the MAPCO2 data with the interval 2011.2–2012.1 representing the longest continuous record for the mooring NEC data. The integrated mooring NEC estimate for this interval was 4.09 ± 1.34 kg CaCO3•m−2•y−1 (Table 3).
Discussion
Annual NEC for 2011 calculated by the census NEC (2.35 ± 1.01 kg CaCO3•m−2•y−1) and by the bottle NEC (2.23 ± 1.02 kg CaCO3•m−2•y−1) are in close agreement. Chemistry-based NEC estimates measure NEC via the TA anomaly technique thereby recording the integrated signal of calcification and CaCO3 dissolution occurring within the reef ecosystem. These findings that the census-based budget are in close agreement with the bottle chemistry NEC suggest that the summation of the components of coral reef calcification and CaCO3 dissolution are representative of the total balance between calcification and CaCO3 dissolution occurring at Hog Reef.
Annual NEC calculated for 2011 for Hog Reef using census (2.35 ± 1.01 kg CaCO3•m−2•y−1) and bottle-based (2.23 ± 1.02 kg CaCO3•m−2•y−1) methods in addition to other census-based NEC studies from the Caribbean (Stearn et al., 1977; Mallela and Perry, 2007; Perry et al., 2013) generally fall within the 20–250 mmol CaCO3•m−2•d−1 (0.73–9.13 kg CaCO3•m−2•y−1) range of average global coral reef flat NEC (Atkinson, 2011; Figure 5). The relationship between percent hard coral cover and reef NEC in this study is in general agreement with trends observed in other census-based studies of Caribbean reefs (Stearn et al., 1977; Mallela and Perry, 2007; Perry et al., 2013; Figure 5). Notably, the annual Hog Reef census NEC and bottle NEC are in close agreement with the census NEC calculated for a Bonaire reef (2.31 ± 1.05 kg CaCO3•m−2•y−1) with analogous hard coral cover (Hog Reef: 26 ± 5%; Bonaire reef: 25.0 ± 4.5%) and depth (Hog Reef: 10.3 ± 3.3 m; Bonaire Reef: 10 m; Perry et al., 2013; Figure 5). Collectively, these findings support earlier claims by Montaggioni and Braithwaite (2009) and measurements by Hamylton et al. (2013) that net coral reef calcification estimates using chemistry and census-based approaches are generally in close agreement.
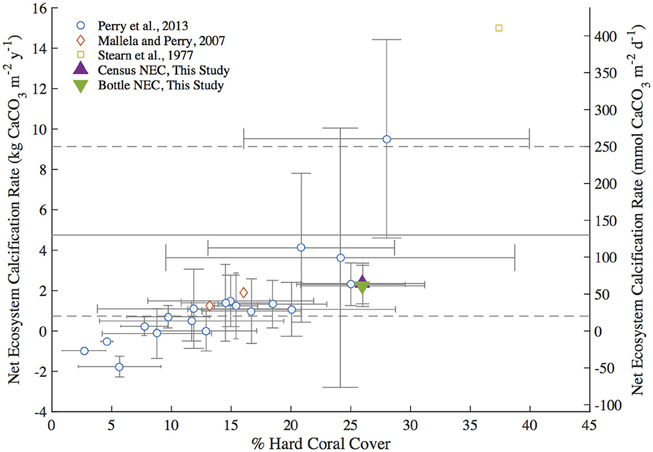
Figure 5. Summary plot of Caribbean Reef percent hard coral cover vs. Net Ecosystem Calcification (NEC) adapted from Perry et al. (2013). Census NEC and bottle NEC are the 2011 integrated NEC values from this study. The gray dashed lines represent the upper and lower bounds of typical global coral reef flat NEC and the solid gray line indicates the mean global coral reef flat NEC from Atkinson (2011).
To test for any temporal bias in the NEC rates calculated from daytime bottle sampling of NEC, the autonomous MAPCO2 mooring recorded seawater pCO2 every 3-h allowing for a higher temporal resolution of NEC to be measured. The mooring NEC values reveal the seasonal cycles and diel variability in NEC with generally higher NEC values of 4.10 ± 1.34 kg CaCO3•m−2•y−1 compared to 2.35 ± 1.01 kg CaCO3•m−2•y−1 and 2.46 ± 1.02 kg CaCO3•m−2•y−1 for the census NEC and bottle NEC respectively during the same initial mooring deployment from 2011.2 to 2012.1 (Table 3; Figures 3, 6). These mooring NEC values may be higher due to additional uncertainty generated by modeling TA from MAPCO2 mooring pH-pCO2 and/or could relate to higher frequency variability in reef processes. The absolute mooring NEC values should therefore be treated with some caution, but the range nonetheless highlights the dynamic variability of Hog Reef NEC. Interestingly, agreement between the census and chemistry-based NEC methods varies over the 2-year period further highlighting the dynamic variability of coral reef environments (Figure 3). This may be in part due to unmeasured temporal variability in the rates of dissolution by microborers and sediments, species-level differences in seasonal calcification responses, higher frequency variability in calcification rates than the 2-month intervals measured by the in situ growth rate experiments, and or changes in seawater residence time resulting from changes in wind and currents. Mean annual CaCO3 dissolution by microborers was used for the census NEC; however, recent work has shown that CaCO3 dissolution of new substrates by microborers varies nonlinearly due to succession of microboring communities over time and a combination of biotic and abiotic factors (Vogel et al., 2000; Carreiro-Silva et al., 2005; Aline, 2008; Tribollet et al., 2009; Grange et al., 2015). Similarly, sediment CaCO3 dissolution rates were measured once in the summer and thus do not account for any potential temporal variability in CaCO3 dissolution rates. Further research should be conducted to quantify shorter temporal scale variability in growth rates of biocalcifiers, CaCO3 dissolution rates, and changes in coral reef seawater residence time to better understand these changes and the factors driving variable NEC (Venti et al., 2012; Teneva et al., 2013).
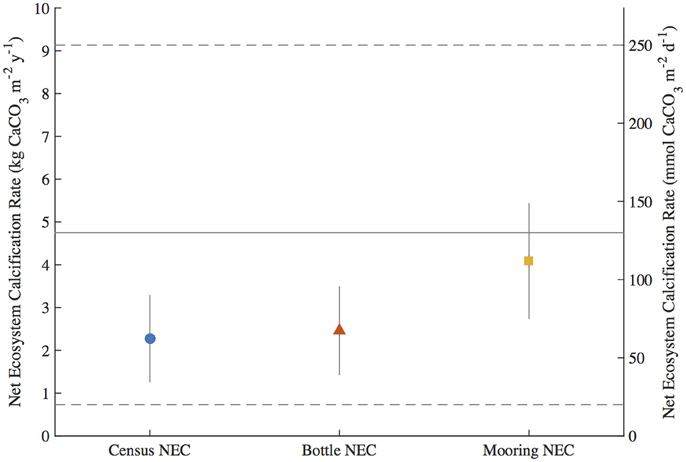
Figure 6. Integrated Net Ecosystem Calcification (NEC) (±uncertainty) during the first mooring deployment from 2011.2 to 2012.1 for the census NEC, bottle NEC, and mooring NEC. The solid gray line and dashed gray lines represent the mean and range of NEC, respectively, for reef flats globally from Atkinson (2011).
The census NEC in this study was limited by the high structural complexity (i.e., caves and overhangs) of Hog Reef, lack of calcification by suborder holaxonia and phyla Mollusca, and potential differences in biocalcification rates in Bermuda relative to literature reported rates for the tropical Caribbean. The limitations imposed by “canopy effects” present in the planar video surveys of structurally complex Hog Reef (Goatley and Bellwood, 2011) lead to underestimates of calcification by benthic foraminifera, bryozoans, corals, and coralline algae as well as underestimates of CaCO3 dissolution by cryptic bioeroders (Hutchings, 1986), uncolonized substrate, and sediments occurring in unsampled caves. A prior estimate of Bermuda coral reef benthic foraminifera CaCO3 production (0.080 kg CaCO3•m−2•y−1; Langer et al., 1997) is significantly less than the census NEC (2.35 ± 1.01 kg CaCO3•m−2•y−1) suggesting the absence of benthic foraminifera has a small influence on the Hog Reef NEC estimate. Additionally, the lack of published calcification rates for suborder holaxonia sea fans and sea rods and absence of phyla Mollusca and Echinodermata in the benthic survey data further underestimate total calcification occurring at Hog Reef. Because Bermuda is located at the edge of the latitudinal limit for coral reefs, it remains unclear how the cooler waters may systematically reduce calcification rates of all biocalcifiers in Bermuda relative to literature reported rates for more tropical Caribbean reefs. Annual in situ calcification rates for 2011 in this study for D. labyrinthiformis (3.02 kg CaCO3•m−2•y−1) and P. astreoides (2.70 kg CaCO3•m−2•y−1) were 35 and 57% lower respectively than calcification rates aggregated by ReefBudget for Caribbean corals at 10 m-depth (Perry et al., 2012). Similarly reduced growth rates in Bermuda relative to elsewhere in the Caribbean were observed for P. strigosa, D. labyrinthiformis, P. astreoides, and Scolymia cubensis (Tomascik and Logan, 1990; Logan and Tomascik, 1991; Logan et al., 1994). These findings that calcification rates are potentially lower in Bermuda suggest that the Caribbean ReefBudget calcification rates (Perry et al., 2012) used for many of the calcifying species in this study overestimate Hog Reef NEC. While this study was unable to quantify the contributions by each of these components, the close agreement between the census NEC and the bottle NEC suggest the net effect of these uncertainties on NEC may cancel out or are small relative to the other components of the census-based budget.
The bottle and mooring NEC in this study were limited by the ability to measure residence time, reef depth, and TA of reef seawater relative to source seawater. Estimations of NEC via the alkalinity anomaly method are particularly sensitive to changes in residence time and flow rates of the seawater overlying the reef community (Venti et al., 2012; Zhang et al., 2012; Falter et al., 2013; Teneva et al., 2013). Controlled volume experiments and numerical models further elucidate the necessity in measuring the height of the resulting mixed water column when calculating NEC (Zhang et al., 2012; Falter et al., 2013; Teneva et al., 2013). Prior work on residence times for nearby North Channel by Venti et al. (2012) and Bermuda platform bathymetry data from Sutherland et al. (2014) constrained these uncertainties in residence time and depth such that bottle and mooring NEC could be estimated for Hog Reef. To test for the contributions of uncertainty in residence time and seawater depth in this study, a sensitivity analysis was performed on the bottle NEC to test for a range of variability introduced within one standard deviation of mean residence times and depth of the effective reef footprint of Hog Reef (Figure 7). The source seawater TA for Bermuda rim reefs is well characterized by BATS making Hog Reef an ideal location to estimate chemistry-based NEC. Reef seawater TA for the bottle NEC estimates was directly measured (±4 μmol•kg−1) while mooring NEC in this study requires reef seawater TA to be calculated from measured pCO2 and modeled pHtotal (estimated ±21 μmol•kg−1 from Millero, 2007). The resulting error between bottle NEC (±1.02 kg CaCO3•m−2•y−1) and mooring NEC (±1.34 kg CaCO3•m−2•y−1) reveals that the uncertainty introduced from predicting mooring TA is less than the combined uncertainties in seawater residence time and depth. This collectively shows that uncertainty in bottle and mooring NEC estimates are only as good as the ability to quantify the residence time and volume of the seawater overlying the benthic community.
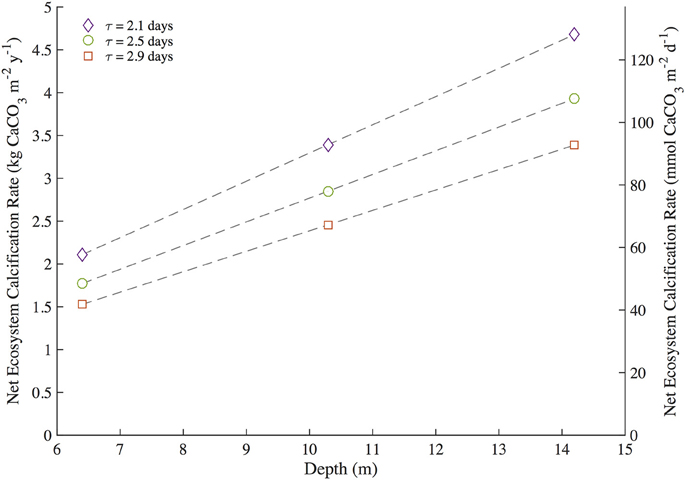
Figure 7. Sensitivity analysis for bottle NEC at Hog Reef during the 2-year study period. Bottle Net Ecosystem Calcification (NEC) was calculated iteratively using mean depth ± one standard deviation (10.3 ± 3.3 m) and mean residence time ± one standard deviation (2.5 ± 0.4 days) to determine the sensitivity of NEC to the interacting uncertainty and variability of these measurements.
The balance between coral reef calcification and CaCO3 dissolution is of particular concern to the persistence of coral reef structure and other ecosystem services (Eyre et al., 2014). Coral community shifts and declining coral cover have already decreased Caribbean reef NEC with a tipping point from positive to negative net CaCO3 production occurring when hard coral cover falls below ca. 10% (Perry et al., 2013, 2015). In this study, census-based estimates of calcification greatly exceeded CaCO3 dissolution at Hog Reef (Figure 4); however, chemistry based estimates reveal occasional measurements of net CaCO3 dissolution occurring in spring and mid-summer (Figure 3). Despite larger-scale patterns of coral cover decline in the Caribbean over the most recent decades (Gardner et al., 2003), mean Bermuda rim reef hard coral cover has remained approximately constant over that time period (Dodge et al., 1982; CARICOMP, 2000; Linton and Fisher, 2004; MEP, 2007; Smith et al., 2013; Jackson et al., 2014). Because coral cover has remained approximately constant, any decadal-scale changes in calcification and CaCO3 dissolution are therefore more likely to have changed due to changing rates and not changing benthic community composition. Notably, recent studies have shown that coral reef CaCO3 dissolution is stimulated by changing climate and ocean chemistry (Andersson et al., 2009; Tribollet et al., 2009; Cyronak et al., 2013a; Reyes-Nivia et al., 2013) suggesting that even at constant coral cover, increased CaCO3 dissolution could drive declines in net CaCO3 production at Hog Reef. Further research should be conducted to see how these rates have changed in response to changing climate and ocean chemistry to better understand potential calcification-CaCO3 dissolution tipping points for the rim reefs of Bermuda.
Continued global declines in coral cover and changing coral community composition highlight the importance for NEC measurements to be included in coral reef monitoring projects to assess the ability of a given coral reef to maintain positive CaCO3 production and therefore reef structure and function. Because NEC measures the capacity for in situ coral reef CaCO3 production (Perry et al., 2012, 2013), it must be considered within the context of additional import, export, and erosion of CaCO3 material if the monitoring goal is to directly measure net coral reef accretion (e.g., Scoffin, 1992; Milliman, 1993; Kleypas et al., 2001; Perry et al., 2008, 2012; Montaggioni and Braithwaite, 2009; Tribollet and Golubic, 2011). To date, much attention has been given to reef accretion processes highlighting the importance of additionally studying the dynamics of erosive processes, especially dissolution of CaCO3 in sediment and by microborers, sponges, and other bioeroders. Although sediment dissolution was only a small component of the total dissolution in this study due to the small percentage surface area of sands, other reefs have a much larger percentage surface area of sands making sediment CaCO3 dissolution a more important component of the CaCO3 budget at those reefs (Cyronak et al., 2013a; Cyronak and Eyre, 2016). Nonetheless, census and chemistry-based NEC estimates represent relatively non-invasive means of measuring coral reef CaCO3 production capacity. Census-based NEC and the relative CaCO3 production contributions by the dominant biocalcifying species for Caribbean coral reefs can be estimated from benthic survey data using standardized methods and literature reported rates from the ReefBudget project (Perry et al., 2012). Notably, D. labyrinthiformis, P. strigosa, M. alcicornis, and O. franksi contribute 94 ± 19% of the total calcification at Hog Reef (Table 1, Figure 4) suggesting conservation measures should focus on those four species to preserve positive CaCO3 production at Hog Reef. Chemistry-based NEC estimates require well-constrained estimates of seawater residence time, bathymetry, source seawater TA, and reef seawater TA to capture the entire sum of calcification and CaCO3 dissolution over shorter time scales (e.g., Langdon et al., 2010 and references therein). These shorter time scale NEC measurements allow the mechanisms (i.e., Smith and Buddemeier, 1992: temperature, light, carbonate chemistry, hydrodynamics, nutrients, salinity, and sea level) driving NEC to be further explored (Silverman et al., 2007; Shaw et al., 2012, 2015; Albright et al., 2015), thus providing a greater understanding of coral reef NEC and how coral reef CaCO3 production may be affected by global change. The results of this study conducted at Hog Reef suggest that either method may be used with remarkable agreement over annual time scales (Hog Reef, 2011 census NEC 2.35 ± 1.01 kg CaCO3•m−2•y−1 vs. bottle NEC 2.23 ± 1.02 kg CaCO3•m−2•y−1) depending on the available resources and goals of the reef-monitoring agency. When used in conjunction, the census and chemistry-based NEC approaches corroborate estimates of NEC to provide species-level estimates of CaCO3 production (census NEC; Table 1, Figure 4) while highlighting temporal variability (chemistry NEC; Figure 3) in coral reef CaCO3 production.
Conclusions
The present study reveals that 2011 annual census NEC (2.35 ± 1.01 kg CaCO3•m−2•y−1) and bottle NEC (2.23 ± 1.02 kg CaCO3•m−2•y−1) at Hog Reef are in close agreement. Census-based budgets allow for NEC to be subdivided into the individual contributions by species or substrate on calcification and CaCO3 dissolution over annual time scales and revealed that the vast majority of CaCO3 production at Hog Reef (94 ± 19%) was by D. labyrinthiformis, P. strigosa, M. alcicornis, and O. franksi. Alternatively, chemistry-based estimates capture the NEC of the entire reef at shorter temporal timescales allowing the high temporal variability of coral reef NEC to be analyzed relative to the potential drivers causing NEC to vary. Varying agreement between census-based and chemistry-based NEC was found during the ca. 2-year study interval further highlighting the dynamic nature of NEC and calling for further investigation of the mechanisms driving variability in biocalcification, dissolution, and seawater residence times at Hog Reef. These findings collectively suggest that either method, but ideally both methods, may be used to estimate coral reef NEC depending on the goals or available resources of the coral reef-monitoring project and that high temporal variability in coral reef environments must always be considered when studying biogeochemical processes such as calcification and CaCO3 dissolution.
Author Contributions
TAC and AJA designed the NEC study, analyzed the results, and wrote the manuscript. AJA, AC, TC, SdP, BE, RG, EH, RJ, SM, TN, CS, AJS, JT, and AT collected and provided data for various components of the NEC study. All authors commented on and approved the final draft of this manuscript.
Funding
NSF OCE 09-28406 (AJA, NB, SdP); NSF OCE 12-55042 (AJA); NSF OCE 14-16518 (AJA, RJ); ARC DP150102092 (BE, AJA); French Ministry of Ecology MEDDE- Program MIDACOR (AT); NOAA Office of Oceanic and Atmospheric Research (AS, CS).
Conflict of Interest Statement
The authors declare that the research was conducted in the absence of any commercial or financial relationships that could be construed as a potential conflict of interest.
Acknowledgments
James J. Leichter is gratefully acknowledged for providing guidance and insight into developing methods for determining the effective footprint based on the acoustic current profiler data. We thank Mandy Shailer from the Government of Bermuda for her assistance in providing us with the most up-to-date Bermuda platform bathymetry data. We thank Sandrine Caquineau for her assistance with scanning electron microscopy on the platform ALIZES (Centre IRD, Bondy, Fr). Additional BIOS and NOAA PMEL staff are gratefully acknowledged for their contributions to the data collection of various components of this project. Theodor Kindeberg provided comments that improved an earlier version of this manuscript. We additionally thank the two reviewers for their constructive comments and feedback. This work is PMEL contribution number 4504.
References
Albright, R., Benthuysen, J., Cantin, N., Caldeira, K., and Anthony, K. (2015). Coral reef metabolism and carbon chemistry dynamics of a coral reef flat. Geophys. Res. Lett. 42, 3980–3988. doi: 10.1002/2015GL063488
Aline, T. (2008). Dissolution of dead corals by euendolithic microorganisms across the northern Great Barrier Reef (Australia). Microb. Ecol. 55, 569–580. doi: 10.1007/s00248-007-9302-6
Alvarez-Filip, L., Carricart-Ganivet, J. P., Horta-Puga, G., and Iglesias-Prieto, R. (2013). Shifts in coral-assemblage composition do not ensure persistence of reef functionality. Sci. Rep. 3:3486. doi: 10.1038/srep03486
Alvarez-Filip, L., Dulvy, N. K., Gill, J. A., Côté, I. M., and Watkinson, A. R. (2009). Flattening of Caribbean coral reefs: region-wide declines in architectural complexity. Proc. Biol. Sci. 276, 3019–3025. doi: 10.1098/rspb.2009.0339
Andersson, A. J., and Gledhill, D. (2013). Ocean acidification and coral reefs: effects on breakdown, dissolution, and net ecosystem calcification. Ann. Rev. Mar. Sci. 5, 321–348. doi: 10.1146/annurev-marine-121211-172241
Andersson, A. J., Kuffner, I. B., Mackenzie, F. T., Jokiel, P. L., Rodgers, K. S., and Tan, A. (2009). Net loss of CaCO3 from a subtropical calcifying community due to seawater acidification: mesocosm-scale experimental evidence. Biogeosciences 6, 1811–1823. doi: 10.5194/bg-6-1811-2009
Andersson, A. J., Yeakel, K. L., Bates, N. R., and de Putron, S. J. (2014). Partial offsets in ocean acidification from changing coral reef biogeochemistry. Nat. Clim. Chang. 4, 56–61. doi: 10.1038/nclimate2050
Andréfouët, S., and Payri, C. (2000). Scaling-up carbon and carbonate metabolism of coral reefs using in-situ data and remote sensing. Coral Reefs 19, 259–269. doi: 10.1007/s003380000117
Atkinson, M. (2011). “Biogeochemistry of nutrients,” in Coral Reefs: An Ecosystem in Transition, eds Z. Dubinsky and N. Stambler (Dordrecht: Springer), 199–206.
Bak, R. P. M. (1976). The growth of coral colonies and the importance of crustose coralline algae and burrowing sponges in relation with carbonate accumulation. Netherlands J. Sea Res. 10, 285–337. doi: 10.1016/0077-7579(76)90009-0
Bates, N. R. (2002). Seasonal variability of the effect of coral reefs on seawater CO2 and air-sea CO2 exchange. Limnol. Oceanogr. 47, 43–52. doi: 10.4319/lo.2002.47.1.0043
Bates, N. R., Amat, A., and Anderrsson, A. J. (2010). The interaction of carbonate chemistry and coral reel calcification: the carbonate chemistry coral reef ecosystem feedback (CREF) hypothesis. Biogeosciences 7, 2509–2530. doi: 10.5194/bg-7-2509-2010
Bates, N. R., Best, M. H. P., Neely, K., Garley, R., Dickson, A. G., and Johnson, R. J. (2012). Detecting anthropogenic carbon dioxide uptake and ocean acidification in the North Atlantic Ocean. Biogeosciences 9, 2509–2522. doi: 10.5194/bg-9-2509-2012
Bates, N. R., Samuels, L., and Merlivat, L. (2001). Biogeochemical and physical factors influencing seawater f CO2 and air-sea CO2 exchange on the Bermuda coral reef. Limnol. Oceanogr. 46, 833–846. doi: 10.4319/lo.2001.46.4.0833
Bermuda Weather Service (2016). Climate Data for Bermuda. Available online at: www.weather.bm/climate.asp
Broecker, W. S., and Takahashi, T. (1966). Calcium carbonate precipitation on the Bahama Banks. J. Geophys. Res. 71, 1575–1602. doi: 10.1029/JZ071i006p01575
CARICOMP (2000). “Status and temporal trends at CARICOMP coral reef sites,” in Proceedings of the 9th International Coral Reef Symposium, Vol. 1, (Bali).
Carreiro-Silva, M., McClanahan, T. R., and Kiene, W. E. (2005). The role of inorganic nutrients and herbivory in controlling microbioerosion of carbonate substratum. Coral Reefs 24, 214–221. doi: 10.1007/s00338-004-0445-3
Chave, K. E., Smith, S. V., and Roy, K. J. (1972). Carbonate production by coral reefs. Mar. Geol. 12, 123–140. doi: 10.1016/0025-3227(72)90024-2
Cyronak, T., and Eyre, B. D. (2016). The synergistic effects of ocean acidification and organic metabolism on calcium carbonate (CaCO3) dissolution in coral reef sediments. Mar. Chem. 183, 1–12. doi: 10.1016/j.marchem.2016.05.001
Cyronak, T., Santos, I. R., and Eyre, B. D. (2013a). Permeable coral reef sediment dissolution driven by elevated pCO2 and pore water advection. Geophys. Res. Lett. 40, 4876–4881. doi: 10.1002/grl.50948
Cyronak, T., Santos, I. R., McMahon, A., and Eyre, B. D. (2013b). Carbon cycling hysteresis in permeable carbonate sands over a diel cycle: implications for ocean acidification. Limnol. Oceanogr. 58, 131–143. doi: 10.4319/lo.2013.58.1.0131
Dahl, A. L. (1973). Surface area in ecological analysis: quantification of benthic coral-reef algae. Mar. Biol. 23, 239–249. doi: 10.1007/BF00389331
de Groot, R., Brander, L., van der Ploeg, S., Costanza, R., Bernard, F., Braat, L., et al. (2012). Global estimates of the value of ecosystems and their services in monetary units. Ecosyst. Serv. 1, 50–61. doi: 10.1016/j.ecoser.2012.07.005
Dickson, A. G. (1990). Standard potential of the reaction: AgCl(s) + 1/2 H2(g) = Ag(s) + HCl(aq), and the standard acidity constant of the ion HSO4- in synthetic seawater from 273.15 to 318.15 K. J. Chem. Thermodyn. 22, 113–127. doi: 10.1016/0021-9614(90)90074-Z
Dickson, A. G., and Millero, F. J. (1987). A comparison of the equilibrium constants for the dissociation of carbonic acid in seawater media. Deep Sea Res. Part A. Oceanogr. Res. Pap. 34, 1733–1743. doi: 10.1016/0198-0149(87)90021-5
Dickson, A. G., Sabine, C. L., and Christian, J. R. (2007). Guide to Best Practices for Ocean CO2 Measurements. IOCCP Report no. 8, PICES Special Publication 3, International Ocean Carbon Coordination Project, Sopot, Poland. Available online at: cdiac.ornl.gov/oceans/ Handbook_2007.html
Dodge, R. E., Logan, A., and Antonius, A. (1982). Quantitative reef assessment studies in Bermuda: a comparison of methods and preliminary results. Bull. Mar. Sci. 32, 745–760.
Done, T. J., Ogden, J. C., Wiebe, W. J., and Rosen, B. R. (1996). “Biodiversity and ecosystem function of coral reefs,” in Heywood VH Global Biodiversity Assessment, eds H. A. Mooney, J. H. Cushman, E. Medina, O. E. Sala, and E.-D. Schulze (Cambridge University Press for United Nations Environment Programme), 393–429.
Eakin, C. M. (1996). Where have all the carbonates gone? A model comparison of calcium carbonate budgets before and after the 1982–1983 El Nino at Uva Island in the eastern Pacific. Coral Reefs 15, 109–119. doi: 10.1007/bf01771900
Edmunds, P. J., Comeau, S., Lantz, C., Andersson, A., Briggs, C., Cohen, A., et al. (2016). Integrating the effects of ocean acidification across functional scales on tropical coral reefs. BioScience 66, 350–362. doi: 10.1093/biosci/biw023
Esford, L. E., and Lewis, J. C. (1990). Stiffness of Caribbean gorgonians (Coelenterata, Octocorallia) and Ca/Mg content of their axes. Mar. Ecol. Prog. Ser. Oldendorf 6, 189–200. doi: 10.3354/meps067189
Eyre, B. D., Andersson, A. J., and Cyronak, T. (2014). Benthic coral reef calcium carbonate dissolution in an acidifying ocean. Nat. Clim. Chang. 4, 969–976. doi: 10.1038/nclimate2380
Falter, J. L., Lowe, R. J., Zhang, Z., and McCulloch, M. (2013). Physical and biological controls on the carbonate chemistry of coral reef waters: effects of metabolism, wave forcing, sea level, and geomorphology. PLoS ONE 8:e53303. doi: 10.1371/journal.pone.0053303
Gardner, T. A., Côté, I. M., Gill, J. A., Grant, A., and Watkinson, A. R. (2003). Long-term region-wide declines in Caribbean corals. Science 301, 958–960. doi: 10.1126/science.1086050
Gattuso, J. P., Pichon, M., Delesalle, B., Canon, C., and Frankignoulle, M. (1996). Carbon fluxes in coral reefs. I. Lagrangian measurement of community metabolism and resulting air-sea CO2 disequilibrium. Mar. Ecol.Prog. Ser. 145, 109–121. doi: 10.3354/meps145109
Glover, D. M., Jenkins, W. J., and Doney, S. C. (2011). Modeling Methods for Marine Science. Cambridge: Cambridge University Press.
Goatley, C. H., and Bellwood, D. R. (2011). The roles of dimensionality, canopies and complexity in ecosystem monitoring. PLoS ONE 6:e27307. doi: 10.1371/journal.pone.0027307
Grange, J. S., Rybarczyk, H., and Tribollet, A. (2015). The three steps of the carbonate biogenic dissolution process by microborers in coral reefs (New Caledonia). Environ. Sci. Pollut. Res. 22, 13625–13637. doi: 10.1007/s11356-014-4069-z
Hamylton, S., Silverman, J., and Shaw, E. (2013). The use of remote sensing to scale up measures of carbonate production on reef systems: a comparison of hydrochemical and census-based estimation methods. Int. J. Remote Sens. 34, 6451–6465. doi: 10.1080/01431161.2013.800654
Harney, J. N., and Fletcher, C. H. III. (2003). A budget of carbonate framework and sediment production, Kailua Bay, Oahu, Hawaii. J. Sediment. Res.73, 856–868. doi: 10.1306/051503730856
Hubbard, D. K., Miller, A. I., and Scaturo, D. (1990). Production and cycling of calcium carbonate in a shelf-edge reef system (St. Croix, U.S. Virgin Islands): applications to the nature of reef systems in the fossil record. J. Sediment. R. 60, 335–360. doi: 10.1306/212F9197-2B24-11D7-8648000102C1865D
Hutchings, P. A. (1986). Biological destruction of coral reefs. Coral reefs 4, 239–252. doi: 10.1007/BF00298083
Jackson, J. B. C., Donovan, M. K., Cramer, K. L., and Lam, V. (2014). Status and Trends of Caribbean Coral Reefs: 1970-2012. Gland: Global Coral Reef Monitoring Network; IUCN.
Jokiel, P. L., Maragos, J. E., and Franzisket, L. (1978). Coral Growth: Buoyant Weight Technique. Coral Reefs: Research Methods. Paris: UNESCO, 529–541.
Kinsey, D. W. (1979). Carbon Turnover and Accumulation by Coral Reefs. Doctoral dissertation, University of Hawai'i.
Kinsey, D. W. (1981). “The Pacific/Atlantic reef growth controversy,” in Proceedings of the 4th International Coral Reef Symposium, Vol. 1, (Manila), 493–498.
Kinsey, D. W. (1985). “Metabolism, calcification and carbon production. I. System level studies,” in Proceedings of the 5th International Coral Reef Congress (Tahiti), 503–542.
Kleypas, J. A. (1997). Modeled estimates of global reef habitat and carbonate production since the last glacial maximum. Paleoceanography 12, 533–545. doi: 10.1029/97PA01134
Kleypas, J. A., Buddemeier, R. W., and Gattuso, J. P. (2001). The future of coral reefs in an age of global change. Int. J. Earth Sci. 90, 426–437. doi: 10.1007/s005310000125
Kleypas, J. A., McManus, J. W., and Meñez, L. A. (1999). Environmental limits to coral reef development: where do we draw the line? Am. Zool. 39, 146–159.
Ku, H. H. (1966). Notes on the use of propagation of error formulas. J. Res. Natl. Bur. Stand. 70C, 263–273. doi: 10.6028/jres.070c.025
Langdon, C., Gattuso, J.-P., and Andersson, A. (2010). “Measurements of calcification and dissolution of benthic organisms and communities,” in Guide to Best Practices for Ocean Acidification Research and Data Reporting, eds U. Riebesell, V. J. Fabry, L. Hansson, and J.-P. Gattuso (Luxembourg: Publications Office of the European Union), 215–232.
Langer, M. R., Silk, M. T., and Lipps, J. H. (1997). Global ocean carbonate and carbon dioxide production; the role of reef Foraminifera. J. Foraminiferal Res. 27, 271–277. doi: 10.2113/gsjfr.27.4.271
Levin, S. A. (1992). The problem of pattern and scale in ecology: the Robert H. MacArthur award lecture. Ecology 73, 1943–1967. doi: 10.1007/978-1-4615-1769-6_15
Linton, D., and Fisher, T. (2004). CARICOMP Caribbean Coastal Marine Productivity Program 1993-2003. Kingston: Caricomp.
Logan, A., and Tomascik, T. (1991). Extension growth rates in two coral species from high-latitude reefs of Bermuda. Coral Reefs 10, 155–160. doi: 10.1007/BF00572174
Logan, A., Yang, L., and Tomascik, T. (1994). Linear skeletal extension rates in two species of Diploria from high-latitude reefs in Bermuda. Coral Reefs 13, 225–230. doi: 10.1007/BF00303636
Mallela, J., and Perry, C. T. (2007). Calcium carbonate budgets for two coral reefs affected by different terrestrial runoff regimes, Rio Bueno, Jamaica. Coral Reefs 26, 129–145. doi: 10.1007/s00338-006-0169-7
Marsh, J. A. Jr. (1970). Primary productivity of reef-building calcareous red algae. Ecology 51, 255–263. doi: 10.2307/1933661
McDougall, T. J., and Barker, P. M. (2011). Getting Started with TEOS-10 and the Gibbs Seawater (GSW) Oceanographic Toolbox. Sydney: SCOR/IAPSO WG 127, 1–28.
Mehrbach, C., Culberson, C. H., Hawley, J. E., and Pytkowicz, R. M. (1973). Measurement of the apparent dissociation constants of carbonic acid in seawater at atmospheric pressure. Limnol. Oceanogr. 18, 897–907. doi: 10.4319/lo.1973.18.6.0897
MEP (2007). Marine Environmental Program Annual Report, 2006–2007. Bermuda Institute of Ocean Sciences, 80.
Millero, F. J. (2007). The marine inorganic carbon cycle. Chem. Rev. 107, 308–341. doi: 10.1021/cr0503557
Milliman, J. D. (1993). Production and accumulation of calcium carbonate in the ocean: budget of a nonsteady state. Glob. Biogeochem. Cycles 7, 927–957. doi: 10.1029/93GB02524
Moberg, F., and Folke, C. (1999). Ecological goods and services of coral reef ecosystems. Ecol. Econ. 29, 215–233. doi: 10.1016/S0921-8009(99)00009-9
Montaggioni, L. F., and Braithwaite, C. J. R. (2009). Quaternary Coral Reef Systems: History, Development Processes and Controlling Factors, Developments in Marine Geology. Oxford: Elsevier.
Perry, C. T., Edinger, E. N., Kench, P. S., Murphy, G. N., Smithers, S. G., Steneck, R. S., et al. (2012). Estimating rates of biologically driven coral reef framework production and erosion: a new census-based carbonate budget methodology and applications to the reefs of Bonaire. Coral Reefs 31, 853–868. doi: 10.1007/s00338-012-0901-4
Perry, C. T., Murphy, G. N., Kench, P. S., Smithers, S. G., Edinger, E. N., Steneck, R. S., et al. (2013). Caribbean-wide decline in carbonate production threatens coral reef growth. Nat. Commun. 4, 1402. doi: 10.1038/ncomms2409
Perry, C. T., Spencer, T., and Kench, P. S. (2008). Carbonate budgets and reef production states: a geomorphic perspective on the ecological phase-shift concept. Coral Reefs 27, 853–866. doi: 10.1007/s00338-008-0418-z
Perry, C. T., Steneck, R. S., Murphy, G. N., Kench, P. S., Edinger, E. N., Smithers, S. G., et al. (2015). Regional-scale dominance of non-framework building corals on Caribbean reefs affects carbonate production and future reef growth. Glob. Chang. Biol. 21, 1153–1164. doi: 10.1111/gcb.12792
Reyes-Nivia, C., Diaz-Pulido, G., Kline, D., Guldberg, O. H., and Dove, S. (2013). Ocean acidification and warming scenarios increase microbioerosion of coral skeletons. Glob. Chang. Biol. 19, 1919–1929. doi: 10.1111/gcb.12158
Salvat, B. (1992). Coral reefs—a challenging ecosystem for human societies. Glob. Environ. Change 2, 12–18. doi: 10.1016/0959-3780(92)90032-3
Schneider, C. A., Rasband, W. S., and Eliceiri, K. W. (2012). NIH image to ImageJ: 25 years of image analysis. Nat. Methods 9, 671–675. doi: 10.1038/nmeth.2089
Scoffin, T. (1992). Taphonomy of coral reefs: a review. Coral Reefs 11, 57–77. doi: 10.1007/BF00357423
Shaw, E. C., McNeil, B. I., and Tilbrook, B. (2012). Impacts of ocean acidification in naturally variable coral reef flat ecosystems. J. Geophys. Res. Oceans 117, C03038. doi: 10.1029/2011JC007655
Shaw, E. C., Phinn, S. R., Tilbrook, B., and Steven, A. (2015). Natural in situ relationships suggest coral reef calcium carbonate production will decline with ocean acidification. Limnol. Oceanogr. 60, 777–788. doi: 10.1002/lno.10048
Silverman, J., Lazar, B., and Erez, J. (2007). Effect of aragonite saturation, temperature, and nutrients on the community calcification rate of a coral reef. J. Geophys. Res. Oceans 112, C05004. doi: 10.1029/2006JC003770
Smith, S. R., de Putron, S., Murdoch, T. J., Pitt, J. M., and Nagelkerken, I. (2013). “Biology and ecology of corals and fishes on the Bermuda Platform,” in Coral Reefs of the United Kingdom Overseas Territories, ed C. R. C. Sheppard (Dordrecht: Springer), 135–151.
Smith, S. V. (1978). Coral-reef area and the contributions of reefs to processes and resources of the world's oceans. Nature 273, 225–226. doi: 10.1038/273225a0
Smith, S. V., and Buddemeier, R. W. (1992). Global change and coral reef ecosystems. Annu. Rev. Ecol. Syst. 23, 89–118. doi: 10.1146/annurev.es.23.110192.000513
Smith, S. V., and Key, G. S. (1975). Carbon dioxide and metabolism in marine environments. Limnol. Oceanogr. 20, 493–495. doi: 10.4319/lo.1975.20.3.0493
Smith, S. V., and Kinsey, D. W. (1976). Calcium carbonate production, coral reef growth, and sea level change. Science 194, 937–939. doi: 10.1126/science.194.4268.937
Spurgeon, J. P. (1992). The economic valuation of coral reefs. Mar. Pollut. Bull. 24, 529–536. doi: 10.1016/0025-326X(92)90704-A
Stearn, C. W., Scoffin, T. P., and Martindale, W. (1977). Calcium carbonate budget of a fringing reef on the West Coast of Barbados part I—zonation and productivity. Bull. Mar. Sci. 27, 479–510.
Sutherland, M. G., McLean, S. J., Love, M. R., Carignan, K. S., and Eakins, B. W. (2014). Digital Elevation Models of Bermuda: Data Sources, Processing and Analysis. Boulder, CO: NOAA National Geophysical Data Center, U.S. Dept. of Commerce, 7.
Sutton, A. J., Sabine, C. L., Maenner-Jones, S., Lawrence-Slavas, N., Meinig, C., Feely, R. A., et al. (2014). A high-frequency atmospheric and seawater pCO2 data set from 14 open-ocean sites using a moored autonomous system. Earth Syst. Sci. Data 6, 353–366. doi: 10.5194/essd-6-353-2014
Teneva, L., Dunbar, R. B., Mucciarone, D. A., Dunckley, J. F., and Koseff, J. R. (2013). High-resolution carbon budgets on a Palau back−reef modulated by interactions between hydrodynamics and reef metabolism. Limnol. Oceanogr. 58, 1851–1870. doi: 10.4319/lo.2013.58.5.1851
Tomascik, T., and Logan, A. (1990). A comparison of peripheral growth rates in the recent solitary coral Scolymia cubensis (Milne-Edwards and Haime) from Barbados and Bermuda. Bull. Mar. Sci. 46, 799–806.
Tribollet, A., Godinot, C., Atkinson, M., and Langdon, C. (2009). Effects of elevated pCO2 on dissolution of coral carbonates by microbial euendoliths. Glob. Biogeochem. Cycles 23, GB3008. doi: 10.1029/2008GB003286
Tribollet, A., and Golubic, S. (2011). “Reef bioerosion: agents and processes,” in Coral Reefs: An Ecosystem in Transition, eds Z. Dubinsky and N. Stambler (Dordrecht: Springer), 435–449.
Uppström, L. R. (1974). The boron/chlorinity ratio of deep-sea water from the Pacific Ocean. Deep Sea Res. Oceanogr. Abstr. 21, 161–162. doi: 10.1016/0011-7471(74)90074-6
van Heuven, S., Pierrot, D., Rae, J. W. B., Lewis, E., and Wallace, D. W. R. (2011). MATLAB Program Developed for CO2 System Calculations. ORNL/CDIAC-105b. Oak Ridge: Carbon Dioxide Information Analysis Center, Oak Ridge National Laboratory, U.S. Department of Energy.
Vecsei, A. (2004). A new estimate of global reefal carbonate production including the fore-reefs. Glob. Planet. Change 43, 1–18. doi: 10.1016/j.gloplacha.2003.12.002
Venti, A., Kadko, D., Andersson, A. J., Langdon, C., and Bates, N. R. (2012). A multi-tracer model approach to estimate reef water residence times. Limnol. Oceanogr. Methods 10, 1078–1095. doi: 10.4319/lom.2012.10.1078
Vogel, K., Gektidis, M., Golubic, S., Kiene, W. E., and Radtke, G. (2000). Experimental studies on microbial bioerosion at Lee Stocking Island, Bahamas and One Tree Island, Great Barrier reef, Australia: implications for paleoecological reconstructions. Lethaia 33, 190–204. doi: 10.1080/00241160025100053
Yeakel, K. L., Andersson, A. J., Bates, N. R., Noyes, T. J., Collins, A., and Garley, R. (2015). Shifts in coral reef biogeochemistry and resulting acidification linked to offshore productivity. Proc. Natl. Acad. Sci. U.S.A. 112, 14512–14517. doi: 10.1073/pnas.1507021112
Keywords: coral reef, net ecosystem calcification, budget, accretion, dissolution, calcium carbonate, biogeochemistry
Citation: Courtney TA, Andersson AJ, Bates NR, Collins A, Cyronak T, de Putron SJ, Eyre BD, Garley R, Hochberg EJ, Johnson R, Musielewicz S, Noyes TJ, Sabine CL, Sutton AJ, Toncin J and Tribollet A (2016) Comparing Chemistry and Census-Based Estimates of Net Ecosystem Calcification on a Rim Reef in Bermuda. Front. Mar. Sci. 3:181. doi: 10.3389/fmars.2016.00181
Received: 02 June 2016; Accepted: 06 September 2016;
Published: 23 September 2016.
Edited by:
Jessica Carilli, University of Massachusetts Boston, USAReviewed by:
Christopher Paul Jury, Hawai'i Institute of Marine Biology, USAChris Perry, University of Exeter, UK
Copyright © 2016 Courtney, Andersson, Bates, Collins, Cyronak, de Putron, Eyre, Garley, Hochberg, Johnson, Musielewicz, Noyes, Sabine, Sutton, Toncin and Tribollet. This is an open-access article distributed under the terms of the Creative Commons Attribution License (CC BY). The use, distribution or reproduction in other forums is permitted, provided the original author(s) or licensor are credited and that the original publication in this journal is cited, in accordance with accepted academic practice. No use, distribution or reproduction is permitted which does not comply with these terms.
*Correspondence: Travis A. Courtney, traviscourtney@gmail.com