Biodiversity in Marine Ecosystems—European Developments toward Robust Assessments
 Anna-Stiina Heiskanen1*
  Torsten Berg2
  Laura Uusitalo1
  Heliana Teixeira3†
  Annette Bruhn4
  Dorte Krause-Jensen4
  Christopher P. Lynam5
  Axel G. Rossberg5†
  Samuli Korpinen1
  Maria C. Uyarra6
  Angel Borja6
- 1Marine Research Centre, Finnish Environment Institute (SYKE), Helsinki, Finland
- 2MariLim Aquatic Research GmbH, Schönkirchen, Germany
- 3European Commission, Joint Research Centre (JRC), Directorate for Sustainable Resources, D.2 Water and Marine Resources Unit, Ispra, Italy
- 4Bioscience, Aarhus University, Silkeborg, Denmark
- 5Centre for Environment, Fisheries and Aquaculture Science, Lowestoft, UK
- 6Marine Research Division, AZTI, Pasaia, Spain
Sustainability of marine ecosystems and their services are dependent on marine biodiversity, which is threatened worldwide. Biodiversity protection is a major target of the EU Marine Strategy Framework Directive, requiring assessment of the status of biodiversity on the level of species, habitats, and ecosystems including genetic diversity and the role of biodiversity in food web functioning and structure. This paper provides a summary of the development of new indicators and refinement of existing ones in order to address some of the observed gaps in indicator availability for marine biodiversity assessments considering genetic, species, habitat, and ecosystem levels. Promising new indicators are available addressing genetic diversity of microbial and benthic communities. Novel indicators to assess biodiversity and food webs associated with habitats formed by keystone species (such as macroalgae) as well as to map benthic habitats (such as biogenic reefs) using high resolution habitat characterization were developed. We also discuss the advances made on indicators for detecting impacts of non-native invasive species and assessing the structure and functioning of marine food-webs. The latter are based on indicators showing the effects of fishing on trophic level and size distribution of fish and elasmobranch communities well as phytoplankton and zooplankton community structure as food web indicators. New and refined indicators are ranked based on quality criteria. Their applicability for various EU and global biodiversity assessments and the need for further development of new indicators and refinement of the existing ones is discussed.
Introduction
Sustainability of marine ecosystems and their services are dependent on marine biodiversity, which is threatened worldwide (Narayanaswamy et al., 2013; Bennett et al., 2015). Biodiversity is fundamental to sustain marine ecosystem services, such as food, maintenance of water quality, and recovery from perturbations (Beaumont et al., 2007; Liquete et al., 2016). Despite its important role and contribution to human wellbeing, its lost has been reported world-wide. The main threats to marine biodiversity include habitat loss, overexploitation, pollution by hazardous substances, eutrophication, and invasions by non-indigenous species (Kappel, 2005; Venter et al., 2006). Efforts to reduce these pressures for halting the biodiversity loss, a commitment of the signatory countries of the Convention on Biological Diversity (CBD, 1992), is therefore essential for global food security, coastal water quality, ecosystem stability, and buffering the resistance and recovery of ecosystem services, thus enabling different types of future economic valuations and management (Reker et al., 2015). Restoring marine biodiversity through sustainable fisheries management, pollution control, maintenance of essential habitats, and the creation of marine reserves, are some of the opportunities for investments that can support the productivity and reliability of goods and services that the ocean provides to humanity (Worm et al., 2006; Palumbi et al., 2009; Cressey, 2016). Marine management should ensure sustaining all of an ecosystem's biological parts at functioning levels—via conservation of biodiversity at all different levels (from genetic to ecosystems)—in order to maintain ecosystem integrity and stability (Palumbi et al., 2009). The objective of ecosystem-based management of marine environment is to ensure healthy, functional and diverse ecosystems by managing the key drivers of adverse impacts. Biodiversity indicators need to measure variables that are documented to respond to pressures, using methods that can distinguish the anthropogenic impact from natural variability (Borja et al., 2016).
In order to understand the current biodiversity status and its conservation needs (including restoration and prevention), it is imperative to monitor fundamental parameters of biodiversity, both structural and functional (Strong et al., 2015). As biodiversity is such a multifaceted concept, monitoring may need covering genetic variability and physiological or life history diversity within species, surrogate taxa such as habitat-forming species (e.g., seagrasses, kelps), pollutant-recycling species (e.g., marsh grasses, macroalgae), and species diversity all the way from megafauna to microbes, planktonic prokaryotes and micro-eukaryotes, and energy flow hubs (Strong et al., 2015). In addition to skilful taxonomists, the monitoring process might strongly benefit from information-based tools designed for quicker assessments of taxonomy (Pittman et al., 2007), long-term monitoring sites, new tools for remote and continuous measurement of different biological components (e.g., microbial diversity, oceanic, and coastal phytoplankton and zooplankton, and meio- and mega-fauna in the benthos). Such tools include (i) genomics (Bourlat et al., 2013), (ii) robust marine biosensors (e.g., automated aerial, surface, and underwater drones equipped with sonar or acoustic monitoring), (iii) underwater cameras for detection of ocean fauna, and (iv) improved mathematical models to chart energy flow within food webs amounting to creation of marine life observatories (Palumbi et al., 2009).
The EU Marine Strategy Framework Directive (MSFD; 2008/56/EC), one of the major legal frameworks for the protection of marine biodiversity together with the EU Biodiversity Strategy 2020 (COM/2011/0244) and the Convention on Biological Diversity (CBD, 1992), highlights setting programs for monitoring and assessing the environmental status of the marine waters. According to MSFD, the status of the marine environment is evaluated using 11 descriptors, that comprise both biodiversity related descriptors (D1, biological diversity; D4, food-webs; and D6, seafloor integrity) and pressure descriptors (D2, non-indigenous species; D3, fisheries; D5, eutrophication; D7, hydrological conditions; D8 and D9, contaminants in the environment and in seafood; D10, litter; D11, energy and noise). These are further detailed in the EU Commission Decision 2010/477/EU providing 29 criteria and 56 associated “indicators” that should be monitored for the assessment of the environmental status.
The MSFD puts biodiversity in the center of the assessment of marine environmental status (Borja et al., 2010). The descriptor (D1) on biodiversity has the following target to contribute to the achievement of the Good Environmental Status (GES): “Biological diversity is maintained. The quality and occurrence of habitats and the distribution and abundance of species are in line with prevailing physiographic, geographic, and climatic conditions.” The background and definitions, the key attributes (biological components, predominant habitat type, and ecotypes for mobile species) as well as the suggested indicator classes for the descriptor (D1) criteria of the attributes are presented by Cochrane et al. (2010). While this descriptor directly targets biodiversity, MSFD Descriptor 4 (Marine food-webs), which calls for maintenance of the normal functioning of marine food-webs, and some aspects of MSFD Descriptor 6 (Seafloor integrity) are also closely related to the assessment of biodiversity (Borja et al., 2010).
The assessment of the ecological status of coastal waters is also required by the EU Water Framework Directive (WFD; 2000/60/EC) which does not specifically address biodiversity. Nevertheless some of the indicators for biological quality elements under WFD, such as phytoplankton, macrophytes, zoobenthos, and additionally indicators for fish community structure for transitional waters (e.g., Heiskanen et al., 2004), can be also applied to the MSFD (Borja et al., 2010). Some of these indicators include parameters for species composition, community structure and abundance, and are thus also applicable for assessing biodiversity at the community level. For example, zoobenthos indicators such as AMBI (AZTI Marine Biotic Index; Borja et al., 2000) and BBI (Brackish waters Benthic Index; Perus et al., 2007) and macrophyte indicators such as eelgrass depth limit, all describe aspects of those communities (or biogenic habitats) and can be used in the biodiversity assessment for the MSFD (Rice et al., 2012) and have been included in the initial assessments of the marine environment carried out by EU member states in 2012.
The analysis of indicators and assessments applied in the MSFD initial assessments during the first phase of the MSFD implementation revealed some problems regarding the degree of development and operationality of the biodiversity assessment within the EU member states compared to the requirements of the MSFD (Berg et al., 2015; Hummel et al., 2015). Data availability and regional specificities influenced the number of methodologies used and reported by member states (Palialexis et al., 2014). Some ambiguity in the EU Commission Decision (Berg et al., 2015) introduced discrepancies and increased the potential for non-harmonized approaches in the assessment of the marine environment even between member states of the same regional sea.
In addition to the assessments performed by EU member states, marine biodiversity assessments have also been carried out at regional level by the Regional Sea Conventions (RSC), which have identified a number of biodiversity indicators representing the different trophic levels of the marine ecosystem as well as the relevant habitats and ecosystems. OSPAR and HELCOM, the relevant RSC for the North East Atlantic and Baltic Sea regions, respectively, have agreed to develop common indicators for the major elements and species groups of marine biodiversity: benthic and pelagic habitats, seabirds, marine mammals, fish and food webs (HELCOM, 2016; OSPAR, 2016). Existing monitoring programmes in these regions were originally set up to assess pollution effects in the marine system and commercially exploited fish stocks. Therefore, these did not originally cover biodiversity assessment needs as specified by the MSFD. Many of the common indicators currently being defined under OSPAR and HELCOM are new indicators to the regions, specifically developed for the forth-coming environmental assessment in 2018 and many of them have not been properly validated yet.
In order to complement the on-going work for biodiversity indicator development for the MSFD environmental status assessments in the EU, the EU FP7 project DEVOTES (DEVelopment Of innovative Tools for understanding marine biodiversity and assessing good Environmental Status; www.devotes-project.eu) carried out a comprehensive overview of existing biodiversity-related indicators used in previous marine assessments carried out under different policy frameworks, in the MSFD initial assessment, and elsewhere (Teixeira et al., 2014). The DEVOTES inventory of the existing biodiversity indicators was compiled in the form of a catalog, which includes over 600 entries. In this paper, we present an overview of the indicator development and refinements in DEVOTES, which were aimed to address some of the identified gaps and further development needs for the next phase of the MSFD assessment (by 2018).
Materials and Methods
DEVOTES biodiversity indicator catalog is available via a database software (DEVOTool), which allows navigating the metadata (http://www.devotes-project.eu/devotool) and to make specific queries to find existing indicators depending on the needs of the user. The catalog currently includes over 600 indicators of marine biodiversity, food web status, sea floor integrity, and alien species, used and proposed to be used in marine assessments. We queried the database to find out how many indicators there are for each ecosystem component, and how they relate to the MSFD Descriptors and criteria (Table 1). The exact DEVOTool query used here is presented in the Supplementary Material. Table 1 presents an overview of the number of indicators included in the DEVOTool Indicator Catalog and representing the different biodiversity components that these indicators cover (i.e., Microbes, Phytoplankton, Zooplankton, etc.), and their applicability to the MSFD Descriptors and criteria.
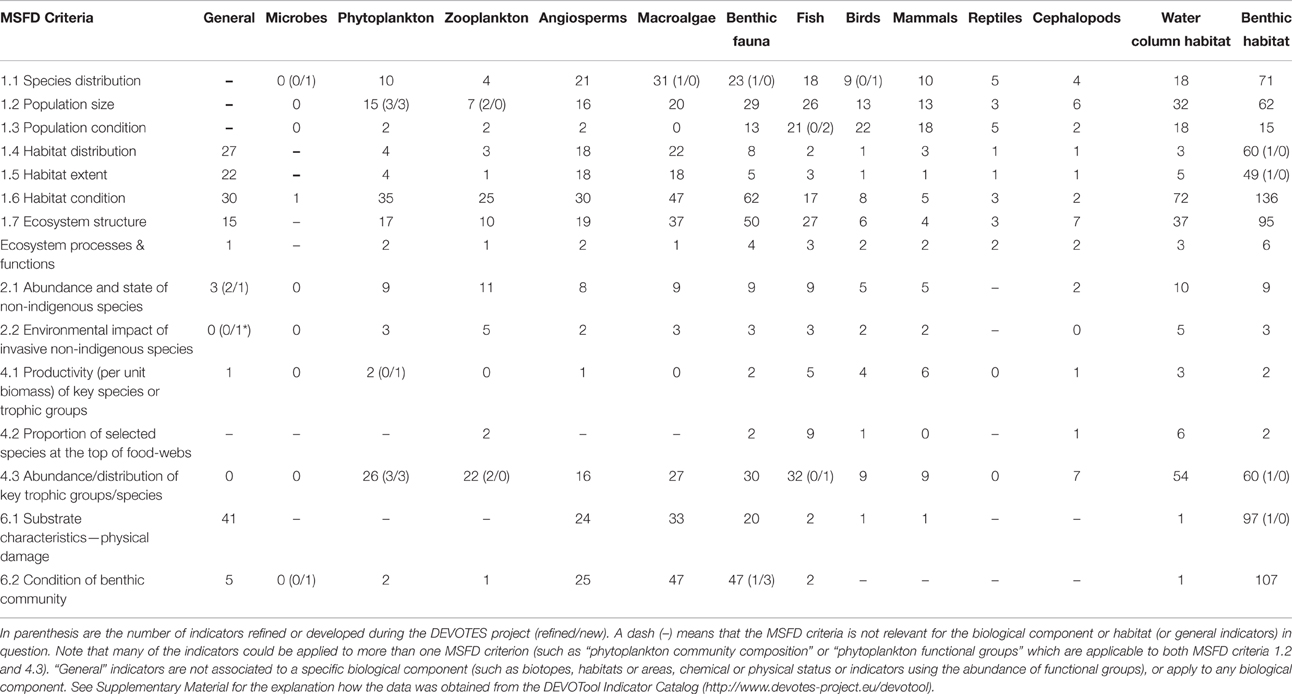
Table 1. Total number of indicators for specific biological components and MSFD criteria of descriptors 1, 2, 4, and 6 (according to Commission Decision 2010/477/EU) included in the DEVOTool Catalog prior to the new developments (database version 7).
At the early stages of the project, after the initial indicator catalog compilation, similar data was used to analyse the gaps in the available indicator coverage, and to prioritize the indicator development taking place within the project (Teixeira et al., 2014). The gap analysis was carried out comparing how well the indicators in the catalog cover the requirement of the MSFD Commission Decision (2010/477/EU) criteria and indicators for the biodiversity related descriptors D1, D2, D4, and D6. Also it was evaluated how well the indicators in the catalog covered the biodiversity components, and habitats, as listed in Table 1 of Annex III to the Directive (MSFD; 2008/56/EC) and specified by Cochrane et al. (2010). The number of indicators refined and new indicators developed for various biodiversity components are also included in Table 1. Overview of the methodologies for development of new indicators and refinements of existing indicators are compiled in Berg et al. (2016) and referred in the text.
Results
Gap Analysis of Biodiversity Indicators
Despite the high number of marine biodiversity indicators available, there were important gaps in terms of the MSFD requirements (Table 2; Berg et al., 2015). Additionally, there is insufficient information regarding the quality and confidence of the indicators (Queiros et al., 2016). Most indicators lack regional targets or quality threshold values, and few have a measure of confidence and a demonstrated link to pressures (Teixeira et al., 2014). Thus, although the indicators were operational in the sense that they were used in previous marine assessments, their applicability to fulfill the criteria of MSFD is less evident (Berg et al., 2015).
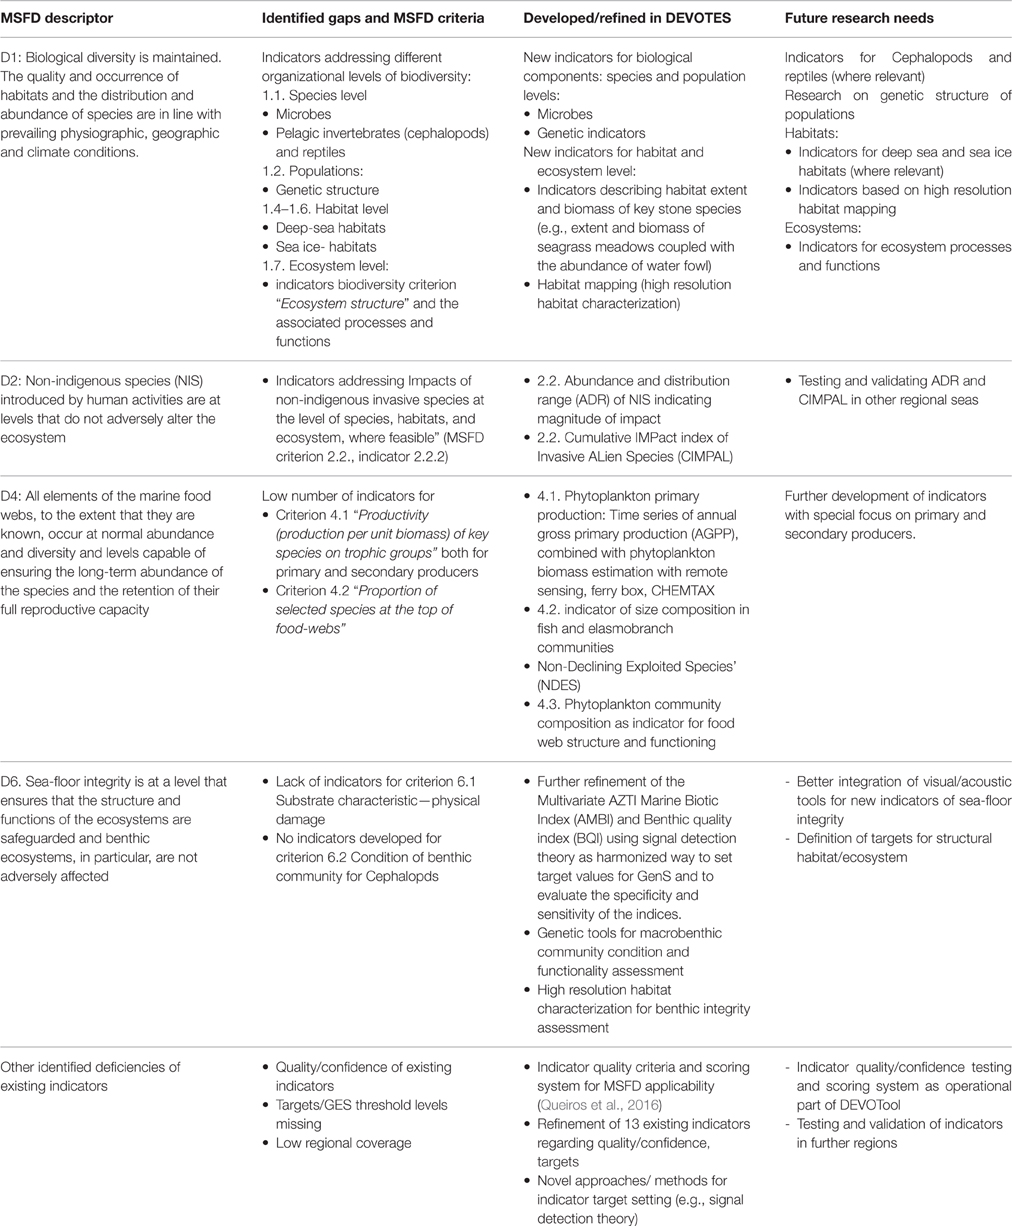
Table 2. Overview of the identified gaps in the suite of existing indicators (as included in the DEVOTool Catalog v. 7) for MSFD environmental status concerning Descriptors 1, 2, 4, and 6 (Annex 1) with respect to MSFD criteria (as identified in Commission Decision 2010/477/EU) and development of new and refined indicators in the DEVOTES project, as well as the identified future research needs.
Major gaps observed for the Descriptor 1 were indicators to assess the biodiversity at ecosystem level and the genetic composition of populations, indicators for microbes, pelagic invertebrates (Cephalopods), and reptiles (Table 2). Abyssal and bathyal zones totally lack indicators addressing those depths (Hummel et al., 2015, Teixeira et al., 2014). Moreover, habitats with restricted distribution in the regional seas (like ice-associated species and communities) had a low overall number of indicators (Teixeira et al., 2014). Indicators for the MSFD biodiversity criterion 1.7 “Ecosystem structure” and the associated processes and functions are relatively scarce (Berg et al., 2015), and those few addressing this criterion focused essentially on communities, often in isolated components. Only few biodiversity indicators related to ecosystem processes and function were reported (Table 1), all of them for the North-Eastern Atlantic (Teixeira et al., 2014).
MSFD Descriptor 2 addresses the threat on natural biological diversity caused by the non-indigenous species (NIS), which are the taxa introduced outside their natural range and natural dispersal potential as result of human activities. Particularly the invasive NIS are recognized as a global threat to biodiversity (Olenin et al., 2010). Despite the requirements of MSFD Descriptor 2, there were no reported indicators in Europe specifically assessing the “Impacts of non-indigenous invasive species at the level of species, habitats and ecosystem, where feasible” (MSFD criteria 2.2., indicator 2.2.2; Tables 1, 2; Teixeira et al., 2014). In most cases, the MSFD initial assessments of the Member States did not include reporting of the adverse effects in biodiversity or the magnitude of impacts caused by NIS (Palialexis et al., 2014; Berg et al., 2015). RSCs (e.g., Barcelona and Bucharest Conventions, HELCOM, and OSPAR) have not included indicators for NIS impacts within their agreed set of indicators. Only recently there have been research activities to develop practical proposals to help managers assess these requirements in standardized ways (e.g., Zaiko et al., 2011; Katsanevakis et al., 2016; Nentwig et al., 2016; Rabitsch et al., 2016).
Most of the MSFD food web indicators (Descriptor 4) are related to “Abundance or distribution of key trophic groups or species” (MSFD criteria 4.3), and are thus simultaneously D1 (MSFD criteria 1.1) indicators (Berg et al., 2015). There is a need to develop indicators related to MSFD criterion 4.1 (“Productivity (production per unit biomass) of key species on trophic groups”) especially focusing on primary and secondary producers, as well as for the criterion 4.2 (“Proportion of selected species at the top of food-webs”; Table 2).
Finally, the remaining biological descriptor of the MSFD (Descriptor 6 on sea-floor integrity) is rather well developed in terms of indicators, having a high number of them (≥20 indicators), both for criterion 6.1. (“Substrate characteristics—physical damage”) and 6.2. (“Condition of benthic community”) for angiosperms, macroalgae, and benthic fauna. However, there is a need for developing indicators especially for cephalopods, but also for other biological components. Also there is a gap in the development of targets at the level of benthic habitats and ecosystems.
Biodiversity Indicator Refinement and Development in DEVOTES
In order to address the identified gaps in the indicator availability for marine assessments, 16 new indicators were developed and 13 indicators were refined (Table 3) to better fulfill the MSFD requirements (Berg et al., 2016). The indicators were scored according to the eight indicator quality criteria listed by Queiros et al. (2016) in order to evaluate their fitness as potential indicators for the MSFD assessments (Figure 1). The quality criteria are: (1) Scientific basis, (2) Ecosystem relevance, (3) Responsiveness to pressure, (4) Possibility to set targets, (5) precautionary capacity, (6) Quality of sampling method, (7) Cost-effectiveness, and (8) Existing and ongoing monitoring data. In general, the newly developed indicators covered both pelagic and benthic ecosystems and addressed several biological components and habitats that were identified as lacking indicators or as being under-represented in several marine regions (Teixeira et al., 2014). In addition, 13 pre-existing indicators were further refined in order to improve their performance and confidence. For example, they were tested for responsiveness to pressures, or using new data sets to validate their applicability in wider sea regions.
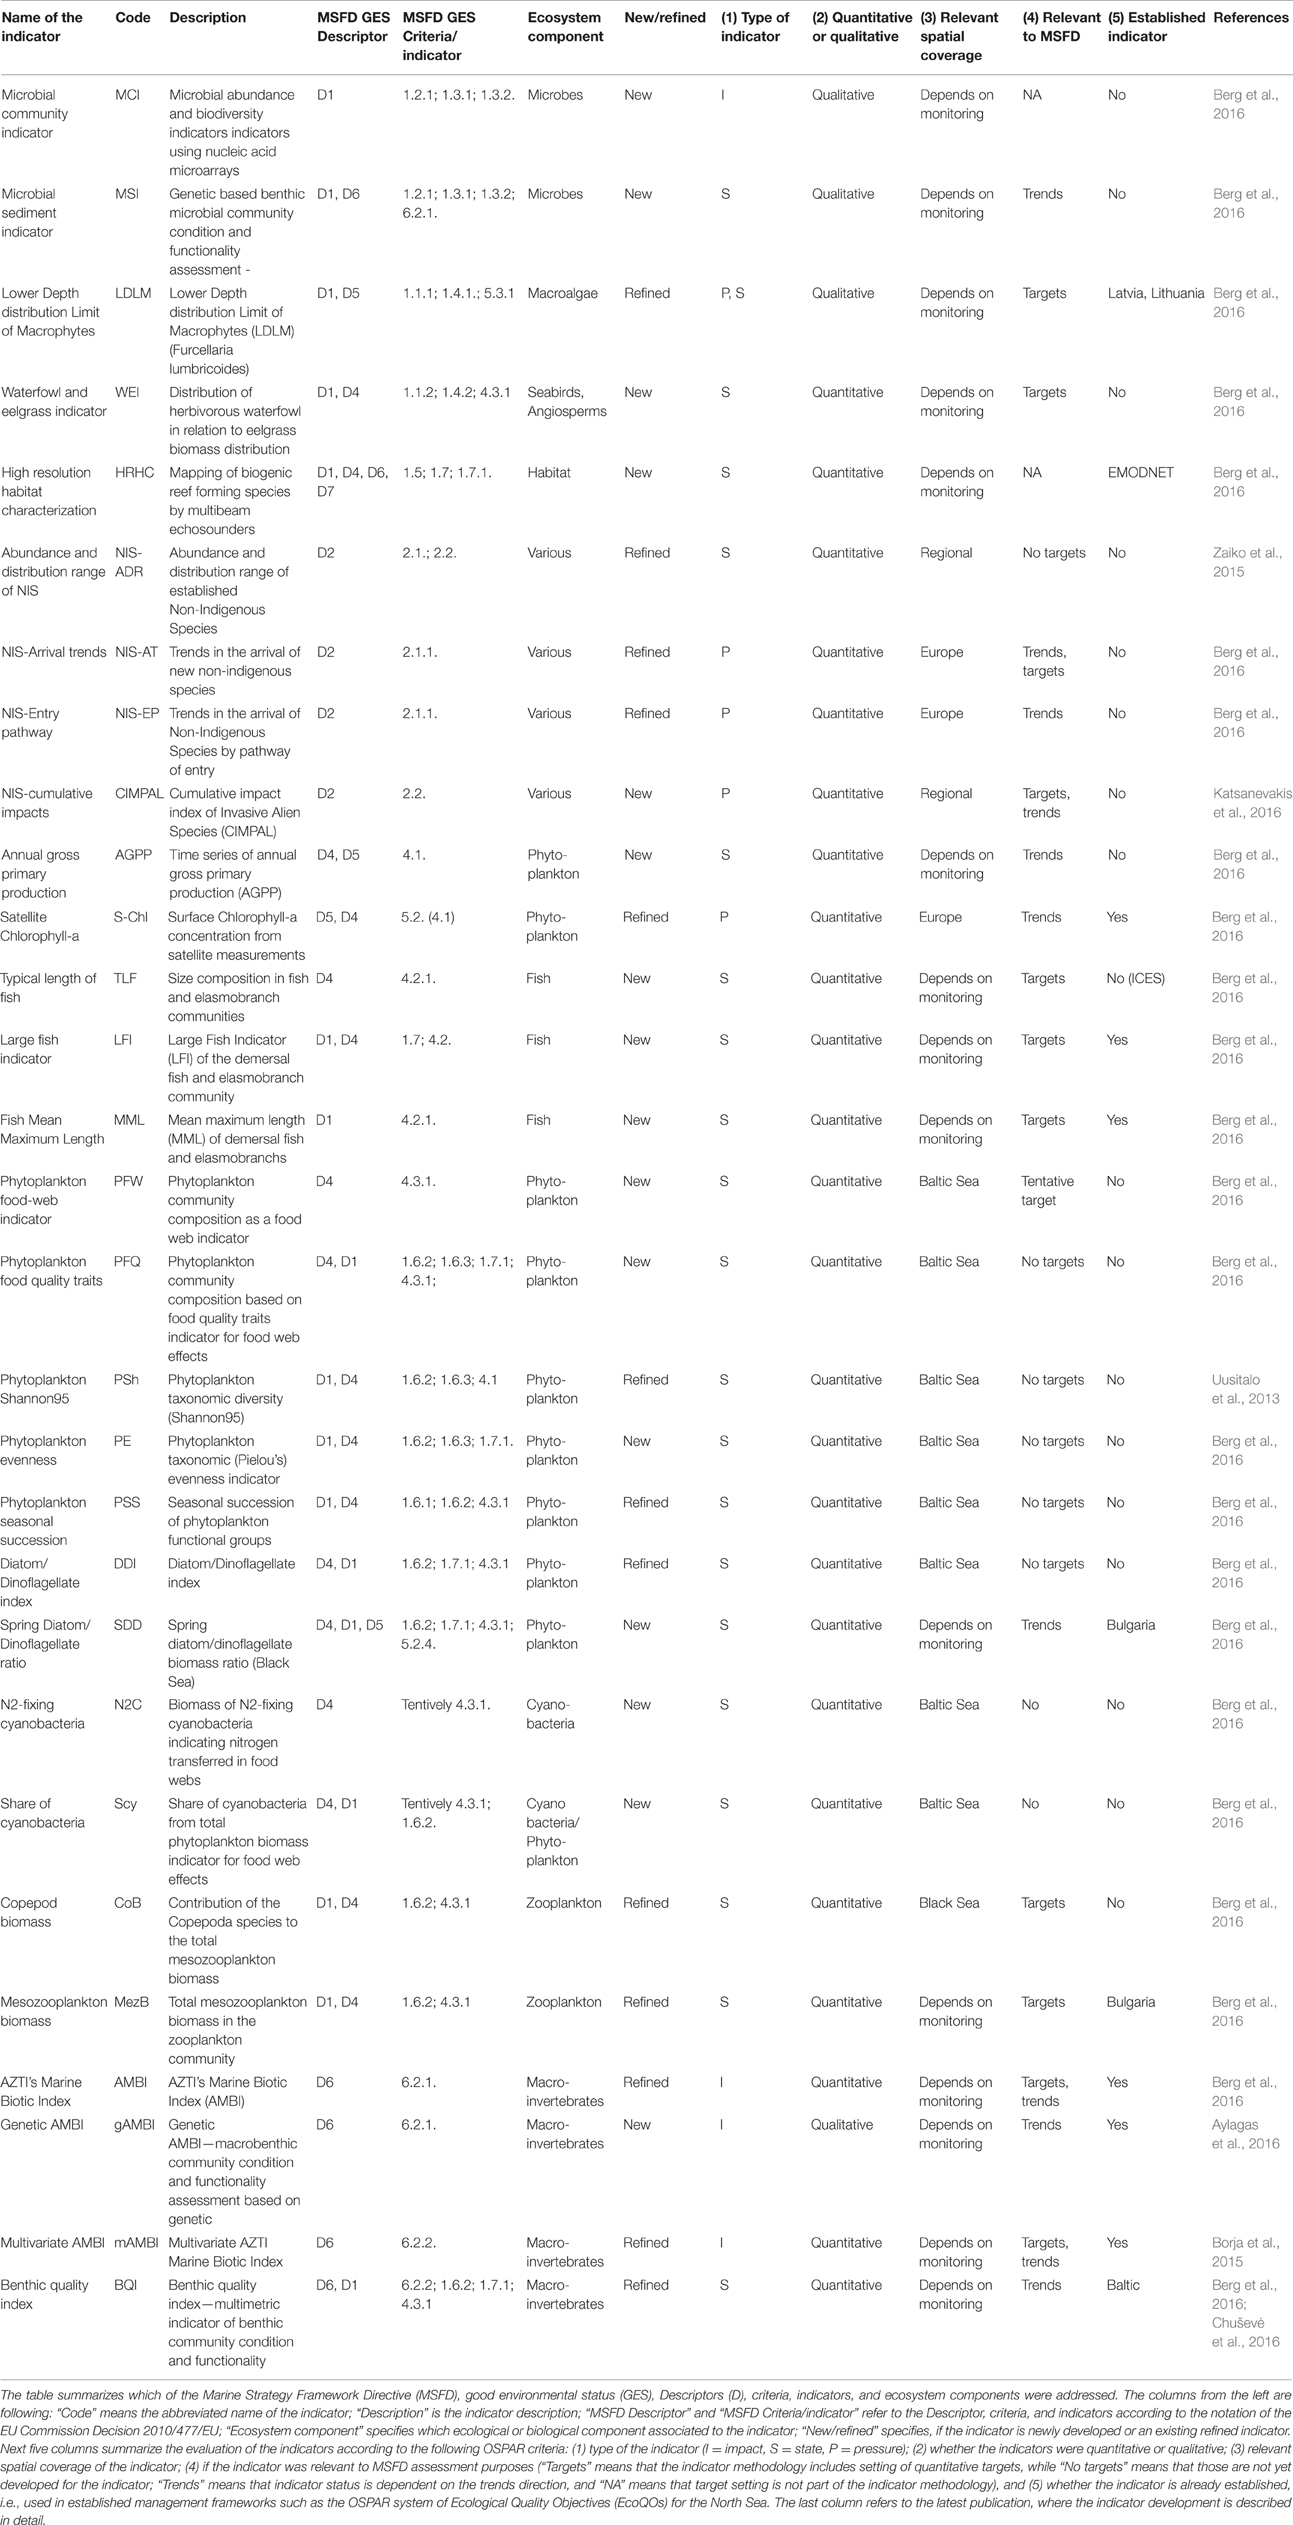
Table 3. New and refined indicators developed during the DEVOTES project.
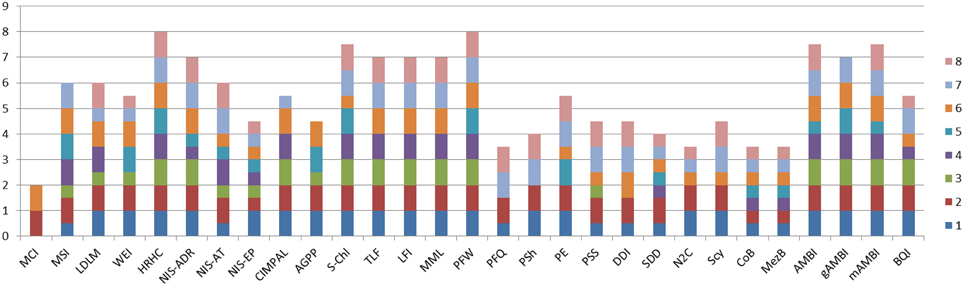
Figure 1. Cumulative quality scoring of the indicators developed and refined during the DEVOTES project. Indicator quality scores are based on the framework to test and evaluate indicator quality (Queiros et al., 2016). Each indicator was evaluated based on eight quality criteria: (1) Scientific basis; (2) Ecosystem relevance; (3) Responsiveness to pressures; (4) Possibility to set targets; (5) Early warning capacity; (6) Concreteness; (7) Cost-Efficiency; (8) Existing and on-going data. For each indicator the quality criteria were evaluated and scored using three evaluation scores: 1, criteria is fully met; 0.5, criteria is partially met; and 0, criteria is not met. The scoring principles for each indicator and criteria are described in detail by Berg et al. (2016). Indicator codes are same as in Table 3.
Indicators for Genetic Diversity of Microbial and Benthic Communities
The genetic structure of a population (MSFD criteria 1.3, and indicator 1.3.2) was the least covered of the MSFD D1—biological diversity indicator requirements (Table 1; Teixeira et al., 2014). This highlights the need for new developments addressing the genetic component of biodiversity and introducing such new methods to marine monitoring programmes. Emerging assessment tools based on molecular techniques have received strong attention from the scientific community (Bourlat et al., 2013), which might increase their potential for contributing to assessments of GES.
Genetic diversity is an aspect of biodiversity that has recently gained increased attention, but operational indicators addressing genetic structure of the populations are still scarce. Instead of using traditional sampling, taxonomic data can be obtained using a DNA metabarcoding technique. Microbial indicators were identified as one of the gaps and, consequently, further work to advance bacterial community indicators using nucleic acid microarrays was initiated in DEVOTES. Microbial abundance and biodiversity variables are relevant for several MSFD descriptors i.e., D1 Biodiversity, D4 Food webs, and also D5 Eutrophication (Caruso et al., 2015). Specifically, MSFD indicators 1.2.1 (Population abundance and/or biomass, as appropriate), and 1.3.1 (Population demographic characteristics (e.g., body size or age class structure, sex ratio, fecundity rates, survival/mortality rates), and 1.3.2 (Population genetic structure, where appropriate) were targeted in the development work.
Micro-organisms present in the sediments were also included in the analysis addressing the MSFD indicator 6.2.1. Presence of particularly sensitive and/or tolerant species; in addition to D1 indicators. The microbial sediment indicator followed the approach of gAMBI (genetic AMBI; Aylagas et al., 2014, 2016), and scored quite high in the fitness as an operational indicator, particularly on ecosystem relevance, concreteness, early warning capacity, and cost efficiency (Figure 1).
The AMBI indicator for benthic invertebrates (Borja et al., 2000) was modified by applying simultaneous amplification of a standardized DNA fragment from the total DNA extracted from an environmental sample (gAMBI). This allows the rapid, accurate and cost-effective identification of the entire taxonomic composition of thousands of samples simultaneously (Aylagas et al., 2014, 2016). Such DNA data do not provide accurate estimations about the abundance of the taxa in a certain sample, so current use is restricted to presence/absence estimations. Nonetheless, a high proportion of the taxa visually identified can be detected using the DNA metabarcoding technique. The benthic gAMBI indicator scored also high in the evaluation of the indicator fitness (Figure 1).
Habitats of Key Species as Indicators of Biodiversity on Ecosystem Level Functions
Vegetated marine areas, such as seagrass meadows and kelp forests, are important habitats for a wide diversity of algae, invertebrates and fish (Steneck et al., 2002, Schmidt et al., 2011, Boström et al., 2014, Sheaves et al., 2015, Thormar et al., 2016) including economically important fish such as cod (Lilley and Unsworth, 2014). The vegetation stimulates biodiversity by being a habitat-forming ecosystem component, hugely increasing the colonizable area while also providing shelter and food for a wealth of organisms.
In turn, the organisms of the habitat exert a feed-back effect on the meadows and their functioning. Hence, the presence of fish exerts an import role in contributing to maintaining healthy vegetated ecosystems via top-down control of nuisance algae (Baden et al., 2012). The extent and biomass of sea grass meadows may also couple with the abundance of waterfowl in terms of bottom-up as well as top-down effects, thereby showing an additional link to biodiversity. Accordingly, Berg et al. (2016) propose that “the idea of an indicator is that extended eelgrass cover/biomass in combination with large populations of foraging birds reflects good environmental status” which “requires a suitable balance between bottom up control of eelgrass meadows on bird populations and top-down control of the birds on eelgrass meadows.” Testing of the relationships between eelgrass cover/biomass and the abundance of herbivorous waterfowl was carried out in order to develop a new indicator “Distribution of herbivorous waterfowl in relation to eelgrass biomass distribution” (Berg et al., 2016). This indicator is relevant for several GES criteria, D1 (biodiversity) and D4 (food webs), 1.1. Species and 1.4. Habitat distribution; and 4.3. Abundance/distribution of key trophic groups/species. The indicator scored relatively high (Figure 1), and thus it is considered as a promising indicator for MSFD. On this basis we suggest that indicators describing habitat extent and biomass of key stone species may serve as indicators of biodiversity both on habitat as well as on species level and concurrently enabling coupling with other biological components, and providing proxies also for ecosystem level of structural and functional biodiversity indicators.
Moreover, one of the commonly used macrophyte indicators is the Lower Depth distribution Limit of Macrophytes (LDLM), which indicates the distribution and abundance of habitat forming macrophyte species. This indicator informs about the following MSFD criteria 1.1. Species, and 1.4. Habitat distribution, as well as 5.3. Indirect effects of nutrient enrichment, particularly the indicator 5.3.2. abundance of perennial seaweeds and seagrasses adversely impacted by decrease in water transparency. In DEVOTES, the target setting of the LDLM indicator for a perennial red alga species, Furcellaria lumbricalis was refined and harmonized (Table 3).
A promising tool to characterize and map marine habitats is to use multibeam echosounders on vessels (systematic high resolution habitat characterization) which provide high resolution and georeferenced technology and allow continuous and direct mapping of biogenic reef-forming species (e.g., Harris and Baker, 2011). This methodology can be used to derive operational indicators for many MSFD biodiversity indicators under the criteria 1.5 Habitat extent, and (1.6) condition, as well as 1.7 Ecosystem structure, 1.7.1. Composition and relative proportions of ecosystem components (habitats and species) (Berg et al., 2016).
Non-indigenous Species Indicators (D2)
One of the identified gaps in all regional seas was the lack of indicators for measuring the ecological impact of non-indigenous species in the marine ecosystems. The early detection of invasive species, using eDNA and metabarcoding was addressed by Ardura et al. (2015) and Zaiko et al. (2015). The abundance and distribution range (ADR), a semi-quantitative characteristic of the extension of a non-indigenous species population within the biopollution assessment framework (Olenin et al., 2007), can be used as measure of the bioinvasion impact. It was tested on the zebra mussel studying ecosystem-level impacts (Minchin and Zaiko, 2013; Zaiko et al., 2014) and the results showed that ADR of zebra mussels generally corresponded with the overall impact score and might be indicative of the particular invasion phase (establishment, expansion, outbreak, accommodation). ADR could thus serve as a proxy for the overall magnitude of impact of the species. Since data on species abundance and distribution can be retrieved from the regular biodiversity monitoring records, delivering ADR is a cost-effective solution for environmental status assessment. Determining the cumulative impact of invasive non-indigenous species is another approach toward assessing their role in biodiversity. The recently developed Cumulative IMPact index of Invasive ALien Species (CIMPAL) uses a spatially explicit conservative additive model based on the distributions of invasive species and ecosystems, including the reported magnitude of ecological impacts and the strength of such evidence (Katsanevakis et al., 2016).
Indicators for Food Webs (D4)
Productivity of key species on trophic groups
Indicators for phytoplankton primary production (PP), provide information on the vigor of an ecosystem (energy fluxes and ability to recover from disturbance) and thus health of the pelagic ecosystem (Tett et al., 2007). Phytoplankton photosynthesis produces organic matter which is then utilized by organisms at higher trophic levels and provides the base on the pelagic food web. There are currently different methods adopted for measuring PP (e.g., oxygen evolution, 14C method, PAM fluorometers, models, remote sensing). Traditional methods for measuring PP (e.g., 14C method) are reliable but time-consuming, expensive and localized. Other methods (e.g., remote sensing, models) can investigate a wider area but require validation or may have limited applicability to certain water types. Time series of annual gross primary production (AGPP) at different ecohydrodynamic regions of the North Sea (based on van Leeuwen et al., 2015) were calculated using an empirical model (Cloern, 1987) from measurements of chlorophyll (proxy of phytoplankton biomass), light attenuation coefficient (Kd), and surface irradiance. Currently there is no on-going monitoring that would provide data for AGPP indicator calculation and target setting, thus the indicator had a medium score (Figure 1), and it requires further development to be operational.
Phytoplankton blooms in coastal and open marine waters are characterized by high temporal and spatial fluctuations. Therefore remote sensing and continuous fluorometric measurements are promising tools to detect and measure phytoplankton phenomena in the surface layers of marine waters (e.g., Kutser, 2009; Kahru and Elmgren, 2014; Cristina et al., 2015). The phytoplankton biomass assessment method based on surface chlorophyll-a concentration measurements using cost-effective remote sensing data (Gohin, 2011a,b; Novoa et al., 2011; Cristina et al., 2015), builds on the indicator assessment approach developed for in situ samples (Revilla et al., 2009) and gained a high score in the indicator evaluation matrix (Figure 1).
The joint use of remote sensing biomass observations and ship-of-opportunity fluorescence measurements are a powerful combination to detect changes both in the phytoplankton biomass and composition. Remote sensing, bio-optics, microscopy, and CHEMTAX results provide a combination of analytical tools that can be used to develop a phytoplankton biomass (chlorophyll a) index for marine and coastal waters off the Iberian peninsula, in Portugal (Gohin, 2011b; Cristina et al., 2015, 2016a,b; Goela et al., 2015).
Proportion of selected species at the top of food-webs: fish and elasmobranch indicators
A number of promising indicators that capture the effects of fishing on marine biodiversity has been tested (Fu et al., 2015; Lynam and Mackinson, 2015; Coll et al., 2016). Fishing targets particular species and through the inherent selectivity of the fishing gears, often regulated by mesh size restrictions, larger individuals of populations are preferentially caught. So community level indicators that focus on changes in abundance (Kleisner et al., 2015), species composition (such as the mean maximum length of fish and elasmobranchs), trophic level (Shannon et al., 2014), or the relative biomass across a size spectrum (Engelhard et al., 2015; Thorpe et al., 2016) of fish and elasmobranch assemblages can respond strongly to direct fishing pressure. DEVOTES also developed an indicator of size composition in fish and elasmobranch communities (Berg et al., 2016), the biomass weighted geometric mean length of fish, known as Typical Length (ICES, 2014) since changes in size structure has been shown to represent change in trophic level (Jennings et al., 2007).
Shannon et al. (2014) made a comparison of the performance of trophic level (TL) indicators to demonstrate fishing impacts in 9 marine ecosystems and showed that the information content of these indicators differed depending on the data source, the previous changes in state and the historical development of fishing in the system. Catch-based TL indicators calculated using landings statistics represent the pressure on the system, while survey based TL indicators show unbiased state changes at the surveyed community level. In order to gain a complete picture of the wider effects of fishing on food web structure, complementary model derived TL indicators can be examined. While a meta-analysis of the 9 ecosystems revealed a significant pattern of low TL (for either catch-, survey,- or model-based indicators) under high fishing mortality, the relationship varied greatly at the level of the single ecosystem (some positive and negative relationships in addition to non-significant relationships). To understand why a particular trajectory in TL occurred in any single ecosystem, a good knowledge of changes in fisheries management and environmental change specific to the system is necessary.
Kleisner et al. (2015) tested the “Non-Declining Exploited Species” (NDES) indicator across 22 marine ecosystems, where the indicator is the proportion of species with survey catch-rates that have a positive monotonic temporal trend assessed with a significance test determined using a distributional test for the community given the length of time series data available (see Lynam et al., 2010). The authors conclude that the indicator can provide a valuable and relatively easy-to-understand measure of change in the ecosystem. The authors compared their evaluation of changes within ecosystems by the NDES to similar evaluations using community indicators derived from survey data (i.e., the proportion of predatory fish, mean trophic level, and mean life span; see Coll et al., 2016). In many, but not all cases, a decline in NDES was mirrored by the community metrics. In other cases, fishing pressure was found to be impacting only part of the community and this was not reflected well in the overall community metrics. Thus, the scale of fishing impacts on the ecosystem and thus the responsiveness of community metrics to pressure are dependent on the level of fishing pressure relative to other drivers including natural environmental change as shown by Fu et al. (2015). Similarly, spatial patterns in indicators and their response to drivers are often evident. Engelhard et al. (2015) demonstrated that the Large Fish Indicator of the demersal fish and elasmobranch community has responded to decreases in fishing pressure in those parts of the North Sea where demersal fishing effort was once high but the response was not uniform across the area. This study along with Marshall et al. (2016) demonstrates that that the strength of different drivers of fish community structure varies across the North Sea. As a result, the outcomes of management measures are likely to vary in different localities.
Abundance/distribution of key trophic groups/species
Phytoplankton community composition. Phytoplankton community composition can be used as an indicator for food web structure as well as being an early warning indicator for subsequent effects on the food web. Food web indicators are an important part of biodiversity assessment because the food web delivers energy to all trophic levels thus sustaining the biodiversity components, and chl-a alone is not an applicable indicator for the dynamic processes in food webs. To this end, a phytoplankton community composition index was developed (Suikkanen et al., 2013). The application to areas in the Baltic Sea revealed that late summer communities in the Gulf of Finland, the Åland Sea, and the northern Baltic proper have shifted toward more microbial, less energy-efficient food webs consisting of more mixotrophic and lower food-quality phytoplankton. This may lead to a decreased availability of energy for herbivorous zooplankton and planktivorous fish, despite an observed increase in chl-a and phytoplankton biodiversity. The food web indicator “Phytoplankton community composition as a food web indicator” scored high in the indicator quality evaluation and is currently a candidate indicator for HELCOM holistic ecosystem assessment (Lehtinen et al., 2015).
Novel indicators focusing on the role and impact of N2-fixing cyanobacteria in the pelagic food web were also considered. Cyanobacterial nitrogen is efficiently assimilated and transferred in Baltic food webs (Karlson et al., 2015). On the other hand, high abundance of cyanobacteria may harm the copepod reproduction and exert negatively on the food web (Engström-Öst et al., 2015). However, the tested indicators did not show a clear and coherent response to pressures, and scored low in ranking of the potential indicators (Figure 1).
Also phytoplankton community composition based on food quality traits could potentially be used as an early warning indicator for food web effects on higher trophic levels, as the quality of different phytoplankton taxa as food source for higher trophic levels varies (e.g., Danielsdottir et al., 2007). The same idea was also behind the indicator based on diatom/dinoflagellate ratio that has implications for zooplankton community composition and further in the food web. The different functional properties of diatoms and dinoflagellates have an influence on the fate of the organic matter produced and thus have consequences for the overall biogeochemical cycles (e.g., Klais et al., 2011). Diatoms and dinoflagellates are proposed as a life form indicator in the OSPAR area (Gowen et al., 2011), considered as a supplementary indicator in the Baltic Sea (HELCOM, 2012a,b; Klais et al., 2011), and in the Black Sea (Sahin et al., 2007).
Revision of other existing indicators for phytoplankton diversity were also considered and developed further where feasible. The Shannon95 indicator (Uusitalo et al., 2013) and phytoplankton taxonomic evenness, that has been shown to correlate with the resource use efficiency and stability of the community (Ptacnik et al., 2008), were tested but did not show a clear and coherent response to pressures. The indicator on seasonal succession patterns of phytoplankton groups (Devlin et al., 2009), describes the normal or established seasonal succession patterns of phytoplankton groups and suggests that major deviations from this pattern indicate impairment of environmental status. However, sufficiently frequent sampling is seldom available through monitoring programmes.
Zooplankton community composition
Zooplankton has a crucial role in the pelagic food web, as it transfers energy from phytoplankton to higher trophic levels (Checkley et al., 2009), and changes in the zooplankton community's abundance and composition are related to the functioning of the aquatic ecosystem (Jeppesen et al., 2011). Changes in the eutrophication status of aquatic systems impacts composition of zooplankton community (Gliwiz, 1969; Pace, 1986), and the growth of planktivorous fish is regulated by composition and biomass of the mesozooplankton that they feed upon (Cardinale et al., 2002; Rajasilta et al., 2014). A number of zooplankton indicators have been proposed to assess the status and functioning of marine food webs (Teixeira et al., 2014; Berg et al., 2016).
Long-term monitoring of mesozooplankton composition has been conducted in the Baltic Sea as well as in the Black sea, and based on these data, zooplankton metrics have been proposed as indicators of environmental status both in the Baltic (HELCOM, 2012b) and in the Black Sea (Bulgarian Initial Assessment report, 2013, and Black Sea Commission zooplankton expertise group).
Biomass of mesozooplankton includes information of major key groups, forming the structure of the planktonic fauna, particularly the groups Copepoda, Cladocera, Meroplankton, and the species Oikopleura dioica and Parasagitta setosa. Copepods are present all year round and distributed within the coastal, shelf, and open sea habitats. They are a key group of mesozooplankton that reflects the food availability for zooplanktivorous fish (particularly sprat and anchovy, partly horse mackerel). Mesozooplankton community composition is indirectly impacted by eutrophication (via changes in primary productivity and phytoplankton community composition), whereas climatic changes, predation, introduction of synthetic compounds (from point sources), and predation of invasive species, result in direct impacts. Relatively high copepod biomass implies food availability for fish and consequently is considered to represent good status of the food web structure (D4 criterion 4.3.1 abundance trends of functionally important selected groups/species).
The response of the zooplankton indicators with respect environmental variables was tested using Signal Detection Theory (SDT; Murtaugh, 1996). Phytoplankton total biomass and chl-a values were used as “Golden Standard” meaning that the indicator was considered to represent good status when these metrics were in good status. Zooplankton indicators received relatively low grading using the quality criteria ranking. Zooplankton is patchily distributed and seasonal variations in biomass and species structure result in a large variation in the data. Therefore the failure to detect a response to pressure patterns might partly be a problem in the different spatial and temporal scales of zooplankton and pressure data.
Approaches for Setting Thresholds/Targets for the Biodiversity Indicators
Indicator boundaries (thresholds) or target values are necessary to decide whether management action is required. A numeric definition for GES, i.e., the GES boundaries, can be defined by several alternative approaches (HELCOM, 2012a): (a) as an“acceptable” deviation from a reference condition (i.e., reference conditions representing natural conditions with minimal impact of anthropogenic pressures, that is the EU WFD approach), (b) as an “acceptable” deviation from a fixed reference point (i.e., fixed or depending on other variables), (c) as an “acceptable” deviation from a desired hypothetical condition (e.g., based on models), (d) as a threshold derived from ecological or physiological models (e.g., carrying capacity of a system, critical depth for photosynthesis, etc.), (e) as temporal trends, or tipping points (e.g., an analysis for changes in status), and (f) as biological effects on the condition of an organism (e.g., thresholds for contamination effects).
In the Baltic Sea, HELCOM has coordinated development of core indicators, which also included setting up the GES boundaries. In practice, the core indicators' GES boundary is not only a single threshold but can be a range (with a lower and upper thresholds), a direction of a trend, or based on a class-scale. Also it appeared to be practical to apply several approaches in parallel, when setting GES boundaries for the HELCOM core indicators (HELCOM, 2013). The trend-based targets are heavily debated, as they do not address whether the status is GES or not, but only show the direction. An alternative to this could be a class-scale assessment, which could be given under high uncertainty of more definite GES threshold. This has not, however, yet been applied to any of the core indicators in practice.
SDT was tested for setting the threshold values for indicators (Chuševė et al., 2016). SDT was applied to the “Benthic quality index” (BQI; Rosenberg et al., 2004) in order to check its accuracy, sensitivity and specificity. In general, the SDT was found to be a robust and scientifically sound approach to set boundaries for indicator values, and to be helpful for planning environmental monitoring.
Finally, a new approach to address the target setting of the indicators in relation to ecosystem resilience (i.e., the ability to recover rapidly and predictably from pressures) and to select indicators and their target ranges has been introduced (Rossberg et al., 2017). The idea is to simply choose the target range for any ecosystem state indicator as the range of values from where, when all pressures were hypothetically removed, the mean time to reach the indicator's natural range of variation was no longer than the “acceptable recovery time R,” which is a societal choice. Based on examples, an acceptable recovery time was settled to 30 years. Where this criterion was applied, Rossberg et al. (2017) showed that this definition naturally leads to (1) related criteria for pressure indicators, and (2) selection criteria for important indicators among a range of candidates and for suites of indicators.
This approach implies that it is not always necessary that the targets of MSFD indicators aim at restoring natural or near-natural ecosystem states. Deviations from natural states are acceptable if recovery to natural states is not too slow. It is acknowledged that some ecosystem components are naturally much less resilient than others; and therefore the focus is paced on indicator-based assessments of these low-resilience components that recover slowly after pressures have been removed or decreased. Rossberg et al. (2017) then argued that state indicators and pressure indicators should always be used jointly in assessments of sustainable use, because due to the slow recovery of low-resilience ecosystem components, there is no immediate relationship between states and pressures. If an ecosystem component recovers quickly after the relaxation of pressures, there is little concern that it might be used unsustainably. The approach by Rossberg et al. (2017) aims to define status boundaries that ensures sustainable use of ecosystem services. It is therefore focused primarily on protecting the interests of future generations. Moreover, the status assessments (within these boundaries) should be complemented by considerations of their suitability for current societal needs. They recommend that these two kinds of assessment, and management decisions based on these, should be carried out by separate management bodies to avoid potential conflicts of interest.
Discussion
Indicator Development and Gaps Addressed
The new developments and refined indicators by DEVOTES addressed some of the gaps identified with respect to the MSFD criteria and indicators in different marine regions where possible. In addition, DEVOTES indicator development focused on those biological components and habitats where monitoring data and the expertise in the DEVOTES research consortia were available.
Some of the indicators developed and refined were already established indicators, meaning that those are applied in the management frameworks such as EcoQO indicators (i.e., the OSPAR System of Ecological Quality Objectives—EcoQO—for the North Sea), or in the national MSFD monitoring of the EU member states (Table 3). However, many of the new indicators (such as new genetic indicators for microbes) are not yet used in the marine assessments meaning that those need to be tested in different marine regions and approved by the national and regional managers to be part of the MSFD monitoring and assessment programmes. Many of the NIS indicators were evaluated as relevant for MSFD, but those are not yet included in the marine monitoring programmes. Most of the fish and macrozoobenthic indicators developed and refined are used for food web and benthic integrity and biodiversity assessments being more mature for assessment purposes, while many of the phytoplankton and zooplankton indicators were judged not to be particularly useful for MSFD purposes, besides the new indicator on Phytoplankton food quality traits, that is currently considered as a candidate for a HELCOM core indicator.
Two of the identified gaps were the absence of indicators for biodiversity on a genetic level (Descriptor 1, criteria 1.3. Genetic structure of populations) as well as the lack of indicators for microbial communities. A DNA metabarcoding technique was applied to develop indicators to assess both microbial communities (Berg et al., 2016) and benthic invertebrate biodiversity (Aylagas et al., 2014, 2016). Genetic methods such as nucleic acid microarrays were considered a suitable methodology to quickly determine diversity and abundance of microbial communities (DeSantis et al., 2007). Marine prokaryotes respond rapidly to environmental changes and anthropogenic pressures and are thus considered as useful components for the assessment of microbial biodiversity, and impacts of eutrophication and toxic substances (Caruso et al., 2015). When the genetic methods were applied to identify microbial and benthic organisms in already established and tested indicator methodologies such AMBI (Borja et al., 2000), they appeared to provide a cost-effective and robust methodology for biodiversity assessment. Development of genetic tools is expanding rapidly and more effort on benchmarking and standardization will be needed to enable the use of genetic tools in biodiversity assessments in the future (Aylagas et al., 2016).
We also developed indicators to assess habitats of key species as indicators of biodiversity on ecosystem functions. Keystone species, such as species of seagrasses, kelps, and intertidal algae are recognized as effective ecosystem engineers forming vegetated habitats with multiple ecosystem functions including the stimulation of biodiversity (Gutiérrez et al., 2011) and the mitigation of climate change (Duarte et al., 2013). As increasing human pressures on coastal ecosystems threaten the continued supply of essential functions and services, the protection of marine vegetated habitats should be a management priority (Duarte et al., 2013). The high number of indicators available for vegetated habitats (Table 1) suggests that this is already well recognized and that these indicators (such as lower depth limit of macrophytes) are used in practice in marine assessments for policy purposes. In a recent review on seagrass indicators globally, Roca et al. (2016) carried out a meta-analysis and compared the applicability of different types of seagrass indicators to detect environmental improvement. They concluded that physiological and biochemical indicators are more suitable due their fast response to changes of environmental stressors than structural indicators (e.g., shoot density or biomass). Moreover, there is global and local evidence that biodiversity and top–down control strongly influences the functioning of threatened vegetated ecosystems, and indication that biodiversity is comparably important to global change stressors (Duffy et al., 2015; Matheson et al., 2016). Therefore key stone species prove well suited as operational indicators of biodiversity at the levels of species, habitat and ecosystems.
One of the major global threats to marine biodiversity is the spreading of invasive NIS (Costello et al., 2010). There are a number of regulations for controlling NIS, including the MSFD that aim to restrict the spreading of new NIS (Ojaveer et al., 2014). However, the intrinsic complexity of NIS for being detected on time implies the need to provide early warning indicators for tracking potential vectors of invasions as well as to assess the impacts of NIS on native species, habitats, and ecosystems. Therefore, DEVOTES developed and refined indicators to assess the impacts of invasive species which can be used to identify vulnerable areas, environmental targets and to prioritize management actions.
The MSFD also calls for indicators that address the deviations from the normal structure and functioning of the marine food webs. Such indicators would reflect distortions in the top-down control or bottom-up regulation of the food webs. The cascading impacts of top-down control reach into all trophic levels of food webs. As an example, removal of large predatory species can cause a relief on lower trophic levels causing increase on zooplanktivorous fish and thus, change composition and biomass zooplankton communities. Likewise, the bottom-up regulation based on the changes in the phytoplankton composition and quality of algae as a food source for zooplankton can change productivity and species composition of zooplankton impacting the fish communities. D4, food web, was identified to have relatively few indicators (Table 1), and DEVOTES developed and refined indicators that can be used to assess different aspects of food web structure and functioning, such as the abundance and distribution of fish indicators, productivity of key trophic groups (phytoplankton primary production) and phytoplankton composition as food web indicator providing an indication of the palatability of phytoplankton for zooplankton.
Some of the indicators developed or refined in the DEVOTES project were evaluated to show poor responsiveness to pressures (Table 3, Figure 1). Nevertheless, we suggest maintaining these ecologically relevant indicators in the assessment suites, particularly if they are collected on the side of other monitoring programmes and the monitoring would not be very costly. They could then be used as surveillance indicators and applied to complement the indicators with clear pressure-state links (ICES, 2014). Some factors used in the assessment of marine ecosystem health do not have a very clear pressure-state relationship (ICES, 2014). Many foodweb components are simultaneously affected by multiple pressures and processes, showing response to cumulative and synergistic effects, and singling out the effect of any one of those may be impossible. These surveillance indicators would be supplementary and provide information of the overall “health status” of the ecosystem even in the absence of clear pressure-state relationships.
Despite the current work to supplement the indicator suite already included in the DEVOTool catalog, important gaps still remain; many of the biological components and habitats are not adequately monitored to allow development and testing of potential indicators. Reptiles, such as the European sea turtles, Caretta caretta, Chelonia mydas, and Lepidochelys kempii, are all either endangered or vulnerable species (IUCN Red List), and thus require conservation measures through marine protected areas. There are specific regional or local programmes for sea turtle protection (such as Sea Turtle Protection Society of Greece ARCHELON) that provide information of the status of local populations and advocate conservation measures. Likewise, Cephalopods represent a group of species with only few existing indicators included in the DEVOTool Indicator Catalog. A recent ICES report on Cephalopod biology and fisheries stated: “[Despite the importance of several species for European fisheries, there is limited management of the fisheries and no routine assessment; data collection is often either not part of routine fishery data collection or the data are inadequate for assessment. Increasingly, however, cephalopods are seen as alternative target species to replace overexploited finfish stocks, and the growing fishing effort means that management will almost certainly be needed within the next few years. Also on the horizon is the development of commercial aquaculture].” (Jereb et al., 2015).
One of the major oceanic ecosystems lacking indicators is the deep-sea habitats and their respective communities (Teixeira et al., 2014). The deep pelagic ocean and deep seabed ecosystems represent the largest biomes of the global biosphere, but still the knowledge of their biodiversity, habitats and processes is scarce (Webb et al., 2010; Danovaro et al., 2014). The deep-sea physical, biogeochemical and ecological processes present distinctive features from other marine ecosystems (Danovaro et al., 2014; Thurber et al., 2014), and the specific habitats or ecosystems host very specific communities (Danovaro et al., 2010). Also many deep-sea invertebrates are exceptionally long-lived and grow extremely slowly (Clark et al., 2016). Current evidence indicates that cumulative stressors from e.g., fishing and resource exploitation will cause important and largely unpredictable ecological changes in these biotopes (Gramling, 2014; Clark et al., 2016). Removal of habitat-forming species, decline in diversity, change in abundance and biomass, reduction in distribution, change in community structure, namely its composition and food web structure are a few of the expected impacts (Clark et al., 2016). Climate change will further expose these already vulnerable ecosystems to combined stresses of warming, ocean acidification, deoxygenation, and effects of altered food inputs (Levin and Le Bris, 2015; Rogers, 2015). Due to the attributes mentioned, the recovery capacity of these deep-sea ecosystems is highly limited and predicted to take much more time to recover after pressures have ceased (Clark et al., 2016). Specific metrics of sensitivity of deep-sea fauna and habitats are therefore urgently needed for assessing the risk stemming from impacts and for identifying vulnerable ecological units (Clark et al., 2016). Baselines need to be established for diversity, abundance, and biomass of deep-sea ecosystems, particularly for the less studied pelagic realm and an understanding of ecological processes needs to be developed (Danovaro et al., 2014; Rogers, 2015). Such indicators will allow prioritizing areas for protection and designing more efficient monitoring programmes for the deep-sea realm.
There were not any indicators for the sea ice habitats, as these represent quite marginal habitat in the European regional seas. In the Polar Regions, sea ice habitats are important for the productivity of the sea and harbor rich biological communities and food webs associated with those (see Thomas and Dieckmann, 2010, for further references). Due to the climate change and warming of the Polar Regions, the extension of the seasonal, and permanent ice cover is shrinking with an alarming pace (Dieckmann and Hellmer, 2010). In the Baltic Sea, the seasonal ice cover is mostly restricted to the northern parts, and similarly as in the Arctic regions, it is an important habitat with rich community of ice-associated algae and micro-organisms as well as migrating birds, and as a primary breeding ground for the two seal species (Granskog et al., 2006). Climate change is projected to change further the biology and ecology of the Baltic Sea, including the diminishing duration and extent of the sea ice cover with its consequences to the ice associated biota (Viitasalo, 2012). However, due to the lack of monitoring and indicators for the sea ice habitat and biota, it is not possible to assess their impacts on biodiversity status in the ice-covered sub-basins of the Baltic Sea.
Linking to Other Indicator Based Assessments of Biodiversity
The conservation initiatives worldwide often share common assessment elements and make use of similar baseline information (e.g., Duffy et al., 2013; Pereira et al., 2013). Versatile use of indictors across environmental policies, geographical regions, and spatial scales is apparent as many of methods and biodiversity indicators are applied in several assessment or monitoring programmes (Teixeira et al., 2014). Approximately 30% of the indicators suggested to be applied for MSFD were already used for assessment needs of the other EU Directives or regulations (e.g., Birds and Habitat Directives, Water Framework Directive or Common Fisheries Policy). The need to economize marine monitoring, but yet maintain and enhance operational monitoring networks (Borja and Elliott, 2013) can benefit from careful planning of interoperable monitoring and assessment where the same indicators could be used for several purposes, and combined depending on the needs of each respective assessment purpose.
There are indicators used for MSFD assessments targeting threatened marine species included in the IUCN Red List, as well as several MSFD indicators miming the candidate metrics to Essential Biodiversity Variables proposed by Pereira et al. (2013, e.g., Abundances and distributions, Taxonomic diversity, Habitat structure, Allelic diversity). Also the nine Essential Ocean Variables (EOVs) on Biology and Ecosystem health of marine ecosystems under discussion can benefit from operational indicators included in the DEVOTool Catalog (Teixeira et al., 2014) or those refined and developed by DEVOTES (GOOS, 2016). These relate to the “Status of functional groups” and the “Health of living ecosystems” (Phytoplankton biomass and productivity, Incidence of harmful algal blooms, Zooplankton diversity, Fish distribution and abundance, Apex predator distribution and abundance, Seagrass cover, Macroalgal cover, Live coral cover, Mangrove cover). The wider use of environmental indicators applicable for various marine EU legislation and international agreements such as the RSC or the CBD (Zampoukas et al., 2012; Pereira et al., 2013) promotes harmonization between the different assessment systems and allows effective use of monitoring data for different reporting purposes, provided that the indicators satisfy specific quality criteria (Tittensor et al., 2014; Queiros et al., 2016) that should be common for all programmes.
European status assessments of marine biodiversity have chosen an ambitious path, where data-driven indicators with numeric thresholds should be used to depict definite status classifications. Moreover, the purpose is to link indicators to anthropogenic pressures and further to the human activities. Comparison with the assessment approaches in the marine and coastal areas of the United States (U.S.) shows that there is a conceptual difference, which is mainly due to the different understanding of the indicator concept and approaches for setting the assessment thresholds. A general trend in the U.S. assessments is to give scores for different indicators (or assessment questions) and the scoring is based on descriptive definitions. For instance, the National Oceanographic and Atmospheric Administration (NOAA) Marine Sanctuary Programme1 makes status assessments based on expert analysis. The experts make the status interpretation based on 17 questions and the descriptions of status classes which are elaborated on the basis of monitoring data. Similarly, the NOAA fish stock assessments2 and the Sea Turtle Assessment (National Marine Fisheries Service, 2013) are based on four criteria scored by experts and guided by information from the monitoring data. The National Estuarine Eutrophication Assessment (Bricker et al., 2007) uses quantitative thresholds for some eutrophication symptoms (e.g., percentage change in vegetation coverage) but the class boundaries are defined qualitatively using expert knowledge. The NOAA Marine Mammal Assessment (Carretta et al., 2015) is based on monitoring data but the assessment is descriptive, no specific status class is given, and the state of the populations is determined based on the viability analysis of the population. The U.S. National Park Service3 assesses the country's intertidal zone within protected areas based on expert interpretation of data variability and trends. The indicators in the U.S. Environmental Protection Agency (EPA) National Coastal Condition Report (US EPA, 2012) are closest to the European indicator concept, containing some biodiversity aspects, similar to EU MSFD, and using numerical indicator thresholds to define status classes. Due to the relatively strong European consensus on the indicator concept, the US indicators would not likely be applicable in the MSFD context. Though being used successfully in the US-wide assessments such as the National Coastal Condition Report, the US indicators do not have similar marine assessment framework as in the EU which aims at covering all marine elements, regions and pressures in a coherent and coordinated way.
Further Research Needs, and Way Forward
The EU MSFD depicts a cyclical implementation and the next assessment of the environmental status of the marine environment is planned to be completed in 2018. Thus, the EU member states and RSCs are currently on the way in planning this assessment. Based on the experiences from the previous MSFD initial assessment (completed in 2012), the EU Commission is on its way to revise the earlier Commission Decision (2010/477/EU) to advice the on-going initial (MSFD Article 8) assessment that is due to 2018. Different aspects of biodiversity will be in the focus of the assessment, as the ecosystem services provided by the living part of the marine ecosystems are strongly dependent on structural and functional status of biodiversity. Monitoring and managing the health of the seas and oceans is highly relevant for the sustainable use of the marine resources particularly in the light of the recent Blue Growth initiatives is Europe (EU's Blue Growth Strategy4) and worldwide (e.g., FAO's Blue Growth Initiative5) that emphasize the sustainable use of marine resources, but with the expectation that more seafood, energy, and other living and non-living resources can be extracted from the seas. Full ecosystem approach, with concise cover of the marine ecosystem components, is needed for the managers to evaluate that Blue Growth is carried out sustainably, i.e., not threatening the future potential of delivering marine living resources and ecosystem services.
There is a need to have a comprehensive set of indicators, in order to cover all important multifaceted components of marine biodiversity assessments; ideally including both surveillance indicators and those with a clear pressure-state link. Some of the remaining gaps and further specific research needs are presented in Table 2. Further development and validation of marine biodiversity indicators requires improved data with better spatial and temporal coverage based on novel monitoring methods. In addition to the tests carried out in the DEVOTES project, more experimental indicator testing is needed to ensure their ecological relevance, robustness, and responsiveness to pressures, and also to enable incorporation into models in order to extrapolate marine assessments for into larger spatial regimes and temporal scales. With the help of combination of different tools, indicators covering both early warming and long-term assessment needs across different spatial scales can be combined into a holistic assessment of marine environment.
Conclusions
Despite the large number of indicators available for the assessment of marine biodiversity there are needs for further development in order to ensure (1) full ecosystem approach (covering all components of marine ecosystem, and all levels of marine biodiversity), (2) improved indicator confidence and responsiveness to pressures, and (3) consistent approach and methodology for setting thresholds for environmental status assessment. DEVOTool provides a comprehensive state-of-the-art compilation of biodiversity related indicators developed for assessment of coastal and marine ecosystems in Europe and elsewhere. This tool is publicly available for marine managers, experts, and NGOs to rank, evaluate, and choose biodiversity related indicators and to find those that fit best to the needs of the regional and local environmental assessments in Europe and worldwide. There is a relatively concise set of indicators for the second phase of the MSFD implementation, however, some important areas like the deep sea habitats, and trophic levels of marine food webs (e.g., microbes) or taxonomic groups (i.e., reptiles) have fewer indicators operational. Moreover, an assessment of ecosystem processes and functions, i.e., the overall status of ecosystem functioning is an area that requires attention in order to understand interrelations between various ecosystem components and how those impact each other under changing anthropogenic manageable and non-manageable external pressures.
Author Contributions
Conceived and designed the paper: AH, TB, LU. Data was analyzed by HT, AB, AH. All authors participated in the interpretation of the data, reviewing the literature, and drafting the paper. Final approval of the version to be published: AH.
Funding
This manuscript is a result of DEVOTES (DEVelopment Of innovative Tools for understanding marine biodiversity and assessing good Environmental Status) project, funded by the European Union under the 7th Framework Programme, “The Ocean of Tomorrow” Theme (grant agreement no. 308392), www.devotes-project.eu. MCU is partially funded through the Spanish programme for Talent and Employability in R+D+I “Torres Quevedo”).
Conflict of Interest Statement
The authors declare that the research was conducted in the absence of any commercial or financial relationships that could be construed as a potential conflict of interest.
The reviewer IM declared a shared affiliation, though no other collaboration, with the authors MY and AB to the handling Editor, who ensured that the process nevertheless met the standards of a fair and objective review.
Acknowledgments
We wish to thank the participants of the DEVOTES work package on biodiversity indicator development Eva Aylagas (AZTI), T.J.S. Balsby (AU), Martynas Bučas (Kucorpi), Elisa Capuzzo (Cefas), Jacob Carstensen (AU), Anne Chenuil (CNRS), P Clausen (AU), Valentina Doncheva (IO-BAS), Isabel Ferrera (CSIC), Esther Garcés (CSIC), Heidi Hällfors (SYKE), Pirkko Kauppila (SYKE), Harri Kuosa (SYKE), Sirpa Lehtinen (SYKE), Maiju Lehtiniemi (SYKE), Sergej Olenin (Kucorpi), Snejana Moncheva (IO-BAS), Nadia Papadopoulou (HCMR), Albert Reñé (CSIC), Naiara Rodríguez-Ezpeleta (AZTI), Kremena Stefanova (IO-BAS), Sanna Suikkanen (SYKE), Anastasija Zaiko (Kucorpi), Argyro Zenetos (HCMR). Helpful comments of the two referees are gratefully acknowledged.
Supplementary Material
The Supplementary Material for this article can be found online at: https://www.frontiersin.org/article/10.3389/fmars.2016.00184
Footnotes
1. ^http://sanctuaries.noaa.gov/science/monitoring/welcome.html
2. ^http://www.st.nmfs.noaa.gov/stock-assessment/reports
3. ^http://science.nature.nps.gov/im/units/nccn/monitor/intertidal.cfm
References
Ardura, A., Zaiko, A., Martinez, J. L., Samulioviene, A., Semenova, A., and Garcia-Vazquez, E. (2015). eDNA and specific primers for early detection of invasive species – A case study on the bivalve Rangia cuneata, currently spreading in Europe. Mar. Environ. Res. 112(Pt B), 48–55. doi: 10.1016/j.marenvres.2015.09.013
Aylagas, E., Borja, A., Irigoien, X., and Rodriguez-Ezpeleta, N. (2016). Benchmarking DNA metabarcoding for biodiversity-based monitoring and assessment. Front. Mar. Sci. 3:96. doi: 10.3389/fmars.2016.00096
Aylagas, E., Borja, A., and Rodríguez-Ezpeleta, N. (2014). Environmental status assessment using dna metabarcoding: towards a genetics Based Marine Biotic Index (gAMBI). PLoS ONE 9:e90529. doi: 10.1371/journal.pone.0090529
Baden, S., Emanuelsson, A., Pihl, L., Svensson, C. J., and Åberg, P. (2012). Shift in seagrass food web structure over decades is linked to overfishing. Mar. Ecol. Prog. Ser. 451, 61–73. doi: 10.3354/meps09585
Beaumont, N. J., Austen, M. C., Atkins, J. P., Burdon, D., Degraer, S., van Ierland, E., et al. (2007). Identification, definition and quantification of goods and services provided by marine biodiversity: implications for the ecosystem approach. Mar. Pollut. Bull. 54, 253–265. doi: 10.1016/j.marpolbul.2006.12.003
Bennett, E. M., Cramer, W., Begossi, A., Cundill, G., Díaz, S., Egoh, B., et al. (2015). Linking biodiversity, ecosystem services, and human well-being: three challenges for designing research for sustainability. Curr. Opin. Environ. Sustain. 14, 76–85. doi: 10.1016/j.cosust.2015.03.007
Berg, T., Balsby, T. J. S., Borja, A., Bučas, M., Capuzzo, E., Carstensen, J., et al. (2016). Report on the New Indicators and Methods for Setting Reference and Target Values Deliverable 3.3, 263. DEVOTES FP7 Project. Available online at: http://www.devotes-project.eu/
Berg, T., Fürhaupter, K., Teixeira, H., Uusitalo, L., and Zampoukas, N. (2015). The Marine Strategy Framework Directive and the ecosystem approach - pitfalls and solutions. Mar. Pollut. Bull. 96, 18–28. doi: 10.1016/j.marpolbul.2015.04.050
Borja, A., and Elliott, M. (2013). Marine monitoring during an economic crisis: the cure is worse than the disease. Mar. Pollut. Bull. 68, 1–3. doi: 10.1016/j.marpolbul.2013.01.041
Borja, A., Elliott, M., Andersen, J. H., Berg, T., Carstensen, J., Rodriguez-Ezpeleta, N., et al. (2016). Overview of integrative assessment of marine systems: the ecosystem approach in practice. Front. Mar. Sci. 3:26. doi: 10.1016/j.marpolbul.2010.09.026
Borja, Á., Elliott, M., Carstensen, J., Heiskanen, A. S., and van de Bund, W. (2010). Marine management - Towards an integrated implementation of the European Marine Strategy Framework and the Water Framework Directives. Mar. Pollut. Bull. 60, 2175–2186. doi: 10.1016/j.marpolbul.2010.09.026
Borja, A., Franco, J., and Pérez, V. (2000). A marine biotic index to establish the ecological quality of soft-bottom benthos within European estuarine and coastal environments. Mar. Pollut. Bull. 40, 1100–1114. doi: 10.1016/S0025-326X(00)00061-8
Borja, Á., Marín, S., Muxika, I., Pino, L., and Rodríguez, J. G. (2015). Is there a possibility of ranking benthic quality assessment indices to select the most responsive to different human pressures? Mar. Pollut. Bull. 97, 85–94. doi: 10.1016/j.marpolbul.2015.06.030
Boström, C., Baden, S., Bockelmann, A. C., Dromph, K., Fredriksen, S., Gustafsson, C., et al. (2014). Distribution, structure and function of Nordic seagrass ecosystems: implications for coastal management and conservation. Aquat. Conserv. 24, 410–434. doi: 10.1002/aqc.2424
Bourlat, S. J., Borja, A., Gilbert, J., Taylor, M. I., Davies, N., Weisberg, S. B., et al. (2013). Genomics in marine monitoring: new opportunities for assessing marine health status. Mar. Pollut. Bull. 74, 19–31. doi: 10.1016/j.marpolbul.2013.05.042
Bricker, S., Longstaff, B., Dennison, W., Jones, A., Boicourt, K., Wicks, C., et al. (2007). Effects of Nutrient Enrichment In the Nation's Estuaries: A Decade of Change. NOAA Coastal Ocean Program Decision Analysis Series No. 26. National Centers for Coastal Ocean Science, Silver Spring, MD, 328.
Cardinale, M., Casini, M., and Arrhenius, F. (2002). The influence of biotic and abiotic factors on the growth of sprat (Sprattus sprattus) in the Baltic Sea. Aquat. Living Resour. 15, 273–281. doi: 10.1016/s0990-7440(02)01188-9
Carretta, J. V., Oleson, E. M., Weller, D. W., Lang, A. R., Forney, K. A., Baker, J., et al. (2015). U.S. Pacific Marine Mammal Stock Assessments: 2014. U.S. Department of Commerce, NOAA Technical Memorandum, NOAA-TMNMFS-SWFSC-549, 414.
Caruso, G., La Ferla, R., Azzaro, M., Zoppini, A., Marino, G., Petochi, T., et al. (2015). Microbial assemblages for environmental quality assessment: Knowledge, gaps and usefulness in the European Marine Strategy Framework Directive. Crit. Rev. Microbiol. 42, 883–904. doi: 10.3109/1040841X.2015.1087380
Checkley, D., Alheit, J., Oozeki, Y., and Roy, C. (2009). Climate Change and Small Pelagic Fish. Cambridge: Cambridge University Press.
Chuševė, R., Nygård, H., Vaičiūtė, D., Daunys, D., and Zaiko, A. (2016). Application of signal detection theory approach for setting thresholds in benthic quality assessments. Ecol. Indic. 60, 420–427. doi: 10.1016/j.ecolind.2015.07.018
Clark, M. R., Althaus, F., Schlacher, T. A., Williams, A., Bowden, D. A., and Rowden, A. A. (2016). The impacts of deep-sea fisheries on benthic communities: a review. ICES J. Mar. Sci. 73, i51–i69. doi: 10.1093/icesjms/fsv123
Cloern, J. E. (1987). Turbidity as a control on phytoplankton biomass and productivity in estuaries. Cont. Shelf Res. 7, 1367–1381. doi: 10.1016/0278-4343(87)90042-2
Cochrane, S. K. J., Connor, D. W., Nilsson, P., Mitchell, I., Reker, J., Franco, J., et al. (2010). Marine Strategy Framework Directive – Task Group 1 Report Biological Diversity. EUR 24337 EN – Joint Research Centre, Office for Official Publications of the European Communities. doi: 10.2788/86653
Coll, M., Shannon, L. J., Kleisner, K. M., Juan-Jordá, M. J., Bundy, A., Shin, Y. J., et al. (2016). Ecological indicators to capture the effects of fishing on biodiversity and conservation status of marine ecosystems. Ecol. Indic. 60, 947–962. doi: 10.1016/j.ecolind.2015.08.048
Costello, M. J., Coll, M., Danovaro, R., Halpin, P., Ojaveer, H., and Miloslavich, P. (2010). A census of marine biodiversity knowledge, resources, and future challenges. PLoS ONE 5:e12110. doi: 10.1371/journal.pone.0012110
Cristina, S., Cordeiro, C., Lavender, S., Costa Goela, P., Icely, J., and Newton, A. (2016a). MERIS phytoplankton time series products from the SW Iberian Peninsula (Sagres) using seasonal-trend decomposition based on loess. Remote Sens. 8:449. doi: 10.3390/rs8060449
Cristina, S., D'Alimonte, D., Costa Goela, P., Kajiyama, T., Icely, J., Moore, G., et al. (2016b). Standard and regional bio-optical algorithms for chlorophyll a estimates in the atlantic off the Southwestern Iberian Peninsula. IEEE Geosci. Remote Sens. Lett. 13, 757–761. doi: 10.1109/LGRS.2016.2529182
Cristina, S., Icely, J., Goela, P. C., DelValls, T. A., and Newton, A. (2015). Using remote sensing as a support to the implementation of the European Marine Strategy Framework Directive in SW Portugal. Cont. Shelf Res. 108, 169–177. doi: 10.1016/j.csr.2015.03.011
Danielsdottir, G. M., Brett, M. T., and Arhonditsis, G. B. (2007). Phytoplankton food quality control of planktonic food web processes. Hydrobiologia 589, 29–41. doi: 10.1007/s10750-007-0714-6
Danovaro, R., Corinaldesi, C., D'Onghia, G., Galil, B., Gambi, C., Gooday, A. J., et al. (2010). Deep-sea biodiversity in the Mediterranean Sea: the known, the unknown, and the unknowable. PLoS ONE 5:e11832. doi: 10.1371/journal.pone.0011832
Danovaro, R., Snelgrove, P. V., and Tyler, P. (2014). Challenging the paradigms of deep-sea ecology. Trends Ecol. Evol. 29, 465–475. doi: 10.1016/j.tree.2014.06.002
DeSantis, T. Z., Brodie, E. L., Moberg, J. P., Zubieta, I. X., Piceno, Y. M., and Andersen, G. L. (2007). High-density universal 16S rRNA microarray analysis reveals broader diversity than typical clone library when sampling the environment. Microb. Ecol. 53, 371–383. doi: 10.1007/s00248-006-9134-9
Devlin, M., Barry, J., Painting, S., and Best, M. (2009). Extending the phytoplankton tool kit for the UK Water Framework Directive: indicators of phytoplankton community structure. Hydrobiologia 633, 151–168. doi: 10.1007/s10750-009-9879-5
Dieckmann, G. S., and Hellmer, H. H. (2010). “An importance of sea ice: an overview,” in Sea Ice, eds D. N. Thomas and G. S. Dieckmann, (Chichester: John Wiley & Sons), 1–22.
Duarte, C. M., Losada, I. J., Hendriks, I. E., Mazarrasa, I., and Marbà, N. (2013). The role of coastal plant communities for climate change mitigation and adaptation. Nat. Clim. Change 3, 961–968. doi: 10.1038/nclimate1970
Duffy, J. E., Amaral-zettler, L. A., Fautin, D. G., Paulay, G., Rynearson, T. A., Sosik, H. M., et al. (2013). Envisioning a marine biodiversity observation network. Bioscience 63, 350–361. doi: 10.1525/bio.2013.63.5.8
Duffy, J. E., Reynolds, P. L., Boström, C., Coyer, J. A., Cusson, M., Donadi, S., et al. (2015). Biodiversity mediates top–down control in eelgrass ecosystems: a global comparative-experimental approach. Ecol. Lett. 18, 696–705. doi: 10.1111/ele.12448
Engelhard, G. H., Lynam, C. P., Garcia-Carreras, B., Dolder, P., and MacKinson, S. (2015). Effort reduction and the large fish indicator: spatial trends reveal positive impacts of recent European fleet reduction schemes. Environ. Conserv. 42, 227–236. doi: 10.1017/S0376892915000077
Engström-Öst, J., Brutemark, A., Vehmaa, A., Motwani, N. H., and Katajisto, T. J. (2015). Consequences of a cyanobacteria bloom for copepod reproduction, mortality and sex ratio. J. Plankton Res. 37, 388–398. doi: 10.1093/plankt/fbv004
Fu, C., Large, S., Knight, B., Richardson, A. J., Bundy, A., Reygondeau, G., et al. (2015). Relationships among fisheries exploitation, environmental conditions, and ecological indicators across a series of marine ecosystems. J. Mar. Syst. 148, 101–111. doi: 10.1016/j.jmarsys.2015.01.004
Gliwiz, Z. M. (1969). Studies on the feeding of pelagic zooplankton in lakes with varying trophy. Ekol. Polska 1, 663–708.
Goela, P. C., Icely, J., Cristina, S., Danchenko, S., Angel DelValls, T., and Newton, A. (2015). Using bio-optical parameters as a tool for detecting changes in the phytoplankton community (SW Portugal). Estuar. Coast. Shelf Sci. 167(Pt A), 125–137. doi: 10.1016/j.ecss.2015.07.037
Gohin, F. (2011a). Annual cycles of chlorophyll-a, non-algal suspended particulate matter, and turbidity observed from space and in-situ in coastal waters. Ocean Sci. 7, 705–732. doi: 10.5194/os-7-705-2011
Gohin, F. (2011b). Joint use of satellite and in-situ data for coastal monitoring. Ocean Sci. Discuss. 8, 955–998. doi: 10.5194/osd-8-955-2011
GOOS (2016). GOOS Biology and Ecosystems Expert Panel: April 2016, 6. Available online at: https://www.cbd.int/doc/meetings/mar/mcbom-2016-01/information/mcbom-2016-01-inf-05-en.pdf
Gowen, R. J., McQuatters-Gollop, A., Tett, P., Best, M., Bresnan, E., Castellani, C., et al. (2011). The Development of UK Pelagic (Plankton) Indicators and Targets for the MSFD. A Report of a workshop held at AFBI, Belfast.
Gramling, C. (2014). Seafloor mining plan advances, worrying critics. Science 344:463. doi: 10.1126/science.344.6183.463
Granskog, M., Kaartokallio, H., Kuosa, H., Thomas, D. N., and Vainio, J. (2006). Sea ice in the Baltic Sea – a review. Estuar. Coast. Shelf Sci. 70, 145–160. doi: 10.1016/j.ecss.2006.06.001
Gutiérrez, J. L., Jones, C. G., Byers, J. E., Arkema, K. K., Berkenbusch, K., Commito, J. A., et al. (2011). Physical ecosystem engineers and the functioning of estuaries and coasts. Treat. Estaur. Coast. Sci. 7, 53–81. doi: 10.1016/B978-0-12-374711-2.00705-1
Harris, P. T., and Baker, E. K. (Eds.). (2011). Seafloor Geomorphology as Benthic Habitat: GeoHab Atlas of Seafloor Geomorphic Features and Benthic Habitats. London: Elsevier.
Heiskanen, A. S., van de Bund, W., Cardoso, A. C., and Nöges, P. (2004). Towards good ecological status of surface waters in Europe -interpretation and harmonisation of the concept. Water Sci. Technol. 49, 169–177. Available online at: http://wst.iwaponline.com/content/49/7/169
HELCOM (2012a). “Development of a set of core indicators: interim report of the HELCOM CORESET project. PART A. Description of the selection process,” in Baltic Sea Environment Proceedings No. 129A (Helsinki).
HELCOM (2012b). “Development of a set of core indicators: interim report of the HELCOM CORESET project. PART B: Descriptions of the indicators,” in Baltic Sea Environment Proceedings No. 129B (Helsinki).
HELCOM (2013). “HELCOM core indicators: final report of the HELCOM CORESET project,” in Baltic Sea Environment Proceedings No. 136 (Helsinki).
HELCOM (2016). Status of development of HELCOM core indicators. HELCOM Working Group on the State of the Environment and Nature Conservation, Schwerin, Germany, 11–15. Available online at: http://www.helcom.fi/baltic-sea-trends/biodiversity/
Hummel, H., Frost, M., Juanes, J. A., Kochmann, J., Castellanos Perez Bolde, C. F., Aneiros, F., et al. (2015). A comparison of the degree of implementation of marine biodiversity indicators by European countries in relation to the Marine Strategy Framework Directive (MSFD). J. Mar. Biol. Assoc. U.K. 95, 1519–1531. doi: 10.1017/S0025315415000235
ICES (2014). Report of the Working Group on the Ecosystem Effects of Fishing Activities (WGECO). ICES Document CM 2014/ACOM:26, Copenhagen. Available online at: http://tinyurl.com/p8vwu7d
Jennings, S., De Oliveira, J., and Warr, K. J. (2007). Measurement of body size and abundance in tests of macroecological and food web theory. J. Anim. Ecol. 76, 72–82. doi: 10.1111/j.1365-2656.2006.01180.x
Jeppesen, E., Noges, P., Davidson, T. A., Haberman, J., Noges, T., Blank, K., et al. (2011). Zooplankton as indicators in lakes: a scientific-based plea for including zooplankton in the ecological quality assessment of lakes according to the European Water Framework Directive (WFD). Hydrobiologia 676, 279–297. doi: 10.1007/s10750-011-0831-0
Jereb, P., Allcock, A. L., Lefkaditou, E., Piatkowski, U., Hastie, L. C., and Pierce, G. J. (Eds.). (2015). Cephalopod Biology and Fisheries in Europe: II. Species Accounts. ICES Cooperative Research Report No. 325, 360.
Kahru, M., and Elmgren, R. (2014). Multidecadal time series of satellite-detected accumulations of cyanobacteria in the Baltic Sea. Biogeosciences 11, 3619–3633. doi: 10.5194/bg-11-3619-2014
Kappel, C. V. (2005). Losing pieces of the puzzle: threats to marine, estuarine, and diadromous species. Front. Ecol. Environ. 3:275–282. doi: 10.1890/1540-9295(2005)003[0275:LPOTPT]2.0.CO;2
Karlson, A. M. L., Duberg, J., Motwani, N. H., Hogfors, H., Klawonn, I., Ploug, H., et al. (2015). Nitrogen fixation by cyanobacteria stimulates production in Baltic food webs. Ambio 44(Suppl. 3), 413–426. doi: 10.1007/s13280-015-0660-x
Katsanevakis, S., Tempera, F., and Teixeira, H. (2016). Mapping the impact of alien species on marine ecosystems: the Mediterranean Sea case study. Divers. Distrib. 22, 694–707. doi: 10.1111/ddi.12429
Klais, R., Tamminen, T., Kremp, A., Spilling, K., and Olli, K. (2011). Decadal-scale changes of dinoflagellates and diatoms in the anomalous Baltic sea spring bloom. PLoS ONE 6:e21567. doi: 10.1371/journal.pone.0021567
Kleisner, K. M., Coll, M., Lyman, C. P., Bundy, A., Shannon, L., Shin, Y.-J., et al. (2015). Evaluating changes in marine communities that provide ecosystem services through comparative assessments of community indicators. Ecosyst. Serv. 16, 413–429. doi: 10.1016/j.ecoser.2015.02.002
Kutser, T. (2009). Passive optical remote sensing of cyanobacteria and other intense phytoplankton blooms in coastal and inland waters. Int. J. Remote Sens. 17, 4401–4425. doi: 10.1080/01431160802562305
Lehtinen, S., Hällfors, H., Kauppila, P., Kuosa, H., Lehtiniemi, M., Suikkanen, S., et al. (2015). Phytoplankton Community Composition in Relation to the Pelagic Food Web in the Open Northern Baltic sea. HELCOM Baltic Sea Environment Fact Sheets. Available Online at: http://www.helcom.fi/baltic-sea-trends/environment-fact-sheets/
Levin, L. A., and Le Bris, N. (2015). The deep ocean under climate change. Science 350, 766–768. doi: 10.1126/science.aad0126
Lilley, R. J., and Unsworth, R. K. F. (2014). Atlantic Cod (Gadus morhua) benefits from the availability of seagrass (Zostera marina) nursery habitat. Glob. Ecol. Conserv. 2, 367–377. doi: 10.1016/j.gecco.2014.10.002
Liquete, C., Cid, N., Lanzanova, D., Grizzetti, B., and Reynaud, A. (2016). Perspectives on the link between ecosystem services and biodiversity: the assessment of the nursery function. Ecol. Indic. 63, 249–257. doi: 10.1016/j.ecolind.2015.11.058
Lynam, C. P., and Mackinson, S. (2015). How will fisheries management measures contribute towards the attainment of Good Environmental Status for the North Sea ecosystem? Glob. Ecol. Conserv. 4, 160–175. doi: 10.1016/j.gecco.2015.06.005
Lynam, C. P., Cusack, C., and Stokes, D. (2010). A methodology for community level hypothesis testing applied to detect trends in phytoplankton and fish communities in Irish waters. Estuar. Coast. Shelf Sci. 87, 451–462. doi: 10.1016/j.ecss.2010.01.019
Marshall, A. M., Grant, G. R., van Leeuwen, S. M., Pinnegar, J. K., Wei, H.-L., Webb, T. J., et al. (2016). Quantifying heterogeneous responses of fish community size structure using novel combined statistical techniques. Glob. Change Biol. 22, 1755–1768. doi: 10.1111/gcb.13190
Matheson, K., McKenzie, C. H., Gregory, R. S., Robichaud, D. A., Bradbury, I. R., Snelgrove, P. V. R., et al. (2016). Linking eelgrass decline and impacts on associated fish communities to European green crab Carcinus maenas invasion. Mar. Ecol. Prog. Ser. 548, 31–45. doi: 10.3354/meps11674
Minchin, D., and Zaiko, A. (2013). “Variability of the zebra mussel (Dreissena polymorpha) impacts in the Shannon River system,” in Quagga and Zebra Mussels: Biology, Impacts and Control, 2nd Edn, eds T. Nalepa and D. Schlosser (Boca Raton, FL; New York, NY; London: CRC Press Taylor & Francis Group), 587–597.
Murtaugh, P. A. (1996). The statistical evaluation of ecological indicators. Ecol. Appl. 6, 132–139. doi: 10.2307/2269559
Narayanaswamy, B. E., Coll, M., Danovaro, R., Davidson, K., Ojaveer, H., and Renaud, P. E. (2013). Synthesis of knowledge on marine biodiversity in european seas: from census to sustainable management. PLoS ONE 8:e58909. doi: 10.1371/journal.pone.0058909
National Marine Fisheries Service (2013) Sea Turtle Assessment Status and Research Needs. NOAA Technical Memorandum NMFS-F/SPO-131.
Nentwig, W., Bacher, S., Pyšek, P., Vilà, M., and Kumschick, S. (2016). The generic impact scoring system (GISS): a standardized tool to quantify the impacts of alien species. Environ. Monit. Assess. 188, 1–13. doi: 10.1007/s10661-016-5321-4
Novoa, S., Chust, G., Valencia, V., Froidefond, J. M., and Morichon, D. (2011). Estimation of chlorophyll-a concentration in waters over the continental shelf of the Bay of Biscay: a comparison of remote sensing algorithms. Int. J. Remote Sens. 32, 8349–8371. doi: 10.1080/01431161.2010.540588
Ojaveer, H., Galil, B., Minchin, D., Olenin, S., Amorim, A., Canning-Clode, J., et al. (2014). Ten recommendations for advancing the assessment and management of non-indigenous species in marine ecosystems. Mar. Pollut. 44, 160–165. doi: 10.1016/j.marpol.2013.08.019
Olenin, S., Alemany, F., Cardoso, A. C., Gollasch, S., Goulletquer, P., Lehtiniemi, M., et al. (2010). Marine Strategy Framework Directive Task Group 2 Report Non-indigenous Species. EUR 24342 EN. Joint Research Centre, Office for Official Publications of the European Communities. doi: 10.2788/87092
Olenin, S., Minchin, D., and Daunys, D. (2007). Assessment of biopollution in aquatic ecosystems. Mar. Pollut. Bull. 55, 379–394. doi: 10.1016/j.marpolbul.2007.01.010
OSPAR (2016). Structure of the Intermediate Assessment 2017. Available online at: http://www.ospar.org/work-areas/cross-cutting-issues/intermediate-assessment-2017-resources
Pace, M. L. (1986). An empirical analysis of zooplankton community size structure across lake trophic gradients. Limnol. Oceanogr. 31, 45–55. doi: 10.4319/lo.1986.31.1.0045
Palialexis, A., Tornero, V., Barbone, E., Gonzalez, D., Hanke, G., Cardoso, A. C., et al. (2014). In-Depth Assessment of the EU Member States' Submissions for the Marine Framework Strategy Framework Directive under Articles 8, 9 and 10 JRC Scientific and Technical Reports. Publications Office of the European Union.
Palumbi, S. R., Sandifer, P. A., Allan, J. D., Beck, M. W., Fautin, D. G., Fogarty, M. J., et al. (2009). Managing for ocean biodiversity to sustain marine ecosystem services. Front. Ecol. Environ. 7, 204–211. doi: 10.1890/070135
Pereira, H. M., Ferrier, S., Walters, M., Geller, G. N., Jongman, R. H. G., Scholes, R. J., et al. (2013). Essential biodiversity variables. Science 339, 277–278. doi: 10.1126/science.1229931
Perus, J., Bonsdorff, E., Bäck, S., Lax, H. G., Villnäs, A., and Westberg, V. (2007). Zoobenthos as indicators of ecological status in coastal brackish waters: a comparative study from the Baltic Sea. Ambio 36, 250–256. doi: 10.1579/0044-7447(2007)36[250:ZAIOES]2.0.CO;2
Pittman, S. J., Christensen, J. D., Caldow, C., Menza, C., and Monaco, M. E. (2007). Predictive mapping of fish species richness across shallow-water seascapes in the Caribbean. Ecol. Modell. 204, 9–21. doi: 10.1016/j.ecolmodel.2006.12.017
Ptacnik, R., Solimini, A. G., Andersen, T., Tamminen, T., Brettum, P., Lepistö, L., et al. (2008). Diversity predicts stability and resource use efficiency in natural phytoplankton communities. Proc. Natl. Acad. Sci. U.S.A. 105, 5134–5138. doi: 10.1073/pnas.0708328105
Queiros, A. M., Strong, J. A., Mazik, K., Carstensen, J., Bruun, J., Somerfield, P. J., et al. (2016). An objective framework to test the quality of candidate indicators of good environmental status. Front. Mar. Sci. 3:73. doi: 10.3389/fmars.2016.00073
Rabitsch, W., Genovesi, P., Scalera, R., Biała, K., Josefsson, M., and Essl, F. (2016). Developing and testing alien species indicators for Europe. J. Nat. Conserv. 29, 89–96. doi: 10.1016/j.jnc.2015.12.001
Rajasilta, M., Hänninen, J., and Vuorinen, I. (2014). Decreasing salinity improves the feeding conditions of the Baltic herring (Clupea harengus membras) during spring in the Bothnian Sea, northern Baltic. ICES J. Mar. Sci. 71, 1148–1152. doi: 10.1093/icesjms/fsu047
Reker, J., de Carvalho Belchior, C., and Royo Gelabert, E. (2015). State of Europe's Seas. EEA Report, 2.
Revilla, M., Franco, J., Bald, J., Borja, A., Laza, A., Seoane, S., et al. (2009). Assessment of the phytoplankton ecological status in the Basque coast (northern Spain) according to the European Water Framework Directive. J. Sea Res. 61, 60–67. doi: 10.1016/j.seares.2008.05.009
Rice, J., Arvanitidis, C., Borja, A., Frid, C., Hiddink, J. G., Krause, J., et al. (2012). Indicators for sea-floor integrity under the european marine strategy framework directive. Ecol. Indic. 12, 174–184. doi: 10.1016/j.ecolind.2011.03.021
Roca, G., Alcoverro, T., Krause-Jensen, D., Balsby, T. J. S., Katwijk, M., van Marbà, N., et al. (2016). Response of seagrass indicators to shifts in environmental stressors: a global review and management synthesis. Ecol. Indic. 63, 310–323. doi: 10.1016/j.ecolind.2015.12.007
Rogers, A. D. (2015). Environmental change in the deep ocean. Annu. Rev. Environ. Resour. 40, 1–38. doi: 10.1146/annurev-environ-102014-021415
Rosenberg, R., Blomqvist, M., Nilsson, H. C., Cederwall, H., and Dimming, A. (2004). Marine quality assessment by use of benthic species-abundance distributions: a proposed new protocol within the European Union Water Framework Directive. Mar. Pollut. Bull. 49, 728–739. doi: 10.1016/j.marpolbul.2004.05.013
Rossberg, A. G., Uusitalo, L., Berg, T., Zaiko, A., Chenuil, A., Uyarra, M. C., et al. (2017). Quantitative criteria for choosing targets and indicators for sustainable use of ecosystems. Ecol. Indic. 72, 215–224. doi: 10.1016/j.ecolind.2016.08.005
Sahin, F., Bat, L., Ustun, F., Birinci Ozdemir, Z., Satilmis, H., Kideys, A., et al. (2007). The dinoflagellate-diatom ratio in the Southern Black sea off Sinop in 1999-2000. Rapp. Comm. Int. Mer. Médit. 38, 388.
Schmidt, A. L., Coll, M., Romanuk, T. N., and Lotze, H. K. (2011). Ecosystem structure and services in eelgrass Zostera marina and rockweed Ascophyllum nodosum habitats. Mar. Ecol. Progr. Ser. 437, 51–68. doi: 10.3354/meps09276
Shannon, L., Coll, M., Bundy, A., and Gascuel, D. others (2014). Trophic level-based indicators to track fishing impacts across marine ecosystems. Mar. Ecol. Prog. Ser. 512, 115–140. doi: 10.3354/meps10821
Sheaves, M., Baker, R., Nagelkerken, I., and Connolly, R. M. (2015). True value of estuarine and coastal nurseries for fish: incorporating complexity and dynamics. Estuar. Coasts 38, 401–414. doi: 10.1007/s12237-014-9846-x
Steneck, R. S., Graham, M. H., Bourq, B. J., Corbett, D., and Erlandson, J. M. (2002). Kelp forest ecosystems, biodiversity, stability resilience and future. Environ. Conserv. 29, 436–459. doi: 10.1017/S0376892902000322
Strong, J. A., Andonegi, E., Bizsel, K. C., Danovaro, R., Elliott, M., Franco, A., et al. (2015). Marine biodiversity and ecosystem function relationships: The potential for practical monitoring applications. Estuar. Coast. Shelf Sci. 161, 46–64. doi: 10.1016/j.ecss.2015.04.008
Suikkanen, S., Pulina, S., Engström-Öst, J., Lehtiniemi, M., Lehtinen, S., and Brutemark, A. (2013). Climate change and eutrophication induced shifts in Northern Summer plankton communities. PLOS ONE 8:e66475. doi: 10.1371/journal.pone.0066475
Teixeira, H., Berg, T., Fürhaupter, K., Uusitalo, L., Papadopoulou, N., Bizsel, K. C., et al. (2014). Existing Biodiversity, Non-Indigenous Species, Food-Web and Sea-Floor Integrity GES Indicators. Deliverable 3.1, 198pp + 2 Annexes. DEVOTES FP7 Project. Available online at: http://www.devotes-project.eu/
Tett, P., Gowen, R., Mills, D., Fernandes, T., Gilpin, L., Huxham, M., et al. (2007). Defining and detecting undesirable disturbance in the context of marine eutrophication. Mar. Pollut. Bull. 55, 282–297. doi: 10.1016/j.marpolbul.2006.08.028
Thormar, J., Hasler-Sheetal, H., Baden, S., Boström, C., Clausen, K. K., Krause-Jensen, D., et al. (2016). Eelgrass (Zostera marina) food web structure in different environmental settings. PLoS ONE 11:e0146479. doi: 10.1371/journal.pone.0146479
Thorpe, R. B., Dolder, P. J., Reeves, S., Robinson, P., and Jennings, S. (2016). Assessing fishery and ecological consequences of alternate management options for multispecies fisheries. ICES J. Mar. Sci. 73, 1503–1512. doi: 10.1093/icesjms/fsw028
Thurber, A. R., Sweetman, A. K., Narayanaswamy, B. E., Jones, D. O. B., Ingels, J., and Hansman, R. L. (2014). Ecosystem function and services provided by the deep sea. Biogeosciences 11, 3941–3963. doi: 10.5194/bg-11-3941-2014
Tittensor, D. P., Walpole, M., Hill, S. L. L., Boyce, D. G., Britten, G. L., Burgess, N. D., et al. (2014). A mid-term analysis of progress toward international biodiversity targets. Science 346, 241–244. doi: 10.1126/science.1257484
Uusitalo, L., Fleming-Lehtinen, V., Hällfors, H., Jaanus, A., Hällfors, S., and London, L. (2013). A novel approach for estimating phytoplankton biodiversity. ICES J. Mar. Sci. 70, 408–417. doi: 10.1093/icesjms/fss198
van Leeuwen, S., Tett, P., Mills, D., and van der Molen, J. (2015). Stratified and non-stratified areas in the North Sea: long-term variability and biological and policy implications. J. Geophys. Res. 120, 4670–4676. doi: 10.1002/2014JC010485
Venter, O., Brodeur, N. N., Nemiroff, L., Belland, B., Dolinsek, I. J., and Grant, J. W. A. (2006). Threats to endangered species in Canada. Bioscience 56, 903–910. doi: 10.1641/0006-3568(2006)56[903:TTESIC]2.0.CO;2
Viitasalo, M. (2012). “Impact of climate change on biology of the Baltic Sea,” in From the Earth's Core to Outer Space. Lecture notes in Earth Sciences, ed I. Haapala (Berlin/Heidelberg: Springer), 171–184.
Webb, T. J., Berghe, E. V., and O'Dor, R. (2010). Biodiversity's big wet secret: the global distribution of marine biological records reveals chronic under-exploration of the deep pelagic ocean. PLoS ONE 5:e10223. doi: 10.1371/journal.pone.0010223
Worm, B., Barbier, E. B., Beaumont, N., Duffy, J. E., Folke, C., Halpern, B. S., et al. (2006). Impacts of biodiversity loss on ocean ecosystem services. Science 314, 787–790. doi: 10.1126/science.1132294
Zaiko, A., Lehtiniemi, M., Narscius, A., and Olenin, S. (2011). Assessment of bioinvasion impacts on a regional scale: a comparative approach. Biol. Invasions 13, 1739–1765. doi: 10.1007/s10530-010-9928-z
Zaiko, A., Minchin, D., and Olenin, S. (2014). “The day after tomorrow”: anatomy of an ‘r’ strategist aquatic invasion. Aquat. Invasions 9, 145–155. doi: 10.3391/ai.2014.9.2.03
Keywords: indicators, food web, good environmental status, invasive species, pelagic ecosystem, benthic ecosystem, marine strategy framework directive
Citation: Heiskanen A-S, Berg T, Uusitalo L, Teixeira H, Bruhn A, Krause-Jensen D, Lynam CP, Rossberg AG, Korpinen S, Uyarra MC and Borja A (2016) Biodiversity in Marine Ecosystems—European Developments toward Robust Assessments. Front. Mar. Sci. 3:184. doi: 10.3389/fmars.2016.00184
Received: 20 June 2016; Accepted: 08 September 2016;
Published: 23 September 2016.
Edited by:
Michael Elliott, University of Hull, UKReviewed by:
Iñigo Muxika, AZTI-Tecnalia, SpainUrsula Scharler, University of KwaZulu-Natal, South Africa
Copyright © 2016 Heiskanen, Berg, Uusitalo, Teixeira, Bruhn, Krause-Jensen, Lynam, Rossberg, Korpinen, Uyarra and Borja. This is an open-access article distributed under the terms of the Creative Commons Attribution License (CC BY). The use, distribution or reproduction in other forums is permitted, provided the original author(s) or licensor are credited and that the original publication in this journal is cited, in accordance with accepted academic practice. No use, distribution or reproduction is permitted which does not comply with these terms.
*Correspondence: Anna-Stiina Heiskanen, anna-stiina.heiskanen@ymparisto.fi
†Present Address: Heliana Teixeira, Departamento de Biologia and CESAM, Universidade de Aveiro, Aveiro, Portugal;
Axel G. Rossberg, School of Biological and Chemical Sciences, Queen Mary University of London, London, UK