A Hard Day's Night: Diatoms Continue Recycling Photosystem II in the Dark
 Gang Li
 Amy D. Woroch1
  Amanda M. Cockshutt
 Douglas A. Campbell
- 1Chemistry and Biochemistry Department, Mount Allison University, Sackville, NB, Canada
- 2Key Laboratory of Tropical Marine Bio-resources and Ecology, South China Sea Institute of Oceanology, Chinese Academy of Sciences, Guangzhou, China
Marine diatoms are photosynthetic, and thrive in environments where light fluctuates. Like all oxygenic photosynthetic organisms diatoms face a light-dependent inactivation of the Photosystem II complexes that photooxidize water to generate biosynthetic reductant. To maintain photosynthesis this photoinactivation must be countered by slow and metabolically expensive protein turnover, which is light dependent in cyanobacteria and in plants. We tracked daily cycles of the content, synthesis and degradation of Photosystem II, in a small and in a large marine diatom, under low and high growth light levels. We show that, unlike plants, diatoms maintain extensive cycling of Photosystem II proteins even in the dark. Photosystem II protein cycling saturates at low light, and continued cycling in dark periods, using energy from respiration, allows the diatoms to catch up to excess photoinactivation accumulated over the preceding illuminated period. The large diatom suffers only limited photoinactivation of Photosystem II, but cycling of Photosystem II protein exceeds Photosystem II inactivation, so the large diatom recycles functional Photosystem II units before they are inactivated. Through the diel cycle the contents of active Photosystem II centers and Photosystem II proteins change predictably, but are not correlated, generating large changes in the fraction of total PSII that is active at a given time or growth condition. We propose that dark and steady cycling of Photosystem II proteins is driven by the tight integration of chloroplastic and mitochondrial metabolism in diatoms. This ability for baseline, continuous Photosystem II repair could contribute to the success of diatoms in mixed water environments that carry them from illumination to darkness and back.
Introduction
Marine diatoms are major oceanic primary producers (Field et al., 1998; Armbrust, 2009) with distinctive biooptical (Key et al., 2010) and metabolic (Armbrust, 2004; Allen et al., 2011; Hopkinson et al., 2011) characteristics, including tight metabolic coupling between their chloroplasts and mitochondria (Prihoda et al., 2012; Bailleul et al., 2015). Like all oxygenic photoautotrophs, diatoms use Photosystem II (PSII) to photooxidize water and generate the reductant that supports their biological productivity. PSII, however, suffers inactivation under illumination (Vass, 2011; Vinyard et al., 2013a,b), at a rate inversely proportional to diatom cell size (Key et al., 2010). This inactivation must be countered through an expensive protein repair cycle (Edelman and Mattoo, 2008; Nixon et al., 2010; Raven, 2011; Komenda et al., 2012) which shows a light-dependency in cyanobacteria and in green plants (Edelman and Mattoo, 2008; Komenda et al., 2012). Under low to moderate illumination the rate of PSII inactivation is a nearly linear function of light level (Tyystjärvi and Aro, 1996; Campbell and Tyystjärvi, 2012) even though at least two mechanisms (Oguchi et al., 2011; Vass, 2011; Tyystjärvi, 2013; Zavafer et al., 2015) drive photoinactivation. As in cyanobacteria (Nixon et al., 2010; Komenda et al., 2012) in marine centric diatoms this repair cycle is mediated by FtsH protease complexes (Campbell et al., 2013), but diatoms can accumulate significant pools of PSII repair cycle intermediates, even under moderate light conditions (Wu et al., 2011, 2012). These sub-pools of PSII components interact with complex regulation of excitation dissipation (Lavaud et al., 2007, 2016; Lavaud and Lepetit, 2013), within a physical context of triply stacked thylakoids (Gibbs, 1962; Drum, 1963; Lepetit et al., 2012) that are distinct from the thylakoid arrangements (Rast et al., 2015) in green (Baroli and Melis, 1996; Edelman and Mattoo, 2008) or cyanobacterial (Singh et al., 2008; Komenda et al., 2012) model species. PSII repair thus represents a significant (Li et al., 2015), light-dependent burden on protein metabolism in diatoms, like other photoautotrophs. Under variable light the instantaneous rate of PSII inactivation can outrun the repair rate, at the expense of drawdown of pools of reserve subunits (Wu et al., 2011, 2012; Lavaud et al., 2016) or pools of active PSII (PSIIactive) (Behrenfeld et al., 1998).
Given recent findings of ATP shuttling between mitochondria and chloroplasts (Prihoda et al., 2012; Bailleul et al., 2015) to drive CO2 fixation in diatoms, we hypothesized that dark repair of PSII, supported by respiration, could confer an advantage upon marine diatoms, which thrive in fluctuating light environments (MacIntyre et al., 2000; Lavaud et al., 2007). We thus measured pools of PSIIactive, and the degradation and synthesis rates of key PSII proteins across diel cycles (Chisholm and Costello, 1980) and growth light levels. We find that diatoms maintain an active cycling of PSII subunits during dark periods, and may indeed rely upon dark repair of PSII to balance cycles of inactivation and replacement of PSII.
Materials and Methods
Culture Protocol and Growth Rate
We cultured a small diatom Thalassiosira pseudonana (CCMP 1335, Provasoli-Guillard NCMA) and a larger diatom Thalassiosira punctigera (CCAP 1085/19, Provasoli-Guillard NCMA) semicontinuously in f/2 medium (Guillard and Ryther, 1962) in 2 L polycarbonate bottles (Nalgene, USA) at 18°C, under 75 or 300 μmol photons m−2 s−1 provided by fluorescent tubes (Sylvania) and measured with a microspherical quantum sensor (US-SQS, Waltz, Germany). During cultivation, culture bottles were manually shaken 2–3 times per day and arbitrarily distributed in a growth chamber. Light in the chamber started at 08:00 and stopped at 24:00 (16:8, L:D cycle), 16:00 (8:16 L:D cycle), or at 12:00 (4:20, L:D cycle). We grew 2 separate replicate cultures of each species under combinations of light and day length, for a total of 20 separate semi-continuous culture runs across the combinations of 3 diel cycles, 2 light levels, and 2 species.
To track growth of small T. pseudonana we measured fluorescence excited at 440 nm and emission at 650 nm (SpectraMax Gemini EM) at 10:00 every day, before and after dilutions with fresh media to keep Chla within 110–200 ng mL−1. To track the growth of larger T. punctigera we took duplicate 2 mL samples at 10:00, fixed in Lugol's acid solution, and then counted cells with a Sedgwick Rafter chamber under an inverted microscope. The cell suspension density for T. punctigera was maintained at 650–1100 cells mL−1, for Chla of 60–110 ng mL−1. Growth rate was estimated as:
where Nt is the culture fluorescence or cell number at time t; and N0 is the fluorescence or cell number at time 0. All cultures were grown through at least 15 transfers of semicontinuous dilution with fresh media under the given light level and L:D cycle, giving more than 12 cellular generations under the specified conditions before use for subsequent measurements. Growth rates for these cultures were published as part of another study (Li et al., 2016) on the effects of photoperiod and growth light upon growth rates.
Sampling Protocol
After more than 12 cellular generations of growth under a given condition we took 250 mL sub-samples from each replicate 2 L bottle for each L:D treatment at each growth light level, 2 h (06:00) and 0 h (08:00) before the light came on, and then again every 2 h within the illuminated period of 16, 8, or 4 h. To each 250 mL sub-culture we added a final concentration of 500 μg mL−1 lincomycin to inhibit chloroplast protein translation (Baroli and Melis, 1996; Key et al., 2010). After 900, 1800, 3600, and 7200 s we took 2 mL from the sub-culture flask for fluorescence measurements, and vacuum-filtered 50 mL of sub-culture onto a binder-free Whatman GF/F glass fiber filter (25 mm in diameter), which was immediately flash frozen in liquid nitrogen and stored at −80°C for later analyses of proteins and chlorophyll. We did the same measurements and samplings at 0 and 7200 s from the parent cultures in the 2 L bottle as controls in the absence of lincomycin. At each 0 or 7200 s time-point we mixed by gently shaking the 2 L bottle before taking duplicate 2 mL cultures which were fixed in Lugol's acid solution. We then measured the cell suspension density with a Coulter Z2 counter (Beckman Instruments, Florida, US) for T. pseudonana and with a Sedgwick Rafter chamber under an inverted microscope for T. punctigera.
Photosystem II Content and Turnover Determinations
At each time point we took 2 mL samples from each 2 L mother bottle or 250 mL lincomycin treatment flask, dark-adapted for 300 s within a cuvette with temperature control (18°C) and measured Fast Repetition and Relaxation chlorophyll fluorescence kinetics (Kolber et al., 1998) (FL 3600, Photon Systems Instruments, Czech Republic). We used a train of 40 × 1.2 μs flashlets of blue light (455 nm) that were applied over 128 μs to progressively close PSII reaction centers (Laney, 2003; Laney and Letelier, 2008). After 120 s of exposure to growth light we again measured the FRR fluorescence. We analyzed the resulting FRR induction curves with the PSIWORX script (A. Barnett, sourceforge.net) for MATLAB software and derived the base line fluorescence in dark- (F0) or growth-light-adapted cells (Fs), and the maximal fluorescence with (FM) and maximal fluorescence in the light-adapted state (FM'). We calculated the maximal photochemical yield in dark-adapted cells as:
Oxborough et al. (2012) and Silsbe et al. (2015) introduced F0'/σPSII' as a rapid measure of the pool of PSIIactive with calibration against slower oxygen flash yield measures of PSIIactive (Chow et al., 1989; Suggett et al., 2009; Murphy et al., 2016). This useful correlation, however, diverged after photoinhibition which causes a rise in F0' (Ware et al., 2015a,b) through an increase in the fluorescence yield of photoinactivated PSII. (Oxborough and Baker, 1997) derived an estimator of F0' that corrects for the influence of non-photochemical quenching on F0, and which excludes the cumulative influence of photoinactivation, herein termed F0'Oxborough. We therefore plotted F0'Oxborough/σPSII' vs. paired oxygen flash yield measures (Chow et al., 1989; Suggett et al., 2009) of fmol PSIIactive μg protein−1, measured on the same culture samples, and found a correlation robust in the face of accumulated photoinactivation of PSII, with or without the presence of lincomycin to block PSII repair (Murphy et al., 2016). We then used this calibrated fluorescence based measure, PSIIactivefluor, to track diel progressions (Figures 1A,C; Supplemental Figures 1A,C,E,G,I,K, 2A,C,E,G) of the cellular content of PSIIactive.
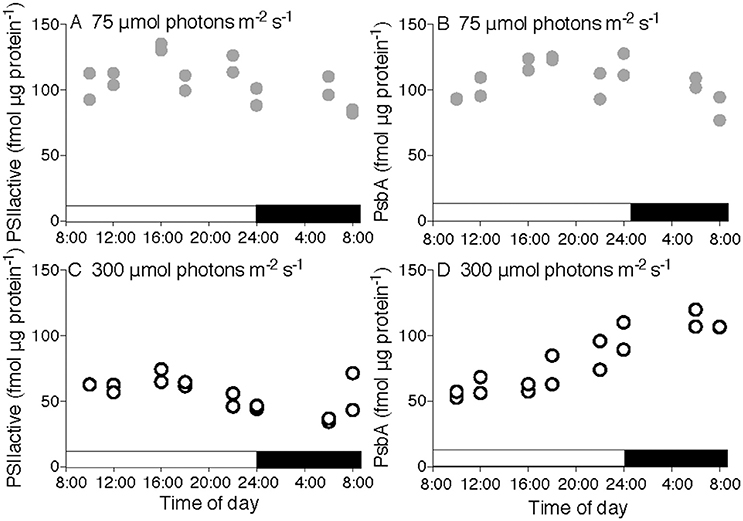
Figure 1. Diel progressions of content of Photosystem II for T. pseudonana. PSIIactivefluor (A,C) or PsbA protein content (B,D) vs. time of day for cultures growing under 75 (A,B) or 300 μmol photons m−2 s−1 (C,D) with a 16:8 L:D cycle indicated by horizontal bars along X axes. Points show determinations upon two separate cultures for each condition.
We extracted an exponential first order rate constant for PSII inactivation, kpi (Kok, 1956), as the exponential rate of decay of repeated measures of PSIIactivefluor over 7200 s incubations in the presence of lincomycin to block PSII repair (Supplemental Figures 1A,C,E,G,I,K, 2A,C,E,G, closed symbols). These rate constants for inactivation correlated well with kpiFV/FM (Supplemental Figure 3) calculated on the basis of changes in the fluorescence measure of the quantum yield of the PSII pool, FV/FM (Supplemental Figure 4) in the same samples. We also extracted an exponential first order rate constant for the activation of new PSIIactive, kpsii activation, relative to the starting pool of PSIIactive. This phenomenological rate constant expresses the cellular capacity to generate new PSIIactive. kpsii activation accommodates an increase in the total pool of PSIIactive through either growth or a change in protein allocation (Wu et al., 2012), and so is not arithmetically equivalent to ‘krec’ (Kok, 1956) which implicitly assumes a constant pool of PSIIactive, with recovery of PSIIactive only through recycling of existing PSII subunits.
Protein Content and Turnover Determinations
In parallel with our functional measures of PSIIactive we filtered and then flash froze 50 ml samples of culture for later immunoquantitation analyses (Brown et al., 2008) of the contents of PsbA (Figures 1B,D; Supplemental Figures 1B,D,F,H,J,L, 2B,D,F,H) and PsbD (Supplemental Figure 5) proteins of PSII, along with the FtsH protease (Supplemental Figure 7) and the PsaC subunit of PSI (data not shown). Total protein was extracted from the frozen filters using the MPBio FastPrep®-24 with bead lysing matrix D (SKU 116913050) and 450 μL of 1X denaturing extraction buffer (0.1375 mol L−1 TRIS buffer, 0.075 mol L−1 LDS, 1.075 mol L−1 glycerol, 0.5 mmol L−1 EDTA, 0.1 mg mL−1 Pefabloc) (Brown et al., 2008) for three cycles of 60 s at 6.5 m s−1. We measured total protein in the extracts using Bio-Rad DC protein assay kit (500-0116) with known BGG standards. We then loaded 1–5 μg of total protein onto 4–12% acrylamide precast NuPAGE or Bolt gels (Life Technologies) and loaded in parallel with a range of PsbA, PsbD, PsaC or FtsH protein standards (Agrisera, www.agrisera.se, AS01 016S; AS09 146S; AS04 042S; AS11 1789S) to establish a standard curve for quantitation of the target protein. We ran electrophoresis for 25 min at 200 V and transferred proteins to a polyvinylidene fluoride (PVDF) membrane for 60 min at 20 V. After the membrane blocking with 2% (g/mL) ECL prime™ blocking agent, we applied a primary antibody (Agrisera, AS05 084A; AS06 146 at 1:20,000 dilution or AS10 939; AS11 1789 at 1:5000 dilution), then an anti-rabbit secondary antibody coupled with horseradish peroxidase (Agrisera, AS09 602, 1:20,000). After this, we developed the membranes with chemoluminescence using ECL Select (GE Biosciences) and imaged under a CCD imager (BioRadVersaDoc 4000MP). Finally, we quantified PsbA, PsbD, PsaC or FtsH protein subunits by fitting the sample signal values to the protein standard curves (Brown et al., 2008). The global anti-FtsH antibody used in this study can potentially detect all five isoforms of Thalassiosira FtsH, but the cellular FtsH content is dominated by the single isoform encoded in the chloroplastic genome of Thalassiosira (Campbell et al., 2013). Our estimates of PSIIactive and PsbA contents showed no significant difference between the replicates paired for equivalent species, growth condition and diel sampling time (Supplemental Figure 6).
We used the immunoquantitations from the lincomycin treated sub-cultures to estimate first order exponential rate constants for the removal of the proteins, kPsbA degrade (Supplemental Figures 1B,D,F,H,J,L, 2B,D,F,H; closed symbols) and kPsbD degrade (Supplemental Figure 5) when new protein synthesis was blocked by lincomycin:
In parallel we estimated rate constants for synthesis, kPsbA synth (Supplemental Figures 1B,D,F,H,J,L, 2B,D,F,H; open vs. closed symbols) and kPsbD synth by adding the net exponential rate of increase in the protein in the absence of lincomycin, in the main culture, to the net exponential rate of loss of protein in the lincomycin treated sub-culture.
Statistical Analyses
The functional and protein quantitation samplings in this manuscript were drawn from a sub-set of a larger matrix of cultures grown to test the interactive effects of photoperiod and growth light level on growth rates and resource allocations in a small and a large diatom (Li et al., 2016). For this study we used data from two separately grown cultures for each combination of species (Thalassiosira pseudonana or Thalassiosira punctigera), growth light level (75 or 300 μmol photons m−2 s−1), and light:dark cycle (16:8 L:D, 8:16 L:D, 4:20, L:D cycle). Within each combination we had multiple repeat measurement times from each culture during the photoperiod, and two repeat measurement times during the dark scotoperiod. We initially ran a single-factor ANOVA (RStudio) and found that at our level of replication and time resolution, measurement time within a photoperiod or within a dark scotoperiod had no statistically significant influence upon the measured variables fmol PSIIactive μg protein−1, fmol PsbA μg protein−1, kPSII activation, kpi, kPsbA synth, kPsbA degrade, fmol PsbD μg protein−1, kPsbD synth, kPsbD degrade, or fmol FtsH μg protein−1. The single exception was a statistically significant influence of measurement time within the photoperiod upon fmol PSIIactive μg protein−1 for T. punctigera (df = 8, F = 2.59, P = 0.0306), although these determinations suffered from scatter among one condition (Supplemental Figure 2C, T. punctigera, 300 μmol photons m−2 s−1). For most subsequent analyses we therefore pooled measurements from within the photoperiod, or from within the dark period. We then used 3-factor ANOVA with Tukey Honest Significant Difference post-tests (RStudio) to determine the effects of light level, light vs. dark and photoperiod length upon measured fmol PSIIactive μg protein−1 (Figures 1A,C; Supplemental Figures 1, 2); fmol PsbA μg protein−1 (Figures 1A,C; Supplemental Figures 1, 2); kPSII activation (Figures 2A,B); kpi (Figures 2A,B; Figure 3); kPsbA synth (Figures 2C,D); kPsbA degrade (Figures 2C,D); kPsbD degrade (Supplemental Figure 5); and kPsbD synth from cultures grown under 75 or 300 μmol photons m−2 s−1, with 4:20, 8:16, or 16:4 h photo:scoto period lengths. A Bartlett test for homogeneity of variances and a Shapiro test for normality were run on residuals to confirm that the data fit the assumptions of the tests. Some, but not all, variables showed no significant change between the photoperiod and the scotoperiod and were therefore pooled into aggregate averages for a species under a given growth light. The details of our statistical analyses are included as a Supplemental Data text file.
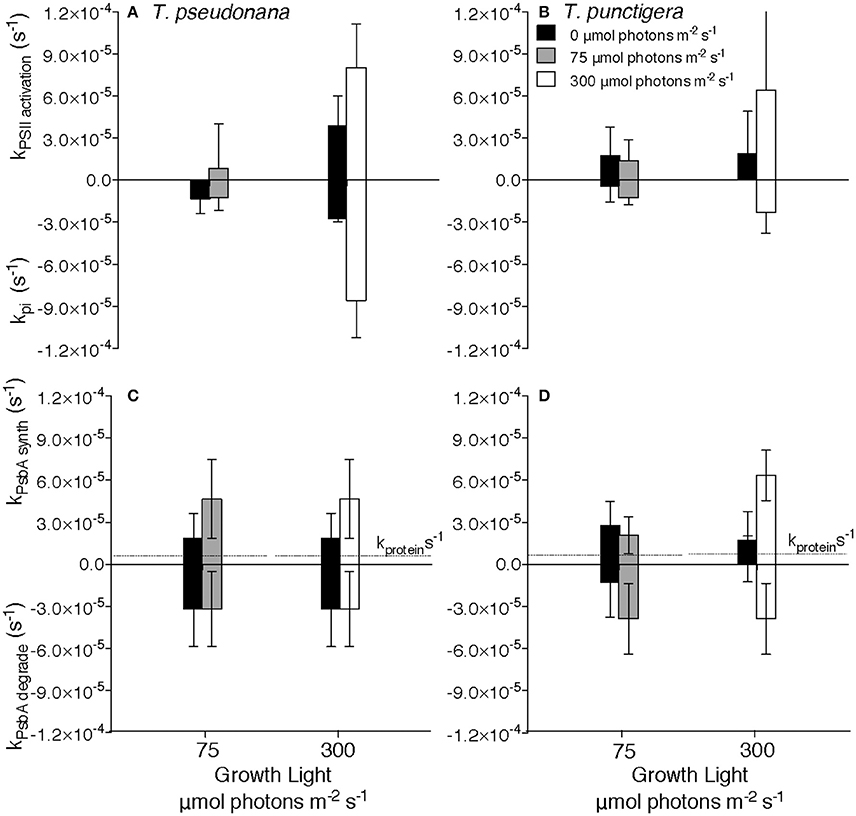
Figure 2. Rate constants for Photosystem II cycling. Rate constants for Photosystem II inactivation (kpi) for T. pseudonana (A) or T. punctigera (B) measured under darkness (closed bars), 75 (shaded bars) or 300 (open bars) μmol photons m−2 s−1. Rate constants for synthesis (kPsbA synth) or removal (kPsbA degrade) of PsbA protein for T. pseudonana (C) or T. punctigera (D). Data pooled from determinations under 4:20, 8:16 and 16:8 L:D cycles, 2–4 separate determinations per diel cycle upon two independent cultures for each combination of growth light, diel cycle and species. n = 4–36, ± SD Horizontal dotted lines at ~0.5 × 10⁻⁵ s−1 in (C,D) show the protein specific growth rate constant for the 16:8 photoperiods for each culture and growth combination, presented for comparison to the rate constants for Photosystem II protein turnover.
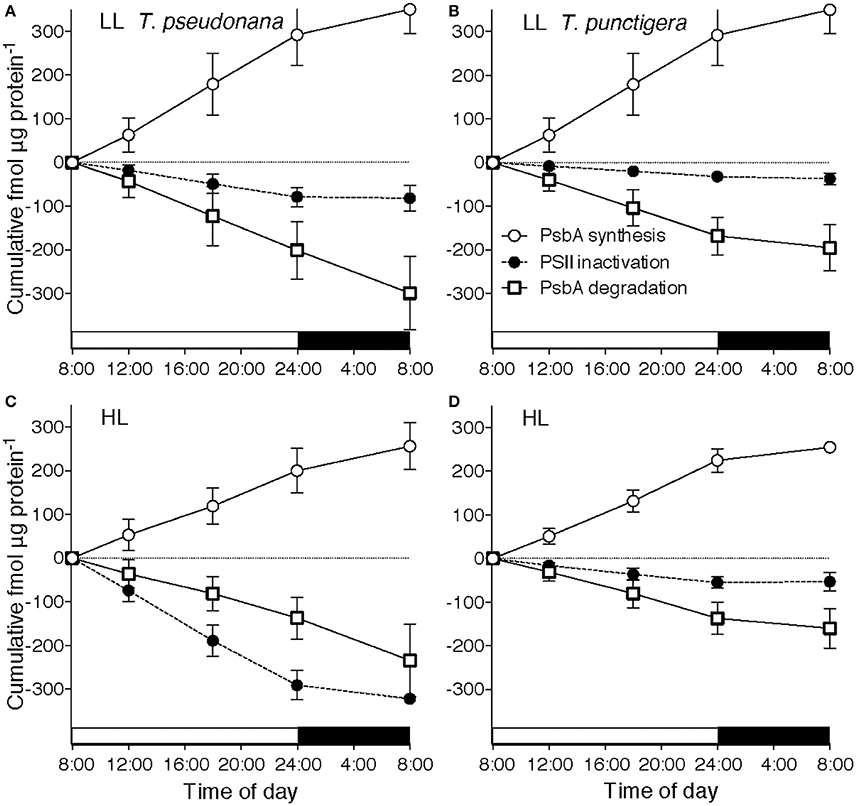
Figure 3. Cumulative diel Photosystem II cycling. Cumulative diel inactivation of Photosystem II (closed circles), cumulative diel removal of PsbA (open squares) and cumulative diel synthesis of PsbA (open circles) for T. pseudonana (A,C) or T. punctigera (B,D) grown under 75 (A,B) or 300 (C,D) μmol photons m−2 s−1. 16:8 L:D Diel cycle indicated by horizontal bars along X axes. Error bars show propagated standard deviation.
Results
Across a 16:8 L:D cycle under low growth light (75 μmol photons m−2 s−1) the small diatom T. pseudonana showed nearly steady contents of PSIIactive (Figure 1A) and the core PSII protein PsbA (Figure 1B) in a ~1:1 ratio showing that PSIIactive accounts for almost all PsbA protein. This indicates that only small pools of inactive PSII repair cycle intermediates were present under this growth condition.
Under a 16:8 L:D cycle at higher growth light (300 μmol photons m−2 s−1) the content of PSIIactive (Figure 1C) was significantly lower [3-factor ANOVA, df = 1, F = 53.669, p = 3.66 × 10⁻¹⁰, with Tukey Honest Significant Difference post-tests (RStudio)], even though the quantum yield of PSII (Supplemental Figures 4A,C) was only marginally lower. This highlights an important distinction between the pool size for PSIIactive and the fluorescence based quantum yield for PSII. At midday PSIIactive and PsbA protein content converged at ~58 fmol μg protein−1, before diverging late in the period of high light as PSIIactive declined and PsbA protein accumulated (Figure 1D), because PsbA synthesis outran PsbA degradation. During the subsequent dark period PSIIactive dropped significantly [3-factor ANOVA, df = 1, F = 14.418, p = 0.000315 with Tukey Honest Significant Difference post-tests (RStudio)] to only ~30% of the pool of PsbA protein, with a large pool of reserve protein that is not part of a PSIIactive (compare Figures 1C,D, dark period). The content of PSIIactive then increased from the late night measurement to measurements at dawn (Figure 1C), even when PsbA protein synthesis was blocked by the chloroplast protein translation inhibitor lincomycin (Supplemental Figures 1C,D). Thus, in the dark the cells contained a reserve of PSII protein available for assembly into PSIIactive around dawn, even when new protein synthesis was blocked. PsbA protein content then dropped again in the morning as PSIIactive and PsbA protein contents converged (Figure 1D). Analogous experiments with T. pseudonana under 8:16 and 4:20 diel cycles (Supplemental Figure 1) showed similar responses. The parallel set of experiments on the larger diatom T. punctigera (Supplemental Figure 2) showed generally dampened diel responses and a lower fraction of the PsbA pool in the PSIIactive pool under low growth light (Supplemental Figures 2A,B,E,F).
The content of the key FtsH protease that mediates removal of PsbA (Nixon et al., 2005; Campbell et al., 2013) was steady through the diel cycle in both T. pseudonana and T. punctigera, while T. pseudonana showed a significant up-regulation of FtsH protein under the higher growth light [2-factor ANOVA, df = 1, F = 4.757, p = 0.032 with Tukey Honest Statistical Difference post-tests (RStudio)] (Supplemental Figures 7A–D).
We estimated the rate constants for inactivation of PSII, kpi and for the countering activation, kpsii activation of new units of PSIIactive (Figures 2A,B), by tracking [PSIIactivefluor] over 7200 s time intervals, with or without blockage of chloroplast protein synthesis by lincomycin, for T. pseudonana (Supplemental Figure 1) and for T. punctigera (Supplemental Figure 2). We repeatedly estimated these rate constants over 7200 s periods during darkness (Figures 2A,B closed bars), moderate low growth light (Figures 2A,B, shaded bars) or higher growth light (Figures 2A,B, open bars). 3-way ANOVA found no significant effects of culture photoperiod length, nor time within the photoperiod, upon the rate constants, but there were significant effects of dark vs. light during the measurement period, and of the growth light level. Therefore, to increase statistical power for the estimation of rate constants Figure 2 pools data from multiple determinations on cultures grown under 16:8 (Supplemental Figures 1, 2), 8:16 (Supplemental Figure 1) and 4:20 (Supplemental Figures 1, 2) L:D diel cycles. The smaller T. pseudonana shows higher rate constants for PSII inactivation under higher light growth [3-factor ANOVA, df = 1, F = 534.448, P <2e-16, with Tukey Honest Significant Difference post-tests (RStudio)] consistent with the higher intrinsic susceptibility of smaller diatoms to photoinactivation of PSIIactive (Key et al., 2010; Wu et al., 2011, 2012). T. pseudonana also shows a surprising rate constant for inactivation of PSIIactive even in the dark (Figure 2A, dark bars), since measurable loss of PSIIactive was observed relative to total protein pools during dark periods in this species. The counteracting rate for activation of new units of PSIIactive, kpsii activation, did not show a statistically significant response to culture photoperiod length, nor to time within the photoperiod, but did show a significant increase under higher growth light [3-factor ANOVA, df = 1, F = 59.91, P = 0.0015,with Tukey Honest Significant Difference post-tests (RStudio)] compared to moderate light and during the photoperiod vs. darkness [3-factor ANOVA, df = 1, F = 19.56, P = 0.0115,with Tukey Honest Significant Difference post-tests (RStudio)].
The rate constants for removal of PsbA protein, kPsbA degrade, again measured in the presence of lincomycin to block counteracting synthesis of PsbA (Supplemental Figures 1, 2), did not vary significantly across determinations in darkness, low or higher light for T. pseudonana (Figure 2C) nor for T. punctigera (Figure 2D). Under low light kPsbA degrade was larger than kpi in both T. pseudonana (Welch Two Sample t-test, t = −4.529, df = 43.254, p = 4.612 × 10⁻⁵) (Figures 2A,C) and in the larger T. punctigera (Welch Two Sample t-test, t = −6.586, df = 38.453, p = 8.5 × 10⁻⁸) (Figures 2B,D). Furthermore, the kPsbA degrade was larger than the protein specific growth rates presented for each combination of species and growth light, for comparison (Figures 2C,D).
We estimated rate constants for synthesis of PsbA protein, kPsbA synth, by comparing changes in PsbA content in the absence and in the presence of the chloroplast translation inhibitor lincomycin for T. pseudonana (Supplemental Figure 1) and for T. punctigera (Supplemental Figure 2) over 7200 s periods repeated through the diel cycle. kPsbA synth showed significant PsbA synthesis during the dark period, particularly after the higher daytime growth light level. In parallel with our analyses of degradation and synthesis of PsbA we also analyzed degradation and synthesis of the PsbD core protein of PSII (Supplemental Figure 5). As expected in these diatoms (Wu et al., 2011, 2012) turnover of PsbD was of comparable magnitude to the turnover of PsbA, although the kinetics of the turnover of the two proteins were not tightly correlated on a sample by sample basis.
To analyze the cumulative diel progression of the PSII repair cycle we plotted cumulative inactivation of PSII (Figure 3), cumulative removal of PsbA protein (Figure 3) and cumulative synthesis of PsbA protein (Figure 3) over a 16:8 L:D diel cycle starting at 08:00 with low growth light (Figures 3A,B) or high growth light (Figures 3C,D) for T. pseudonana (Figures 3A,C) and for T. punctigera (Figures 3B,D). These trajectories are based upon the pools of PSIIactive and PsbA over the diel cycle (Figure 1; Supplemental Figures 1, 2), along with the rate constants estimated for loss or synthesis of the pools estimated for the illumination levels and species (Figure 2). Two-way ANOVA showed that growth light level (Df = 1, F = 9.048, Pr = 0.011) and species (Df = 1, F = 12.841, Pr = 0.004) both showed significant influences on cumulative PSII inactivation. In contrast growth light or species did not show significant effects upon cumulative PsbA degradation, nor upon cumulative PsbA synthesis. In T. pseudonana under low light (Figure 3A) less than 100 fmol PSIIactive μg protein−1 suffered inactivation up to the end of the 16 h photoperiod at 24:00 (Figure 3A, closed circles). Over the same 16 h of low light illumination ~200 fmol PsbA μg protein−1 was cleared (Figure 3A, open squares), while ~270 fmol PsbA μg protein−1 was synthesized. Therefore, the cells were degrading and replacing protein subunits from PSII units that had not suffered inactivation. Furthermore, during the subsequent dark period PSII inactivation stopped but PsbA protein turnover continued, so that over the 24 h cycle ~350 fmol PsbA μg protein−1 was degraded and replaced through synthesis, while only ~100 fmol PSII μg protein−1 was inactivated (Welch Two-Sample t-test df = 13.805, p = 0.0107).
In T. pseudonana under high light illumination (Figure 3C) inactivation approximately balanced PsbA clearance and replacement over 24 h, with PsbA turnover continuing during the dark hours to catch up to photoinactivation incurred during the photoperiod and no significant difference between diel PSII photoinactivation and diel PsbA degradation.
For T. punctigera the lower kpi than T. pseudonana [3-factor ANOVA, df = 1, F = 21.235, P = 2.52 × 10⁻⁵,with Tukey Honest Significant Difference post-tests (RStudio)] (Figure 2B) and lower content of PSIIactive (Supplemental Figure 2A) meant much less cumulative inactivation of PSIIactive over the 16 h high light illumination up to 24:00 (Figure 3D). In principle this could have lowered the metabolic repair costs for T. punctigera because fewer PSII inactivations mean lower requirements for PSII protein turnover (Li et al., 2015). In fact cumulative diel PsbA degradation (Figures 3B,D) and diel PsbA synthesis (Figures 3B,D) in T. punctigera again significantly exceeded cumulative diel inactivation under both low (Welch Two-Sample t-test df = 17.441, p = 7.76 × 10⁻⁵) and high growth light (Welch Two-Sample t-test df = 17.983, p = 5.8 × 10⁻⁴), showing that the larger T. punctigera was also turning over PsbA proteins even for PSIIactive that had not suffered inactivation.
Cumulative diel PsbA protein turnover in these strains is already light saturated at a growth light of 75 μmol photons m−2 s−1, consistent with findings in other organisms (Edelman and Mattoo, 2008) that PsbA protein turnover saturates under low light. For T. pseudonana growing under low light much of the daily clearance of PsbA took place during the dark period following illumination (Figure 3A, open circles and squares). For T. pseudonana the metabolic costs of PSII protein turnover were actually similar under low and under higher light, because even though photoinactivations were slow under low light (Figure 2A), the cells under low light contained more PSIIactive (Figure 1A), so the total diel burden of PSII turnover was similar under low and high light. For T. punctigera cumulative PSII protein turnover exceeded cumulative PSII inactivation, under both low and high growth light (Figures 3B,D). In contrast we found no evidence for statistically significant rates of turnover of the PsaC subunit of Photosystem I over the same measurement periods (data not presented), suggestin that in these cells turnover of Photosystem I proteins is negligible compared to PSII protein turnover, at least up to moderately high growth lights.
Discussion
Labeling experiments, reviewed in Edelman and Mattoo (2008) showed that in model plants and in cyanobacteria (Nixon et al., 2005) PSII protein turnover is largely light dependent and reaches rate saturation under low light. In our measures of PSII protein turnover in marine centric diatoms we find that significant PsbA and PsbD degradation, and some synthesis, continue during darkness. Indeed dark turnover represents a large fraction of total diel cycling of PSII proteins in the diatoms tested. In the small diatom Thalassiosira pseudonana the burden of PSII cycling upon chloroplastic protein metabolism was actually similar under low light, with slow photoinactivation per PSII but large pools of PSII, and under higher growth-saturating light with faster photoinactivation per PSII but smaller pools of PSII. In the larger diatom T. punctigera cumulative diel turnover of PSII proteins consistently outran the cumulative inactivation of PSIIactive. Thus, in diatoms PSII inactivation (Komenda et al., 2007) is not a necessary precursor step to protein degradation and the chloroplasts in these large diatoms are degrading subunits taken from PSII that have not been inactivated. The diatoms, like other chlorophyll a/c organisms, have a triply layered thylakoid organization (Gibbs, 1962; Drum, 1963; Lepetit et al., 2012) that may place kinetic limitations upon access of the FtsH protease (Komenda et al., 2012) to PSII, in contrast to the single layer thylakoid arrangement in cyanobacteria, or the grana/stroma thylakoid organization of higher plants. The 1–2 ATP per peptide bond to drive chloroplastic protein degradation (Nixon et al., 2010; Raven, 2011; Komenda et al., 2012; Campbell et al., 2013) in the dark must derive from the tight coupling of chloroplastic and mitochondrial ATP and amino acid metabolism in diatoms (Allen et al., 2011; Prihoda et al., 2012; Bailleul et al., 2015). This dark PsbA turnover capacity is particularly evident in the small, coastal strain T. pseudonana in this study. We suggest that diatoms have evolved an ongoing PSII protein turnover in the dark as an adaptation to match kinetic limitations on their instantaneous PSII protein turnover, with fluctuating instantaneous photoinactivation rates in variable light environments. In another study (Li et al., 2016) we show that for the larger T. punctigera dark periods are actually necessary for the species to achieve maximal growth rates. The diatoms may thus offset the burden of PSII repair upon ATP, protein and amino acid metabolism to dark periods. This allows transient burn down of reserve pools of PSIIactive during intervals of high illumination (Behrenfeld et al., 1998), with a subsequent clean up in the succeeding dark period.
Author Contributions
GL conducted all growth and culturing experiments, harvested all samples for subsequent analyses, conducted all photophysiological measures, did some of the PsbA quantitations, generated draft figures and curve fits, and contributed to the text. AW conducted quantitations of FtsH and some of the PsbA quantitations, generated draft figures, contributed to the text and performed the statistical analyses with DC. ND conducted quantitations of PsaA and PsaC, managed the reagents for protein quantitations and contributed to the text. AC supervised the protein quantitation work and contributed to the text. DC supervised the culturing and photophysiology work, contributed to figure drafting and curve fitting, wrote the draft of the text and performed the statistical analyses with AW. All authors edited and revised the manuscript.
Conflict of Interest Statement
DC and AC are minority shareholders in the company Environmental Proteomics which provided the protein quantitation standards used in this study. The authors did not derive any financial benefit from the donation. The other authors declare that the research was conducted in the absence of any commercial or financial relationships that could be construed as a potential conflict of interest.
Acknowledgments
Jessica Grant-Burt did cell count determinations for Thalassiosira punctigera. This work was supported by the Natural Sciences and Engineering Research Council of Canada (AC, DC) and the Canada Research Chairs program (DC) using equipment supported by the Canada Foundation for Innovation and the New Brunswick Innovation Foundation. GL was supported by CAS Strategic Pilot Science and Technology of China (XDA13020103, XDA11020200), National Natural Science Foundation (41676156), and Guangdong Natural Science Foundation (2015A030313826) of China.
Supplementary Material
The Supplementary Material for this article can be found online at: https://www.frontiersin.org/article/10.3389/fmars.2016.00218/full#supplementary-material
Supplemental Figure 1. Diel progressions of function and content of Photosystem II for T. pseudonana under 16:8, 8:16, or 4:20 L:D diel cycles. PSIIactivefluor (A,C,E,G,I,K) or PsbA protein content (B,D,F,H,J,L) vs. time of day for cultures growing under 75 (A,B,E,F,I,J) or 300 (C,D,G,H,K,L) μmol photons m−2 s−1 with a 16:8 (A–D), 8:16 (E–H), or 4:20 (I–L) L:D cycles. Diel cycle indicated by horizontal bars along X axes. Open symbols show measures from control cultures. Closed symbols show measures from sub-cultures treated with lincomycin for 900, 1800, 3600, or 7200 s to inhibit chloroplast protein synthesis. Error bars show ranges of two individual determinations.
Supplemental Figure 2. Diel progressions of function and content of Photosystem II for T. punctigera under 16:8 or 4:20 L:D diel cycles. PSIIactivefluor (A,C,E,G) or PsbA protein content (B,D,F,H) vs. time of day for cultures growing under 75 (A,B,E,F) or 300 (C,D,G,H) μmol photons m−2 s−1 with a 16:8 (A–D) or 4:20 (E–H) L:D cycles. Diel cycle indicated by horizontal bars along X axes. Open symbols show measures from control cultures. Closed symbols show measures from sub-cultures treated with lincomycin for 900, 1800, 3600, or 7200 s to inhibit chloroplast protein synthesis. Error bars show ranges of two individual determinations.
Supplemental Figure 3. Comparison of Photosystem II inactivation rate constant for kpi derived from FV/FM to kpi determined from calibrated determinations of the content of PSIIactivefluor for T. pseudonana (A) or T. punctigera (B). Closed symbols are measures from dark periods; shaded symbols from cultures under 75 μmol photons m−2 s−1; open symbols from cultures under 300 μmol photons m−2 s−1. Data is from cultures growing under 4:20, 8:16, or 16:8 L:D diel cycles. Dashed line shows 1:1 ratio; fitted regressions did not differ significantly from 1:1.
Supplemental Figure 4. Diel progressions of fluorescence based maximum quantum yield of Photosystem II (FV/FM). T. pseudonana (A,C,E,F,G,I) or T. punctigera (B,D,H,J) FV/FM vs. time of day for cultures growing under 75 (A,B,E,G,H) or 300 (C,D,F,I,J) μmol photons m−2 s−1 with a 16:8 (A–D), 8:16 (E,F), or 4:20 (G–J) L:D cycles. Diel cycle indicated by horizontal bars along X axes. Open symbols show measures from control cultures. Closed symbols show measures from sub-cultures treated with lincomycin for 900, 1800, 3600, or 7200 s to inhibit chloroplast protein synthesis. Error bars show ranges of two individual determinations.
Supplemental Figure 5. Rate constants for degradation and synthesis of PsbD protein vs. PsbA protein. Rate constant for removal of PsbD protein vs. rate constant for removal of PsbA for T. pseudonana (A) or T. punctigera (B). Rate constant for accumulation of PsbD protein vs. rate constant for accumulation of PsbA for T. pseudonana (C) or T. punctigera (D). Closed symbols are measures from dark periods; gray symbols from cultures under 75 μmol photons m−2 s−1; open symbols from cultures under 300 μmol photons m−2 s−1. Dashed line shows 1:1 ratio; fitted regressions did not differ significantly from 1:1.
Supplemental Figure 6. Comparison of paired determinations of fmol PSIIactivefluor μg protein−1 (A) or fmol PsbA μg protein−1 (B) from replicate cultures. Data from paired cultures of T. pseudonana (circles) and T. punctigera (triangles), growing under 75 (shaded symbols) or 300 (open symbols) μmol photons m−2 s−1. Samples taken from dark periods after either growth light are shown as closed symbols. Data is from cultures growing under 4:20, 8:16, or 16:8 L:D diel cycles. Paired T-tests show no significant difference between paired replicate data.
Supplemental Figure 7. Diel progressions of content of FtsH protease for T. pseudonana (A,C) or T. punctigera (B,D) vs. time of day for cultures growing under 75 (A,B) or 300 μmol photons m−2 s−1 (C,D) with a 16:8 L:D cycle indicated by horizontal bars along X axes. Points show repeated determinations upon two separate cultures for each condition.
References
Allen, A. E., Dupont, C. L., Oborník, M., Horák, A., Nunes-Nesi, A., McCrow, J. P., et al. (2011). Evolution and metabolic significance of the urea cycle in photosynthetic diatoms. Nature 473, 203–207. doi: 10.1038/nature10074
Armbrust, E. V. (2004). The genome of the diatom Thalassiosira pseudonana: ecology, evolution, and metabolism. Science 306, 79–86. doi: 10.1126/science.1101156
Armbrust, E. V. (2009). The life of diatoms in the world's oceans. Nature 459, 185–192. doi: 10.1038/nature08057
Bailleul, B., Berne, N., Murik, O., Petroutsos, D., Prihoda, J., Tanaka, A., et al. (2015). Energetic coupling between plastids and mitochondria drives CO2 assimilation in diatoms. Nature 524, 366–369. doi: 10.1038/nature14599
Baroli, I., and Melis, A. (1996). Photoinhibition and repair in Dunaliella salina acclimated to different growth irradiances. Planta 198, 640–646. doi: 10.1007/BF00262653
Behrenfeld, M. J., Prasil, O., Kolber, Z. S., Babin, M., and Harrison, P. J. (1998). Compensatory changes in Photosystem II electron turnover rates protect photosynthesis from photoinhibition. Photosynth. Res. 58, 259–268. doi: 10.1023/A:1006138630573
Brown, C., MacKinnon, J., Cockshutt, A., Villareal, T., and Campbell, D. (2008). Flux capacities and acclimation costs in Trichodesmium from the Gulf of Mexico. Mar. Biol. 154, 413–422. doi: 10.1007/s00227-008-0933-z
Campbell, D. A., Hossain, Z., Cockshutt, A. M., Zhaxybayeva, O., Wu, H., and Li, G. (2013). Photosystem II protein clearance and FtsH function in the diatom Thalassiosira pseudonana. Photosynth. Res. 115, 43–54. doi: 10.1007/s11120-013-9809-2
Campbell, D. A., and Tyystjärvi, E. (2012). Parameterization of photosystem II photoinactivation and repair. Biochim. Biophys. Acta 1817, 258–265. doi: 10.1016/j.bbabio.2011.04.010
Chisholm, S. W., and Costello, J. C. (1980). Influence of environmental factors and population composition on the timing of cell division in thalassiosira fluviatilis (bacillariophyceae) grown on light/dark cycles1. J. Phycol. 16, 375–383. doi: 10.1111/j.1529-8817.1980.tb03048.x
Chow, W. S., Hope, A. B., and Anderson, J. M. (1989). Oxygen per flash from leaf disks quantifies Photosystem II. Biochim. Biophys. Acta 973, 105–108. doi: 10.1016/S0005-2728(89)80408-6
Drum, R. W. (1963). The cytoplasmic fine structure of the diatom, Nitzschia palea. J. Cell Biol. 18, 429–440. doi: 10.1083/jcb.18.2.429
Edelman, M., and Mattoo, A. K. (2008). D1-protein dynamics in photosystem II: the lingering enigma. Photosynth. Res. 98, 609–620. doi: 10.1007/s11120-008-9342-x
Field, C. B., Behrenfeld, M. J., Randerson, J. T., and Falkowski, P. (1998). Primary production of the biosphere: integrating terrestrial and oceanic components. Science 281, 237–240. doi: 10.1126/science.281.5374.237
Gibbs, S. P. (1962). The ultrastructure of the chloroplasts of algae. J. Ultrastruct. Res. 7, 418–435. doi: 10.1016/S0022-5320(62)90038-2
Guillard, R. R. L., and Ryther, J. H. (1962). Studies of marine planktonic diatoms: I. Cyclotella nana Hustedt and Detonula confervacea (Cleve) Gran. Can. J. Microbiol. 8, 229–239. doi: 10.1139/m62-029
Hopkinson, B. M., Dupont, C. L., Allen, A. E., and Morel, F. M. M. (2011). Efficiency of the CO2-concentrating mechanism of diatoms. Proc. Natl. Acad. Sci. U.S.A. 108, 3830–3837. doi: 10.1073/pnas.1018062108
Key, T., McCarthy, A., Campbell, D. A., Six, C., Roy, S., and Finkel, Z. V. (2010). Cell size trade-offs govern light exploitation strategies in marine phytoplankton. Environ. Microbiol. 12, 95–104. doi: 10.1111/j.1462-2920.2009.02046.x
Kok, B. (1956). On the inhibition of photosynthesis by intense light. Biochim. Biophys. Acta 21, 234–244. doi: 10.1016/0006-3002(56)90003-8
Kolber, Z. S., Prášil, O., and Falkowski, P. G. (1998). Measurements of variable chlorophyll fluorescence using fast repetition rate techniques: defining methodology and experimental protocols. Biochim. Biophys. Acta 1367, 88–106. doi: 10.1016/S0005-2728(98)00135-2
Komenda, J., Sobotka, R., and Nixon, P. J. (2012). Assembling and maintaining the Photosystem II complex in chloroplasts and cyanobacteria. Curr. Opin. Plant Biol. 15, 245–251. doi: 10.1016/j.pbi.2012.01.017
Komenda, J., Tichy, M., Prásil, O., Knoppová, J., Kuviková, S., de Vries, R., et al. (2007). The exposed N-terminal tail of the D1 subunit is required for rapid D1 degradation during photosystem II repair in Synechocystis sp. PCC 6803. Plant Cell Online 19, 2839–2854. doi: 10.1105/tpc.107.053868
Laney, S. R. (2003). Assessing the error in photosynthetic properties determined with Fast Repetition Rate fluorometry. Limnol. Oceanogr. 48, 2234–2242. doi: 10.4319/lo.2003.48.6.2234
Laney, S. R., and Letelier, R. M. (2008). Artifacts in measurements of chlorophyll fluorescence transients, with specific application to fast repetition rate fluorometry. Limnol. Oceanogr. Methods 6, 40–50. doi: 10.4319/lom.2008.6.40
Lavaud, J., and Lepetit, B. (2013). An explanation for the inter-species variability of the photoprotective non-photochemical chlorophyll fluorescence quenching in diatoms. Biochim. Biophys. Acta 1827, 294–302. doi: 10.1016/j.bbabio.2012.11.012
Lavaud, J., Six, C., and Campbell, D. A. (2016). Photosystem II repair in marine diatoms with contrasting photophysiologies. Photosynth. Res. 127, 189–199. doi: 10.1007/s11120-015-0172-3
Lavaud, J., Strzepek, R. F., and Kroth, P. G. (2007). Photoprotection capacity differs among diatoms: possible consequences on the spatial distribution of diatoms related to fluctuations in the underwater light climate. Limnol. Oceanogr. 52, 1188–1194. doi: 10.4319/lo.2007.52.3.1188
Lepetit, B., Goss, R., Jakob, T., and Wilhelm, C. (2012). Molecular dynamics of the diatom thylakoid membrane under different light conditions. Photosynth. Res. 111, 245–257. doi: 10.1007/s11120-011-9633-5
Li, G., Brown, C. M., Jeans, J. A., Donaher, N. A., McCarthy, A., and Campbell, D. A. (2015). The nitrogen costs of photosynthesis in a diatom under current and future pCO2. New Phytol. 205, 533–543. doi: 10.1111/nph.13037
Li, G., Talmy, D., and Campbell, D. A. (2016). Diatom growth responses to photoperiod and light are predictable from diel reductant generation. J. Phycol. doi: 10.1111/jpy.12483. [Epub ahead of print].
MacIntyre, H. L., Kana, T. M., and Geider, R. J. (2000). The effect of water motion on short-term rates of photosynthesis by marine phytoplankton. Trends Plant Sci. 5, 12–17. doi: 10.1016/S1360-1385(99)01504-6
Murphy, C. D., Ni, G., Suggett, D. J., Li, G., Barnett, A., Kui, X., et al. (2016). Quantitating active Photosystem II reaction center content from fluorescence induction transients. Limnol. Oceanogr. Methods. doi: 10.1002/lom3.10142
Nixon, P. J., Barker, M., Boehm, M., de Vries, R., and Komenda, J. (2005). FtsH-mediated repair of the photosystem II complex in response to light stress. J. Exp. Bot. 56, 357–363. doi: 10.1093/jxb/eri021
Nixon, P. J., Michoux, F., Yu, J., Boehm, M., and Komenda, J. (2010). Recent advances in understanding the assembly and repair of photosystem II. Ann. Bot. 106, 1–16. doi: 10.1093/aob/mcq059
Oguchi, R., Terashima, I., Kou, J., and Chow, W. S. (2011). Operation of dual mechanisms that both lead to photoinactivation of Photosystem II in leaves by visible light. Physiol. Plant. 142, 47–55. doi: 10.1111/j.1399-3054.2011.01452.x
Oxborough, K., and Baker, N. R. (1997). Resolving chlorophyll a fluorescence images of photosynthetic efficiency into photochemical and non-photochemical components – calculation of qP and Fv'/Fm'; without measuring Fo'. Photosynth. Res. 54, 135–142. doi: 10.1023/A:1005936823310
Oxborough, K., Moore, C. M., Suggett, D. J., Lawson, T., Chan, H. G., and Geider, R. J. (2012). Direct estimation of functional PSII reaction center concentration and PSII electron flux on a volume basis: a new approach to the analysis of Fast Repetition Rate fluorometry (FRRf) data. Limnol. Oceanogr. Methods 10, 142–154. doi: 10.4319/lom.2012.10.142
Prihoda, J., Tanaka, A., de Paula, W. B. M., Allen, J. F., Tirichine, L., and Bowler, C. (2012). Chloroplast-mitochondria cross-talk in diatoms. J. Exp. Bot. 63, 1543–1557. doi: 10.1093/jxb/err441
Rast, A., Heinz, S., and Nickelsen, J. (2015). Biogenesis of thylakoid membranes. Biochim. Biophys. Acta 1847, 821–830. doi: 10.1016/j.bbabio.2015.01.007
Raven, J. A. (2011). The cost of photoinhibition. Physiol. Plant. 142, 87–104. doi: 10.1111/j.1399-3054.2011.01465.x
Silsbe, G. M., Oxborough, K., Suggett, D. J., Forster, R. M., Ihnken, S., Komárek, O., et al. (2015). Toward autonomous measurements of photosynthetic electron transport rates: an evaluation of active fluorescence-based measurements of photochemistry. Limnol. Oceanogr. Methods 13, 138–155. doi: 10.1002/lom3.10014
Singh, M., Satoh, K., Yamamoto, Y., Kanervo, E., and Aro, E.-M. (2008). In vivo quality control of photosystem II in cyanobacteria Synechocystis sp. PCC 6803: D1 protein degradation and repair under the influence of light, heat and darkness. Indian J. Biochem. Biophys. 45, 237–243.
Suggett, D., MacIntyre, H., Kana, T., and Geider, R. (2009). Comparing electron transport with gas exchange: parameterising exchange rates between alternative photosynthetic currencies for eukaryotic phytoplankton. Aquat. Microb. Ecol. 56, 147–162. doi: 10.3354/ame01303
Tyystjärvi, E. (2013). Photoinhibition of Photosystem II. Int. Rev. Cell Mol. Biol. 300, 243–303. doi: 10.1016/B978-0-12-405210-9.00007-2
Tyystjärvi, E., and Aro, E.-M. (1996). The rate constant of photoinhibition, measured in lincomycin-treated leaves, is directly proportional to light intensity. Proc. Natl. Acad. Sci. U.S.A. 93, 2213–2218. doi: 10.1073/pnas.93.5.2213
Vass, I. (2011). Role of charge recombination processes in photodamage and photoprotection of the photosystem II complex. Physiol. Plant. 142, 6–16. doi: 10.1111/j.1399-3054.2011.01454.x
Vinyard, D. J., Ananyev, G. M., and Charles Dismukes, G. (2013a). Photosystem II: the reaction center of oxygenic photosynthesis*. Annu. Rev. Biochem. 82, 577–606. doi: 10.1146/annurev-biochem-070511-100425
Vinyard, D. J., Gimpel, J., Ananyev, G. M., Cornejo, M. A., Golden, S. S., Mayfield, S. P., et al. (2013b). Natural variants of photosystem II subunit D1 tune photochemical fitness to solar intensity. J. Biol. Chem. 288, 5451–5462. doi: 10.1074/jbc.M112.394668
Ware, M. A., Belgio, E., and Ruban, A. V. (2015a). Comparison of the protective effectiveness of NPQ in Arabidopsis plants deficient in PsbS protein and zeaxanthin. J. Exp. Bot. 66, 1259–1270. doi: 10.1093/jxb/eru477
Ware, M. A., Belgio, E., and Ruban, A. V. (2015b). Photoprotective capacity of non-photochemical quenching in plants acclimated to different light intensities. Photosynth. Res. 126, 261–274. doi: 10.1007/s11120-015-0102-4
Wu, H., Cockshutt, A. M., McCarthy, A., and Campbell, D. A. (2011). Distinctive photosystem II photoinactivation and protein dynamics in marine diatoms. Plant Physiol. 156, 2184–2195. doi: 10.1104/pp.111.178772
Wu, H., Roy, S., Alami, M., Green, B. R., and Campbell, D. A. (2012). Photosystem II photoinactivation, repair, and protection in marine centric diatoms. Plant Physiol. 160, 464–476. doi: 10.1104/pp.112.203067
Keywords: FtsH, photoinactivation, protein turnover, PsbA, PsbD, thylakoids, Thalassiosira
Citation: Li G, Woroch AD, Donaher NA, Cockshutt AM and Campbell DA (2016) A Hard Day's Night: Diatoms Continue Recycling Photosystem II in the Dark. Front. Mar. Sci. 3:218. doi: 10.3389/fmars.2016.00218
Received: 20 July 2016; Accepted: 24 October 2016;
Published: 08 November 2016.
Edited by:
George S. Bullerjahn, Bowling Green State University, USAReviewed by:
Katherine Rose Marie Mackey, University of California, Irvine, USAKlaas J. Jan Hellingwerf, University of Amsterdam, Netherlands
Copyright © 2016 Li, Woroch, Donaher, Cockshutt and Campbell. This is an open-access article distributed under the terms of the Creative Commons Attribution License (CC BY). The use, distribution or reproduction in other forums is permitted, provided the original author(s) or licensor are credited and that the original publication in this journal is cited, in accordance with accepted academic practice. No use, distribution or reproduction is permitted which does not comply with these terms.
*Correspondence: Douglas A. Campbell, dcampbell@mta.ca