Coupled Response of Bacterial Production to a Wind-Induced Fall Phytoplankton Bloom and Sediment Resuspension in the Chukchi Sea Shelf, Western Arctic Ocean
 Mario Uchimiya1,2*†
  Chiaki Motegi3
  Shigeto Nishino4 Yusuke Kawaguchi4
  Jun Inoue1,4
  Hiroshi Ogawa2
  Toshi Nagata2*
- 1Arctic Environment Research Center, National Institute of Polar Research, Tachikawa, Japan
- 2Department of Chemical Oceanography, Atmosphere and Ocean Research Institute, The University of Tokyo, Kashiwa, Japan
- 3Takuvik Joint International Laboratory, Université Laval, Québec, QC, Canada
- 4Japan Agency for Marine-Earth Science and Technology, Yokosuka, Japan
Heterotrophic bacterial abundance and production, dissolved free amino acid (DFAA) and dissolved combined amino acid (DCAA) concentrations, and other microbial parameters were determined for seawater samples collected at a fixed station (maximum water depth, 56 m) deployed on the Chukchi Sea Shelf, in the western Arctic Ocean, during a 16-day period in September 2013. During the investigation period, the sampling station experienced strong winds and a subsequent phytoplankton bloom, which was thought to be triggered by enhanced vertical mixing and upward nutrient fluxes. In this study, we investigated whether bacterial and dissolved amino acid parameters changed in response to these physical and biogeochemical events. Bacterial abundance and production in the upper layer increased with increasing chlorophyll a concentration, despite a concomitant decrease in seawater temperature from 3.2 to 1.5°C. The percentage of bacteria with high nucleic acid content during the bloom was significantly higher than that during the prebloom period. The ratio of the depth-integrated (0–20 m) bacterial production to primary production differed little between the prebloom and bloom period, with an overall average value of 0.14 ± 0.03 (± standard deviation, n = 8). DFAA and DCAA concentrations varied over a limited range throughout the investigation, indicating that the supply and consumption of labile dissolved amino acids were balanced. These results indicate that there was a tightly coupled, large flow of organic carbon from primary producers to heterotrophic bacteria during the fall bloom. Our data also revealed that bacterial production and abundance were high in the bottom nepheloid (low transmittance) layer during strong wind events, which was associated with sediment resuspension due to turbulence near the seafloor. The impacts of fall wind events, which are predicted to become more prominent with the extension of the ice-free period, on bacterial processes and the dynamics of organic matter in the Chukchi Sea Shelf could have far-reaching influences on biogeochemical cycles and ecosystem dynamics in broader regions of the Arctic Ocean.
Introduction
The Arctic Ocean is highly vulnerable to climate change (Hoegh-Guldberg and Bruno, 2010; Wassmann et al., 2011), with sea-ice reduction becoming increasingly evident (Stroeve et al., 2007; Kwok et al., 2009). Sea-ice reduction allows more sunlight to penetrate into the water column, which is thought to enhance primary production in the Arctic Ocean (Arrigo and van Dijken, 2011). Recent data have indicated that the Arctic regions are now developing a fall phytoplankton bloom, indicating a shift in the pelagic ecosystem from a polar mode (a single annual bloom) to a temperate mode (two blooms in spring and fall) (Ardyna et al., 2014). The fall bloom is associated with delayed freeze-up and increased exposure of the sea surface to wind stress, which promotes vertical mixing and nutrient replenishment to the sun-lit layer (Rainville et al., 2011; Ardyna et al., 2014). However, there are significant gaps in our understanding of the regulation of primary production and its effects on the Arctic regions, particularly in regard to how fall storms affect the magnitude and patterns of biogeochemical fluxes. This lack of knowledge severely hampers our ability to predict future changes in Arctic ecosystems.
To examine the effects of fall storms on the biogeochemistry of the Chukchi Sea Shelf, a time series survey was conducted on board the R/V “Mirai” (MR13–06 cruise) over a period of 16 days at a sampling station (water depth, 56 m) deployed on the Chukchi Sea Shelf (fixed-point observation [FPO]; Kawaguchi et al., 2015; Nishino et al., 2015). As previously reported, the FPO station experienced strong wind events, with the most prominent event induced by a high-pressure system over the East Siberian Sea (Inoue et al., 2015), and a subsequent phytoplankton bloom during the investigation (Nishino et al., 2015). This provided the first field evidence of the initiation of a fall bloom following storm events in the Arctic shelf. Data on the hydrography, turbulence, and nutrient distribution indicated that the bloom was triggered by enhanced vertical mixing and upward nutrient fluxes (Nishino et al., 2015). Furthermore, the strong wind events were accompanied by enhanced currents in the deeper layer and turbulent mixing near the seafloor (Kawaguchi et al., 2015).
As part of the FPO project, in the present study, we examined how bacteria responded to the storm-induced bloom and other changes in environmental conditions. Heterotrophic bacteria are the major consumer of dissolved organic matter (DOM) and play an important role in regulating bioelement fluxes in oceanic environments (Azam, 1998). Early studies have suggested that bacterial activity is strongly suppressed by low water temperature in polar regions (Pomeroy and Deibel, 1986). More recent data indicate that the bacterial production to primary production ratio (BP:PP ratio) has a median value of 0.04 in Arctic waters, which is lower than the general value of 0.1 obtained for lower latitude oceans (Kirchman et al., 2009b). This implies that the fraction of primary production that passes through DOM-bacteria coupling is lower in colder than warmer oceanic regions. The uncoupling between DOM production and consumption may allow DOM to be exported to the oligotrophic basin, which, if proven to be the case, has important biogeochemical implications (Davis and Benner, 2007). However, other studies have cast doubt on the low-temperature suppression hypothesis, reporting high BP:PP ratios (>0.2, Rich et al., 1997; Kirchman et al., 2009a) and high metabolic activities of bacteria (Yager et al., 2001; Alonso-Sáez et al., 2014; Børsheim and Drinkwater, 2014) even at near- or sub-zero temperatures in Arctic waters. These results suggest that either low DOM supply (Kirchman et al., 2009b), high mortality (Bird and Karl, 1999; Brum et al., 2016), or both, rather than low temperature per se, limit bacterial production, although the effects of temperature and other factors on the BP:PP ratio and bacteria-DOM coupling on Arctic shelves remain ambiguous.
We tested two opposing hypotheses. Hypothesis 1 was that bacteria respond to enhanced DOM production during the fall bloom, leading to an increase in bacterial production with the development of the bloom. Hypothesis 2 was that low temperatures suppress bacterial consumption of DOM and bacterial production, allowing DOM to accumulate during the bloom. In addition, we examined whether bacterial production was enhanced in the water layer near the seafloor in response to the increased physical perturbation. We collected data on bacterial abundance and production, other microbial parameters [percentage of bacteria with high nucleic acid content (%HNA, a physiological indicator of bacteria) and the viruses-to-bacteria abundance ratio (an indicator of the strength of viruses–bacteria interactions)], and the concentrations and compositions of dissolved free amino acids (DFAAs) and dissolved combined amino acids (DCAAs). Dissolved amino acids represent one of the largest identifiable pools of DOM and can serve as important carbon and nitrogen sources for bacteria (Bronk, 2002), providing a useful model for elucidating the strength and nature of DOM-bacteria coupling. Several previous studies have investigated dissolved amino acid concentrations and their composition in Arctic waters (Cota et al., 1996; Davis and Benner, 2005; Shen et al., 2012), although it remains unclear how these parameters relate to the occurrence of phytoplankton blooms.
Materials and Methods
Data Collection and Seawater Sampling
Time series sampling was conducted during September 10–26, 2013, on board the R/V “Mirai” (MR13–06 cruise) at a station located on the Chukchi Sea Shelf, in the western Arctic Ocean (72.75°N, 168.25°W; bottom depth, 56 m; Figure 1). Surface wind speed was continuously measured throughout the observation period, and hydrographic data, including temperature, salinity, transmittance, and chlorophyll a (Chl. a) concentration were collected mainly at 6 h intervals, as described elsewhere (Nishino et al., 2015). Seawater samples for the determination of bacterial production, and those for the determination of bacterial and viral abundances were collected at 24 h (10–13 September), 12 h (14–16 September), and 6 h intervals (17–26 September), whereas samples for determining DFAA and DCAA concentrations were collected at 24 h intervals. Surface (0 m) seawater samples were collected using a clean bucket, whereas subsurface seawater samples were collected from eight layers (from 5 m to the depth 10 m above the seafloor) using acid-washed Niskin bottles (Niskin-X, General Oceanics) attached to a conductivity-temperature-depth (CTD) carousel.
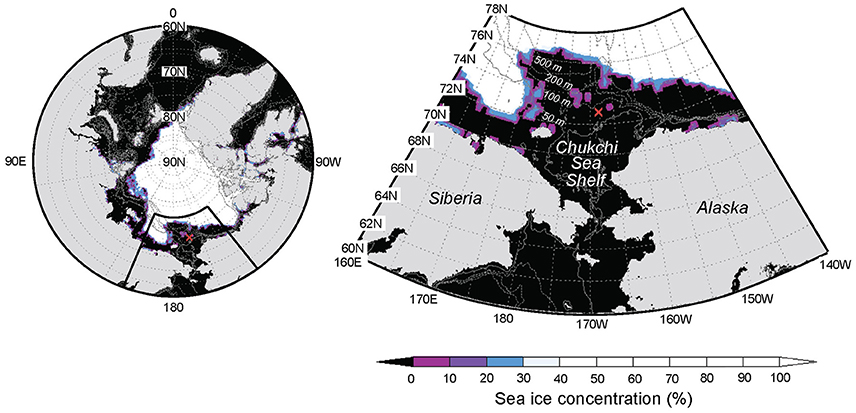
Figure 1. Location of the fixed-point observation (FPO) station (red cross) on the Chukchi Sea Shelf, western Arctic Ocean (Stn. 41; 72.75°N, 168.25°W; bottom depth, 56 m). Gray contours are isobaths (2-Min Gridded Global Relief Data; ETOPO2v2). Sea ice concentrations on 16 September 2013 are also shown (NCEP Climate Forecast System Version 2; CFSv2).
Subsamples for the determination of heterotrophic bacterial production and bacterial and viral abundances were transferred to 1 L acid-washed polycarbonate bottles (Nalgene). To determine DFAA and DCAA concentrations, seawater was passed through a pre-combusted (450°C, 5 h) glass fiber filter (GF/F, Whatman) mounted on a filter cartridge (PP-47, Advantec) attached to a Niskin bottle, and the filtrate was collected in a 100 mL glass bottle. The bottles containing the seawater samples were transferred to the laboratory on the ship for further processing. Sampling and processing were carried out carefully, and gloves were worn to minimize contamination.
Bacterial Production, and Bacterial and Viral Abundance
Bacterial production was estimated from the incorporation rate of 3H-leucine (NET1166, Perkin Elmer; specific activity, 161 Ci mmol−1) (Kirchman, 2001). A 1.5 mL sample of seawater was transferred to a sterile 2 mL vial, and 10 μL 3H-leucine was added (final concentration, 10 nmol L−1). The sample was incubated for 2 h in the dark at ambient temperature (±0.5°C). Incubation was stopped by adding 80 μL trichloroacetic acid (TCA, Wako). The fixed sample was centrifuged (5417R, Eppendolf) at 14,000 rpm for 10 min, and the pellet was washed with 10% TCA, followed by 80% ethanol (Wako), and dried overnight. In the laboratory on land, a 1 mL scintillation cocktail (Ultima Gold, Perkin Elmer) was added to the sample and radio-assayed using a liquid scintillation counter, correcting for quenching (TRI-CARB 3110 TR, Perkin Elmer). The leucine incorporation rate was converted into bacterial production using a theoretical conversion factor of 1.55 kg C mol−1 (Simon and Azam, 1989), which has been used in previous studies conducted in the western Arctic Ocean (Kirchman et al., 2009a,b). Triplicate and one TCA-killed control were prepared for each sample. The mean coefficient of variation for triplicates was 5.7% (± standard deviation, ±3.7; n = 427).
The bacterial and viral abundances were determined using flow cytometry following Yang et al. (2010) with slight modifications. Briefly, 2 mL subsamples were transferred to 2 mL cryovials (Nalgene) and fixed by adding 100 μL 0.02 μm filtered 20% glutaraldehyde (Wako; final concentration, 1%). The fixed sample was kept in a refrigerator for 15 min, frozen in liquid nitrogen, and then stored in a deep freezer (−80°C) until analysis. In the laboratory on land, samples were thawed, diluted 10-fold with Tris–EDTA buffer (10 mmol L−1 Tris–HCl, 1 mmol L−1 EDTA, pH 8.0, Nippon Gene), and then stained with 10 μL SYBR Green l (Invitrogen; final concentration, 10−4 of commercial stock) in the dark for 10 min. The stained sample was amended with 1.0 μm reference-size beads (Molecular Probes) and injected into a flow cytometer (FACS Verse, Becton Dickinson). To determine viral abundance, samples were diluted 100-fold with TE-buffer before staining. For both bacterial and viral abundance counting, event rates were kept below 300 events s−1. Data were analyzed using BD FACSuite software (Becton Dickinson). Bacteria with high nucleic acid content were distinguished based on the intensity of green fluorescence (FL1) (Gasol and del Giorgio, 2000). Bacterial biomass was estimated by multiplying the bacterial abundance by the cell quota of 12 fg C cell−1 (Fukuda et al., 1998). Bacterial growth rate was estimated by dividing the bacterial production by the biomass. Viral abundance data for the period of 17–18 September were missing because of a failure during sample analysis.
Amino Acid Concentration and Composition
In the on-ship laboratory, 15 mL samples of seawater were transferred to 20 mL glass ampoules and stored at −20°C until analysis. In the laboratory on land, each sample was thawed and divided into two aliquots to determine dissolved total hydrolysable amino acid (DTAA) and DFAA. For DTAA, samples were hydrolyzed using the vapor-phase method according to Tsugita et al. (1987) with slight modifications. Briefly, 200 μL samples of seawater were transferred to 1 mL glass tubes and dried completely in a vacuum oven. The dried sample was placed in a hydrolysis chamber (JASCO) and exposed to the fumes of a hydrochloric acid–trifluoroacetic acid mixture at 158°C for 30 min. The hydrolyzed samples were neutralized and diluted using 1 mL Milli-Q water (Millipore). Seawater samples for determining DFAA and DTAA were injected into an ultra-high-performance liquid chromatography system equipped with a reverse-phase column (Acquity UPLC BEH C18, Waters; particle size, 1.7 μm; column size, 2.1 × 100 mm) and fluorescence detector (X-LC 3120FP, JASCO; excitation and emission wavelengths, 345 and 455 nm, respectively) after derivatization with o-phthalaldehyde (OPA; Lindroth and Mopper, 1979). The identified amino acids were aspartic acid (Asp), glutamic acid (Glu), histidine (His), serine (Ser), arginine (Arg), glycine (Gly), threonine (Thr), beta-alanine (β-Ala), alanine (Ala), tyrosine (Tyr), γ-aminobutyric acid (GABA), methionine (Met), valine (Val), phenylalanine (Phe), isoleucine (Ile), and leucine (Leu). For the DTAA analysis, asparagine (Asn) and glutamine (Gln) were quantified as Asp and Glu, respectively, because of deamination during hydrolysis. Data were analyzed using ChromNAV software (JASCO). DCAA was calculated by subtracting DFAA from DTAA. Principal component analysis (PCA) was performed to analyze the composition of DFAA and DCAA. Prior to performing the PCA analysis, the mole% of each amino acid was standardized by subtracting the mean and dividing by the standard deviation (Kaiser and Benner, 2009). Non-metric multidimensional scaling (NMDS) was also used to examine the amino acid compositional variability (Quinn and Keough, 2002). The differences in the amino acid compositions between layers (upper vs. deeper) and periods (prebloom vs. bloom) were analyzed using analysis of similarities (ANOSIM, Quinn and Keough, 2002). The degradation index (DI) for DCAA was calculated using the formula and constants presented in Table 1 of Dauwe et al. (1999). Statistical calculations were conducted using the R software package (R Core Team, 2016).
Meteorological, Hydrographical, and Other Biochemical Parameters
Meteorological, hydrographical, and other biochemical data were provided by the Japan Agency for Marine-Earth Sciences and Technology (JAMSTEC), and are available from their online database (http://www.godac.jamstec.go.jp/darwin/cruise/mirai/mr13-06_leg1/e). Surface wind speed was measured using an anemometer (KE-500, Koshin Denki) installed on the ship foremast (height, 24 m above sea surface). Water temperature was measured using a CTD sensor (SBE9plus, Sea-Bird Electronics). Transmittance was determined using a transmission meter (C-Star, WET Labs), and Chl. a concentration was determined fluorometrically (Welschmeyer, 1994).
Results
Overview of Physical and Biogeochemical Features
We first provide a brief overview of the major physical and biogeochemical features of the FPO station, which are described in greater detail in Nishino et al. (2015) and Kawaguchi et al. (2015). Throughout the FPO period, the water column was a two-layered system characterized by the presence of a strong pycnocline (σθ = 25.5–25.9) at a depth of 15–30 m (Kawaguchi et al., 2015) and low and high nutrient concentrations in the upper (defined as the layer with σθ < 25.5) and deeper layers (defined as the layer with σθ > 25.9), respectively; total inorganic nitrogen was depleted in the upper layer throughout the period (<0.15 μmol L−1) (Nishino et al., 2015). Seawater temperatures in the upper layer tended to decrease with time (from 3.2 to 1.5°C), whereas no similar trend was evident in the deeper layer (Figure 2B). A cold wind event on 14–15 September and subsequent stronger winds (>13 m s−1) during 19–22 September (Figure 2A) resulted in enhanced mixing around the pycnocline based on local turbulent activity detected using a microstructure profiler (Kawaguchi et al., 2015). This enhanced mixing coincided with increased upward nutrient fluxes, enhanced primary production, and an increase in phytoplankton biomass (Nishino et al., 2015). Chl. a concentrations were on average 1.7-fold higher during the period after 19 September relative to the preceding period (Figure 2C). Data from time-series (mainly at 24 h intervals) CTD surveys conducted in the surrounding region (30 × 30 km) of the FPO station and from stream trajectories measured using free-drifting buoys indicated that it was unlikely that the increase in Chl. a at the FPO station was attributable to the lateral advection of a different water mass from the surrounding region (Nishino et al., 2015). Rather, the results were interpreted as an indication that wind-induced physical disturbances (mixing) led to enhanced nutrient supply to the upper layer, which alleviated the nutrient limitation of phytoplankton and resulted in the occurrence of the bloom (Nishino et al., 2015). Based on these results, we hereafter divide the FPO period into the prebloom (10–18 September) and bloom periods (19–26 September). Strong winds were accompanied by enhanced currents in the deeper layer and turbulent mixing near the seafloor (Kawaguchi et al., 2015; Nishino et al., 2015). Transmittance data indicated that the benthic nepheloid layer (low transmittance layer; Thorpe, 2005) existed throughout the FPO period, with the most persistent nepheloid layer being observed between 17 and 22 September (Figure 2D), indicating that sediments were resuspended due to turbulence near the seafloor during the strong wind events.
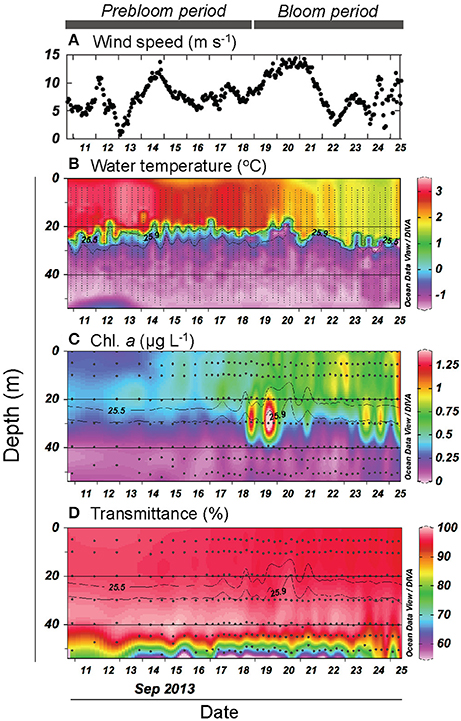
Figure 2. (A) Temporal variation in surface wind speed. Vertical and temporal variation in (B) water temperature, (C) chlorophyll a (Chl. a) concentration, and (D) transmittance. Gray contour lines indicate potential density (σθ). The contour graphs were created using Ocean Data View software (Schlitzer, 2016).
Temporal Variability in Microbial Variables and Dissolved Amino Acid Concentrations in the Upper Layer
Both bacterial abundance and production displayed a generally similar temporal pattern in the upper layer (Figures 3A,B), and were higher during the bloom than the prebloom period (Table 1). On average, bacterial abundance was 42% higher during the bloom than during the prebloom. The corresponding value for bacterial production was 29% (Table 1). Both bacterial abundance and production were positively correlated with Chl. a concentration [Pearson's r: 0.88 and 0.77 for abundance and production, respectively (p < 0.001); Figures 4A,B], whereas they were negatively correlated with water temperature [Pearson's r: −0.82 and −0.58 for abundance and production, respectively (p < 0.001)].
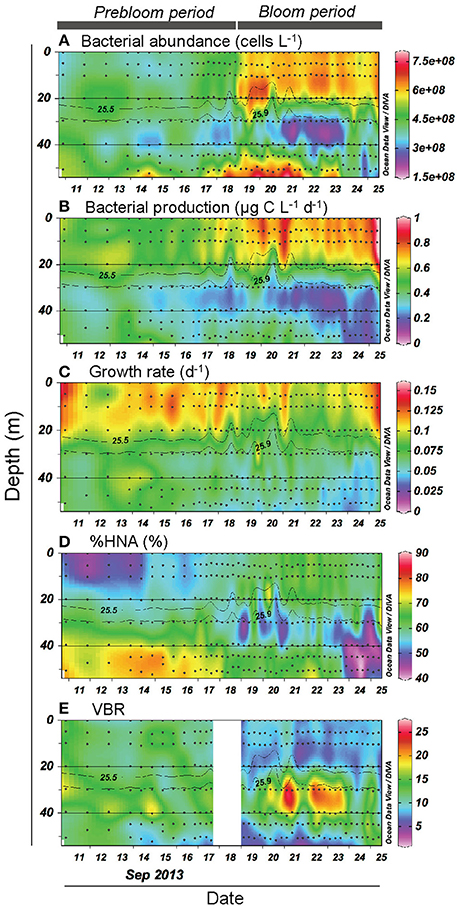
Figure 3. Vertical and temporal variation in (A) bacterial abundance, (B) bacterial production, (C) growth rate, (D) percentage of high-nucleic-acid bacteria (%HNA), and (E) viruses-to-bacteria ratio (VBR). Gray contour lines indicate potential density (σθ). The contour graphs were created using Ocean Data View software (Schlitzer, 2016).
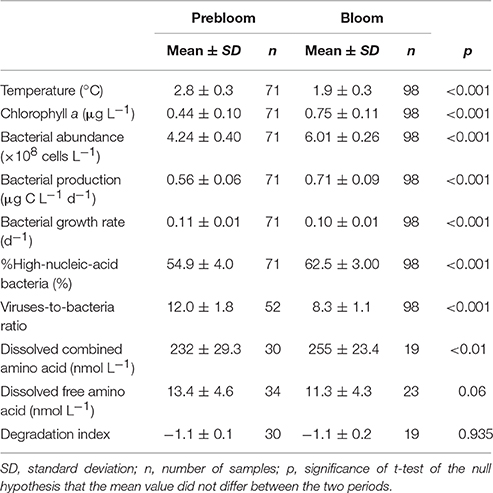
Table 1. Mean values of hydrographical, microbial, and dissolved amino acid parameters determined in the upper layer during prebloom and bloom periods.
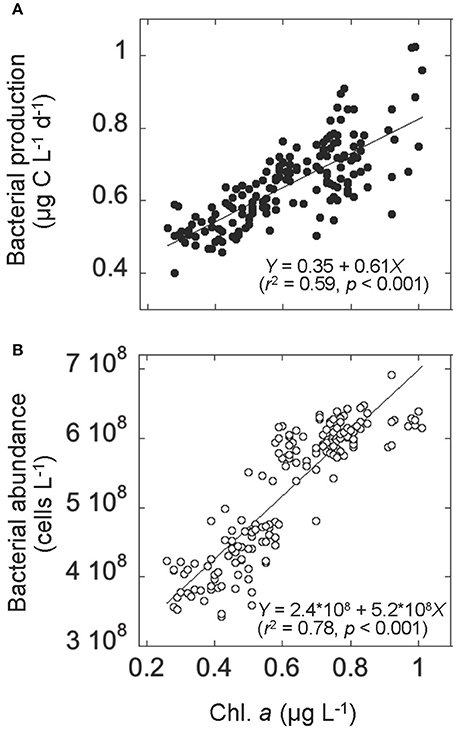
Figure 4. Relationships in the upper layer between (A) chlorophyll a (Chl. a) concentration and bacterial production and (B) Chl. a concentration and bacterial abundance. Solid lines represent the Model II regression line (Sokal and Rohlf, 1995). The corresponding regression equations with r2 (coefficient of determination), and p (significance) are also given.
Bacterial growth rate displayed a complex temporal pattern in the upper layer (Figure 3C). The mean growth rate differed only slightly (10%) between periods (Table 1). In contrast, %HNA tended to increase with time from 10 to 20 September (Figure 3D). The mean %HNA during the bloom (63%) was significantly higher than the corresponding value (55%) during the prebloom (Table 1). Viral abundance displayed no clear temporal pattern, with the extent of variability being less pronounced than that of bacterial abundance (data not shown). On average, the viruses-to-bacteria abundance ratio (VBR) during the bloom (8.3) was lower than that during the prebloom (12) (Figure 3E; Table 1).
DCAA concentrations varied over a limited range (183–307 nmol L−1) (Figure 5A). The mean DCAA concentration during the bloom (255 ± 23 nmol L−1) was significantly higher than that during the prebloom (232 ± 29 nmol L−1) (Table 1), although the difference was small. DFAA concentration displayed no clear temporal pattern (Figure 5B), and remained low (<25 nmol L−1), except for a sample collected in the surface layer on 18 September. There was no significant difference in DFAA concentration between the prebloom (13.4 ± 4.6 nmol L−1) and bloom periods (11.3 ± 4.3 nmol L−1) (Table 1).
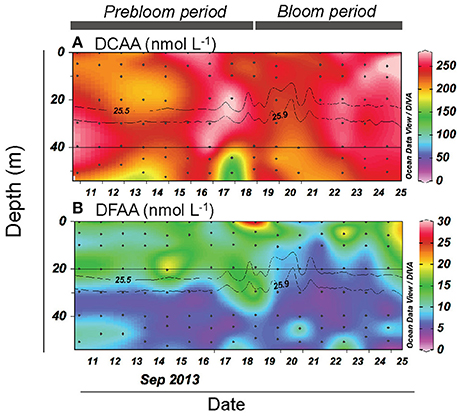
Figure 5. Vertical and temporal variation in the concentration of (A) dissolved combined amino acid (DCAA) and (B) dissolved free amino acid (DFAA). Gray contour lines indicate potential density (σθ). The contour graphs were created using Ocean Data View software (Schlitzer, 2016).
Temporal Variability in Microbial Variables and Dissolved Amino Acid Concentrations in the Deeper Layer
Bacterial abundance and production in the deeper layer were generally lower than those in the upper layer (Figures 3A,B). A notable feature was high bacterial abundance and production near the seafloor, with marked peaks observed between September 18 and 21 (Figures 3A,B). These peaks broadly coincided with strong winds (Figure 2A) and the occurrence of the benthic nepheloid layer (Figure 2D). Both bacterial abundance and production increased with increasing surface wind speed (Figures 6A,B) and decreasing transmittance (Figures 6C,D). Bacterial growth rate and %HNA tended to be high during the earlier FPO period, and then generally decreased with time (Figures 3C,D). VBR (Figure 3E) and DCAA and DFAA concentrations (Figures 5A,B) displayed no systematic temporal patterns in the deeper layer.
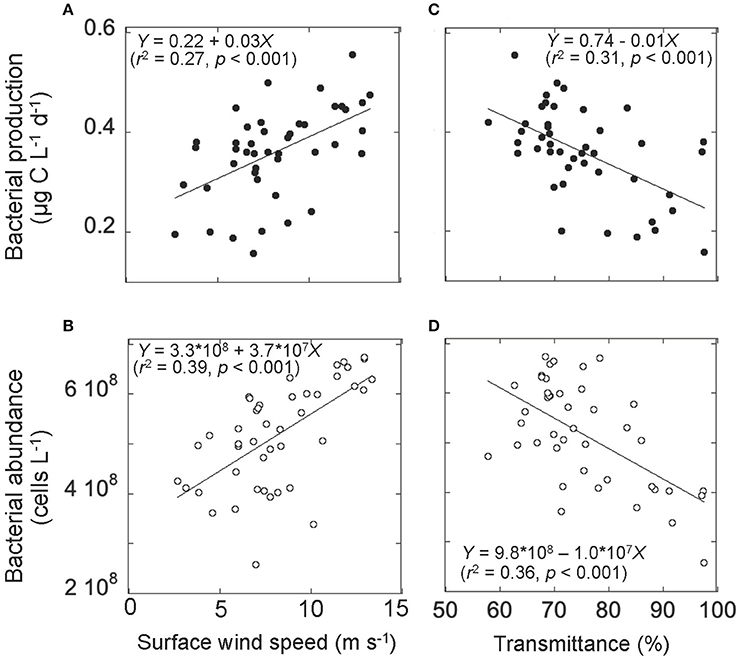
Figure 6. Relationships between (A) surface wind speed and bacterial production, (B) surface wind speed and bacterial abundance, (C) transmittance and bacterial production, and (D) transmittance and bacterial abundance. Data on transmittance and bacterial production and abundance were collected at the water layer 10 m above the seafloor. Solid lines represent the Modell II regression line (Sokal and Rohlf, 1995). The corresponding regression equations with r2 (coefficient of determination), and p (significance) are also given.
Compositional Variability of Dissolved Amino Acids
Neither the NMDS ordination nor the scaling plot of the first two components (PC1 and PC2) of the PCA for DCAA revealed clear systematic patterns in the compositional variability between the layers (upper vs. deeper layers) and the periods (prebloom vs. bloom) (data not shown). The mean percentage contributions of individual amino acids are tabulated in Table 2. Among the most abundant amino acids in DCAA were Gly (26.5%) and Ala (16.0%), followed by Asp (9.2%) and Ser (8.8%) (Table 2). In the upper layer, DI values did not differ significantly between the prebloom (−1.1 ± 0.1) and bloom periods (−1.1 ± 0.2) (Table 1). The mean DI in the upper layer (−1.1 ± 0.1) was close to the corresponding value in the deeper layer (−1.2 ± 0.2).
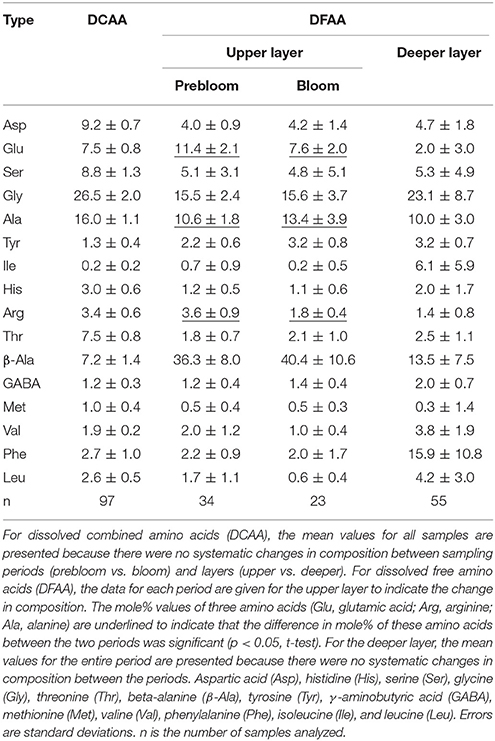
Table 2. Mole% of individual amino acids.
The DFAA compositional variability was more pronounced than that of DCAA. The PC1-PC2 plot and the NMDS ordination revealed a systematic difference in the amino acid composition between the upper and deeper layers (Supplementary Figures 1A,B). ANOSIM indicated a significant difference in the DFAA composition between the two layers (R = 0.72, p < 0.01). DFAA in the upper layer were enriched with β-Ala, Glu, Ala, and Arg compared to those in the deeper layer, whereas they were depleted in Leu, Val, and Phe, and Ile (Supplementary Figure 1A; Table 2). ANOSIM also indicated a significant difference in DFAA composition between the two periods in the upper layer (R = 0.30, p < 0.01). The percent contribution of Ala during the bloom period was significantly higher than that during the prebloom period, whereas the reverse was true for Glu and Arg (Table 2).
Discussion
Close Coupling between Primary and Bacterial Production during the Fall Bloom
Our data indicated close coupling between bacterial and primary production during the fall bloom at the FPO station. Bacterial abundance and production increased with increasing Chl. a concentration, despite a concomitant decrease in seawater temperature, providing strong evidence against the low-temperature suppression hypothesis (Hypothesis 2). Comparison of the depth-integrated (0–20 m) bacterial production with primary production, which was estimated by the 13C method with on-deck incubation of samples for 24 h (Nishino et al., 2015), supported this argument. The BP:PP ratio during the bloom was 0.14 ± 0.03, which did not differ significantly (p > 0.05) from that during the prebloom (0.14 ± 0.03) (Figure 7; Table 3). The mean ratio during the entire investigation (0.14) was comparable to the corresponding ratio typically found in lower-latitude oceans including subarctic and equatorial regions (0.1; Kirchman et al., 2009b), but it was higher than the median BP:PP ratio (0.04) derived from compilation of the data collected during four cruises conducted in basin and shelf regions of the western Arctic Ocean (~100 stations and depth profiles were examined; Kirchman et al., 2009b). This tighter relationship between primary and bacterial production at the FPO station than that reported by Kirchman et al. (2009b) might be related to the time of year for both studies [September in the present study vs. mostly May and July for the data compiled by Kirchman et al. (2009b)], and to the difference in the scale of data coverage [a fall bloom at a fixed station in the present study vs. a larger range of dates and regions in Kirchman et al. (2009b)]. Importantly, high and constant BP:PP ratios throughout the FPO period suggest that there was a closely coupled, large flow of carbon from primary producers to bacteria during the fall bloom on the Chukchi Sea Shelf (Hypothesis 1). The mean BP:PP ratio, 0.14, implies that bacterial carbon demand accounted for a high percentage (>50%) of primary production throughout the study period, assuming that the bacterial growth efficiency was about 0.2 (del Giorgio and Cole, 2000). However, further studies are needed for rigorous quantification of the bacterially driven carbon fluxes, in particular regarding the validity of the growth efficiency and the leucine-to-carbon conversion factor. The latter may vary depending on season in cold waters (Rivkin et al., 1996), and could be lower than the 1.55 kg C mol−1 conversion factor in some oligotrophic oceans (Alonso-Sáez et al., 2007).
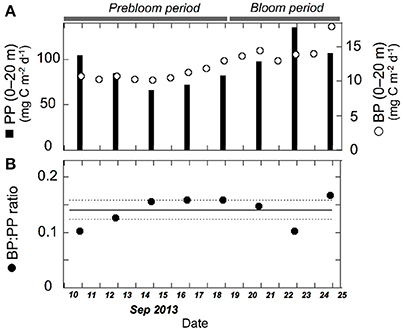
Figure 7. Temporal variation in (A) depth-integrated (0–20 m) bacterial production (open circles), primary production (filled bars), and (B) bacterial production:primary production ratio (BP:PP ratio). Solid and dashed lines indicate mean (0.14) and 95% confidence intervals (±0.02), respectively. Primary production data are from Nishino et al. (2015) and are also available from the JAMSTEC online database (see text for details). Daily bacterial production was calculated from the time-integration of multiple data obtained in a specific time interval.
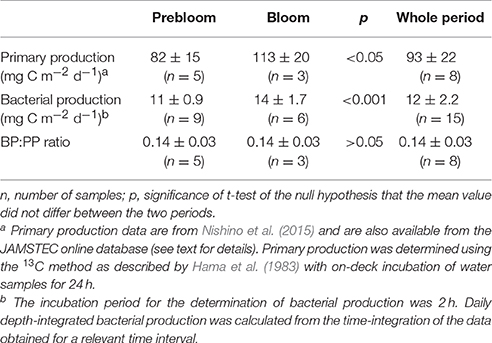
Table 3. Comparison of depth-integrated (0–20 m) primary (PP) and bacterial production (BP) during prebloom and bloom periods.
Our data on DFAA and DCAA concentrations provided further evidence indicating that bacteria coped effectively with enhanced DOM supply during the bloom. Despite the fact that blooms generally promote DFAA production (Hammer and Kattner, 1986), DFAA concentrations during the FPO period remained at remarkably low levels (on average 13.4 ± 4.6 nmol L−1 and 11.3 ± 4.3 nmol L−1 during the prebloom and bloom periods, respectively). Considering the high contribution of β-Ala (36–40% in the upper layer), which is a non-protein amino acid generally considered a degradation product not readily available for bacterial consumption (Keil et al., 2000), the levels of labile DFAA serving as bacterial substrates might be even lower. In fact, the DFAA concentrations recorded in the present study are among the lowest reported to date in surface waters of the Arctic (the lowest DFAA concentrations previously seen in the Arctic Ocean are in the order of 20 nmol L−1, as summarized in Table 4) and lower-latitude oceanic environments (typical range, 10–1000 nmol L−1, as summarized by Sarmento et al., 2013). The low DFAA concentrations imply that bacteria were highly efficient in DFAA uptake during the fall bloom on the Chukchi Sea Shelf, despite the low water temperatures. This is in agreement with Yager and Deming (1999), who reported that oligotrophic Arctic bacteria have highly efficient substrate uptake.
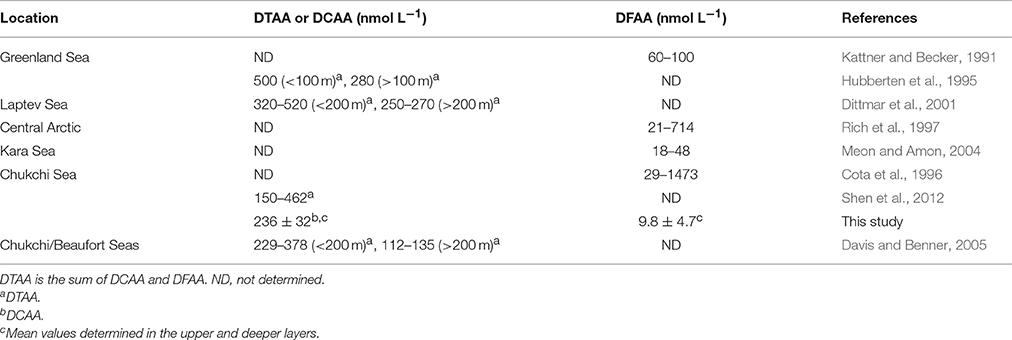
Table 4. Concentrations of dissolved combined amino acid (DCAA), dissolved free amino acid (DFAA), and dissolved total amino acid (DTAA) in the Arctic Ocean.
DFAA compositions differed between the upper and deeper layers and varied over time in the upper layer, which is considered to be due to the fact that the release and assimilation of DFAA are compound-specific (Sarmento et al., 2013). Sarmento et al. (2013) found that Micromonas pusilla (Prasinophyceae), a picoeukaryotic alga abundantly found in Arctic waters (Lovejoy et al., 2007), excreted large quantities of Ala. Our data showing a high %Ala during the bloom period might be a consequence of the high release of Ala by M. pusilla or other algal species making up the bloom. In contrast with DFAA, DCAA compositions varied little with depth and over time. The DCAA composition at the FPO station was characterized by a high mol% of Gly, Ala, and Asp, which is similar to the DTAA composition observed on the Chukchi Sea Shelf and western Canada Basin during the spring and summer of 2002 (Davis and Benner, 2005). The mean DI (Dauwe et al., 1999) calculated for the DCAA at the FPO station was −1.1. This value is similar to the DI previously reported for DCAA collected in the Chukchi Sea (−1.2 to −0.89; Davis and Benner, 2005), but much lower than that determined for DCAA freshly produced from plankton (0.46–1.5; Dauwe et al., 1999; Davis and Benner, 2005). These results indicate that the DCAA at the FPO station was in the advanced degradation state, and primarily composed of less-degradable components, independent of time and depth. Given that fresh DCAA can be abundantly released during blooms via excretion by phytoplankton and other processes associated with viral lysis and grazing (Nagata, 2000; Bronk, 2002), our results indicate that DCAA production and bacterial consumption were closely coupled. We propose that the release of fresh, labile DCAA during the bloom was closely balanced by rapid hydrolysis and assimilation of labile DCAA by bacteria, with the concentration and molecular compositions of bulk DCAA pool remaining constant. Future studies are required to test the validity of this model and to explore the physiological and molecular bases of DOM-bacteria coupling during blooms (Buchan et al., 2014).
Role of Bottom-Up and Top-Down Factors Affecting Bacterial Abundance and Production during the Bloom
The bacterial growth rate in the upper layer differed little between the prebloom and bloom periods. At first glance, this contradicts the theory that bacterial activity was enhanced by DOM supply during the bloom. However, note that the growth rate, as determined from bacterial production and biomass, represents a bulk property of a bacterial community that can be composed of diverse subpopulations with different activity states, ranging from dormant to highly active cells (del Giorgio and Gasol, 2008). Thus, the bulk growth rate might be insufficiently sensitive to reflect the response of active subpopulations to enhanced DOM supply during the bloom. Additionally, the variability in the leucine-to-carbon conversion factor over time (Rivkin et al., 1996), which was not considered in our study, might also introduce errors into the estimates of bacterial growth rates. Another physiological indicator of the bacterial community is %HNA, which generally increases with an increase in organic matter supply in marine environments, although other factors may also affect it (del Giorgio and Gasol, 2008). Cuevas et al. (2011) reported that the addition of a labile organic substrate (glucose) to pelagic seawater samples collected in Arctic waters resulted in increased %HNA. Our data showing that %HNA was significantly higher during the bloom than before the bloom indicates the response of bacterial subpopulations to enhanced DOM supply during the bloom (bottom-up control). Viral lysis and grazing (top-down control) can also affect bacterial abundance and production (Anderson and Rivkin, 2001; Yager et al., 2001). VBR in the upper layer was significantly lower during the bloom relative to the prebloom period, suggesting that the viral lytic pressure was alleviated during the bloom. Although there were no data on bacterivorous grazers at the FPO station, the elevation of bacterial abundance during the bloom might partly reflect low grazing pressure in cold waters (Rose and Caron, 2007).
Bacterial Response to Wind-Induced Sediment Resuspension in the Deeper Layer
Despite persistently cold (−1.5 to −0.4°C) seawater temperatures, bacterial abundance, production, and %HNA varied significantly in the deeper layer. Of particular interest is the high bacterial abundance and production in the layer near the seafloor during the strong wind events, concomitant with decreasing transmittance. These results indicate that wind-induced sediment resuspension led to an increase in bacterial abundance and production in the water column because bacteria and organic matter associated with sediments, as well as those contained in sedimentary interstitial waters, or both, are introduced to the water column. The physical processes responsible for the wind-induced resuspension during the FPO have been discussed by Kawaguchi et al. (2015), who suggested that wind-induced barotropic current (uniform flow throughout the water column), as evidenced by the rapid movement (4 km d−1) of bottom water, led to enhanced turbulence above the seafloor. Their results are consistent with previous findings that, in the Chukchi Sea Shelf, wind stress can induce barotropic current, with a response time of no more than a few days (Winsor and Chapman, 2004), and that, in general, the barotropic current can produce strong vertical shear in the bottom boundary layer (Thorpe, 2005). Our data are among the first to provide the field evidence on closely coupled response of bacterial production to wind-induced sediment resuspension on the Arctic shelf. Generally, the sites and rates of organic matter remineralization and nutrient cycles are significantly affected by sediment resuspension in shallow regions (Wainright, 1987; Wainright and Hopkinson, 1997), although the extent and nature of the biogeochemical effects depend on the environmental setting (Arnosti and Holmer, 2003). Thus, our finding has important implications for enhancing models of the biogeochemical consequences of the extension of the ice-free period and more frequent exposure of the sea surface to strong wind events on Arctic shelves.
Conclusions
Our data collected during the FPO indicated that bacterial production was closely coupled with primary production during a wind-induced fall bloom on the Chukchi Sea Shelf, and that wind-driven resuspension of sediments resulted in enhanced bacterial abundance and production near the seafloor. These results provide novel insights into the pending question concerning the response of the microbial loop to the increased organic matter supply in perennially cold polar waters (Pomeroy and Deibel, 1986; Kirchman et al., 2009b). Our results also have broad implications for emerging discussion on future changes in ecosystem and biogeochemical cycles in the Arctic Ocean. The Chukchi Sea Shelf is characterized by its strong interactions with surrounding basins (Carmack and Wassmann, 2006; Bates et al., 2011). The prominent features of these interactions include the ventilation of the upper halocline of the Arctic Ocean (Woodgate et al., 2005) and the lateral transport of organic matter produced in the productive shelf to the oligotrophic Canada Basin (Davis and Benner, 2007; Uchimiya et al., 2013; Watanabe et al., 2014; Yamada et al., 2015). The impacts of fall wind events, which are predicted to increase with the extension of the ice-free period (Ardyna et al., 2014), on bacterial processes and organic matter dynamics on the Chukchi Sea Shelf could have extensive influences on the biogeochemical cycles and ecosystem dynamics in broader regions of the Arctic Ocean.
Author Contributions
MU and TN designed the study and analyzed the data. SN, JI, and YK organized the fixed-point observation and collected the hydrographical and biogeochemical data. MU and CM performed the microbial and biogeochemical sampling. MU and HO performed the amino acid analyses. MU analyzed the microbiological samples. All of the authors contributed to the preparation of the manuscript.
Conflict of Interest Statement
The authors declare that the research was conducted in the absence of any commercial or financial relationships that could be construed as a potential conflict of interest.
The reviewer BC declared a shared affiliation, though no other collaboration, with several of the authors SN, YK, and JI to the handling Editor, who ensured that the process nevertheless met the standards of a fair and objective review.
Acknowledgments
We thank the captain and crew of R/V Mirai, the researchers onboard, and the staff of Global Ocean Development Inc. and Marine Works Japan for their assistance during the MR13–06 cruise. H. Takeda created the map in Figure 1. N. Saotome assisted in amino acid analyses. T. Hirawake, R. Futsuki, and A. Fujiwara supported primary production measurements. Constructive comments provided by J. Leichter and H. Kaneko on hydrographical data analyses, and M. Simon and K. Y. Børsheim on bacterial parameters significantly aided the preparation of this manuscript. This study was carried out as part of the GRENE Arctic Climate Change Research Project (Project No. 6, coordinated by T. Kikuchi) and supported by JSPS KAKENHI Grant Numbers 24241003 and 15H01725 awarded to TN and 24121003 awarded to HO. We are grateful to the Editor and two reviewers for their productive comments on our manuscript.
Supplementary Material
The Supplementary Material for this article can be found online at: https://www.frontiersin.org/article/10.3389/fmars.2016.00231/full#supplementary-material
Abbreviations
FPO, fixed-point observation.
References
Alonso-Sáez, L., Gasol, J. M., Arístegui, J., Vilas, J. C., Vaqué, D., Duarte, C. M., et al. (2007). Large-scale variability in surface bacterial carbon demand and growth efficiency in the subtropical northeast Atlantic Ocean. Limnol. Oceanogr. 52, 533–546. doi: 10.4319/lo.2007.52.2.0533
Alonso-Sáez, L., Zeder, M., Harding, T., Pernthaler, J., Lovejoy, C., Bertilsson, S., et al. (2014). Winter bloom of a rare betaproteobacteriurn in the Arctic Ocean. Front. Microbiol. 5:425. doi: 10.3389/fmicb.2014.00425
Anderson, M. R., and Rivkin, R. B. (2001). Seasonal patterns in grazing mortality of bacterioplankton in polar oceans: a bipolar comparison. Aquat. Microb. Ecol. 25, 195–206. doi: 10.3354/ame025195
Ardyna, M., Babin, M., Gosselin, M., Devred, E., Rainville, L., and Tremblay, J. E. (2014). Recent Arctic Ocean sea-ice loss triggers novel fall phytoplankton blooms. Geophys. Res. Lett. 41, 6207–6212. doi: 10.1002/2014gl061047
Arnosti, C., and Holmer, M. (2003). Carbon cycling in a continental margin sediment: contrasts between organic matter characteristics and remineralization rates and pathways. Estuar. Coast. Shelf Sci. 58, 197–208. doi: 10.1016/S0272-7714(03)00077-5
Arrigo, K. R., and van Dijken, G. L. (2011). Secular trends in Arctic Ocean net primary production. J. Geophys. Res. Oceans 116:C09011. doi: 10.1029/2011JC007151
Bates, N. R., Cai, W. J., and Mathis, J. T. (2011). The ocean carbon cycle in the western Arctic Ocean: Distributions and air-sea fluxes of carbon dioxide. Oceanography 24, 186–201. doi: 10.5670/oceanog.2011.71
Bird, D. F., and Karl, D. M. (1999). Uncoupling of bacteria and phytoplankton during the austral spring bloom in Gerlache Strait, Antarctic Peninsula. Aquat. Microb. Ecol. 19, 13–27. doi: 10.3354/ame019013
Børsheim, K. Y., and Drinkwater, K. F. (2014). Different temperature adaptation in Arctic and Atlantic heterotrophic bacteria in the Barents Sea Polar Front region. J. Mar. Syst. 130, 160–166. doi: 10.1016/J.Jmarsys.2012.09.007
Bronk, D. A. (2002). “Dynamics of DON,” in Biogeochemistry of Marine Dissolved Organic Matter, eds D. A. Hansell and C. A. Carlson (San Diego, CA: Academic Press), 153–247.
Brum, J. R., Hurwitz, B. L., Schofield, O., Ducklow, H. W., and Sullivan, M. B. (2016). Seasonal time bombs: dominant temperate viruses affect Southern Ocean microbial dynamics. ISME J. 10, 437–449. doi: 10.1038/ismej.2015.125
Buchan, A., LeCleir, G. R., Gulvik, C. A., and González, J. M. (2014). Master recyclers: features and functions of bacteria associated with phytoplankton blooms. Nat. Rev. Microbiol. 12, 686–698. doi: 10.1038/nrmicro3326
Carmack, E., and Wassmann, P. (2006). Food webs and physical-biological coupling on pan-Arctic shelves: unifying concepts and comprehensive perspectives. Prog. Oceanogr. 71, 446–477. doi: 10.1016/J.Pocean.2006.10.004
Cota, G. F., Pomeroy, L. R., Harrison, W. G., Jones, E. P., Peters, F., Sheldon, W. M., et al. (1996). Nutrients, primary production and microbial heterotrophy in the southeastern Chukchi Sea: Arctic summer nutrient depletion and heterotrophy. Mar. Ecol. Prog. Ser. 135, 247–258.
Cuevas, L. A., Egge, J. K., Thingstad, T. F., and Topper, B. (2011). Organic carbon and mineral nutrient limitation of oxygen consumption, bacterial growth and efficiency in the Norwegian Sea. Polar Biol. 34, 871–882. doi: 10.1007/s00300-010-0944-3
Dauwe, B., Middelburg, J. J., Herman, P. M. J., and Heip, C. H. R. (1999). Linking diagenetic alteration of amino acids and bulk organic matter reactivity. Limnol. Oceanogr. 44, 1809–1814.
Davis, J., and Benner, R. (2005). Seasonal trends in the abundance, composition and bioavailability of particulate and dissolved organic matter in the Chukchi/Beaufort Seas and western Canada Basin. Deep Sea Res. II 52, 3396–3410. doi: 10.1016/J.Dsr2.2005.09.006
Davis, J., and Benner, R. (2007). Quantitative estimates of labile and semi-labile dissolved organic carbon in the western Arctic Ocean: a molecular approach. Limnol. Oceanogr. 52, 2434–2444. doi: 10.4319/lo.2007.52.6.2434
del Giorgio, P. A., and Cole, J. J. (2000). “Bacterial energetics and growth efficiency,” in Microbial Ecology of the Oceans, ed D. L. Kirchman (New York, NY: Willy-Liss), 289–325.
del Giorgio, P. A., and Gasol, J. M. (2008). “Physiological structure and single-cell activity in marine bacterioplankton,” in Microbial Ecology of the Oceans, 2nd Edn., ed D. L. Kirchman (Hoboken, NJ: John Wiley and Sons), 243–298.
Dittmar, T., Fitznar, H. P., and Kattner, G. (2001). Origin and biogeochemical cycling of organic nitrogen in the eastern Arctic Ocean as evident from D- and L-amino acids. Geochim. Cosmochim. Acta 65, 4103–4114. doi: 10.1016/S0016-7037(01)00688-3
Fukuda, R., Ogawa, H., Nagata, T., and Koike, I. (1998). Direct determination of carbon and nitrogen contents of natural bacterial assemblages in marine environments. Appl. Environ. Microbiol. 64, 3352–3358.
Gasol, J. M., and del Giorgio, P. A. (2000). Using flow cytometry for counting natural planktonic bacteria and understanding the structure of planktonic bacterial communities. Sci. Mar. 64, 197–224. doi: 10.3989/scimar.2000.64n2197
Hama, T., Miyazaki, T., Ogawa, Y., Iwakuma, T., Takahashi, M., Otsuki, A., et al. (1983). Measurement of photosynthetic production of a marine phytoplankton population using a stable 13C isotope. Mar. Biol. 73, 31–36.
Hammer, K. D., and Kattner, G. (1986). Dissolved free amino acids in the marine environment: a carbon to nitrogen ratio shift during diatom blooms. Mar. Ecol. Prog. Ser. 31, 35–45. doi: 10.3354/meps031035
Hoegh-Guldberg, O., and Bruno, J. F. (2010). The impact of climate change on the world's marine ecosystems. Science 328, 1523–1528. doi: 10.1126/Science.1189930
Hubberten, U., Lara, R. J., and Kattner, G. (1995). Refractory organic compounds in polar waters: relationship between humic substances and amino acids in the Arctic and Antarctic. J. Mar. Res. 53, 137–149. doi: 10.1357/0022240953213322
Inoue, J., Yamazaki, A., Ono, J., Dethloff, K., Maturilli, M., Neuber, R., et al. (2015). Additional Arctic observations improve weather and sea-ice forecasts for the Northern Sea Route. Sci. Rep. 5:16868. doi: 10.1038/srep16868
Kaiser, K., and Benner, R. (2009). Biochemical composition and size distribution of organic matter at the Pacific and Atlantic time-series stations. Mar. Chem. 113, 63–77. doi: 10.1016/j.marchem.2008.12.004
Kattner, G., and Becker, H. (1991). Nutrients and organic nitrogenous compounds in the marginal ice zone of the Fram Strait. J. Mar. Syst. 2, 385–394.
Kawaguchi, Y., Nishino, S., and Inoue, J. (2015). Fixed-point observation of mixed layer evolution in the seasonally ice-free Chukchi Sea: turbulent mixing due to gale winds and internal gravity waves. J. Phys. Oceanogr. 45, 836–853. doi: 10.1175/Jpo-D-14-0149.1
Keil, R. G., Tsamakis, E., and Hedges, J. I. (2000). “Early diagenesis of particulate amino acids in marine systems,” in Perspectives in Amino Acid and Protein Geochemistry, eds G. A. Goodfriend, M. J. Collins, M. L. Fogel, S. A. Macko, and J. F. Wehmiller (New York, NY: Oxford University Press), 69–82.
Kirchman, D. L. (2001). “Measuring of bacterial biomass production and growth rates from leucine incorporation in natural aquatic environments,” in Methods in Microbiology, ed J. H Paul (San Diego, CA: Academic Press), 227–237.
Kirchman, D. L., Hill, V., Cottrell, M. T., Gradinger, R., Malmstrom, R. R., and Parker, A. (2009a). Standing stocks, production, and respiration of phytoplankton and heterotrophic bacteria in the western Arctic Ocean. Deep Sea Res. II 56, 1237–1248. doi: 10.1016/J.Dsr2.2008.10.018
Kirchman, D. L., Morán, X. A. G., and Ducklow, H. (2009b). Microbial growth in the polar oceans - role of temperature and potential impact of climate change. Nat. Rev. Microbiol. 7, 451–459. doi: 10.1038/Nrmicro2115
Kwok, R., Cunningham, G. F., Wensnahan, M., Rigor, I., Zwally, H. J., and Yi, D. (2009). Thinning and volume loss of the Arctic Ocean sea ice cover: 2003–2008. J. Geophys. Res. 114:C07005. doi: 10.1029/2009JC005312
Lindroth, P., and Mopper, K. (1979). High performance liquid chromatographic determination of subpicomole amounts of amino acids by precolumn fluorescence derivatization with o-phthaldialdehyde. Anal. Chem. 51, 1667–1674. doi: 10.1021/ac50047a019
Lovejoy, C., Vincent, W. F., Bonilla, S., Roy, S., Martineau, M. J., Terrado, R., et al. (2007). Distribution, phylogeny, and growth of cold-adapted picoprasinophytes in Arctic seas. J. Phycol. 43, 78–89. doi: 10.1111/j.1529-8817.2006.00310.x
Meon, B., and Amon, R. M. W. (2004). Heterotrophic bacterial activity and fluxes of dissolved free amino acids and glucose in the Arctic rivers Ob, Yenisei and the adjacent Kara Sea. Aquat. Microb. Ecol. 37, 121–135. doi: 10.3354/ame037121
Nagata, T. (2000). “Production mechanisms of dissoved organic matter,” in Microbial Ecology of the Oceans, ed D. L. Kirchman (New York, NY: Willey-Liss), 121–152.
Nishino, S., Kawaguchi, Y., Inoue, J., Hirawake, T., Fujiwara, A., Futsuki, R., et al. (2015). Nutrient supply and biological response to wind-induced mixing, inertial motion, internal waves, and currents in the northern Chukchi Sea. J. Geophys. Res. Oceans 120, 1975–1992. doi: 10.1002/2014jc010407
Pomeroy, L. R., and Deibel, D. (1986). Temperature regulation of bacterial activity during the spring bloom in Newfoundland coastal waters, Science 233, 359–361.
Quinn, G. P., and Keough, M. J. (2002). Experimental Design and Data Analysis for Biologists. Cambridge: Cambridge University Press.
Rainville, L., Lee, C. M., and Woodgate, R. A. (2011). Impact of wind-driven mixing in the Arctic Ocean. Oceanography 24, 136–145. doi: 10.5670/oceanog.2011.65
R Core Team (2016). R: A Language and Environment for Statistical Computing. Vienna: R Foundation for Statistical Computing. Available online at: https://www.R-project.org/
Rich, J., Gosselin, M., Sherr, E., Sherr, B., and Kirchman, D. L. (1997). High bacterial production, uptake and concentrations of dissolved organic matter in the Central Arctic Ocean. Deep Sea Res. II 44, 1645–1663.
Rivkin, R. B., Anderson, M. R., and Lajzerowicz, C. (1996). Microbial processes in cold oceans. I. Relationship between temperature and bacterial growth rate. Aquat. Microb. Ecol. 10, 243–254.
Rose, J. M., and Caron, D. A. (2007). Does low temperature constrain the growth rates of heterotrophic protists? Evidence and implications for algal blooms in cold waters. Limnol. Oceanogr. 52, 886–895. doi: 10.4319/lo.2007.52.2.0886
Sarmento, H., Romera-Castillo, C., Lindh, M., Pinhassi, J., Sala, M. M., Gasol, J. M., et al. (2013). Phytoplankton species-specific release of dissolved free amino acids and their selective consumption by bacteria. Limnol. Oceanogr. 58, 1123–1135. doi: 10.4319/lo.2013.58.3.1123
Schlitzer R. (2016). Ocean Data View. Available online at: http://odv.awi.de
Shen, Y., Fichot, C. G., and Benner, R. (2012). Dissolved organic matter composition and bioavailability reflect ecosystem productivity in the Western Arctic Ocean. Biogeosciences 9, 4993–5005. doi: 10.5194/bg-9-4993-2012
Simon, M., and Azam, F. (1989). Protein content and protein synthesis rates of planktonic marine bacteria. Mar. Ecol. Prog. Ser. 51, 201–213.
Sokal, R. R., and Rohlf, F., J. (1995). Biometry: The Principles and Practices of Statistics in Biological Research, 3rd Edn. New York, NY: WH Freman and company.
Stroeve, J., Holland, M. M., Meier, W., Scambos, T., and Serreze, M. (2007). Arctic sea ice decline: faster than forecast. Geophys. Res. Lett. 34:L09501. doi: 10.1029/2007GL029703
Tsugita, A., Uchida, T., Mewes, H. W., and Ataka, T. (1987). A rapid vapor-phase acid (hydrochloric acid and trifluoroacetic acid) hydrolysis of peptide and protein. J. Biochem. 102, 1593–1597.
Uchimiya, M., Fukuda, H., Nishino, S., Kikuchi, T., Ogawa, H., and Nagata, T. (2013). Vertical distribution of prokaryote production and abundance in the mesopelagic and bathypelagic layers of the Canada Basin, western Arctic: implications for the mode and extent of organic carbon delivery. Deep Sea Res. I 71, 103–112. doi: 10.1016/J.Dsr.2012.10.001
Wainright, S. C. (1987). Stimulation of heterotrophic microplankton production by resuspended marine sediments. Science 238, 1710–1712. doi: 10.1126/Science.238.4834.1710
Wainright, S. C., and Hopkinson, C. S. (1997). Effects of sediment resuspension on organic matter processing in coastal environments: a simulation model. J. Mar. Syst. 11, 353–368. doi: 10.1016/S0924-7963(96)00130-3
Wassmann, P., Duarte, C. M., Agusti, S., and Sejr M. K. (2011). Footprints of climate change in the Arctic marine ecosystem. Glob. Change Biol. 17, 1235–1249. doi: 10.1111/j.1365-2486.2010.02311.x
Watanabe, E., Onodera, J., Harada, N., Honda, M. C., Kimoto, K., Kikuchi, T., et al. (2014). Enhanced role of eddies in the Arctic marine biological pump. Nat. Commun. 5:3950. doi: 10.1038/ncomms4950
Welschmeyer, N. A. (1994). Fluorometric analysis of chlorophyll a in the presence of chlorophyll b and pheopigments. Limnol. Oceanogr. 39, 1985–1992.
Winsor, P., and Chapman, D. C. (2004). Pathways of Pacific water across the Chukchi Sea: a numerical model study. J. Geophys. Res. Oceans 109:C03002. doi: 10.1029/2003JC001962
Woodgate, R. A., Aagaard, K., Swift, J. H., Falkner, K. K., and Smethie, W. M. (2005). Pacific ventilation of the Arctic Ocean's lower halocline by upwelling and diapycnal mixing over the continental margin. Geophys. Res. Lett. 32:L18609. doi: 10.1029/2005gl023999
Yager, P. L., Connelly, T. L., Mortazavi, B., Wommack, K. E., Bano, N., Bauer, J. E., et al. (2001). Dynamic bacterial and viral response to an algal bloom at subzero temperatures. Limnol. Oceanogr. 46, 790–801. doi: 10.4319/lo.2001.46.4.0790
Yager, P. L., and Deming, J. W. (1999). Pelagic microbial activity in an arctic polynya: testing for temperature and substrate interactions using a kinetic approach. Limnol. Oceanogr. 44, 1882–1893.
Yamada, Y., Fukuda, H., Uchimiya, M., Motegi, C., Nishino, S., Kikuchi, T., et al. (2015). Localized accumulation and a shelf-basin gradient of particles in the Chukchi Sea and Canada Basin, western Arctic. J. Geophys. Res. Oceans 120, 4638–4653. doi: 10.1002/2015jc010794
Keywords: Arctic ocean, heterotrophic bacteria, phytoplankton bloom, sedimentary resuspension, wind-induced event
Citation: Uchimiya M, Motegi C, Nishino S, Kawaguchi Y, Inoue J, Ogawa H and Nagata T (2016) Coupled Response of Bacterial Production to a Wind-Induced Fall Phytoplankton Bloom and Sediment Resuspension in the Chukchi Sea Shelf, Western Arctic Ocean. Front. Mar. Sci. 3:231. doi: 10.3389/fmars.2016.00231
Received: 29 August 2016; Accepted: 31 October 2016;
Published: 22 November 2016.
Edited by:
Hongbin Liu, The Hong Kong University of Science and Technology, Hong KongReviewed by:
Bingzhang Chen, Japan Agency for Marine-Earth Science and Technology, JapanDave Kirchman, University of Delaware, USA
Copyright © 2016 Uchimiya, Motegi, Nishino, Kawaguchi, Inoue, Ogawa and Nagata. This is an open-access article distributed under the terms of the Creative Commons Attribution License (CC BY). The use, distribution or reproduction in other forums is permitted, provided the original author(s) or licensor are credited and that the original publication in this journal is cited, in accordance with accepted academic practice. No use, distribution or reproduction is permitted which does not comply with these terms.
*Correspondence: Mario Uchimiya, mario.uchimiya@riken.jp
Toshi Nagata, nagata@aori.u-tokyo.ac.jp
†Present Address: Mario Uchimiya, RIKEN Center for Sustainable Resource Science, Yokohama, Japan