Ammonia Oxidation in the Ocean Can Be Inhibited by Nanomolar Concentrations of Hydrogen Peroxide
 Bradley B. Tolar1,2*†
  Leanne C. Powers2†
  William L. Miller2
  Natalie J. Wallsgrove3
  Brian N. Popp3
  James T. Hollibaugh1,2*
- 1Department of Microbiology, University of Georgia, Athens, GA, USA
- 2Department of Marine Sciences, University of Georgia, Athens, GA, USA
- 3Department of Geology and Geophysics, University of Hawai‘i, Honolulu, HI, USA
Marine Thaumarchaeota were discovered over 20 years ago and although a few isolates from this group are now available for study, we do not yet understand the environmental controls on their growth and distribution. Thaumarchaeotes oxidize ammonia to nitrite, mediating a key step in the global nitrogen cycle, and it is estimated that about 20% of all prokaryotic cells in the ocean belong to this phylum. Despite their almost ubiquitous distribution, marine Thaumarchaeota are rarely abundant in open-ocean surface (<100 m) waters. We tested the hypothesis that this vertical distribution is driven by reactive oxygen species (ROS), specifically H2O2, generated by photochemical and biological processes—“indirect photoinhibition” rather than light inhibition as previously postulated for ammonia-oxidizing Archaea. Here we show that H2O2 can be surprisingly toxic to Thaumarchaeota from the Southern Ocean, with ammonia oxidation inhibited by additions of as little as 10 nM H2O2, while temperate Thaumarchaeota ecotypes were more tolerant. This sensitivity could explain the seasonal disappearance of Thaumarchaeota from polar surface waters and the increase in ammonia oxidation rates with depth commonly observed in marine environments. Our results highlight the need for further physiological studies of Thaumarchaeota, and indicate that ROS sensitivity could be used as a characteristic for dividing the group into meaningful ecotypes.
Introduction
Photoinhibition has been hypothesized to reduce ammonia oxidation (AO), the first step of nitrification, in both ammonia-oxidizing Bacteria (AOB; Hooper and Terry, 1973; Olson, 1981; Ward, 1985; Horrigan and Springer, 1990) and Archaea (AOA; Murray et al., 1998, 1999a; Church et al., 2003; Qin et al., 2014). Nitrification links key processes within the nitrogen cycle (e.g., nutrient regeneration, assimilation, respiration) by converting the most reduced form of inorganic N (ammonium) into the most oxidized (nitrate), which can be denitrified and removed from the pool of fixed N (Ward, 2011). Early measurements of nitrification revealed reduced or undetectable rates in surface waters (Alleman et al., 1987), which were attributed to light sensitivity of AOB. AOA are now generally regarded as the dominant ammonia-oxidizing organisms (AOO) in the ocean (e.g., Wuchter et al., 2006; Francis et al., 2007; Mincer et al., 2007; Prosser and Nicol, 2008; Santoro et al., 2010; Ward, 2011; Tolar et al., 2013) and belong to the Marine Group I Archaea, now classified as Thaumarchaeota (Spang et al., 2010). However, Thaumarchaeota do not typically achieve high abundances in the surface ocean (Karner et al., 2001; Mincer et al., 2007), with notable exceptions during winter at higher latitudes and in polar regions (Murray et al., 1998, 1999a; Church et al., 2003; Wuchter et al., 2006). Attempts to explain these patterns have focused primarily on competition with Bacteria or phytoplankton and on light inhibition (Murray et al., 1999a; Church et al., 2003; Wells and Deming, 2003; Merbt et al., 2012; Smith et al., 2014b). However, most of these theories are derived from negative correlations between environmental variables and abundance. In the Southern Ocean, Thaumarchaeota populations decrease dramatically—especially in surface waters (Church et al., 2003)—as irradiance increases during the transition from winter to summer (Murray et al., 1998). This could indicate that photoinhibition or a product of increased irradiance (such as reactive oxygen species, or ROS) affects Thaumarchaeota and, perhaps, nitrification in general, as AOB have also been shown to be sensitive to light (Hooper and Terry, 1973; Olson, 1981; Ward, 1985; Horrigan and Springer, 1990).
The photochemical production of ROS [e.g., H2O2, superoxide, singlet oxygen, and hydroxyl radical; (Imlay, 2008)] proceeds at significant rates in sunlit surface waters (Figures 1A–D), creating a daily, ubiquitous increase in ROS concentration of 1–2 orders of magnitude. Of these ROS species, H2O2 has the longest half-life (Kieber et al., 2003, and references therein; Powers and Miller, 2014). H2O2 is primarily introduced by photochemical reactions with colored dissolved organic matter (CDOM; Figure 1B; Cooper et al., 1994; Blough and Zepp, 1995); rates of this production vary with solar irradiance, temperature, and [CDOM], but generally range from 9 to 134 nM h−1 in marine systems (reviewed in Kieber et al., 2003). Superoxide () also reacts with trace metals (Figure 1B) to produce H2O2; reactions with Cu(I) can proceed rapidly with rate constants (k) on the order of 2 × 10⁹ M−1 s−1 (Zafiriou et al., 1998), although [Cu(I)] is relatively low (~0.1 nM; Moffett and Zika, 1988). Other sources include atmospheric input through fluxes at the air-sea interface (0.09–4.0 nM h−1; Thompson and Zafiriou, 1983) and rain (Figure 1C), which can rapidly increase surface water [H2O2] due to its high concentration (8.4–82 μM; Zika et al., 1982; Cooper et al., 1987) relative to seawater (<10 nM–4.5 μM; Kieber et al., 2003). There are also biological sources of ROS; phytoplankton produce H2O2 as part of their metabolism during photosynthesis and respiration (Figure 1A; Palenik et al., 1987; Zepp et al., 1987; Palenik and Morel, 1988) up to 0.46 nmol h−1 cell−1 (Twiner and Trick, 2000), though some pathways are not directly linked to photosynthesis. Extracellular biological ROS production ( and H2O2, specifically; Figure 1D) in the absence of light has also been observed, with rates 0.01–11 nM h−1 (Palenik and Morel, 1988; Moffett and Zafiriou, 1990; Roe et al., 2016) that have been attributed to microorganisms such as heterotrophic bacteria and phytoplankton (Palenik et al., 1987; Rose et al., 2008; Diaz et al., 2013).
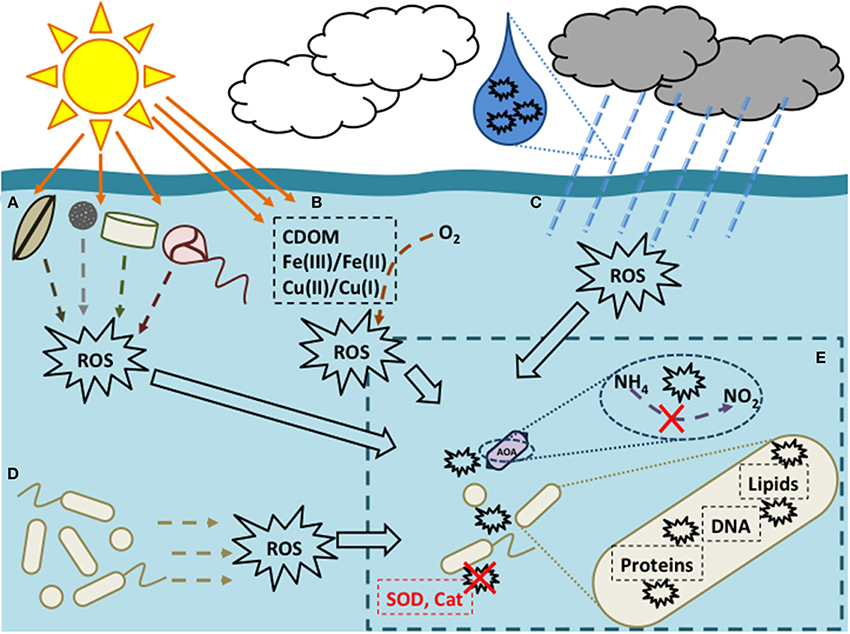
Figure 1. Sources (A–D) and effects (E) of reactive oxygen species (ROS) in marine environments. ROS (here, superoxide and hydrogen peroxide) can be introduced in surface waters (Kieber et al., 2003) via (A) phytoplankton as by-products of photosynthesis, (B) photochemical reactions of colored dissolved organic matter (CDOM) and metals, (C) atmosphere exchange and rain, and (D) production by heterotrophic bacteria (beige). Inset (E) gives a cellular-level view of ROS toxicity: when prokaryotic cells come into contact with ROS, molecules such as DNA, protein, and lipids can become damaged unless enzymes like superoxide dismutase (SOD) or catalase (Cat) are produced to detoxify ROS (Imlay, 2008; detoxification indicated by a red X). As shown in the text, ammonia oxidation by marine Thaumarchaeota (AOA) can be sensitive to ROS.
Since ROS can also be formed internally as by-products of biochemical reactions including photosynthesis and respiration (e.g., Marshall et al., 2005; Diaz et al., 2013), they must be removed to prevent cell damage. Prokaryotes possess a number of mechanisms to protect against ROS damage, including detoxifying enzymes, and DNA repair systems (Imlay, 2008; Figure 1E). A survey of the Integrated Microbial Genomes (IMG) database (http://img.jgi.doe.gov/) indicated a potential deficiency of genes from ROS-protection pathways in Thaumarchaeota relative to Bacteria or Euryarchaeota (Supplementary Table 1). All Thaumarchaeota genomes sequenced to date possess at least one copy of superoxide dismutase, which converts superoxide into H2O2; however, only Nitrososphaera gargensis (Hatzenpichler et al., 2008) and N. evergladensis (Zhalnina et al., 2014) have an annotated catalase (Supplementary Table 1)—the most effective enzyme known for detoxifying H2O2 (Imlay, 2008). These particular catalases have manganese cofactors instead of the more typical heme cofactor, and are less efficient (Mishra and Imlay, 2012). A putative catalase gene was also identified from two Thaumarchaeota single-cell amplified genomes (Luo et al., 2014); a homolog of deoxyribodipyrimidine photolyase, a key enzyme involved in the repair of UV-damaged DNA, was also found in one genome in the same study. Thaumarchaeota have genes annotated as peroxiredoxin; however, peroxiredoxin is less efficient than catalase (Parsonage et al., 2008) and has been shown to remove H2O2 effectively only at low intracellular [H2O2] (<0.1 μM; Imlay, 2008). The other peroxidases encoded in Thaumarchaeota genomes may or may not directly detoxify H2O2 (Mishra and Imlay, 2012). It is therefore possible that the distribution of Thaumarchaeota could be explained by the lack of ROS detoxifying enzymes rather than direct photoinhibition or “competition” with Bacteria or phytoplankton for ammonia.
Here we test the hypothesis that this “missing” ROS protection makes Thaumarchaeota highly sensitive to H2O2 generated external to the cell. We examined the sensitivity of AO to the ROS species H2O2 in AOO assemblages dominated by Thaumarchaeota (Supplementary Tables 2, 3) from a wide range of marine environments, including the Southern Ocean near Palmer Station (Antarctica), the Gulf of Mexico, the Gulf of Alaska, and coastal waters at Marsh Landing, Georgia, USA (See Materials and Methods for details; Figure 2). Previous work supports the notion that Thaumarchaeota are the abundant ammonia oxidizer at these sites (Hollibaugh et al., 2014; Tolar et al., 2016a,b). Whole-seawater incubations were performed at in situ temperatures with additions of 15N-labeled ammonium to determine rates of AO in the presence of H2O2 added at environmentally-relevant (nM) concentrations. We also quantified the effect of H2O2 additions on the abundance of transcripts of amoA, a highly-transcribed Thaumarchaeota gene that encodes the α-subunit of the ammonia monooxygenase enzyme as an index of another, more general (transcription broadly) Thaumarchaeota-specific process. Finally, we measured overall microbial activity using leucine incorporation to determine the effects of H2O2 on general cellular function (protein synthesis) for comparison.
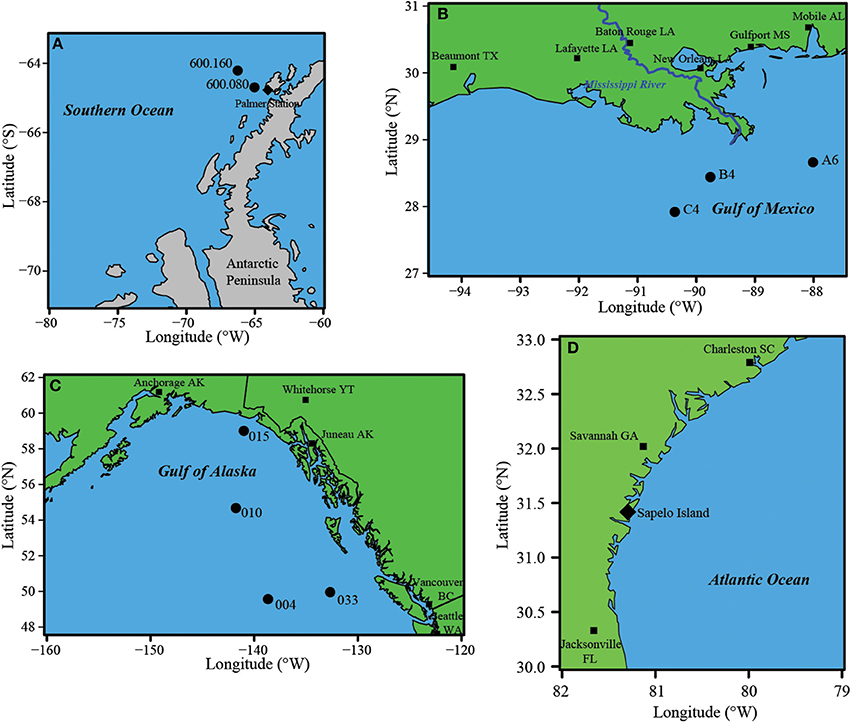
Figure 2. Locations of sample sites where H2O2 experiments were performed. (A) Southern Ocean west of the Antarctic Peninsula; (B) Gulf of Mexico; (C) Gulf of Alaska, (D) Marsh Landing on Sapelo Island, Georgia.
Materials and Methods
Sample Collection
Seawater samples were collected (Figure 2, Supplementary Table 2) from Niskin bottles attached to a CTD rosette along the Palmer LTER 600 line in the Southern Ocean (ARSV Laurence M. Gould, September 2010; Station 600.160—64° 12.657′ S, 66° 15.600′ W; and Station 600.080—64° 41.682′ S, 65° 01.849′ W), in the Gulf of Mexico (GoM—R/V Pelican, May 2012; Station C4—27° 55.169′ N, 90° 22.072′ W; Station B4—28° 26.551′ N, 89° 45.577′ W; Station A6—28° 39.744′ N, 88° 00.443′ W), in the Gulf of Alaska (GoA—R/V Melville, August 2013; Station 004—49° 34.194′ N, 138° 40.188′ W; Station 015—58° 59.968′ N, 140° 59.956′ W; Station 033—49° 57.343′ N, 132° 40.094′ W), and from coastal surface waters from a floating dock at Marsh Landing at the mouth of the Duplin River (a tidal creek draining 1200 ha of salt marsh) adjacent to Sapelo Island, Georgia, USA (Marsh Landing—August 2011 and 2012, September 2013; 31° 25.068′ N, 81° 17.721′ W). Two water masses (Antarctic Surface Water at 10–75 m and Circumpolar Deep Water at 300 m) were sampled in the Southern Ocean for comparison as these have shown different Thaumarchaeota populations in a previous study (Kalanetra et al., 2009). For GoM and GoA samples, water was collected at 200 m as this depth was likely to have high abundance of Thaumarchaeota relative to other organisms, except for GoA Stn 015 (50 m), which was from a more shallow, coastal station (max 180 m depth). Additional Marsh Landing samples were collected over a 24 h period at high tide and low tide (Supplementary Table 3) from Marsh Landing (August 2012, September 2013) and from a dock at Hunt Camp (August 2012; 31° 28.012′ N, 81° 16.006′ W), on the Duplin River upstream of Marsh Landing. We collected 0.22 μm filtered sample water for nutrient analysis, including the measurement of ammonia concentration (Supplementary Tables 2, 3) using previously described methods (Holmes et al., 1999). Photosynthetically-active radiation (PAR) data was gathered to pair to samples collected over 24 h at Marsh Landing (2012, 2013) from the NOAA National Estuarine Research Reserve System (NERRS) meteorological station on Sapelo Island near the floating dock we sampled at Marsh Landing (data accessed from the NOAA NERRS Centralized Data Management Office website: http://www.nerrsdata.org/; accessed 12 Oct 2014).
Experimental Setup
Seawater from each site (Figure 2) was collected from Niskin bottles attached to CTD rosettes (Southern Ocean, GoM, GoA) or directly from surface water (Marsh Landing) into 4 L (Southern Ocean) or 10 L (GoM, GoA, Marsh Landing) carboys and kept at in situ temperature (on-board Percival incubator—Southern Ocean; seawater flow-through tank—GoM, GoA, Marsh Landing) in the dark. 15N-labeled ammonium (15NH4Cl; Cambridge Isotope Laboratories) was added at a concentration of 50 nM (Santoro et al., 2010; Beman et al., 2012) to determine ammonia oxidation (AO) rates, and hydrogen peroxide (H2O2; Fisher Scientific—Southern Ocean; J. T. Baker—GoM, GoA, Marsh Landing) was added to experimental treatments at target concentrations designated as either “low” (10–100 nM) or “high” (30–300 nM) amendments; actual H2O2 additions varied by sample site (Table 1, Supplementary Table 4). For these addition experiments, H2O2 and 15N-labeled ammonium were added directly to carboys for incubation; however, in the Southern Ocean 15NH4Cl was added to duplicate, 250 mL subsamples after an initial incubation (6 h) with H2O2. H2O2 concentrations in stock solutions were determined by measuring absorbance at 240 nm using the measured molar absorptivity of 38.1 M−1 cm−1 (Miller and Kester, 1988). Initial [H2O2] were also estimated by modeling H2O2 decay (Figure 3, Supplementary Table 4) when possible. We did not add H2O2 to samples collected for diurnal studies at Marsh Landing and Hunt Camp (2012, 2013), as we were more interested in the impact on the in situ [H2O2] on AO rates and the variability over a day and tidal cycle. We also took advantage of a rainstorm during sample collection (Marsh Landing 2012, 2013) to gather rainwater (collected over 15 min in a square plastic container) for use in an incubation experiment to compare the effects of H2O2 from chemical vs. natural sources. Rainwater was filtered prior to [H2O2] measurement and addition to prevent decay, and diluted to target nM additions. For comparison to general microbial community activity, leucine incorporation rates were measured in samples from all sites using 13C- or 3H-labeled leucine (See Supplementary Methods for details).
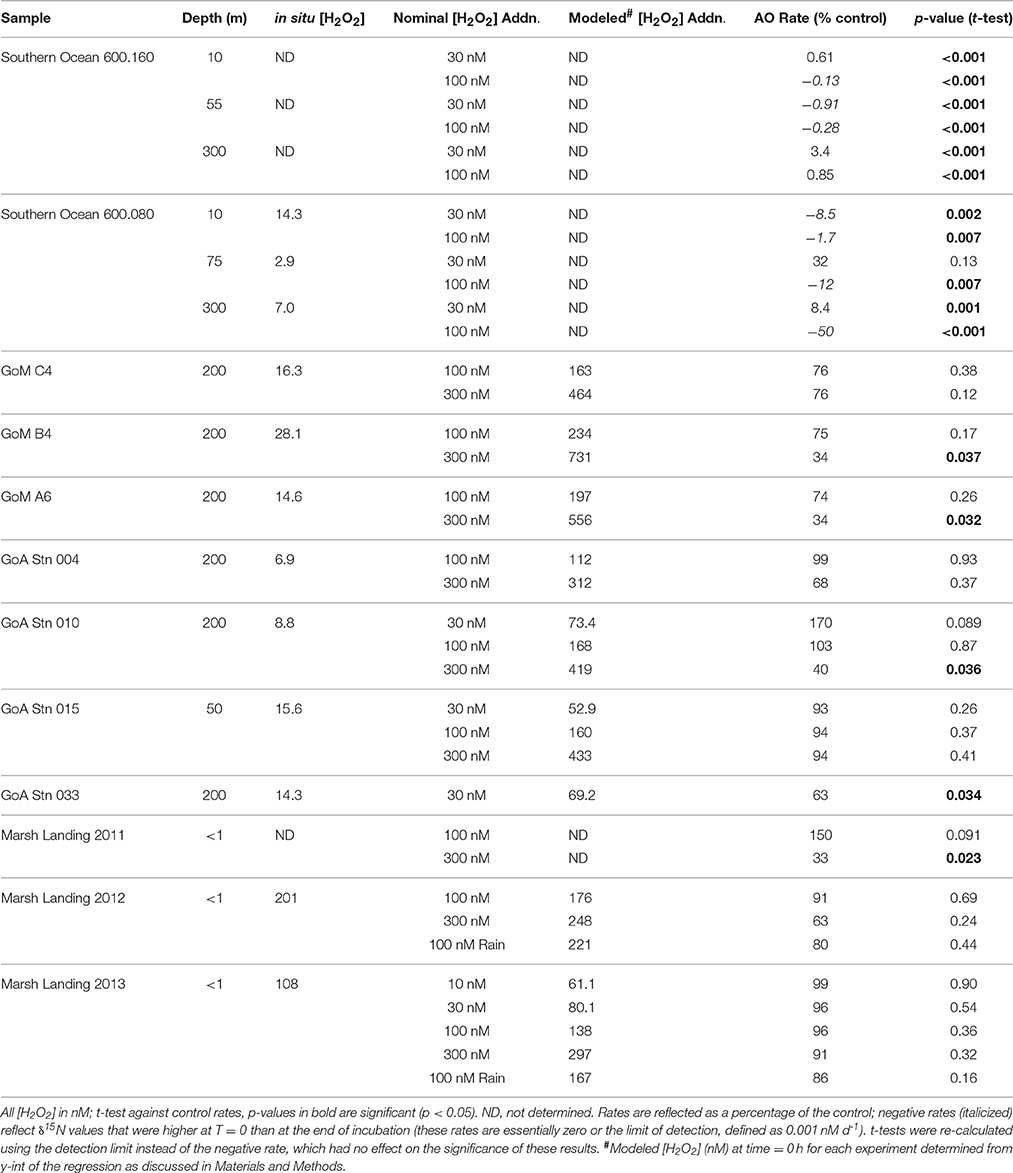
Table 1. Summary of ROS incubation experiments.
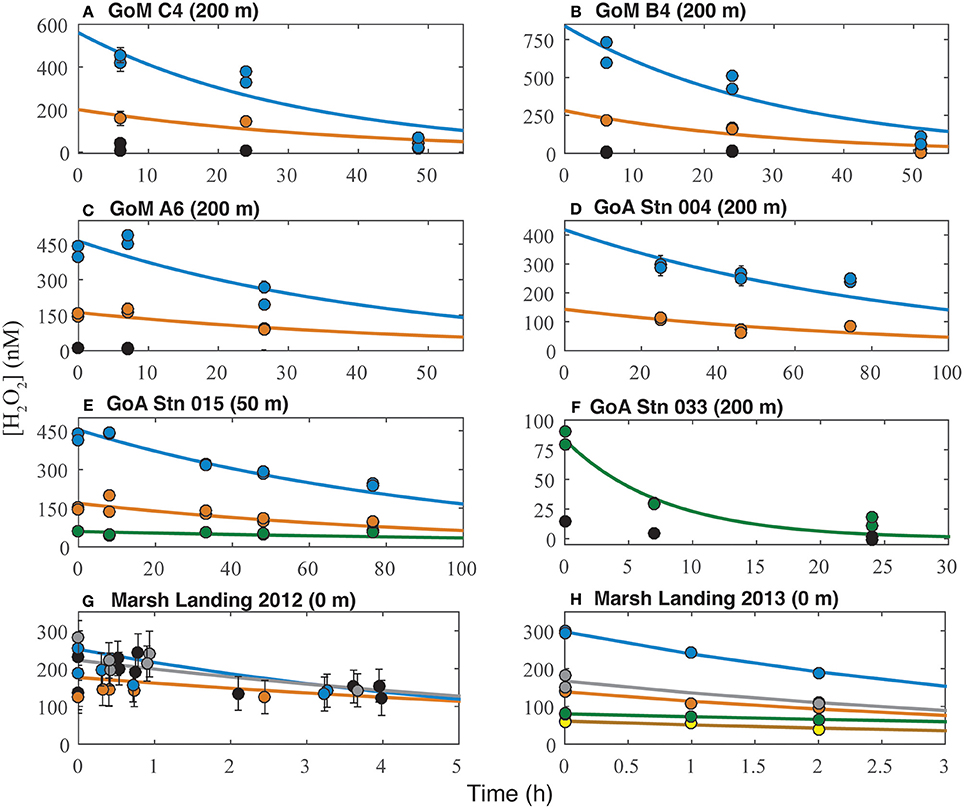
Figure 3. Decay of hydrogen peroxide in ROS experiments from the Gulf of Mexico (A–C) and Gulf of Alaska (D–F) in control (black), 30 nM H2O2 (green), 100 nM H2O2 (orange), and 300 nM H2O2 (blue) incubations; and Marsh Landing 2012 (G) and 2013 (H) in control (black), 10 nM H2O2 (yellow), 30 nM H2O2 (green), 100 nM H2O2 (orange), 300 nM H2O2 (blue), and rain (gray) incubations. Symbols represent measured H2O2 concentrations, while curves represent modeled decay rates; all panels contain error bars representing standard deviation from the mean (note that in some cases error bars are too small to be seen outside of the filled circle). Variability was greater in Marsh Landing 2012 (G) experiments due to particulate matter in sample water interfering with H2O2 measurement.
Nucleic Acid Extraction and Quantification
After incubation for 6 h with H2O2, samples were filtered directly onto 47 mm (Southern Ocean) or 142 mm (GoM, GoA, Marsh Landing) 0.22 μm pore size GVWP filters (Millipore), which were frozen in RNAlater (Ambion) at −20°C (GoM, GoA) or −80°C (Southern Ocean, Marsh Landing) before transport back to the laboratory, where they were kept frozen at −80°C until extraction. RNA was extracted following previously described methods (Poretsky et al., 2008; Gifford et al., 2011) with the replacement of 200 μm zirconium beads (OPS Diagnostics) for the initial bead-beating step. DNA was removed after extraction with the TURBO DNase-Free Kit (Ambion) following manufacturer's instructions with an additional enzyme treatment at 2X concentration. RT-qPCR targeting amoA transcripts was performed using the One-Step RT-qPCR SYBR Mix (BioRad), Archaeal amoA primers (Wuchter et al., 2006), and 1–2 μL of RNA template. AOB amoA transcripts were not detected in any of our samples (data not shown). qPCR reaction conditions follow previous methods (Kalanetra et al., 2009) with the addition of a 15 min incubation step at 50°C for reverse transcription of RNA to cDNA prior to the initial denaturation at 95°C. Raw transcript abundance (copies μL−1 of RNA extract) was converted to transcripts L−1 using the volume filtered and an elution volume of 100 μL, assuming 100% extraction efficiency. DNA extraction with phenol:chloroform, quantification of Archaeal, and Bacterial genes using qPCR, and calculation of gene copies L−1 were performed as previously described (Tolar et al., 2013). Further characterization of the diversity of Thaumarchaeota communities from this study was done using next-generation sequencing (See Supplementary Methods for details).
Ammonia Oxidation Rate Measurements
Ammonia oxidation (AO) rates were measured during dark incubations at in situ temperature for 24 h (GoM, Marsh Landing), 48 h (GoA), or 96 h (Southern Ocean) with 50 nM 15NH4Cl added (mean = 12%, range = 1.7–45% of total [NH4]; Supplementary Table 2). We did not find significant effects on longer incubation time for AO rate measurements made in the Southern Ocean at the same time (Tolar et al., 2016a). For each rate measurement, an initial sample was filtered and frozen immediately after addition of tracer; for samples from the Southern Ocean, parallel control incubations were performed using the addition of tracer to filtered sample water. Incubations were terminated by freezing samples at −20 or −80°C and samples remained frozen at −80°C until analysis. Samples were analyzed using the “denitrifier” method (Sigman et al., 2001) as described previously (Popp et al., 1995; Dore et al., 1998). Briefly, NO2 and NO3 present in each sample were converted to N2O gas through denitrification by Pseudomonas aureofaciens, transferred from the reaction vial, cryofocused, and separated from other gases using a CP-PoraBOND Q capillary column (0.32 mm inner diameter × 25 m × 5 μm) at 20–25°C. δ15N values of N2O were measured using a MAT-252 mass spectrometer (Finnigan) and used to determine how much 15NH3 tracer was introduced to the NOx pool through AO (Beman et al., 2008; Christman et al., 2011). Catalase (Sigma Aldrich) was added to thawed samples (10 μL of 150 units L−1 catalase per 50 mL sample) that were incubated at room temperature for 60 min to prevent any inhibition of P. aureofaciens growth or denitrification ability by residual H2O2 (no difference observed in N2O production with catalase addition; t-test, p = 0.43; Supplementary Table 5). AO rates were calculated from δ15N values as previously described (Christman et al., 2011; Beman et al., 2012); the detection limit for this measurement (0.001 nM d−1) was determined by using the detection limit for [NH4] and [NOx], as well as the uncertainty in stable isotope measurements with this setup (Beman et al., 2011).
Hydrogen Peroxide Concentrations
H2O2 was measured in the Southern Ocean using the POHPAA method (Miller and Kester, 1988) on samples that were first derivatized, then frozen at −20 to −80°C for subsequent measurement on an Aqualog fluorometer (Horiba). Since H2O2 concentrations were below the limit of detection (5 nM) in some of these samples (Supplementary Table 6), we switched to a more sensitive method (King et al., 2007) using a FeLume chemiluminescence system (Waterville Analytical; Supplementary Figure 1) for the remaining experiments (GoM, Marsh Landing, GoA). Full details of the setup for the FeLume system are available in the Supplementary Methods. Briefly, H2O2 reacts with 10-methyl-0-(p-formylphenyl)-acridinium carboxylate trifluoromethanesulfonate (acridinium ester; provided by James Kiddle, University of Western Michigan) at alkaline pH, forming a chemiluminescent product that can be quantified using flow injection analysis (Powers et al., 2015); See Supplementary Methods for more details. A 2 mM H2O2 stock solution was prepared from 30% H2O2 (J. T. Baker) in ultrapure water and checked spectrophotometrically as above. Standards were prepared in aged 0.2 μm filtered seawater and checked for low H2O2 with H2O2 blanks of aged seawater with added catalase (20 μL of 100 units L−1 catalase to 20 mL seawater). Under these conditions, the H2O2 detection limit, defined as three times the standard deviation of the blank, was 2–5 nM.
While the overall decay of [H2O2] has been reported as second order (Zepp et al., 1987), our experiments generally followed first-order kinetics with respect to hydrogen peroxide concentration, using the calculations from Zepp et al. (1987)
where kobs is the observed rate constant (h−1). By integrating Equation (1), H2O2 decay can be modeled with the following equation:
where [H2O2]0 is the initial peroxide concentration. For each experiment, H2O2 data were fit to Equation (2) with a non-linear regression of H2O2 vs. time using the curve fitting toolbox in MATLAB® (MathWorks) and both [H2O2]0 and kobs were used as fitting parameters. Decay rates for GoM samples were determined using H2O2 concentration data from the first 24 h of incubation; GoA decay rates from Stations 004 and 015 were determined over 76 h, Station 010 over 147 h, and Station 033 over 24 h (note that all AO rate incubation samples were terminated at 48 h by subsampling the incubation bottle; the remaining sample was incubated for longer periods as necessary to detect complete decay of H2O2); and Marsh Landing 2012 decay rates were determined over 3.5 h, while Marsh Landing 2013 decay rates were determined over 2 h. Half-lives varied for each environment, ranging from ~3 to 8 h (Marsh Landing) to over 120 h (GoA; Supplementary Table 4).
Statistical Analysis
Statistical tests were performed with R (http://www.r-project.org/) using the commands “aov” for one-way analysis of variance (ANOVA), “TukeyHSD” for the Tukey's honestly significant difference (HSD) test, “t-test” for Student's t-test, and “cor.test” for calculations of Pearson's correlation coefficient (all from the stats package included with R). Stripcharts were used to assess normal distribution of data and a Bartlett test was run to evaluate equality of variance (both within R). Rate data was log-transformed (after scaling to remove negative values) to prevent bias from higher rates obtained in some samples. Percent reduction of rates (AO and leucine incorporation) was calculated by dividing a given rate by the average rate from a non-H2O2 addition control.
Results
A summary of results from all experiments is available in Table 1. AO rates were below detection in the Southern Ocean following the addition of 6–80 nM H2O2 to samples above in situ concentrations (Figures 4A,B; Table 1, Supplementary Table 6), indicating that AOO in this region are extremely sensitive to H2O2. Concentrations of H2O2 in Southern Ocean samples were low (2.9–14 nM; Supplementary Table 6) and match previous measurements (Resing et al., 1993; Yocis, 1995; Sarthou et al., 1997). Despite this relatively small increase in [H2O2], AO rates decreased 67 to >100% of the control rate (Table 1; negative rates indicate samples where the δ15N value was higher at T = 0, and are considered zero or the limit of detection). The change in abundance of AOA amoA transcripts did not reflect the drastic decrease in AO rates observed in treatments with H2O2 additions (this was observed at all sites sampled; Figure 5). Southern Ocean leucine incorporation rates at Station 600.160 were also reduced with increasing H2O2 concentration (Figure 6A), but this reduction was only significant at 10 m (100 nM addition only) and 55 m (both 30 and 100 nM additions; Supplementary Table 2). The reduction in leucine incorporation (mean = 17%) was significantly less than that of AO rates (mean = 67%; t-test, p < 0.01).
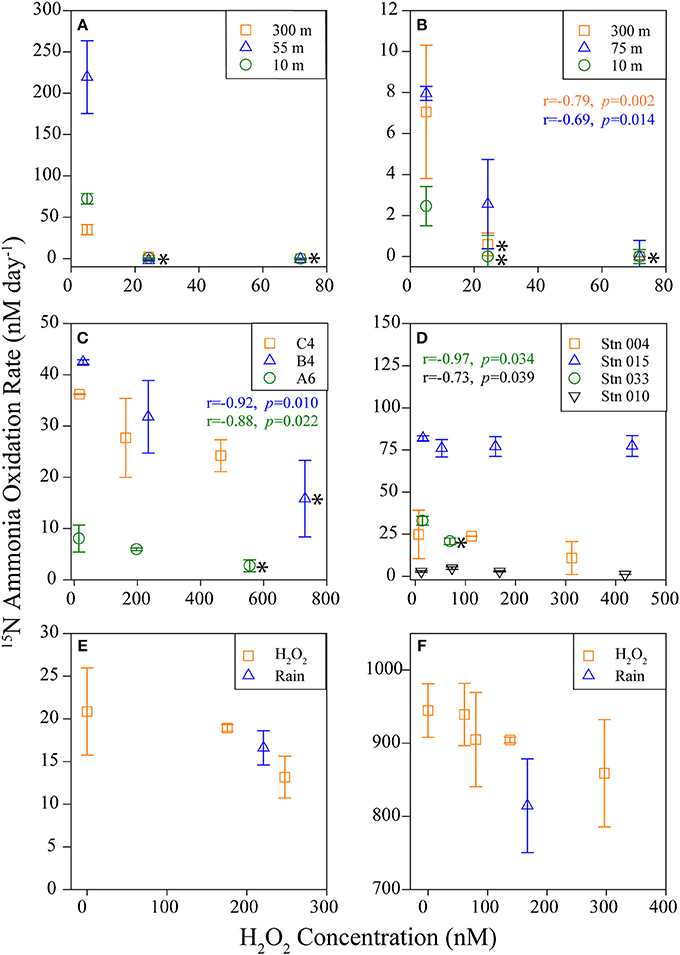
Figure 4. 15N-Ammonia oxidation rates. AO rates measured following H2O2 amendments of samples from the Southern Ocean (A Station 600.160, B Station 600.080; symbols represent sample depth), Gulf of Mexico and Gulf of Alaska (C,D, respectively; symbols represent stations sampled; sample depth was 200 m except at Station 015, which was sampled at 50 m), and coastal waters from Marsh Landing in (E) 2012 and (F) 2013 (symbols represent H2O2 origin, either chemical H2O2 or from rainwater; surface water samples collected). Error bars represent standard deviation from the mean of replicate AO measurements [n = 4 (A,B), 2 (C–F)]. An * to the right of a point indicates a significant difference (t-test, p < 0.05) from the control rate (for A,B, overlapping points were all significantly different, and are represented by only one *). H2O2 concentrations measured for each individual sample; non-control sample [H2O2] includes added H2O2. Pearson's correlation coefficient (r) and associated p-value are shown for those samples with a significant regression between rate and [H2O2], color-coded to match legend for each panel (note that regressions were not done for Station 600.160 (A) as [H2O2] was not measured).
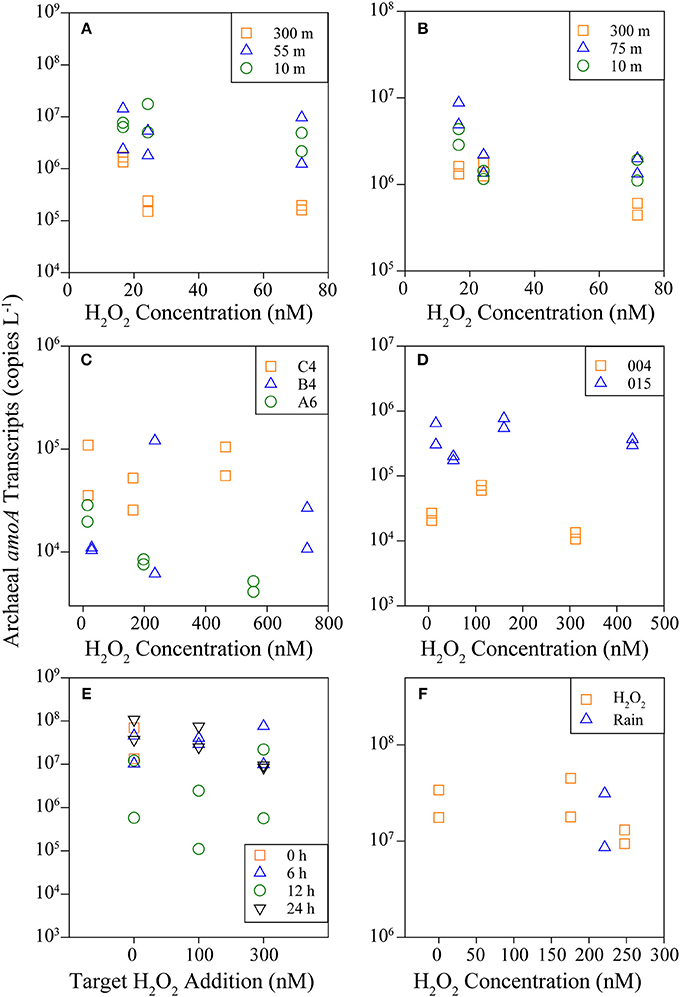
Figure 5. Archaeal amoA transcripts quantified by RT-qPCR using RNA collected from the Southern Ocean (A,B; symbols represent sample depth), Gulf of Mexico and Gulf of Alaska (C,D, respectively; symbols represent station sampled), and Marsh Landing in 2011 (E) and 2012 (F). Symbols indicate H2O2 origin, either chemical H2O2 or from rainwater.
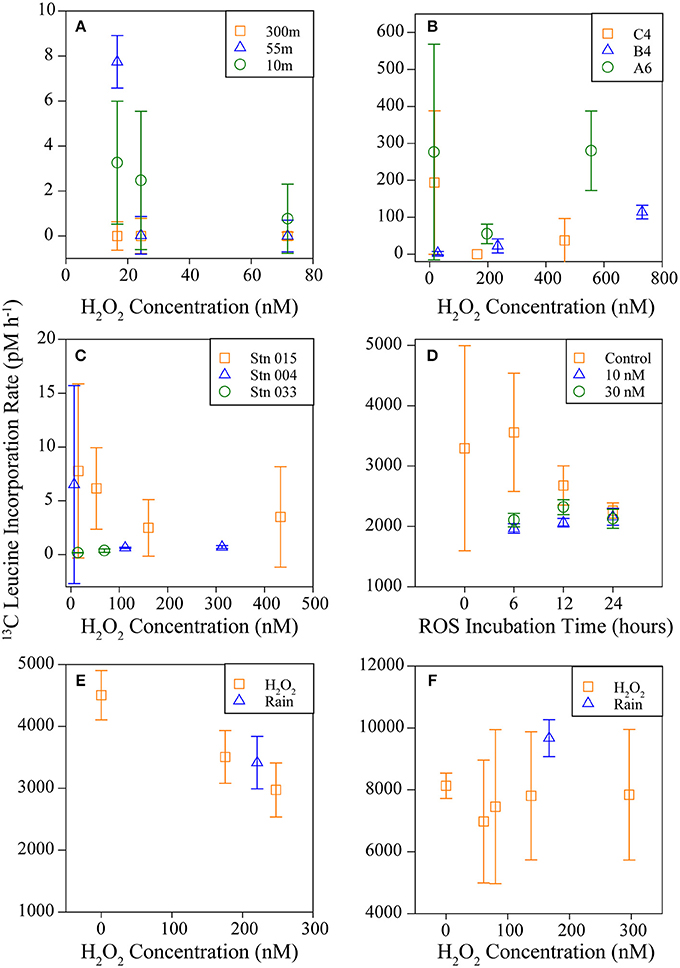
Figure 6. Bacterial and archaeal incorporation of L-leucine measured in the Southern Ocean (A; symbols represent sample depth), the Gulf of Mexico, and the Gulf of Alaska (B,C, respectively; symbols represent station sampled), and Marsh Landing in 2011 (D; symbols represent H2O2 addition), 2012, and 2013 (E,F, respectively; symbols represent H2O2 origin, either chemical H2O2 or from rainwater). Incubations were performed using 3H-labeled (A,D) or 13C-labeled (B,C,E,F) L-leucine. Error bars represent standard deviation from the mean of replicate measurements [n = 6 (A), 3 (C,D), 2 (B,E,F)].
The AO response to H2O2 additions was variable in both the Gulf of Mexico (GoM; Figure 4C, Table 1; average 38% AO reduction) and the Gulf of Alaska (GoA; Figure 4D, Table 1; average 8.5% AO reduction), with the greatest inhibition observed at Station B4 (GoM) and Station 033 (GoA). At the furthest offshore GoM site (Station C4), there was no difference in AO between samples with 0 or 100 nM added H2O2, and no change was observed with amendments of up to 300 nM H2O2 in the coastal GoA sample (Station 015, 50 m). An analysis of Thaumarchaeota 16S rRNA and amoA genes (Supplementary Figure 2) showed that the clades found in the GoA sample most resilient against H2O2 additions (Station 015) were the least similar to other GoA communities. Inhibition of leucine incorporation (protein synthesis) also varied with sample location; for example, we found no significant difference with increased [H2O2] at Stations C4 or A6 (GoM; Figure 6B), whereas AO rates were reduced at both sites (24–66%; Figure 4C, Table 1).
Samples from Marsh Landing were the least inhibited by H2O2 with only one out of ten measurements showing a significant reduction in AO across all 3 years sampled (Figures 4E,F, Supplementary Figure 3): the addition of 300 nM H2O2 in 2011 (67% reduction of AO rate; Table 1; t-test, p < 0.05). These coastal microbial communities were capable of reducing H2O2 concentrations ~6X more quickly (Figures 3G,H) than communities from open ocean sites (Supplementary Table 4, Figures 3A–F), and were markedly distinct in both Thaumarchaeota 16S rRNA and amoA diversity (Supplementary Figure 2). Time courses (2011; Supplementary Figure 3) revealed that 300 nM H2O2 additions significantly reduced AO within 6 h (t-test, p < 0.03; Supplementary Table 2), with no additional reduction or recovery of AO rates after 24 h (p < 0.05; Supplementary Table 2). As with other experiments, Marsh Landing amoA transcript abundance was not reduced by H2O2 (Figures 5E,F). Leucine incorporation in these samples was also significantly reduced by H2O2 additions after 6 h (t-test, p < 0.03; Figures 6D–F, Supplementary Table 2), but the reduction was not significantly different from the reduction in AO rates (mean = 18 vs. 5% reduction; t-test, p ≥ 0.2). We also found that additions of rainwater inhibited AO rates (Figures 4E,F), and a rain event during the 24 h sampling study in 2012 further suppressed rates at one site, despite the absence of PAR and thus photochemical H2O2 production (Supplementary Figure 4B). Rainwater H2O2 concentrations were 30–50 μM (diluted to target nM concentrations for experiments; Supplementary Table 3), consistent with previous measurements (e.g., Zika et al., 1982; Cooper et al., 1987; Willey et al., 1996).
Additional samples collected from Marsh Landing and Hunt Camp over 24 h (Figure 7, Supplementary Figure 4) revealed a daily increase in [H2O2] from 10 to 500 nM [Supplementary Table 3; corresponding to increase in sunlight or “photosynthetically active radiation,” (PAR)]—1 to 2 orders of magnitude greater than what was detected in the Southern Ocean. Samples collected at and immediately after the time of greatest [H2O2] showed decreased AO rates (Figure 7, Supplementary Figure 4), although there was higher variability due to impact of mixing and other processes inherent to an estuarine tidal creek. There was also no clear pattern based on tide sampled (Supplementary Table 3), with no significant difference in rates measured in August 2012 at Marsh Landing except between the two low tides sampled (t-test, p = 0.043; Supplementary Figure 4A), equal rates at high and low tide at Hunt Camp (p = 0.21; Supplementary Figure 4B), and the highest rate in September 2013 at the high tide sampled during the night (p < 0.005 for all comparisons; Figure 7). There was no discernable trend based on time of day or [H2O2]. Thaumarchaeota amoA genes did not vary for experiments in 2012 (Supplementary Figure 4), but amoA transcripts peaked at dawn at Marsh Landing (Supplementary Figure 4A) and showed no trend at Hunt Camp (Supplementary Figure 4B). For the Marsh Landing 2013 diurnal study, there was greater variation across the 24-h period than in 2012; amoA gene abundance peaked after noon and midnight, while amoA transcripts were most abundant right after sunset and before sunrise (Figure 7).
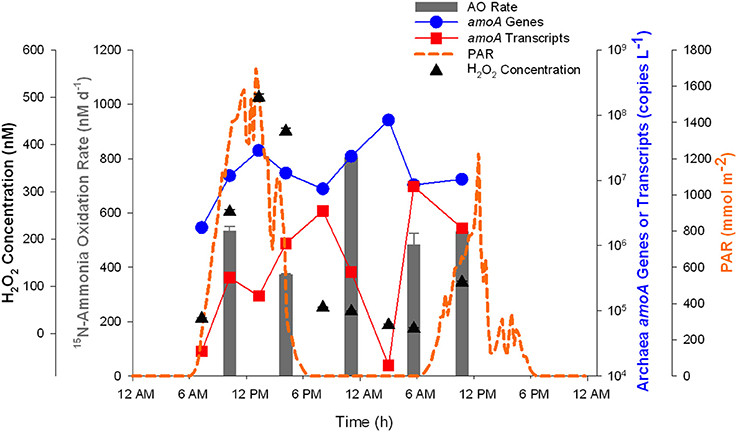
Figure 7. Diurnal measurements of Thaumarchaeota over 24 h at Marsh Landing in September 2013. Thaumarchaeota amoA genes (blue circles) and transcripts (red squares) are shown along with ammonia oxidation rates (gray bars). Photosynthetically active radiation (PAR) is also plotted (orange dashed line) for reference (data from Sapelo Island National Estuarine Research Reserve; http://cdmo.baruch.sc.edu/) with H2O2 concentrations (black triangles). Error bars represent standard deviation from the mean of [H2O2] measurements (n = 3).
Our data show that nanomolar concentrations of H2O2 can be harmful to open-ocean AOO, with the most sensitive communities found in polar waters (Figure 4, Table 1). In contrast, AOO in coastal samples from Marsh Landing appear to be more resistant to H2O2 toxicity, as do AOO in samples from the coastal GoA. Although the results were variable apart from the Southern Ocean experiments, a significant reduction of AO rates following H2O2 amendments was observed when the entire dataset was evaluated together (ANOVA, n = 140, F = 11.2, p < 0.001). The same analysis revealed no significant difference in leucine incorporation rates (all sites: n = 169, F = 2.24, p = 0.09; excluding Marsh Landing: n = 128, F = 2.6, p = 0.06), suggesting that AO is more sensitive to H2O2 toxicity than general microbial metabolism. Comparing the percent reduction in AO rates based on site (ANOVA, n = 140, F = 18.7, p < 0.001) revealed a significant difference between samples from the Southern Ocean (100 ± 19%) and all other sites [Marsh Landing (12 ± 30%), GoM (38 ± 21%), GoA (8.5 ± 36%); Tukey's test, p < 0.001 for all three pairs). This indicates that our hypothesis that ROS can inhibit AO is valid only in certain ocean regions, which warrants further investigation, as site-specific environmental factors or overall microbial community composition may play a role.
Discussion
Culture-based experiments testing light inhibition have indicated that AO by both AOB (Hooper and Terry, 1973; Horrigan and Springer, 1990; Hyman and Arp, 1992; Guerrero and Jones, 1996a) and AOA (Merbt et al., 2012; Qin et al., 2014) is decreased in the presence of increased light; yet none of these studies measured ROS generation during their incubations, which can occur at rates of 10–600 nM H2O2 h−1 under simulated light conditions (Kieber et al., 2003, 2014; Powers and Miller, 2015). However, Hooper and Terry (1974) postulated that the mechanism of this damage was likely due to ROS (“a peroxide or free radical”), based on their observation that reduced photoinhibition was observed when oxygen levels were low or absent in their experiments. Additionally, a very recently published study showed that H2O2 concentrations ≥200 nM completely inhibited AO by a newly isolated marine thaumarchaeote, strain DDS1 (Kim et al., 2016).
We have shown here that nanomolar [H2O2] can inhibit AO in bacterioplankton where Thaumarchaeota are the dominant AOO, and can also inhibit protein synthesis by the overall microbial community, which includes other nitrogen-cycling organisms. H2O2 is produced by abiotic and biotic processes in all sunlit marine waters where it can enter and damage cells that do not have detoxifying enzymes (Figure 1). Surface water [H2O2] ranges from 8 nM to 4.5 μM in marine environments (reviewed in Kieber et al., 2003), and varies from <10 to 250 nM in open ocean waters (e.g., Yuan and Shiller, 2005). Generally, lower H2O2 concentrations (10–20 nM) occur in areas with both low solar irradiance and CDOM like the Southern Ocean (Resing et al., 1993; Yocis, 1995; Sarthou et al., 1997), while higher [H2O2] occurs in coastal regions with both increased irradiance and CDOM, such as in the Amazon River plume (up to 300 nM; Yuan and Shiller, 2001), Orinoco River plume (140–470 nM; Moore et al., 1993), or coastal Gulf of Mexico (90–240 nM; Zika et al., 1985; Cooper et al., 1987). Our study examined Thaumarchaeota populations from both coastal and offshore marine waters that covered this range of natural H2O2 concentrations. Our observation of increased sensitivity in Southern Ocean samples could reflect microorganisms that can survive without ROS detoxification systems in the typically low [H2O2] present there (2.1–33 nM; Resing et al., 1993; Yocis, 1995; Sarthou et al., 1997). Although H2O2 is only one type of ROS, it can both be produced from superoxide and form the hydroxyl radical via reactions with metals, and also is the longest-lived of the ROS species (Kieber et al., 2003, and references therein). Therefore, focusing our work on H2O2 can inform the potential impacts of ROS in general on these communities.
Recent work has shown that Thaumarchaeota are active and oxidize ammonia in sunlit surface waters (Smith et al., 2014a), and culture-based Thaumarchaeota photoinhibition experiments indicated that the specific intensity of light that was inhibitory depended on the strain used (Merbt et al., 2012; Qin et al., 2014). This was also true for AOB, with different strains showing different light intensities needed to inhibit growth (Horrigan and Springer, 1990; Guerrero and Jones, 1996a). Additionally, the wavelength of light used also showed a variable inhibitory effect, with UV wavelengths (<400 nm) the most damaging to AO by AOB cultures (Hooper and Terry, 1974; Guerrero and Jones, 1996a). Recovery after photoinhibition was also found to be wavelength-dependent, as AOB exposed to longer wavelengths (>400 nm) regained activity faster than those exposed to shorter wavelengths or sunlight (Guerrero and Jones, 1996b). Strong absorption of UV radiation (280–400 nm) leads to the production of H2O2 (Miller, 2000; Yocis et al., 2000), with only 10–20% of H2O2 produced by wavelengths >400 nm (Miller, 2000). Therefore, observed wavelength-dependent biological photosensitivity may simply reflect higher [H2O2] production.
In one AOA photoinhibition study, Thaumarchaeota strains did not recover growth in the dark following light exposure (Merbt et al., 2012); yet in another, Qin et al. (2014) observed recovery in two strains, one of which was included in the Merbt et al. (2012) experiments (“Candidatus Nitrosopumilus maritimus” SCM1). Additionally, while Merbt et al. (2012) saw 82% of growth inhibition at 15 μE m−2 s−1 for strain SCM1, a 12-fold increase in light intensity (180 μE m−2 s−1) was required to match this inhibition in experiments performed by Qin et al. (2014). Although the authors had no explanation for this discrepancy, a recent study by Kim et al. (2016) has provided a potential answer. Thaumarchaeota cultures have shown enhanced growth with additions of α-ketoglutarate (Tourna et al., 2011; Qin et al., 2014), which was determined to scavenge endogenously-produced H2O2 that otherwise would inhibit growth (Kim et al., 2016), much like the inhibition of AO shown here. The study by Qin et al. (2014) is the first to report the supplement of α-ketoglutarate to media for growth of this particular strain, and its addition could explain their photoinhibition experimental results by protecting SCM1 against H2O2. Interestingly, the two other thaumarchaeote strains examined Qin et al. (2014) were unable to grow without addition of α-ketoglutarate, indicating enhanced sensitivity to ROS and highlighting differences even amongst closely related isolates.
The sensitivity of ammonia oxidation by AOA to H2O2 could explain their typical absence from oceanic surface waters, consistent with early theories for photoinhibition of AO by AOB (Alleman et al., 1987). A mid-summer bloom of Thaumarchaeota in Georgia coastal waters (Hollibaugh et al., 2014) despite high in situ [H2O2] (up to 500 nM) probably reflects the lower sensitivity of this population of AOA to H2O2, and is likely related to the distinct “cotype” of Thaumarchaeota that resides in coastal Marsh Landing waters compared to open-ocean sites (Supplementary Figure 2). AO has been shown to exhibit less photoinhibition in an estuarine AOB isolate than in marine isolates (Horrigan and Springer, 1990), which is consistent with our findings. However, as shown here, the dynamics of Thaumarchaeota populations in a coastal estuary are more complex (Figure 7, Supplementary Figure 4), with compounding influences of sunlight, tides, physical mixing, and storm events all impacting results. Consequently, it is important to collect samples at shorter time scales to reveal how such complicating factors may individually affect the data. For example, we included incubations with rainwater-derived H2O2 that showed an inhibitory effect on AO matching chemical additions (Figures 4E,F) indicating that storm events could impact bacterioplankton and nitrification that occurs in coastal surface waters (Smith et al., 2014a). Although our diurnal experiments were done in the dark after initial sample collection, we were able to observe natural variation in AO rates and archaeal amoA genes and transcripts under in situ conditions that included H2O2 concentration. We did not find clear patterns between time of day or tide and H2O2 inhibition in these samples, but can now compare our results to future experiments at in situ light levels and sample shorter time scales during the transition between tides.
On a broader scale, our results were location-dependent, with the most sensitive communities found in the Southern Ocean and the most resilient taken from coastal surface waters at Marsh Landing, suggesting that sample location—and thus inherently microbial community composition—is important for predicting ROS sensitivity of AOO. We also observed inconsistencies between sample sites in both the Gulf of Mexico and the Gulf of Alaska, conceivably due to the efficiency with which the surrounding microbial community removes H2O2 (Morris et al., 2012), although differences in net decay rate (Supplementary Table 4, Figures 3A–F) do not fully explain this variability. Alternatively, this may indicate a difference in the composition of thaumarchaeote populations where some “ecotypes” could be more or less resistant to ROS stress.
The question remains as to why some Thaumarchaeota would be sensitive to H2O2 (especially compared to Bacteria), given that they likely evolved in an oxygenated world (Spang et al., 2010; Kelly et al., 2011). Most Thaumarchaeota reside in deep waters with very low in situ H2O2 concentrations, but some clades have been found in surface waters, primarily at higher latitudes (Murray et al., 1998, 1999a; Wuchter et al., 2006). However, we have documented an abundant and active community of Thaumarchaeota in coastal Georgia surface waters (Hollibaugh et al., 2011, 2014), where [H2O2] is high (10–500 nM), especially during summer (Supplementary Tables 2, 3, Figure 7, Supplementary Figure 4). These Thaumarchaeota are comparably less sensitive to H2O2 (Figures 2E,F, Table 1), and the overall community at Marsh Landing is distinct from open-ocean “ecotypes” (Supplementary Figure 2) and more similar to “Ca. N. maritimus” SCM1 (Hollibaugh et al., 2011, 2014). Thus, a more direct test of H2O2 sensitivity using isolates or enrichments could assist in division of Thaumarchaeota into meaningful ecotypes, and may also support the previously described phylogenetic differences between “Group A” (near-surface) and “Group B” (deep) clades (Francis et al., 2005; Beman et al., 2008, 2010; Luo et al., 2014) and their activity (Smith et al., 2014a).
We also observed a discrepancy between H2O2 sensitivity of AO rates vs. amoA transcripts, where rates were reduced despite unchanged transcript levels (Figure 5). mRNA has a much shorter half-life (minutes) compared to protein (hours) such as enzymes, which coordinate biochemical reactions measured as rates (reviewed in Moran et al., 2013). Despite this disconnect, some correlations have been found between rates and gene abundances (Smith et al., 2014a), but most have been weak (Beman et al., 2008; Tolar et al., 2016a,b) or non-existent (Santoro et al., 2010). We do not understand cell-level regulation of transcription or translation in these organisms well enough to predict why this disconnect occurs, although it may simply be due to biases introduced by sample collection or processing time (Feike et al., 2012; Moran et al., 2013). Here, we have minimized the effect of such biases by including non-addition controls, and so any inhibition observed is relative to the control. As amoA transcript abundance was less impacted by H2O2 additions, this may indicate that ammonia monooxygenase is not transcriptionally inhibited by ROS, but rather by damage to the enzyme itself. In Nitrosomonas europaea, direct inhibition of the ammonia monooxygenase enzyme by light has been observed and recovery only occurred if de novo protein synthesis was possible, indicating that in AOB transcription was not affected (Hyman and Arp, 1992).
Mechanisms of H2O2-induced stress include the Fenton reaction, which depends on the presence of reduced Fe and can cause oxidative damage to Thaumarchaeota by the formation of the toxic hydroxyl radical (Imlay, 2008) and inactivation of iron-containing enzymes (Sobota and Imlay, 2011; Anjem and Imlay, 2012). This process occurs within cells; however, membrane-bound enzymes or transporters could also be damaged by exogenous ROS. Damage to enzymes can be reversed (or prevented) by replacement of Fe(III) with a divalent metal, such as manganese (Anjem and Imlay, 2012), and analysis of Thaumarchaeota genomes indicates widespread replacement of Fe by Cu in the active site of many enzymes, including ammonia monooxygenase and proteins in the electron transport system (Walker et al., 2010; Amin et al., 2013). Additionally, the only catalase found in Thaumarchaeota genomes has a manganese cofactor instead of the typical Fe (heme). It is therefore possible that Thaumarchaeota evolved to use alternative metal cofactors in place of Fe to reduce the burden of ROS stress, rather than as a response to low Fe bioavailability (Amin et al., 2013).
We have shown here that ammonia oxidation in the open-ocean is more sensitive to exogenous H2O2 than in coastal environments (average 57% reduction in AO, excluding Marsh Landing; Table 1), and that distinct Thaumarchaeota communities inhabit these samples (Supplementary Figure 2). Yet, we do not have enough physiological information on individual Thaumarchaeota “ecotypes” to understand what makes them different, only correlations of diversity with depth (Francis et al., 2005), habitat (Biller et al., 2012), or ammonia concentration (Sintes et al., 2013). It is therefore possible that ROS sensitivity could be a defining trait for division of Thaumarchaeota into meaningful ecotypes, although further work with a diverse group of cultures is necessary. Mesocosm-based manipulation studies on environmental samples should provide a useful approach and crucial first step for our understanding of how AOA will respond to a changing environment.
Author Contributions
BT, LP, WM, and JH generated hypotheses and planned experiments. WM and LP provided methods and equipment for H2O2 analysis, and BT and LP performed experiments and measured H2O2. BP and NW provided laboratory support and training for 15N-ammonia oxidation measurements, and NW assisted BT with 15N-ammonia oxidation sample processing. BT and JH analyzed the data and wrote the paper.
Funding
Funding for this research was provided by a University of Georgia Graduate School Innovative and Interdisciplinary Research Grant (IIRG) to BT and U.S. National Science Foundation grants OCE 09-43278 (EAGER) and OPP 08-38996 to JH, OCE 12-34388 to WM, and OCE 11-29260 to BP.
Conflict of Interest Statement
The authors declare that the research was conducted in the absence of any commercial or financial relationships that could be construed as a potential conflict of interest.
Acknowledgments
We thank R. Jellison, Q. Liu, F. Cao, and B. Durham for assistance in field sampling, as well as the scientific parties and crew of the ARSV Laurence M. Gould, R/V Pelican (funded through NOASS-CSCOR grant NA07NOS4780225 to W. Gardner), and R/V Melville (funded through NSF grant OCE-1153930 to D. Hansell), the Palmer Station 2010–2011 support staff, and the staff at the UGA Marine Institute on Sapelo Island, especially M. Booth and M. Price. We also thank A. Bratcher, D. Duckett, E. Malagón, L. Lim, J. L. Shih, J. Fackrell, and C. Ka'apu-Lyons for assistance in the laboratory, and W. Whitman, M. Moran, and the reviewers for their suggestions that improved this manuscript. This is SOEST contribution number 9861, and UGAMI contribution number 1054.
Supplementary Material
The Supplementary Material for this article can be found online at: https://www.frontiersin.org/article/10.3389/fmars.2016.00237/full#supplementary-material
References
Alleman, J. E., Keramida, V., and Panteakiser, L. (1987). Light-Induced Nitrosomonas inhibition. Water Res. 21, 499–501. doi: 10.1016/0043-1354(87)90199-0
Amin, S. A., Moffett, J. W., Martens-Habbena, W., Jacquot, J. E., Han, Y., Devol, A., et al. (2013). Copper requirements of the ammonia-oxidizing archaeon Nitrosopumilus maritimus SCM1 and implications for nitrification in the marine environment. Limnol. Oceanogr. 58, 2037–2045. doi: 10.4319/lo.2013.58.6.2037
Anjem, A., and Imlay, J. A. (2012). Mononuclear iron enzymes are primary targets of hydrogen peroxide stress. J. Biol. Chem. 287, 15544–15556. doi: 10.1074/jbc.M111.330365
Beman, J. M., Chow, C. E., King, A. L., Feng, Y. Y., Fuhrman, J. A., Andersson, A., et al. (2011). Global declines in oceanic nitrification rates as a consequence of ocean acidification. Proc. Natl. Acad. Sci. U.S.A. 108, 208–213. doi: 10.1073/pnas.1011053108
Beman, J. M., Popp, B. N., and Alford, S. E. (2012). Quantification of ammonia oxidation rates and ammonia-oxidizing archaea and bacteria at high resolution in the Gulf of California and eastern tropical North Pacific Ocean. Limnol. Oceanogr. 57, 711–726. doi: 10.4319/lo.2012.57.3.0711
Beman, J. M., Popp, B. N., and Francis, C. A. (2008). Molecular and biogeochemical evidence for ammonia oxidation by marine Crenarchaeota in the Gulf of California. ISME J. 2, 429–441. doi: 10.1038/ismej.2007.118
Beman, J. M., Sachdeva, R., and Fuhrman, J. A. (2010). Population ecology of nitrifying archaea and bacteria in the Southern California Bight. Environ. Microbiol. 12, 1282–1292. doi: 10.1111/j.1462-2920.2010.02172.x
Biller, S. J., Mosier, A. C., Wells, G. F., and Francis, C. A. (2012). Global biodiversity of aquatic ammonia-oxidizing archaea is partitioned by habitat. Front. Microbiol. 3:252. doi: 10.3389/fmicb.2012.00252
Blough, N. V., and Zepp, R. G. (1995). “Reactive oxygen species in natural waters,” in Active Oxygen in Chemistry, eds C. S. Foote, J. S. Valentine, A. Greenberg, and J. F. Liebman (New York, NY: Blackie Academic), 280–333.
Christman, G. D., Cottrell, M. T., Popp, B. N., Gier, E., and Kirchman, D. L. (2011). Abundance, Diversity, and activity of ammonia-oxidizing prokaryotes in the Coastal Arctic Ocean in summer and winter. Appl. Environ. Microbiol. 77, 2026–2034. doi: 10.1128/AEM.01907-10
Church, M. J., Delong, E. F., Ducklow, H. W., Karner, M. B., Preston, C. M., and Karl, D. M. (2003). Abundance and distribution of planktonic Archaea and Bacteria in the waters west of the Antarctic Peninsula. Limnol. Oceanogr. 48, 1893–1902. doi: 10.4319/lo.2003.48.5.1893
Cooper, W. J., Saltzman, E. S., and Zika, R. G. (1987). The contribution of rainwater to variability in surface ocean hydrogen peroxide. J. Geophys. Res. 92, 2970–2980. doi: 10.1029/JC092iC03p02970
Cooper, W. J., Shao, C. W., Lean, D. R. S., Gordon, A. S., and Scully, F. E. (1994). Factors affecting the distribution of H2O2 in surface waters. Environ. Chem. Lakes Reserv. 237, 391–422. doi: 10.1021/ba-1994-0237.ch012
Diaz, J. M., Hansel, C. M., Voelker, B. M., Mendes, C. M., Andeer, P. F., and Zhang, T. (2013). Widespread production of extracellular superoxide by heterotrophic bacteria. Science 340, 1223–1226. doi: 10.1126/science.1237331
Dore, J. E., Popp, B. N., Karl, D. M., and Sansone, F. J. (1998). A large source of atmospheric nitrous oxide from subtropical North Pacific surface waters. Nature 396, 63–66. doi: 10.1038/23921
Feike, J., Jürgens, K., Hollibaugh, J. T., Krüger, S., Jost, G., and Labrenz, M. (2012). Measuring unbiased metatranscriptomics in suboxic waters of the central Baltic Sea using a new in situ fixation system. ISME J. 6, 461–470. doi: 10.1038/ismej.2011.94
Francis, C. A., Beman, J. M., and Kuypers, M. M. M. (2007). New processes and players in the nitrogen cycle: the microbial ecology of anaerobic and archaeal ammonia oxidation. ISME J. 1, 19–27. doi: 10.1038/ismej.2007.8
Francis, C. A., Roberts, K. J., Beman, J. M., Santoro, A. E., and Oakley, B. B. (2005). Ubiquity and diversity of ammonia-oxidizing archaea in water columns and sediments of the ocean. Proc. Natl. Acad. Sci. U.S.A. 102, 14683–14688. doi: 10.1073/pnas.0506625102
Gifford, S. M., Sharma, S., Rinta-Kanto, J. M., and Moran, M. A. (2011). Quantitative analysis of a deeply sequenced marine microbial metatranscriptome. ISME J. 5, 461–472. doi: 10.1038/ismej.2010.141
Guerrero, M. A., and Jones, R. D. (1996a). Photoinhibition of marine nitrifying bacteria. I. Wavelength-dependent response. Mar. Ecol. Prog. Ser. 141, 183–192. doi: 10.3354/meps141183
Guerrero, M. A., and Jones, R. D. (1996b). Photoinhibition of marine nitrifying bacteria. II. Dark recovery after monochromatic or polychromatic irradiation. Mar. Ecol. Prog. Ser. 141, 193–198. doi: 10.3354/meps141193
Hatzenpichler, R., Lebedeva, E. V., Spieck, E., Stoecker, K., Richter, A., Daims, H., et al. (2008). A moderately thermophilic ammonia-oxidizing crenarchaeote from a hot spring. Proc. Natl. Acad. Sci. U.S.A. 105, 2134–2139. doi: 10.1073/pnas.0708857105
Hollibaugh, J. T., Gifford, S. M., Moran, M. A., Ross, M. J., Sharma, S., and Tolar, B. B. (2014). Seasonal variation in the metratranscriptomes of a Thaumarchaeota population from SE USA coastal waters. ISME J. 8, 685–698. doi: 10.1038/ismej.2013.171
Hollibaugh, J. T., Gifford, S., Sharma, S., Bano, N., and Moran, M. A. (2011). Metatranscriptomic analysis of ammonia-oxidizing organisms in an estuarine bacterioplankton assemblage. ISME J. 5, 866–878. doi: 10.1038/ismej.2010.172
Holmes, R. M., Aminot, A., Kerouel, R., Hooker, B. A., and Peterson, B. J. (1999). A simple and precise method for measuring ammonium in marine and freshwater ecosystems. Can. J. Fish. Aquat. Sci. 56, 1801–1808. doi: 10.1139/f99-128
Hooper, A. B., and Terry, K. R. (1973). Specific inhibitors of ammonia oxidation in Nitrosomonas. J. Bacteriol. 115, 480–485.
Hooper, A. B., and Terry, K. R. (1974). Photoinactivation of ammonia oxidation in Nitrosomonas. J. Bacteriol. 119, 899–906.
Horrigan, S. G., and Springer, A. L. (1990). Oceanic and estuarine ammonium oxidation: effects of light. Limnol. Oceanogr. 35, 479–482. doi: 10.4319/lo.1990.35.2.0479
Hyman, M. R., and Arp, D. J. (1992). 14C2H2-labeling and 14CO2-labeling studies of the de novo synthesis of polypeptides by Nitrosomonas europaea during recovery from acetylene and light inactivation of ammonia monooxygenase. J. Biol. Chem. 267, 1534–1545.
Imlay, J. A. (2008). Cellular defenses against superoxide and hydrogen peroxide. Annu. Rev. Biochem. 77, 755–776. doi: 10.1146/annurev.biochem.77.061606.161055
Kalanetra, K. M., Bano, N., and Hollibaugh, J. T. (2009). Ammonia-oxidizing Archaea in the Arctic Ocean and Antarctic coastal waters. Environ. Microbiol. 11, 2434–2445. doi: 10.1111/j.1462-2920.2009.01974.x
Karner, M. B., Delong, E. F., and Karl, D. M. (2001). Archaeal dominance in the mesopelagic zone of the Pacific Ocean. Nature 409, 507–510. doi: 10.1038/35054051
Kelly, S., Wickstead, B., and Gull, K. (2011). Archaeal phylogenomics provides evidence in support of a methanogenic origin of the Archaea and a thaumarchaeal origin for the eukaryotes. Proc. R. Soc. B. Bio 278, 1009–1018. doi: 10.1098/rspb.2010.1427
Kieber, D. J., Miller, G. W., Neale, P. J., and Mopper, K. (2014). Wavelength and temperature-dependent apparent quantum yields for photochemical formation of hydrogen peroxide in seawater. Environ. Sci. Process. Impacts 16, 777–791. doi: 10.1039/c4em00036f
Kieber, D. J., Peake, B. M., and Scully, N. M. (2003). “Reactive oxygen species in aquatic ecosystems,” in UV Effects in Aquatic Organisms and Ecosystems, eds E. W. Helbling and H. Zagarese (Cambridge: The Royal Society of Chemistry), 251–290.
Kim, J.-G., Park, S.-J., Sinninghe Damsté, J. S., Schouten, S., Rijpstra, W. I. C., Jung, M.-Y., et al. (2016). Hydrogen peroxide detoxification is a key mechanism for growth of ammonia-oxidizing archaea. Proc. Natl. Acad. Sci. U.S.A. 113, 7888–7893. doi: 10.1073/pnas.1605501113
King, D. W., Cooper, W. J., Rusak, S. A., Peake, B. M., Kiddle, J. J., O'Sullivan, D. W., et al. (2007). Flow injection analysis of H2O2 in natural waters using acridinium ester chemiluminescence: method development and optimization using a kinetic model. Anal. Chem. 79, 4169–4176. doi: 10.1021/ac062228w
Luo, H. W., Tolar, B. B., Swan, B. K., Zhang, C. L. L., Stepanauskas, R., Moran, M. A., et al. (2014). Single-cell genomics shedding light on marine Thaumarchaeota diversification. ISME J. 8, 732–736. doi: 10.1038/ismej.2013.202
Marshall, J. A., De Salas, M., Oda, T., and Hallegraeff, G. (2005). Superoxide production by marine microalgae. Mar. Biol. 147, 533–540. doi: 10.1007/s00227-005-1596-7
Merbt, S. N., Stahl, D. A., Casamayor, E. O., Martí, E., Nicol, G. W., and Prosser, J. I. (2012). Differential photoinhibition of bacterial and archaeal ammonia oxidation. FEMS Microbiol. Lett. 327, 41–46. doi: 10.1111/j.1574-6968.2011.02457.x
Miller, G. W. (2000). Wavelength and Temperature Dependent Quantum Yields for Photochemical Formation of Hydrogen Peroxide in Seawater. M.S. thesis, State University of New York.
Miller, W. L., and Kester, D. R. (1988). Hydrogen-peroxide measurement in seawater by (Para-Hydroxyphenyl) acetic acid dimerization. Anal. Chem. 60, 2711–2715. doi: 10.1021/ac00175a014
Mincer, T. J., Church, M. J., Taylor, L. T., Preston, C., Karl, D. M., and Delong, E. F. (2007). Quantitative distribution of presumptive archaeal and bacterial nitrifiers in Monterey Bay and the North Pacific Subtropical Gyre. Environ. Microbiol. 9, 1162–1175. doi: 10.1111/j.1462-2920.2007.01239.x
Mishra, S., and Imlay, J. (2012). Why do bacteria use so many enzymes to scavenge hydrogen peroxide? Arch. Biochem. Biophys. 525, 145–160. doi: 10.1016/j.abb.2012.04.014
Moffett, J. W., and Zafiriou, O. C. (1990). An investigation of hydrogen peroxide chemistry in surface waters of Vineyard Sound with O2 and 18O2. Limnol. Oceanogr. 35, 1221–1229. doi: 10.4319/lo.1990.35.6.1221
Moffett, J. W., and Zika, R. G. (1988). Measurement of copper(I) in surface waters of the subtropical Atlantic and Gulf of Mexico. Geochim. Cosmochim. Acta 52, 1849–1857. doi: 10.1016/0016-7037(88)90008-7
Moore, C. A., Farmer, C. T., and Zika, R. G. (1993). Influence of the Orinoco River on hydrogen peroxide distribution and production in the Eastern Caribbean. J. Geophys. Res. 98, 2289–2298. doi: 10.1029/92JC02767
Moran, M. A., Satinsky, B., Gifford, S. M., Luo, H., Rivers, A., Chan, L.-K., et al. (2013). Sizing up metatranscriptomics. ISME J. 7, 237–243. doi: 10.1038/ismej.2012.94
Morris, J. J., Lenski, R. E., and Zinser, E. R. (2012). The Black queen hypothesis: evolution of dependencies through adaptive gene loss. MBio 3:e00036–12. doi: 10.1128/mBio.00036-12
Murray, A. E., Preston, C. M., Massana, R., Taylor, L. T., Blakis, A., Wu, K., et al. (1998). Seasonal and spatial variability of bacterial and archaeal assemblages in the coastal waters near Anvers Island, Antarctica. Appl. Environ. Microbiol. 64, 2585–2595.
Murray, A. E., Wu, K. Y., Moyer, C. L., Karl, D. M., and Delong, E. F. (1999a). Evidence for circumpolar distribution of planktonic Archaea in the Southern Ocean. Aquat. Microb. Ecol. 18, 263–273. doi: 10.3354/ame018263
Olson, R. J. (1981). Differential photoinhibition of marine nitrifying bacteria – a possible mechanism for the formation of the primary nitrite maximum. J. Mar. Res. 39, 227–238.
Palenik, B., and Morel, F. M. M. (1988). Dark production of H2O2 in the Sargasso Sea. Limnol. Oceanogr. 33, 1606–1611. doi: 10.4319/lo.1988.33.6_part_2.1606
Palenik, B., Zafiriou, O. C., and Morel, F. M. M. (1987). Hydrogen peroxide production by a marine phytoplankter. Limnol. Oceanogr. 32, 1365–1369. doi: 10.4319/lo.1987.32.6.1365
Parsonage, D., Karplus, P. A., and Poole, L. B. (2008). Substrate specificity and redox potential of AhpC, a bacterial peroxiredoxin. Proc. Natl. Acad. Sci. U.S.A. 105, 8209–8214. doi: 10.1073/pnas.0708308105
Popp, B. N., Sansone, F. J., Rust, T. M., and Merritt, D. A. (1995). Determination of concentration and carbon isotopic composition of dissolved methane in sediments and Nearshore Waters. Anal. Chem. 67, 405–411. doi: 10.1021/ac00098a028
Poretsky, R. R., Bano, N., Buchan, A., Moran, M. A., and Hollibaugh, J. T. (2008). “Environmental transcriptomics: a method to access expressed genes in complex microbial communities,” in Molecular Microbial Ecology Manual, eds G. A. Kowalchuk, F. J. De Bruijn, I. M. Head, A. D. L. Akkermans and J. D. Van Elsas (Dordrecht: Springer), 1892–1904.
Powers, L. C., Babcock-Adams, L. C., Enright, J. K., and Miller, W. L. (2015). Probing the photochemical reactivity of deep ocean refractory carbon (DORC): lessons from hydrogen peroxide and superoxide. Mar. Chem. 177, 306–317. doi: 10.1016/j.marchem.2015.06.005
Powers, L. C., and Miller, W. L. (2014). Blending remote sensing data products to estimate photochemical production of hydrogen peroxide and superoxide in the surface ocean. Environ. Sci. Process. Impacts 16, 792–806. doi: 10.1039/c3em00617d
Powers, L. C., and Miller, W. L. (2015). Hydrogen peroxide and superoxide photoproduction in diverse marine waters: a simple proxy for estimating direct CO2 photochemical fluxes. Geophys. Res. Lett. 42, 7696–7704. doi: 10.1002/2015GL065669
Prosser, J. I., and Nicol, G. W. (2008). Relative contributions of archaea and bacteria to aerobic ammonia oxidation in the environment. Environ. Microbiol. 10, 2931–2941. doi: 10.1111/j.1462-2920.2008.01775.x
Qin, W., Amin, S. A., Martens-Habbena, W., Walker, C. B., Urakawa, H., Devol, A. H., et al. (2014). Marine ammonia-oxidizing archaeal isolates display obligate mixotrophy and wide ecotypic variation. Proc. Natl. Acad. Sci. U.S.A. 111, 12504–12509. doi: 10.1073/pnas.1324115111
Resing, J., Tien, G., Letelier, R., Karl, D. M., and Jones, D. (1993). Palmer LTER: hydrogen peroxide in the Palmer LTER region: II. Water column distribution. Antarct. J. U.S. 28, 227–229.
Roe, K. L., Schneider, R. J., Hansel, C. M., and Voelker, B. M. (2016). Measurement of dark, particle-generated superoxide and hydrogen peroxide production and decay in the subtropical and temperate North Pacific Ocean. Deep Sea Res. 107, 59–69. doi: 10.1016/j.dsr.2015.10.012
Rose, A. L., Webb, E. A., Waite, T. D., and Moffett, J. W. (2008). Measurement and implications of nonphotochemically generated superoxide in the equatorial Pacific Ocean. Environ. Sci. Technol. 42, 2387–2393. doi: 10.1021/es7024609
Santoro, A. E., Casciotti, K. L., and Francis, C. A. (2010). Activity, abundance and diversity of nitrifying archaea and bacteria in the central California Current. Environ. Microbiol. 12, 1989–2006. doi: 10.1111/j.1462-2920.2010.02205.x
Sarthou, G. C., Jeandel, C., Brisset, L., Amouroux, D., Besson, T., and Donard, O.F.X. (1997). Fe and H2O2 distributions in the upper water column in the Indian sector of the Southern Ocean. Earth Planet. Sci. Lett. 147, 83–92. doi: 10.1016/S0012-821X(97)00004-6
Sigman, D. M., Casciotti, K. L., Andreani, M., Barford, C., Galanter, M., and Böhlke, J. K. (2001). A bacterial method for the nitrogen isotopic analysis of nitrate in seawater and freshwater. Anal. Chem. 73, 4145–4153. doi: 10.1021/ac010088e
Sintes, E., Bergauer, K., De Corte, D., Yokokawa, T., and Herndl, G. J. (2013). Archaeal amoA gene diversity points to distinct biogeography of ammonia-oxidizing Crenarchaeota in the ocean. Environ. Microbiol. 15, 1647–1658. doi: 10.1111/j.1462-2920.2012.02801.x
Smith, J. M., Casciotti, K. L., Chavez, F. P., and Francis, C. A. (2014a). Differential contributions of archaeal ammonia oxidizer ecotypes to nitrification in coastal surface waters. ISME J. 8, 1704–1714. doi: 10.1038/ismej.2014.11
Smith, J. M., Chavez, F. P., and Francis, C. A. (2014b). Ammonium uptake by phytoplankton regulates nitrification in the sunlit ocean. PLoS ONE 9:e108173. doi: 10.1371/journal.pone.0108173
Sobota, J. M., and Imlay, J. A. (2011). Iron enzyme ribulose-5-phosphate 3-epimerase in Escherichia coli is rapidly damaged by hydrogen peroxide but can be protected by manganese. Proc. Natl. Acad. Sci. U.S.A. 108, 5402–5407. doi: 10.1073/pnas.1100410108
Spang, A., Hatzenpichler, R., Brochier-Armanet, C., Rattei, T., Tischler, P., Spieck, E., et al. (2010). Distinct gene set in two different lineages of ammonia-oxidizing archaea supports the phylum Thaumarchaeota. Trends Microbiol. 18, 331–340. doi: 10.1016/j.tim.2010.06.003
Thompson, A. M., and Zafiriou, O. C. (1983). Air-sea fluxes of transient atmospheric species. J. Geophys. Res. 88, 6696–6708. doi: 10.1029/JC088iC11p06696
Tolar, B. B., King, G. M., and Hollibaugh, J. T. (2013). An analysis of thaumarchaeota populations from the northern Gulf of Mexico. Front. Microbiol. 4:72. doi: 10.3389/fmicb.2013.00072
Tolar, B. B., Ross, M. J., Wallsgrove, N. J., Liu, Q., Aluwihare, L. I., Popp, B. N., et al. (2016a). Contribution of ammonia oxidation to chemoautotrophy in Antarctic coastal waters. ISME J. 10, 2605–2619. doi: 10.1038/ismej.2016.61
Tolar, B. B., Wallsgrove, N. J., Popp, B. N., and Hollibaugh, J. T. (2016b). Oxidation of urea-derived nitrogen by thaumarchaeota-dominated marine nitrifying communities. Environ. Microbiol. doi: 10.1111/1462-2920.13457. [Epub ahead of print].
Tourna, M., Stieglmeier, M., Spang, A., Könneke, M., Schintlmeister, A., Urich, T., et al. (2011). Nitrososphaera viennensis, an ammonia oxidizing archaeon from soil. Proc. Natl. Acad. Sci. U.S.A. 108, 8420–8425. doi: 10.1073/pnas.1013488108
Twiner, M. J., and Trick, C. G. (2000). Possible physiological mechanisms for production of hydrogen peroxide by the icthyotoxic flagellate Heterosigma akashiwo. J. Plankton Res. 22, 1961–1975. doi: 10.1093/plankt/22.10.1961
Walker, C. B., De La Torre, J. R., Klotz, M. G., Urakawa, H., Pinel, N., Arp, D. J., et al. (2010). Nitrosopumilus maritimus genome reveals unique mechanisms for nitrification and autotrophy in globally distributed marine crenarchaea. Proc. Nat. Acad. Sci. U.S.A. 107, 8818–8823. doi: 10.1073/pnas.0913533107
Ward, B. B. (1985). Light and substrate concentration relationships with marine ammonium assimilation and oxidation rates. Mar. Chem. 16, 301–316. doi: 10.1016/0304-4203(85)90052-0
Ward, B. B. (2011). “Nitrification in the Ocean,” in Nitrification, eds B. B. Ward, D. J. Arp, and M. G. Klotz (Washington, DC: ASM Press), 325–345.
Wells, L. E., and Deming, J. W. (2003). Abundance of Bacteria, the Cytophaga-Flavobacterium cluster and Archaea in cold oligotrophic waters and nepheloid layers of the Northwest Passage, Canadian Archipelago. Aquat. Microb. Ecol. 31, 19–31. doi: 10.3354/ame031019
Willey, J. D., Kieber, R. J., and Lancaster, R. D. (1996). Coastal rainwater hydrogen peroxide: concentration and deposition J. Atmos. Chem. 25, 149–165. doi: 10.1007/BF00053789
Wuchter, C., Abbas, B., Coolen, M. J. L., Herfort, L., van Bleijswijk, J., Timmers, P., et al. (2006). Archaeal nitrification in the ocean. Proc. Natl. Acad. Sci. U.S.A. 103, 12317–12322. doi: 10.1073/pnas.0600756103
Yocis, B. H. (1995). Dynamics of the Hydrogen Peroxide Cycle in Antarctic Waters. M.S. thesis, State University of New York.
Yocis, B. H., Kieber, D. J., and Mopper, K. (2000). Photochemical production of hydrogen peroxide in Antarctic Waters. Deep Sea Res. 47, 1077–1099. doi: 10.1016/S0967-0637(99)00095-3
Yuan, J., and Shiller, A. M. (2001). The distribution of hydrogen peroxide in the southern and central Atlantic Ocean. Deep Sea Res. II 48, 2947–2970. doi: 10.1016/S0967-0645(01)00026-1
Yuan, J., and Shiller, A. M. (2005). Distribution of hydrogen peroxide in the northwest Pacific Ocean. Geochem. Geophys. Geosyst. 6, Q09MQ02. doi: 10.1029/2004GC000908
Zafiriou, O. C., Voelker, B. M., and Sedlak, D. L. (1998). Chemistry of the superoxide radical () in seawater: reactions with inorganic copper complexes. J. Phys. Chem. A 102, 5693–5700. doi: 10.1021/jp980709g
Zepp, R. G., Skurlato, Y. I., and Pierce, J. T. (1987). “Algal-induced decay and formation of hydrogen peroxide in water: its possible role in oxidation of anilines by algae,” in Photochemistry of Environmental Systems, eds R. G. Zika and W. J. Cooper (Washington, DC: American Chemical Society), 215–224.
Zhalnina, K. V., Dias, R., Leonard, M. T., Dorr de Quadros, P., Camargo, F. A., Drew, J. C., et al. (2014). Genome sequence of Candidatus Nitrososphaera evergladensis from group I.1b enriched from Everglades soil reveals novel genomic features of the ammonia-oxidizing archaea. PLoS ONE 9:e101648. doi: 10.1371/journal.pone.0101648
Zika, R. G., Moffett, J. W., Petasne, R. G., Cooper, W. J., and Saltzman, E. S. (1985). Spatial and temporal variations of hydrogen-peroxide in Gulf of Mexico Waters. Geochim. Cosmochim. Acta 49, 1173–1184. doi: 10.1016/0016-7037(85)90008-0
Keywords: Thaumarchaeota, ammonia oxidation, nitrification, nitrogen, ammonia, reactive oxygen species, hydrogen peroxide
Citation: Tolar BB, Powers LC, Miller WL, Wallsgrove NJ, Popp BN and Hollibaugh JT (2016) Ammonia Oxidation in the Ocean Can Be Inhibited by Nanomolar Concentrations of Hydrogen Peroxide. Front. Mar. Sci. 3:237. doi: 10.3389/fmars.2016.00237
Received: 17 June 2016; Accepted: 01 November 2016;
Published: 18 November 2016.
Edited by:
Gordon T. Taylor, Stony Brook University, USAReviewed by:
Dirk De Beer, Max Planck Society, GermanyXuefeng Peng, University of California, Santa Barbara, USA
Brittany Widner, Old Dominion University, USA
Copyright © 2016 Tolar, Powers, Miller, Wallsgrove, Popp and Hollibaugh. This is an open-access article distributed under the terms of the Creative Commons Attribution License (CC BY). The use, distribution or reproduction in other forums is permitted, provided the original author(s) or licensor are credited and that the original publication in this journal is cited, in accordance with accepted academic practice. No use, distribution or reproduction is permitted which does not comply with these terms.
*Correspondence: Bradley B. Tolar, bradley.tolar@gmail.com
James T. Hollibaugh, aquadoc@uga.edu
†Present Address: Bradley B. Tolar, Department of Earth System Science, Stanford University, Stanford, CA, USA;
Leanne C. Powers, Chesapeake Biological Laboratory, University of Maryland Center for Environmental Science, Solomons, MD, USA