Videography Reveals In-Water Behavior of Loggerhead Turtles (Caretta caretta) at a Foraging Ground
 Samir H. Patel
 Kara L. Dodge
 Heather L. Haas
 Ronald J. Smolowitz1
- 1Coonamessett Farm Foundation, East Falmouth, MA, USA
- 2Integrated Statistics, Woods Hole, MA, USA
- 3NOAA Fisheries NEFSC, Woods Hole, MA, USA
Assessing sea turtle behavior at the foraging grounds has been primarily limited to the interpretation of remotely-sensed data. As a result, there is a general lack of detailed understanding regarding the habitat use of sea turtles during a phase that accounts for a majority of their lives. Thus, this study aimed to fill these data gaps by providing detailed information about the feeding habits, prey availability, buoyancy control, and water column usage by 73 loggerhead turtles across 45.7 h of video footage obtained from a remotely operated vehicle (ROV) from, 2008 to 2014. We developed an ethogram to account for 27 potential environmental and behavioral parameters. Turtles were filmed through the entire water column and we quantified the frequency of behaviors such as flipper beats, breaths, defecations, feedings and reactions to the ROV. We used the ROV's depth sensor and visible cues (i.e., water surface or benthic zone in view) to distinguish depth zones and assess the turtles' use of the water column. We also quantified interactions with sympatric biota, including potential gelatinous and non-gelatinous prey species, fish (including sharks), marine mammals and other sea turtles. We discovered that turtles tended to remain within the near surface and surface zones of the water column through the majority of the footage. During benthic dives, turtles consistently exhibited negative buoyancy and some turtles exhibited a dichotomous foraging behavior, first foraging within the water column, then diving to the benthic environment. Videography allowed us to combine behavioral observations and habitat features that cannot be captured by traditional telemetry methods, resulting in a broader understanding of loggerheads' ecological role in the U.S. Mid-Atlantic.
Introduction
Among sea turtles, loggerheads (Caretta caretta) are considered one of the most generalized species in terms of feeding and foraging behavior (Bolton, 2003). Throughout their lives, their diet is composed of a broad array of prey items, including macro algae, plants, and animals, ranging from surface dwelling species to obligate benthic organisms (Witherington, 2002; Seney and Musick, 2007; Casale et al., 2008). As a result, their foraging behavior corresponds to the quantity and quality of available resources (Hawkes et al., 2006; Hatase et al., 2010; Reich et al., 2010) with adult loggerheads exhibiting varying dive patterns dependent on local prey abundances (Patel et al., 2015a). This yields regional variability in loggerhead dive behavior and water column use at their numerous foraging sites. From a conservation standpoint, it is difficult to develop appropriate regional scale management plans for known foraging aggregations, without assessing their individual fine scale habitat use (Block et al., 2011; Schofield et al., 2013).
Sea turtles are cryptic and indirect approaches are often used to describe their at-sea movements and infer behaviors. For loggerheads foraging in the Northwest Atlantic Ocean, several studies have been conducted to track their movements and behaviors through satellite telemetry with over 350 tag deployments (Hawkes et al., 2007; McClellan and Read, 2007; Mansfield et al., 2009; Turtle Expert Working Group, 2009; Arendt et al., 2012a,b). Overall, these studies have identified a seasonal trend of turtles inhabiting the Mid-Atlantic Bight (MAB), shelf waters between Cape Hatteras, North Carolina and Long Island, New York, during the summer and early fall months; while during the winter and spring seasons, turtles transition to southern or warmer offshore waters (Turtle Expert Working Group, 2009). Tracked turtles also exhibited seasonal trends in their diving behavior, with turtles taking shorter dives during the warm summer months and longer dives during the winter months (Hawkes et al., 2007; Arendt et al., 2012a,b). Satellite telemetry research has provided valuable data in establishing the importance of the Mid-Atlantic as an important foraging ground for loggerhead turtles, as tracked juveniles, nesting females, and males all have maintained seasonal residency within the region.
However, due to the limited scope of remote sensing, several questions still remain regarding the ecology and habitat use of this population, especially when considering the high amount of fisheries with known sea turtle interactions (Murray, 2011, 2015; Warden et al., 2015). First, what are the feeding habits and prey available through the water column for loggerheads in this region? For example, Atlantic sea scallops are one of the most profitable fisheries in the United States and sea turtles have the potential to limit this fishery in several ways. Due to physical interactions with the scallop dredges, Turtle Deflector Dredges are required in high density turtle regions (Smolowitz et al., 2012). However, limited data are available on the prey preferences of this turtle population, both within the water column and on the benthos, and how that may affect fisheries' resources. Second, how are turtles reacting to gear in the water and does buoyancy control limit their abilities to avoid gear? Vertical line from set fishing gear is a known threat to sea turtles (Sampson, 2015); yet limited data are available on how turtles react when in contact with loose line that yields an entanglement. Furthermore, if turtles are exhibiting negative buoyancy when diving to the bottom, a behavior seen in green turtles by Hays et al. (2007), this could limit their ability to avoid moving gear as it is dragged across benthic environment. Third, what are turtles doing at the surface or within the near surface zone that may impact aerial observation? Remote sensing tools tend to lose accuracy at near surface depths (Fedak et al., 2002; Polovina et al., 2003), as a result turtle behavior in this zone is generally lumped into a breathing category and for aerial survey assessments a misunderstanding of the availability of turtles at the surface for sightings can yield inaccurate estimates of turtle populations (Marsh and Sinclair, 1989; Shoop and Kenney, 1992; Northeast Fisheries Science Center, 2011; Thomson et al., 2012, 2013; Innes et al., 2014; Fuentes et al., 2015).
To address uncertainties about loggerhead behavior on Mid-Atlantic shelf foraging grounds, Smolowitz et al. (2015) established the method of following a turtle with a remotely operated vehicle (ROV) to obtain video footage through the water column, a novel technique. Smolowitz et al. (2015) provides an overview of the types of data the ROV system can collect; lists sample sizes, sympatric species, prey species, and types of behavioral responses; and provides information about turtle dives into waters historically characterized as being too cold for loggerheads to inhabit (Spotila et al., 1997). Smolowitz et al. (2015) is a first look snapshot at a subset of the ROV data, and it did not quantify the full suite of observed behavior nor examine time series of behavior. We expand upon data obtained in Smolowitz et al. (2015) by quantifying behaviors and building time series of events. More specifically, whereas Smolowitz et al. (2015) lists sympatric species, we examined sympatric species interactions in depth. We assigned every second of each dive into a depth zone, quantified the amount of time that sympatric species were in view in each depth zone, and quantified the amount of time spent feeding in each depth zone. Whereas Smolowitz et al. (2015) lists the types of behaviors that can be observed, we quantified the number of times each behavior was observed, in each depth zone, and we illustrated a time series of behaviors that were logistically difficult to observe with traditional time-depth recorders. We also examine some behaviors, like buoyancy contol, that were not examined in Smolowitz et al. (2015).
In this paper, we built an ethogram of loggerhead behavior on Mid-Atlantic foraging grounds. An ethogram, which is essential to understanding animal behavior, is a quantitative collection of objective and mutually exclusive actions (Lehner, 1987; Sakamoto et al., 2009). Despite widespread reliance on ethograms as scientific tools to summarize and compare animal behavior (Lehner, 1987; Scheer et al., 2004; Howe et al., 2015) challenges associated with observing sea turtle behavior have restricted the number of ethograms built for these species (see Hailman and Elowson, 1992 for a nesting ethogram and Okuyama et al., 2013 for an ethogram based on eight turtles with animal borne data loggers). To provide the first ethogram of loggerheads on the Mid-Atlantic shelf foraging grounds, we developed a coding scheme unique to these data through the use of animal behavior analysis software. We quantified time spent in different depth zones, prey fields, feeding states, and inter- and intra-species interactions. Furthermore, we counted point events such as flipper beats, breaths, and defecations; and we built time series of animal behavior patterns. In doing so, we could relate these quantitative assessments to loggerhead conservation concerns difficult to evaluate without direct observation.
Methods
Details on the ROV specifications, operation techniques, deployment locations, and specific dates can be found in Smolowitz et al. (2015). Data were accrued across 10 trips from, 2008 to 2014 (Smolowitz et al., 2015). We filmed a total of 73 turtles, resulting in, 2742.1 min of video. During the behavioral analysis, we discovered 3 additional turtles in the footage compared to Smolowitz et al. (2015). This yielded an average of 37.6 min per turtle with a range from 30 s to 418.8 min. We excluded turtles filmed for less than 30 s from analyses.
Behavioral Analysis
Video footage was analyzed with the Observer XT Version 12 software package (Noldus Information Technology, Virginia, USA). We developed an ethogram to characterize turtle behaviors including state events (duration and frequency), point events (frequency only) and habitat variables (state events only). Full details and definitions of the 27 parameters that comprise the ethogram can be found in Table 1. Habitat variables included depth zones of the subject turtle, inter- and intra-species observations, and potential prey in view. Depth range was determined using the ROV depth sensor, which provided a live output of the ROV's depth, and visible cues, which were the water surface or benthic zone in view. As it was sometimes difficult to gauge if the turtle was within the same horizontal plane as the ROV, we could not specify the actual depth of the turtle and instead used descriptive values for depth zones. We categorized potential prey as unidentified material, gelatinous, or non-gelatinous, and identified potential prey to species level when possible. Inter- and intra-species observations included other sea turtles, fish (including sharks), and marine mammals. Turtle state event behavior variables included feeding and reaction to the ROV. Point events all corresponded to the actions of the subject turtle. We included four point events: mid-water body adjustment, flipper beat, breath and defecation. Although we did not code for buoyancy, during deep dives, we identified a turtle as being negatively buoyant once it stopped active flipper beating yet continued to descend at a high rate.
Table 1. Ethogram used to code the video footage.
Reliability Analysis
Two independent observers coded the videos. We chose 11 videos of varying lengths to test the inter-observer agreement (precision) of coding (Viera and Garrett, 2005). We compared our results using a reliability analysis algorithm in the Observer XT software. Precision is reported as a kappa statistic, giving a quantitative measure of the agreement between observers based on a −1 to 1 scale, where 1 is perfect agreement, 0 is exactly what is expected by chance, and negative values are indicative of systematic disagreement (Landis and Koch, 1977; Viera and Garrett, 2005). We interpreted our kappa values using the commonly cited scale in Landis and Koch (1977), aiming for a minimum of substantial agreement (0.61–0.80) on all 11 test videos before distributing the remaining footage between the two observers to code separately. We used an analysis of covariance (ANCOVA) to test if the kappa statistic and percentage of agreement from the reliability analysis was related to the duration of the video. We set the significance level to p = 0.05. Statistical analyses were performed in R (R Core Team, 2016).
Results
Reliability Analysis
Eleven videos were used for the reliability analysis to compare observations between the two observers. Test videos varied in length from 4.9 to 40.7 min, and included 22 of the total 27 observation parameters. The five parameters (feeding on non-gelatinous prey, multiple turtles in view including subject turtle, fish and multiple turtles in view including subject turtle, non-gelatinous prey in view only, gelatinous and non-gelatinous prey in view only) not identified in these videos occurred very infrequently throughout the total footage (0–2.3% of total footage per parameter). Videos ranged from 157 to 948 observations, depending on duration and observer. Average kappa value for the 11 videos was 0.68 with a range from 0.61 to 0.76 and there was an average of 84.6% (range = 77.7–90.8%) agreement between observers. There was not a significant relationship when comparing duration of video with kappa value (p = 0.6) or percentage of agreement (p = 0.1).
Feeding
We identified feeding and non-feeding behaviors when the turtle's mouth was in view of the camera. Because we often followed the subject from behind, we categorized 82.2% of total film time as unknown if feeding (Supplementary Table 1). Of the time when we could see the mouth and face of the turtles (17.8% of total time), we categorized 85.0% of time as not feeding, 13.0% of time as feeding on non-gelatinous prey and 2.0% of time as foraging on gelatinous prey. Foraging on gelatinous prey only occurred near surface or within the water column with an approximate depth range from 1 to 16 meters and a median depth of about 4 meters (Figure 1A). We identified five turtles foraging on gelatinous prey 45 times, and gelatinous prey was widely available throughout the water column including near the bottom. Foraging on non-gelatinous prey only occurred while the turtle was on the bottom. We identified two turtles foraging on gelatinous prey that also made dives to the benthic environment (Figure 2A). Although these turtles dove to the sea floor, we did not observe them foraging on benthic organisms, as we were only able to track them on the bottom for a total of 3.4 min.
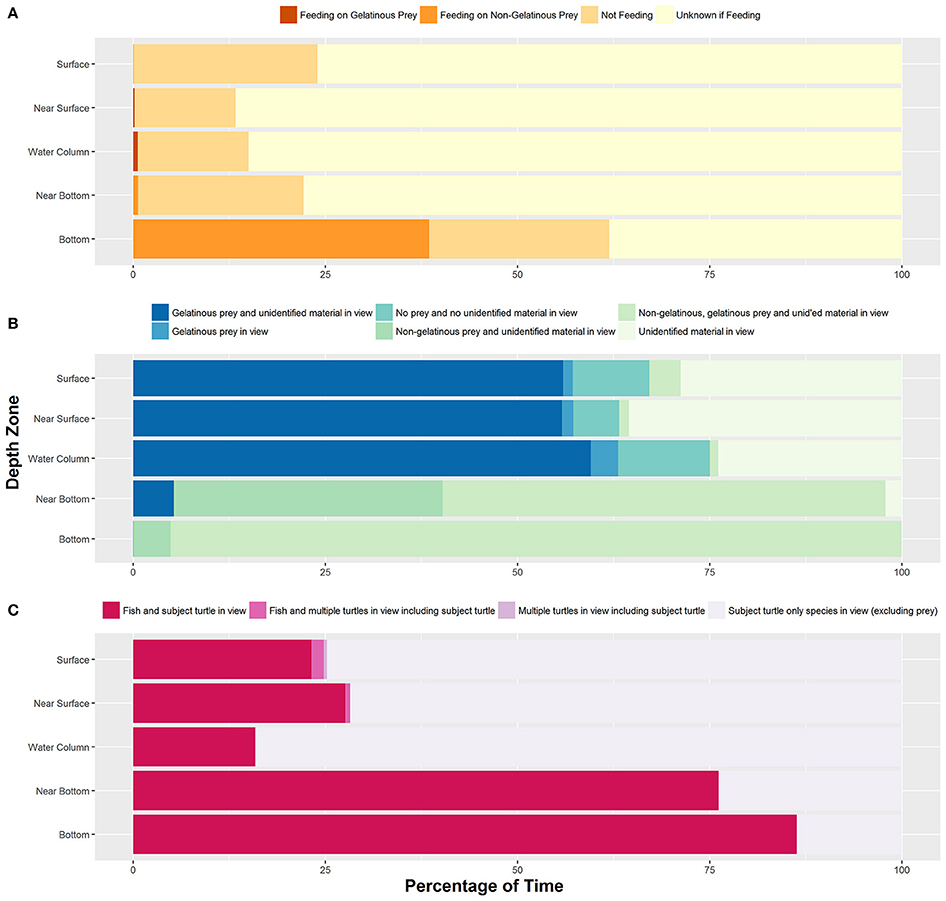
Figure 1. (A) Percentage of time all turtles (n = 73) exhibited each type of feeding behavior within each depth zone. (B) Percentage of time each prey species category was identified in each depth zone. (C) Percentage of time all turtles experienced each type of inter-/intra-species interaction within each depth zone. Sample sizes for each behavior can be found in Supplementary Table 1.
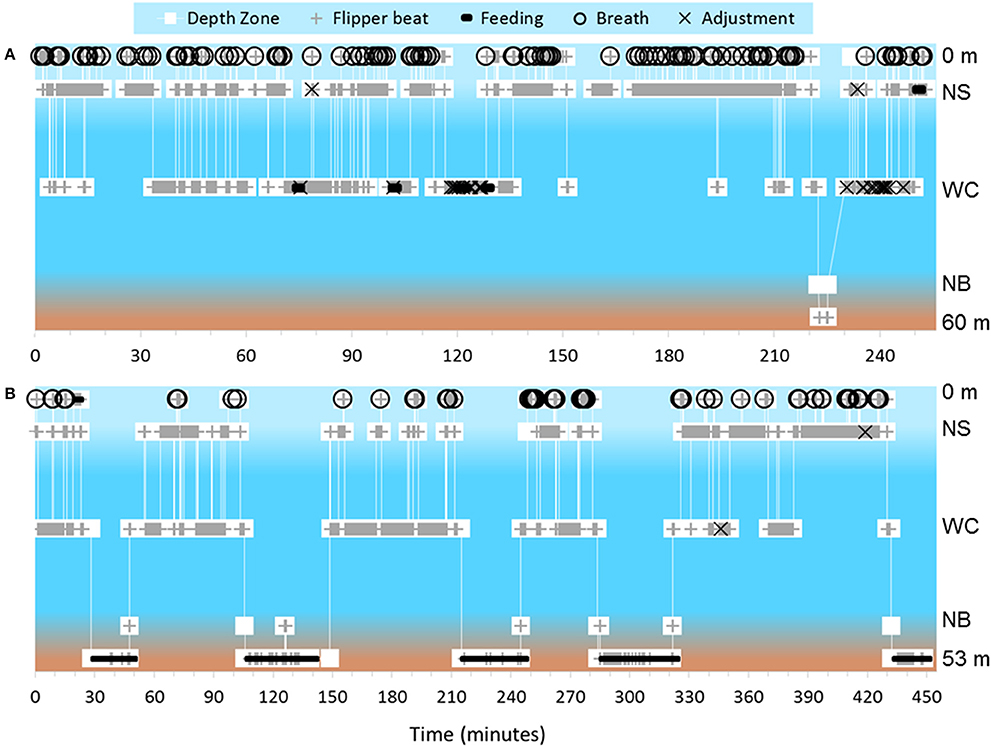
Figure 2. Depth zones are based on the coding scheme and are as follows from top to bottom: 0 m, = Surface; NS, Near Surface; WC, Water Column; NB, Near Bottom; 60 m and 53 m respectively, Bottom. (A) Dive profile for turtle that exhibited both pelagic foraging and a benthic dive during the course of filming. This turtle primarily foraged on gelatinous zooplankton, and this pelagic foraging behavior yielded a swim pattern with a particularly high amount of adjustment events. Bottom depth was 60 m. (B) Dive profile of the longest tracked turtle. This turtle dove five times within ~7 h and exhibited active benthic foraging each time. Bottom depth was 53 m.
Depth Zones
Tracked turtles were found most commonly swimming within the near surface region (42.0% of total time) or water column (44.3% of total time). We filmed turtles at the surface 7.3% of time, with time spent in this depth zone primarily related to breathing events. Turtles spent 0.4% of time near bottom and 6.0% of time directly on the bottom. Time near bottom and on the bottom corresponded to benthic foraging, with near bottom time associated with turtles moving between benthic foraging spots or chasing mobile prey. When turtles were lost from view, most were near surface or in the water column and they swam out of range of the ROV tether or swam too fast for the ROV to follow. The ROV was not quick enough to always follow turtles to the benthic zone, as the turtles became negatively buoyant at depth and could sink at a rate faster than the ROV could fly. We followed 14 turtles on 18 deep dives, losing seven turtles from view during the descent without reacquiring them. Of these 14 turtles, we tracked nine across 13 dives as they reached negative buoyancy. We identified negative buoyancy occurring when the turtles reached between 10 and 33 m. We were able to follow one turtle through 5 deep dives, and this turtle exhibited negative buoyancy at different depths each time (Figure 2B). This turtle stopped active flipper beating at approximately 26, 31, 18, 33, and 29 m for its 5 dives respectively, with each dive reaching between 49 and 53 m. There was no clear relationship between depth of negative buoyancy and dive depth or duration.
We identified seven turtles reaching the benthic environment and of these turtles we identified three foraging on benthic prey. We lost the remaining four turtles from view prior to filming active foraging. Benthic dives reached an average depth of 51.8 m, with a range from 46 to 60 m. Three turtles were lost from view during the benthic dive and were not reacquired. One turtle was lost from view during the deep dive, but was reacquired after approximately 45 min near surface. The fifth turtle was lost from view during the ascent to the surface and was not reacquired. The sixth turtle was lost from view during its fifth recorded benthic dive. The previous 4 dives were recorded through the entire process from descent to ascent. The last turtle was lost from view during the benthic dive but was reacquired at the surface after 19 min.
Prey Species in View
We frequently identified gelatinous prey in view, accounting for 63.4% of total footage time (Figure 1B). The water column was devoid of prey and (or) unidentifiable material 8.5% of total time. We categorized the water column as having only unidentifiable material 27.6% of total time. The presence of non-gelatinous prey was identified 7.7% of the total time, and this was associated with the turtle being on the bottom. The presence of non-gelatinous prey was associated with the presence of both gelatinous prey and unidentifiable material. A complete list of identified species actively preyed upon by filmed loggerheads can be found in Smolowitz et al. (2015).
Inter- and Intra-Species Observations
For total time filmed, only the subject turtle was in view (excluding prey) 73.7% of time (Figure 1C). We filmed seven incidences of multiple turtles in view, with five of these events also including fish species in view. Of the total time filmed, 0.46% included multiple turtles. In terms of fish species in view, a total of 25.8% of time included the subject turtle with associated fish. A list of the inter/intra species interactions can be found in Smolowitz et al. (2015).
Reaction to ROV
Subject turtles did not display a strong reaction to the ROV, with 92.7% of time categorized as no reaction by the subject and the remaining time (7.3%) categorized as subject turtle reacting to the ROV. Although turtles did not spend much time reacting to the ROV, we documented 54 turtles exhibiting some type of reaction. This included circling the ROV from a distance along with close inspection of the ROV. One turtle spent ~14 min continuously nudging and rubbing against the ROV while in the water column; on the ocean floor, another turtle spent ~4 mins biting and head butting the ROV in addition to foraging, eventually losing interest and returning to the surface. On occasion turtles also interacted with the tether of the ROV, brushing against the tether as they swam past. Turtles reacted to these interactions by continuing to swim forward, and due to our ability to move the ROV and tether, along with the thickness and stiffness of the tether, the turtle did not become entangled. These tether interactions occurred as the turtle circled the ROV and in one instance as the turtle was on the ocean floor. One turtle that experienced the closest interaction to an entanglement, momentarily got the tether caught between its flipper and head (Figure 3A). This turtle was able to maneuver away from the tether. Another turtle, while on the ocean floor, walked over the tether, then walked under the tether and briefly got its back flipper caught. Again, the turtle was able to maneuver out of contact with the tether.
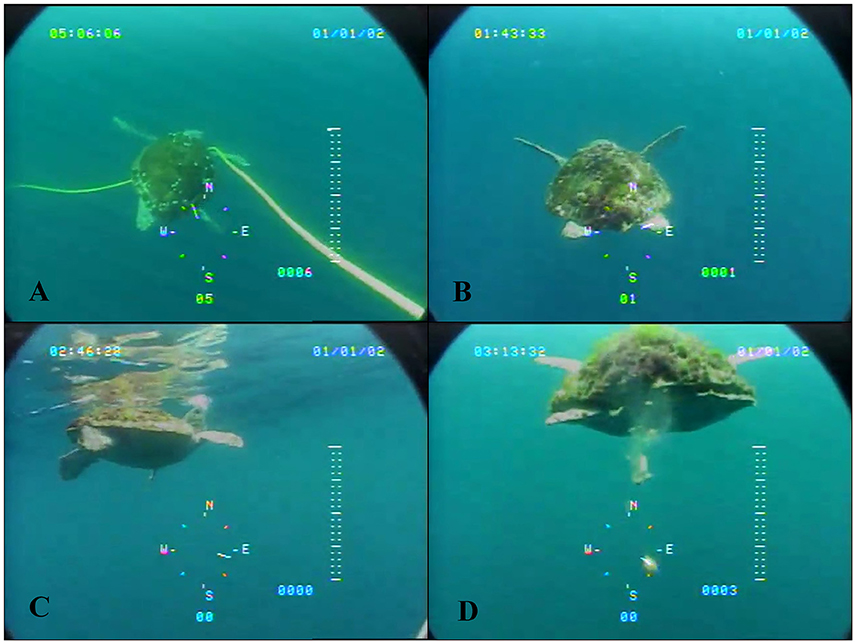
Figure 3. (A) Turtle interacting with the ROV tether, briefly getting it caught between its own head and right front flipper. (B) Flipper orientation we classified as the start of a flipper beat. (C) Footage classified as a breathing event. (D) Footage classified as a defecation event.
Point Events
From all video footage, we counted a total of 39,382 flipper beats, 141 mid-water body adjustments, 1053 breathing events and 13 defecations events (Figures 3B–D). Defecation events took place within the water column or near surface by a total of 10 turtles. We calculated an average flipper beat frequency of ~0.24 Hz (~14.3 beats per min) across all turtles. Flipper beats decreased substantially when turtles were either on the surface or on the bottom. Turtles had an average flipper beat frequency of ~0.28 Hz (~16.6 flipper beats per min) when they were in intermediate depth zones.
Although we counted 1053 breathing events, they were generally short and accounted for a small percentage of the total footage, as indicated by the amount of time turtles were observed at the surface. Prior to deep dives, however, turtles spent an extended amount of time at the surface breathing. We tracked five turtles prior to their benthic dives, with each spending between 3.4 and 5.9 min continuously at the surface immediately prior to diving, while throughout the remainder of the footage these turtles only spent between 2 s and 3.9 min at the surface continuously. The sixth turtle tracked to the benthos exhibited a unique behavior, diving after a quick 3.6 s at the surface, while the seventh turtle we tracked to the bottom was acquired in the midst of its descent.
Turtles exhibited an adjustment in their swim pattern primarily when grabbing prey out of the water column. Adjustments were considered an indicator of potential pelagic foraging when we could not directly observe the turtle's mouth. We counted 141 adjustment events across 21 turtles, with most of these turtles exhibiting 1–5 adjustments during filming. Turtles that foraged in the water column exhibited a higher number of adjustment events ( = 13.3 ± 11.2) compared to those that foraged on benthos ( = 1.3 ± 0.6). One turtle, however, exhibited 30 adjustments across the 153.7 min of footage. This turtle spent the majority of time actively swimming horizontally through the water column, exhibiting swimming behaviors consistent with observed water column foraging, broken up by 13 quick breathing events (2.5% of total time at surface with 38 confirmed breaths).
Discussion
With the combined advances in in-water videography and the corresponding development of integrative behavior-coding software, this study presents the first ethogram for foraging loggerheads in the seasonally important region of the Mid-Atlantic Bight. As a result, we were able to quantify data typically difficult to obtain through alternative means. Specifically, we observed turtles in highly important surface waters. Typically, telemetry devices, due to their inability to accurately gauge the near surface zone below ~1 m of resolution or due to a low sampling rate to conserve battery, group depths such that any dive appearing to be above a specified threshold (e.g., ~5 m) is considered “surface” time associated with breathing (Fedak et al., 2002; Polovina et al., 2003; Hazel et al., 2009; Hagihara et al., 2011). Here we tracked turtles spending a majority of their time within the top few meters of the water column, with only a small percentage of that time breaching the surface to breathe and even a smaller percentage of time in-transit through these depths as turtles tended to remain within the upper water column. This is contradictory to an example of foraging behavior identified through telemetry for turtles in this region (Hawkes et al., 2007). In comparing individual dive profiles, Hawkes et al. (2007) presented a turtle during foraging behavior spending little time at or near the surface; while our time series data seems to show the opposite. Our results may be slightly biased, as turtles were easier to track in good weather and while within the surface and near surface zones, and more difficult to track during benthic dives. However, only ~19% of turtles attempted deep dives while in view and instead most turtles were lost from view while moving horizontally away from the ROV. Regardless, even though turtles use the entire water column, the top few meters represent an important depth strata where they reside during the warm foraging months. This has two conservation implications: (1) when sub-surface turtles are used in abundance estimates done through aerial surveys, availability biases of loggerheads to visual observers need to explicitly consider near-surface layers, and (2) gear modifications aimed at conserving Mid-Atlantic loggerheads should be effective in near-surface waters.
Telemetry studies typically group turtles into benthic or pelagic foragers based on the dive behavior and location (Hatase et al., 2002; Luschi et al., 2003; Hawkes et al., 2006). However, here we identified turtles exhibiting both behaviors of active pelagic foraging followed by dives to the benthic environment. Thus, loggerheads may have a higher level of flexibility in their foraging abilities than typically recognized (Luschi et al., 2003; McClellan et al., 2010). Although Mid-Atlantic shelf loggerheads may potentially have a preference toward benthic fauna over pelagic fauna when both are available, they are spending the majority of their time in the water column that is rich with gelata. Previously, NMFS expected loggerheads to be more prone to interactions on the bottom (National Marine Fisheries Service, 2015), but the heavy use of near surface waters and the prevalence of abundant gelata call this assumption into question for Mid-Atlantic shelf loggerheads. Unfortunately, our view of the turtle's head was sometimes obscured due to the angle of the camera, as a result diet preference could not be quantified limiting our ability to understand loggerhead foraging preferences. However, with the addition of a high resolution camera, the field of view and the level of detail would be much improved making assessments on foraging preference much easier.
Similar to green turtles (Chelonia mydas) studied via crittercam by Hays et al. (2007), we identified that loggerheads are most likely exhibiting negative buoyancy while foraging on benthos. Buoyancy control amongst loggerheads has been studied primarily through indirect or lab based methods, with these studies making assumptions on lung capacity of each turtle based on their size in order to make appropriate buoyancy calculations (Minamikawa et al., 2000; Hochscheid et al., 2003; Hays et al., 2004). Here, we were able to directly observe, in situ, turtles reaching a point of negative buoyancy during their benthic dives. Hays et al. (2004) previously suggested that perhaps turtles exhibit negative buoyancy when diving to the bottom to reduce the likelihood of floating upwards. The physiology of achieving negative buoyancy is explained by Hays et al. (2007). In our footage, turtles display negative buoyancy, making staying at the bottom easier, as they are able to sink after reaching a certain depth without actively swimming and at a rate faster than a powered ROV (~0.35 m s−1). The turtles we filmed swimming within one meter of the bottom either chasing prey or moving between discrete foraging spots, had to continuously push off the bottom or actively flipper beat in order to avoid sinking; while those we filmed returning to the surface from the sea floor had to propel themselves through a majority of the ascent. The strong negative buoyancy and active prey searching of observed loggerheads likely limit the abilities of these turtles to outmaneuver and avoid benthic fishing gear. Therefore, gear modifications that passively deflect benthic turtles (Smolowitz et al., 2012) rather than relying on active sea turtle avoidance behavior likely have important conservation value.
In contrast to studies that use animal-borne devices, we were able to document the reaction of the turtle to the research technique. For telemetry devices attached to sea turtles, researchers have speculated on the animal's reaction to capture, handling, and instrument impact (Wilson and McMahon, 2006) and there's been an effort to quantify the drag caused by telemetry devices (Jones et al., 2013). Turtle reaction has also been inferred from animal-borne cameras through comparison of immediate post-release behavior and footage collected after a one-day delay (Thomson and Heithaus, 2014). With the use of the ROV, we could directly assess the turtles' reactions to our tracking method and compare their behavior to what we assumed was normal in-water behavior (ignoring the ROV). Furthermore, we were able to classify this reaction as the turtle not identifying the ROV as a threat but rather as a curiosity, as we filmed a turtle's predator avoidance response (turning its carapace toward the threat) in the presence of a shark but never recorded an avoidance response to the ROV (see Smolowitz et al., 2015).
Inadvertent interactions with the tether provided information about sea turtle interactions with vertical lines, a conservation concern that is poorly understood (http://www.greateratlantic.fisheries.noaa.gov/protected/seaturtles/docs/vertical_line_summary_final.pdf). Fortunately, the use of a taut and thick tether on the ROV helped limit the interactions from becoming true entanglements. However, along the northeast US seaboard, from Maine to Virginia, between 2002 and 2014 over 20 sea turtles were reported entangled in vertical fishing line annually (Sampson, 2015). No data exists to identify how often turtles interact with vertical lines and do not entangle. Although studies have been conducted to document the occurrence of entanglement between sea turtles and vertical lines from stationary nets (see Gilman et al., 2010), very limited research has been focused on understanding how and why hard shelled turtles become entangled on vertical lines. From our footage, we observed that the entanglement may start with a line becoming caught between the front flipper and head with the turtle reacting by swimming forward in an escape response and forcing more line to cover the individual. It seems likely that entanglements could also be triggered through contact with the back flipper, with both scenarios potentially becoming worse if involving light flexible line that has the ability to create small tight loops at a diameter less than the turtle's flipper or neck.
This study was limited, however, due to our inability to obtain a full suite of data for each turtle, or for certain events to provide a complete analyses. For example, although we followed turtles diving to the bottom, we rarely were able to film the number of breaths prior to the dive, the complete descent, and then the return to the surface. This limited our ability to correlate depth at achieving negative buoyancy with diving parameters. As a second example, we were able to count over 39,000 flipper beats; but without knowing the size of the turtle or the number of breaths, we could not make conclusions on the metabolic requirements for this level of activity (Prange, 1976). In addition to the difficulty in simply acquiring usable footage, the analyses is much more time consuming than what is required for remote sensed data; on average it took us 2 h to code 1 h of footage. As a result, we have found that currently videography is a complementary tool useful for investigating specific events and behaviors at a finer scale and the value of telemetry data will continue to increase by providing the where, when and how to use these complementary tools. However, as technology advances and becomes more cost effective, thus removing limitations such as poor camera quality and low thrust of the ROV, we expect videography to be a common method for building accurate ethograms for sea turtles. Furthermore, as technologies like sonar and drones (Hodgson et al., 2013; Bevan et al., 2016) become more readily available, finding and tracking turtles for extended periods ought to become much easier.
This ROV-based behavioral analysis did, nevertheless, provide important insights into sea turtle assessment and conservation. First, the development of an ethogram for loggerheads at a foraging ground may provide a standard by which researchers can compare behaviors across populations. As the use satellite telemetry increased, researchers developed analytical tools to allow for easy comparison of data (e.g., Jonsen et al., 2007; Dodge et al., 2014; Patel et al., 2015b; Bestley et al., 2015). We expect a similar trend to occur as the use of videography increases in marine research. Second, the ability to provide additional perspectives in quantifying time spent in the near surface and surface zones can inform availability estimates used in determining population size through aerial surveys. Third, within the water column, we acquired a substantial amount of footage (>50% total footage) of gelatinous zooplankton, organisms which may be in important food sources and are typically difficult to track in situ. As climate change is known to have a strong impact on gelatinous zooplankton (Richardson, 2008), improving our ability to track their presence and predation will provide valuable insight into the foraging ecology of a range of animals dependent on gelatinous organisms for food. Fourth, with loggerheads exhibiting negative buoyancy while foraging on the bottom, they may be limited in their ability to avoid dredges or trawls as it would be more difficult to swim toward the surface even if alerted. Finally, we identified that loggerheads tend to react poorly when interacting with line in the water. This is particularly important as world fish stocks are supplemented by aquaculture, especially in the environments overlapping with sea turtles, as these systems use a range of vertical line features (Naylor et al., 2000).
Author Contributions
RS obtained all ROV footage. SP and KD coded the video. KD performed the reliability analysis. SP analyzed the data. SP and HH wrote ms and made the tables and figures. All authors developed the project plan and contributed in editing and improving the manuscript.
Conflict of Interest Statement
The authors declare that the research was conducted in the absence of any commercial or financial relationships that could be construed as a potential conflict of interest.
The reviewer GS and handling Editor declared their shared affiliation, and the handling Editor states that the process nevertheless met the standards of a fair and objective review.
Acknowledgments
We thank James Gutowski of Viking Village Fisheries and the captains, crew and scientists on the F/V Kathy Ann for their expert field work and William Campbell of Ocean Eye Underwater ROV Operations for piloting the ROV. Kathryn Goetting, Carl Huntsberger, Eric Matzen, Shea Miller, Brianna Valenti, Daniel Ward, and Matthew Weeks were integral to the success of this project. This project was funded in part by the scallop industry Sea Scallop Research Set Aside program administered by the Northeast Fisheries Science Center under grants from NA10NMF4540472 to NA14NMF4540079 and by the U.S. Department of the Interior, Bureau of Ocean Energy Management, Environmental Studies Program, Washington, DC, through Inter-Agency Agreement Number M10PG00075 with the National Marine Fisheries Service as the Atlantic Marine Assessment Program for Protected Species (AMAPPS). The work was conducted under ESA permit #14249 issued to Coonamessett Farm Foundation, Inc. and ESA permit #1576 issued to the Northeast Fisheries Science Center. We would like to thank the three reviewers for their valuable insight, leading to a much improved manuscript.
Supplementary Material
The Supplementary Material for this article can be found online at: https://www.frontiersin.org/article/10.3389/fmars.2016.00254/full#supplementary-material
References
Arendt, M., Segars, A., Byrd, J., Boynton, J., Schwenter, J., Whitaker, J., et al. (2012a). Migration, distribution, and diving behavior of adult male loggerhead sea turtles (Caretta caretta) following dispersal from a major breeding aggregation in the Western North Atlantic. Mar. Biol. 159, 113–125. doi: 10.1007/s00227-011-1826-0
Arendt, M., Segars, A., Byrd, J., Boynton, J., Whitaker, J., Parker, L., et al. (2012b). Seasonal distribution patterns of juvenile loggerhead sea turtles (Caretta caretta) following capture from shipping channel in the Northwest Atlantic Ocean. Mar. Biol. 159, 127–139. doi: 10.1007/s00227-011-1829-x
Bestley, S., Jonsen, I. D., Hindell, M. A., Harcourt, R. G., and Gales, N. J. (2015). Taking animal tracking to new depths: synthesizing horizontal-vertical movement relationships for four marine predators. Ecology 96, 417–427. doi: 10.1890/14-0469.1
Bevan, E., Wibbels, T., Navarro, E., Rosas, M., Najera, B. M. Z., Sarti, L., et al. (2016). Using unmanned aerial vehicles (UAV) technology for locating, identifying, and monitoring courtship and mating behavior in the Green Turtle (Chelonia mydas). Herpetol. Rev. 47, 27–32.
Block, B. A., Jonsen, I. D., Jorgensen, S. J., Winship, A. J., Shaffer, S. A., Bograd, S. J., et al. (2011). Tracking apex marine predator movements in a dynamic ocean. Nature 475, 86–90. doi: 10.1038/nature10082
Bolton, A. (2003). “The loggerhead sea turtle – a most excellent fishe,” in Loggerhead Sea Turtles, eds A. B. Bolton and B. E. Witherington (Washington, DC: Smithsonian Books), 1–3.
Casale, P., Abbate, G., Freggi, D., Conte, N., Oliverio, M., and Argano, R. (2008). Foraging ecology of loggerhead sea turtles Caretta caretta in the central Mediterranean Sea: evidence for a relaxed life history model. Mar. Eco. Prog. Ser. 372, 265–276. doi: 10.3354/meps07702
Dodge, K. L., Galuardi, B., Miller, T. J., and Lutcavage, M. (2014). Leatherback turtle movements, dive behavior, and habitat characteristics in ecoregions of the northwest Atlantic Ocean. PLoS ONE 9:e91726. doi: 10.1371/journal.pone.0091726
Fedak, M., Lovell, P., McConnell, B., and Hunter, C. (2002). Overcoming the constraints of long range radio telemetry from animals: getting more useful data from smaller packages. Integ. Comp. Biol. 42, 3–10. doi: 10.1093/icb/42.1.3
Fuentes, M., Bell, I., Hagihara, R., Hamann, M., Hazel, J., Huth, A., et al. (2015). Improving in-water estimates of marine turtle abundance by adjusting aerial survey counts for perception and availability biases. J. Exp. Mar. Bio. Ecol. 417, 77–83. doi: 10.1016/j.jembe.2015.05.003
Gilman, E., Gearhart, J., Price, B., Eckert, S., Milliken, H., Wang, J., et al. (2010). Mitigating sea turtle by-catch in coastal passive net fisheries. Fish Fish. 11, 57–88. doi: 10.1111/j.1467-2979.2009.00342.x
Hagihara, R., Jones, R. E., Sheppard, J. K., Hodgson, A. J., and Marsh, H. (2011). Minimizing errors in the analysis of dive recordings from shallow-diving animals. J. Exp. Mar. Bio. Ecol. 399, 173–181. doi: 10.1016/j.jembe.2011.01.001
Hailman, J., and Elowson, A. (1992). Ethogram of the nesting female loggerhead (Caretta caretta). Herpetologica 48, 1–30.
Hatase, H., Omuto, K., and Tsukamoto, K. (2010). Oceanic residents, neritic migrants: a possible mechanism underlying foraging dichotomy in adult female loggerhead turtles (Caretta caretta). Mar. Bio. 157, 1337–1342. doi: 10.1007/s00227-010-1413-9
Hatase, H., Takai, N., Matsuzawa, Y., Sakamoto, W., Omuta, K., Goto, K., et al. (2002). Size-related differences in feeding habitat use of adult female loggerhead turtles Caretta caretta round Japan determined by stable isotope analyses and satellite telemetry. Mar. Eco. Prog. Ser. 233, 273–281. doi: 10.3354/meps233273
Hawkes, L., Broderick, A., Coyne, M., Godfrey, M., and Godley, B. (2007). Only some like it hot – quantifying the environmental niche of the loggerhead sea turtle. Divers. Distrib. 13, 447–457. doi: 10.1111/j.1472-4642.2007.00354.x
Hawkes, L. A., Broderick, A. C., Coyne, M. S., Godfrey, M. H., Lopez-Jurado, L. F., Lopez-Suarez, P., et al. (2006). Phenotypically linked dichotomy in sea turtle foraging requires multiple conservation approaches. Curr. Bio. 16, 990–995. doi: 10.1016/j.cub.2006.03.063
Hays, G., Marshall, G., and Seminoff, J. (2007). Flipper beat frequency and amplitude changes in diving green turtles, Chelonia mydas. Mar. Biol. 150, 1003–1009. doi: 10.1007/s00227-006-0412-3
Hays, G., Metcalf, J., and Walne, A. (2004). The implications of lung-regulated buoyancy control for dive depth and duration. Ecology 85, 1137–1145. doi: 10.1890/03-0251
Hazel, J., Lawler, I. R., and Hamann, M. (2009). Diving at the shallow end: green turtle behaviour in near-shore foraging habitat. J. Exp. Mar. Bio. Ecol. 371, 84–92. doi: 10.1016/j.jembe.2009.01.007
Hochscheid, S., Bentivegna, F., and Speakman, J. (2003). The dual function of the lung in chelonian sea turtles: buoyancy control and oxygen storage. J. Exp. Mar. Bio. Ecol. 297, 123–140. doi: 10.1016/j.jembe.2003.07.004
Hodgson, A., Kelly, N., and Peel, D. (2013). Unmanned Aerial Vehicles (UAVs) for surveying marine fauna: a dugong case study. PLoS ONE 8:e79556. doi: 10.1371/journal.pone.0079556
Howe, M., Castellote, M., Garner, C., McKee, P., Small, R., and Hobbs, R. (2015). Beluga, Delphinapterus leucas, ethogram: a tool for cook inlet beluga conservation? Mar. Fish. Rev. 77, 32–41. doi: 10.7755/mfr.77.1.3
Innes, S., Heide-Jørgensen, M., Laake, J., Laidre, K., Cleator, H., Richard, P., et al. (2014). Surveys of belugas and narwhals in the Canadian High Arctic in, 1996. NAMMCO Sci. Publ. 4, 169–190. doi: 10.7557/3.2843
Jones, T., Van Houtan, K., Bostrom, B., Ostafichuk, P., Mikkelsen, J., Tezcan, E., et al. (2013). Calculating the ecological impacts of animal-borne instruments on aquatic organisms. Methods Ecol. Evol. 4, 1178–1186. doi: 10.1111/2041-210X.12109
Jonsen, I., Myers, R., and James, M. (2007). Identifying leatherback turtle foraging behavior from satellite telemetry using a switching state-space model. Mar. Eco. Prog. Ser. 337, 255–264. doi: 10.3354/meps337255
Landis, J. R., and Koch, G. G. (1977). The measurement of observer agreement for categorical data. Biometrics 33, 159–174. doi: 10.2307/2529310
Lehner, P. (1987). Design and execution of animal behavior research: an overview. J. Anim. Sci. 65, 1213–1219. doi: 10.2527/jas1987.6551213x
Luschi, P., Hughes, G., Mencacci, R., De Bernardi, E., Sale, A., Broker, R., et al. (2003). Satellite tracking of migrating loggerhead sea turtles (Caretta caretta) displaced in the open sea. Mar. Biol. 143, 793–801. doi: 10.1007/s00227-003-1117-5
Mansfield, K., Saba, V., Keinath, J., and Musick, J. (2009). Satellite tracking reveals a dichotomy in migration strategies among juvenile loggerhead turtles in the Northwest Atlantic. Mar. Biol. 156, 2555–2570. doi: 10.1007/s00227-009-1279-x
Marsh, H., and Sinclair, D. (1989). An experimental evaluation of dugong and sea turtle aerial survey techniques. Aust. Wildl. Res. 16, 639–650. doi: 10.1071/WR9890639
McClellan, C., Braun-McNeill, J., Avens, L., Wallace, B., and Read, A. (2010). Stable isotopes confirm a foraging dichotomy in juvenile loggerhead sea turtles. J. Exp. Mar. Bio. Ecol. 387, 44–51. doi: 10.1016/j.jembe.2010.02.020
McClellan, C. M., and Read, A. J. (2007). Complexity and variation in loggerhead sea turtle life history. Biol. Lett. 3, 592–594. doi: 10.1098/rsbl.2007.0355
Minamikawa, S., Naito, Y., Sato, K., Matsuzawa, Y., Bando, T., and Sakamoto, W. (2000). Maintenance of neutral buoyancy by depth selection in the loggerhead turtle Caretta caretta. J. Exp. Biol. 203, 2967–2975.
Murray, K. (2011). Interactions between sea turtles and dredge gear in the U.S. sea scallop (Placopecten magellanicus) fishery, 2001 – 2008. Fish. Res. 107, 137–146. doi: 10.1016/j.fishres.2010.10.017
Murray, K. (2015). The importance of location and operational fishing factors in estimating and reducing loggerhead turtle (Caretta caretta) interactions in U.S. bottom trawl gear. Fish. Res. 172, 440–451. doi: 10.1016/j.fishres.2015.08.012
National Marine Fisheries Service (2015). Endangered species Act section 7 Consultation on the Atlantic Sea Scallop Fishery Management Plan [consultation No. F/1NER/20I2/01461] with, 2015 Amended ITS. St. Petersburg, FL.
Naylor, R. L., Goldberg, R. J., Primavera, J. H., Kautsky, N., Beveridge, M. C., Clay, J., et al. (2000). Effect of aquaculture on world fish supplies. Nature 405, 1017–1024. doi: 10.1038/35016500
Northeast Fisheries Science Center (2011). Preliminary Summer, 2010 Regional Abundance Estimate of Loggerhead Turtles (Caretta caretta) in Northwestern Atlantic Ocean Continental Shelf Water. Woods Hole, MA: U.S. Department of Commerce, Northeast Fisheries Science Center Reference Document 11-03.
Okuyama, J., Nakajima, K., Noda, T., Kimura, S., Kamihata, H., Kobayashi, M., et al. (2013). Ethogram of immature green turtles: behavioral strategies for somatic growth in large marine herbivores. PLoS ONE 8:e65783. doi: 10.1371/journal.pone.0065783
Patel, S., Morreale, S., Panagopoulou, A., Bailey, H., Robinson, N., Paladino, F., et al. (2015b). Changepoint analysis: a new approach for revealing animal movements and behaviors from satellite telemetry data. Ecosphere 6, 12. doi: 10.1890/ES15-00358.1
Patel, S., Panagopoulou, A., Morreale, S., Kilham, S., Karakassis, I., Riggall, T., et al. (2015a). Differences in size and reproductive output of loggerhead turtles (Caretta caretta) nesting in the Eastern Mediterranean Sea are linked to foraging site. Mar. Eco. Prog. Ser. 535, 231–241. doi: 10.3354/meps11433
Polovina, J., Howell, E., Parker, D., and Balazs, G. (2003). “Dive-depth distribution of loggerhead (Carretta carretta) and olive ridley (Lepidochelys olivacea) sea turtles in the central North Pacific: Might deep longline sets catch fewer turtles?” in Fifteenth Meeting of the Standing Committee On Tuna and Billfish (SCTB 15), (Hawaii).
R Core Team (2016). R: A Language and Environment for Statistical Computing. Vienna: R Foundation for Statistical Computing.
Reich, K., Bjorndal, K., Frick, M., Witherington, B., Johnson, C., and Bolton, A. (2010). Polymodal foraging and adult female loggerheads (Caretta caretta). Mar. Bio. 157, 113–121. doi: 10.1007/s00227-009-1300-4
Richardson, A. (2008). In hot water: zooplankton and climate change. ICES J. Mar. Sci. 65, 279–295. doi: 10.1093/icesjms/fsn028
Sakamoto, K. Q., Sato, K., Ishizuka, M., Watanuki, Y., Takahashi, A., Daunt, F., et al. (2009). Can ethograms be automatically generated using body acceleration data from free-ranging birds? PLoS ONE 4:e5379. doi: 10.1371/journal.pone.0005379
Sampson, K. (2015). Sea Turtle Entanglement at the GARFO Aquaculture Workshop. Gloucester: National Marine Fisheries Service.
Scheer, M., Hofmann, B., and Behr, I. (2004). Ethogram of selected behaviors initiated by free-ranging short-finned pilot whales (Globicephala macrorhynchus) and directed to human swimmers during open water encounters. Anthrozoös 17, 244–258. doi: 10.2752/089279304785643267
Schofield, G., Dimadi, A., Fossette, S., Katselidis, K., Koutsoubas, D., Lilley, M., et al. (2013). Satellite tracking large numbers of individuals to infer population level dispersal and core areas for the protection of an endangered species. Divers. Distrib. 19, 834–844. doi: 10.1111/ddi.12077
Seney, E., and Musick, J. (2007). Historical diet analysis of loggerhead sea turtles (Caretta caretta) in Virginia. Copeia 2, 478–489. doi: 10.1643/0045-8511(2007)7[478:HDAOLS]2.0.CO;2
Shoop, C., and Kenney, R. (1992). Seasonal distribution and abundances of loggerhead and leatherback sea turtles in waters of the Northeastern United States. Herpetol. Monogr. 6, 43–67. doi: 10.2307/1466961
Smolowitz, R., Haas, H., Milliken, H., Weeks, M., and Matzen, E. (2012). Using sea turtle carcasses to assess the conservation potential of a turtle excluder dredge. N. Am. J. Fish. Manage. 30, 993–1000. doi: 10.1577/M10-061.1
Smolowitz, R., Patel, S., Haas, H., and Miller, S. (2015). Using a remotely operated vehicle (ROV) to observe loggerhead sea turtle (Caretta caretta) behavior onforaging grounds off the mid-Atlantic United States. J. Exp. Mar. Bio. Ecol. 471, 84–91. doi: 10.1016/j.jembe.2015.05.016
Spotila, J., O'Connor, M., and Paladino, F. (1997). “Thermal biology,” in The Biology of Sea Turtles, eds P. L. Lutz and J. A. Music (CRC Press), 297–314.
Thomson, J., Cooper, A., Burkholder, D., Heithaus, M., and Dill, L. (2012). Heterogeneous patterns of availability for detection during visual surveys: spatiotemporal variation in sea turtle dive–surfacing behaviour on a feeding ground. Methods Ecol. Evol. 3, 378–387. doi: 10.1111/j.2041-210X.2011.00163.x
Thomson, J., Cooper, A., Burkholder, D., Heithaus, M., and Dill, L. (2013). Correcting for heterogeneous availability bias in surveys of long-diving marine turtles. Biol. Cons. 165, 154–161. doi: 10.1016/j.biocon.2013.06.005
Thomson, J. A., and Heithaus, M. R. (2014). Animal-borne video reveals seasonal activity patterns of green sea turtles and the importance of accounting for capture stress in short term biologging. J. Exp. Mar. Bio. Ecol. 450, 15–20.
Turtle Expert Working Group (2009). An Assessment of the Loggerhead Turtle Population in the Western North Atlantic Ocean. St. Petersburg, FL: NOAA Technical Memorandum NMFS-SEFSC-575.
Viera, A. J., and Garrett, J. M. (2005). Understanding interobserver agreement: the kappa statistic. Fam. Med. 37, 360–363.
Warden, M., Haas, H., Rose, K., and Richards, P. (2015). A spatially explicit population model of simulated fisheries impact on loggerhead sea turtles (Caretta caretta) in the Northwest Atlantic Ocean Ecol. Model. 299, 23–39. doi: 10.1016/j.ecolmodel.2014.11.025
Wilson, R., and McMahon, C. (2006). Measuring devices on wild animals: what constitutes acceptable practice? Front Ecol. Environ. 4:147–154. doi: 10.1890/1540-9295(2006)004[0147:MDOWAW]2.0.CO;2
Keywords: remotely operated vehicle, flipper beats, foraging, defecation, breathing, buoyancy, ethogram
Citation: Patel SH, Dodge KL, Haas HL and Smolowitz RJ (2016) Videography Reveals In-Water Behavior of Loggerhead Turtles (Caretta caretta) at a Foraging Ground. Front. Mar. Sci. 3:254. doi: 10.3389/fmars.2016.00254
Received: 21 July 2016; Accepted: 23 November 2016;
Published: 09 December 2016.
Edited by:
Graeme Clive Hays, Deakin University, AustraliaReviewed by:
Gail Schofield, Deakin University, AustraliaMark Hamann, James Cook University, Australia
Copyright © 2016 Patel, Dodge, Haas and Smolowitz. This is an open-access article distributed under the terms of the Creative Commons Attribution License (CC BY). The use, distribution or reproduction in other forums is permitted, provided the original author(s) or licensor are credited and that the original publication in this journal is cited, in accordance with accepted academic practice. No use, distribution or reproduction is permitted which does not comply with these terms.
*Correspondence: Samir H. Patel, spatel@cfarm.org