Potential Benefits and Shortcomings of Marine Protected Areas for Small Seabirds Revealed Using Miniature Tags
 Sara M. Maxwell
 Melinda G. Conners
 Nicholas B. Sisson
 Tiffany M. Dawson
- 1Department of Biological Sciences, Old Dominion University, Norfolk, VA, USA
- 2Center for the Science of Animal Care and Welfare, Chicago Zoological Society, Brookfield, IL, USA
Marine protected areas are considered important tools for protecting marine biodiversity, and animal tracking is a key way to determine if boundaries are effectively placed for protection of key marine species, including seabirds. We tracked chick-rearing brown noddies (Anous stolidus) from the Dry Tortugas National Park in Florida USA in 2016 using 1.8 g Nanofix GPS tags (n = 10), making this the first time this species has ever been tracked. We determined movement parameters, such as flight speed, distance traveled and home range, and how birds used a complex of marine protected areas including the Dry Tortugas National Park which is largely no-take (i.e., no fishing or extraction permitted), and the Florida Keys National Marine Sanctuary, of which two Ecological Reserves totaling 517.9 km2 are no-take. Birds remained largely within marine protected areas, with 91.3% of birds' locations and 58.8% of the birds' total home range occurring within the MPAs, and 79.2% of birds' locations and 18.2% of the birds' total home range within no-take areas. However, areas of probable foraging, indicated by locations where birds had high-residence time, were found within one of the MPAs only 64.7% of the time, and only 6.7% of those locations were in no-take areas. Birds traveled a mean straight line distance from the colony of 37.5 km, primarily using the region to the southwest of the colony where the shelf break and Loop Current occur. High-residence-time locations were found in areas of significantly higher sea surface temperature and closer to the shelf break than low residency locations. A sea surface temperature front occurs near the shelf edge, likely indicative of where Sargassum seaweed is entrained, providing habitat for forage species. Much of this region, however, falls outside the boundaries of the marine protected areas, and brown noddies and other species breeding in the Dry Tortugas may interact with fisheries via resource competition or discard foraging. The complex of marine protected areas in the region encompasses a large portion of the overall habitat for this small seabird species, however a large portion of the key foraging habitat fell outside the boundaries of the marine protected areas. This study highlights areas for potential management changes including the protection of additional areas, and the importance of advanced tracking technology for management of marine species.
Introduction
Marine protected areas, fishing management zones and other place-based protective measures rely on an understanding of how animals are using management areas to determine their placement and effectiveness. Satellite-based tracking in particular has been a key tool for determining the effectiveness of such management measures (Maxwell et al., 2011; Hart et al., 2013; Schofield et al., 2013). Tracking has played a key role in management of seabirds, for example by determining the effectiveness of marine protected areas (Anderson et al., 2003; Trebilco et al., 2008; Maxwell et al., 2013; Young et al., 2015; Lascelles et al., 2016) and determining fishery bycatch mitigation (Hyrenbach and Dotson, 2003; Cuthbert et al., 2005; Fischer et al., 2009). Thus, the ability to track a wide range of seabird species is critical for management of key species.
Satellite tracking technology has advanced rapidly in the last several decades giving unprecedented insights into the movements of a range of terrestrial and marine species around the globe (Godley et al., 2008; Hart and Hyrenbach, 2010; Costa et al., 2012; Hazen et al., 2012; Hussey et al., 2015; Hays et al., 2016). Despite this, our understanding of the fine-scale movements of many smaller species, particularly species such as seabirds that are reliant on efficient flight, has been limited by tag size (Burger and Shaffer, 2008; Hazen et al., 2012; Vandenabeele et al., 2012; Chivers et al., 2015). However, as tags continue to be miniaturized, doors open to understanding the movements and migrations of smaller species (Hallworth and Marra, 2015; Soanes et al., 2015), allowing tracking to be applied more broadly to place-based management and conservation.
A better understanding of the movement and ecology of the brown noddy (A. stolidus), a small tropical seabird, is critical for effective management. The brown noddy occurs globally in tropical waters and has a global population estimated at 180,000–1,100,000 individuals (BirdLife International, 2016). The brown noddy is also a species of concern for a number of management agencies, including the US National Park Service, US Fish and Wildlife Service and the US National Oceanic and Atmospheric Administration. Noddies have been impossible to track previously as adults weigh 140–170 g and are entirely reliant on efficient flight patterns for foraging. Only one study examines their potential foraging range by using radio telemetry (Harrison and Stone-Burner, 1981), however, this method is limited by where receiving towers are placed and thus full movement patterns cannot necessarily be determined. The only other studies to examine noddy foraging ranges are at-sea surveys (Surman and Wooller, 2003), however, because individuals cannot be followed and foraging must be directly observed, these studies provide limited insight. We do not know fundamental ecological parameters for the brown noddy, such as average foraging trip durations during different breeding phases, departure times, and when and where foraging occurs, though some limited studies exist (Watson, 1908; Harrison and Stone-Burner, 1981; Wolfe, 1989).
Studies aimed at understanding species movements and breeding ecology can answer many pertinent questions essential for management and conservation. In many instances, bird breeding colonies and areas surrounding breeding colonies are actively managed either in terrestrial refuges or at-sea via marine protected areas, or both (e.g., the US Pacific Remote Islands Marine National Monument; Maxwell and Morgan, 2013; Young et al., 2015). Thus, tracking studies can answer questions such as: How well do marine protected area boundaries encompass bird movements, especially during energetically costly times of year such as breeding? What environmental features might influence their movements? What anthropogenic activities (e.g., fishing, oil, and gas development) may impact birds during foraging and breeding?
In this study, we present the first ever movements of individual brown noddies, tracked from Dry Tortugas National Park (DRTO) in the Florida Keys, the only nesting colony of the brown noddy in the continental US. DRTO protects several small islands with multiple seabird colonies including a single large brown noddy breeding colony where egg-laying and incubation start in approximately March and extend until June, while chick rearing occurs from approximately April through September (Chardine and Morris, 1996). Additionally, DRTO protects 261.8 km2 area of at-sea habitat that is largely a no-take area and DRTO is also flanked by the Florida Keys National Marine Sanctuary (FKNMS), a multi-use area where commercial and recreational fishing is allowed, but which also includes two no-take areas (Dry Tortugas National Park, 2001) (Figure 1). In this study, we aimed to determine the extent to which the noddies use the complex of marine protected areas surrounding their colony, in addition to determining basic parameters related to the movement ecology of the brown noddy such as trip durations and arrival/departure times from nests. From limited information from other studies (e.g., Harrison and Stone-Burner, 1981; Surman and Wooller, 2003) we hypothesized noddies would have small foraging ranges with the majority of movements within the marine protected areas. We further explored the relationship between movements and key environmental features in the region, including the shelf break and the Loop Current. Diet studies have suggested that noddies forage on species frequently found in association with in Sargassum, a species of seaweed that is found in large concentrations in the Loop Current (Hensley and Hensley, 1995). Given these previous studies, the proximity of the shelf break and Loop Current to the breeding colony and their known productivity and entrainment properties, we hypothesized that these features would be important foraging destinations for brown noddies.
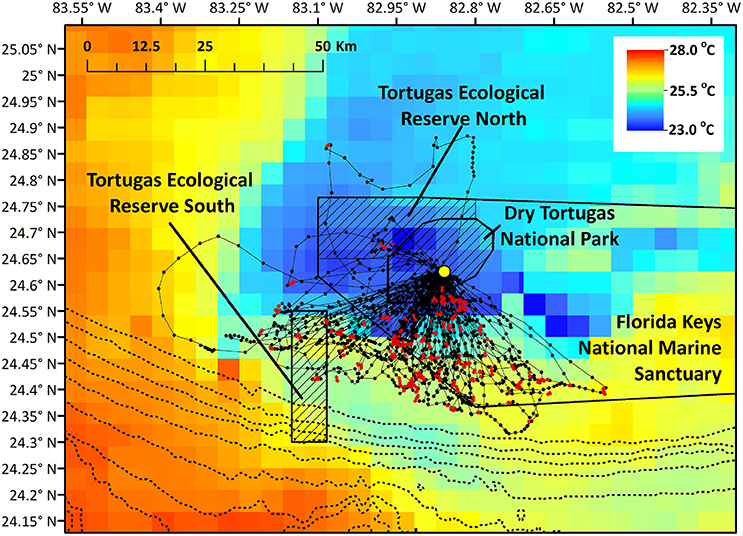
Figure 1. Brown noddy tracks in relation to marine protected areas near the breeding colony and in relation to sea surface temperature (°C). Red locations indicate locations where birds had high-residence time, while black locations indicate low-residence time locations. Hashed areas indicate no-take areas (Dry Tortugas National Park and the two Florida Keys National Marine Sanctuary Ecological Reserves), and the dotted line closest to the park indicates the 100 m bathymetry contour, and depth contours grow deeper by 100 m moving east to west. Yellow point indicates the nesting colony on Bush Key.
Methods
Ethics Statement
The animal use protocol for this research was reviewed and approved by the Institutional Animal Care and Use Committee at Old Dominion University (#866320-3). Procedures were approved under National Park Service Permit #DRTO-2016-SCI-006, and USGS Bird Banding Lab Permit #21780.
Study Area
We studied brown noddies breeding on Bush Key in Dry Tortugas National Park, Florida (24.62817°N, 82.86423°W) in May 2016 over a 7-day period (Table 1). DRTO is 261.8 km2, all of which does not allow commercial fishing, though recreational hook and line fishing is permitted in 53% of the park. DRTO is further surrounded by the Florida Keys National Marine Sanctuary (FKNMS), a 9844.5 km2 multi-use marine protected area that extends largely to the east and north of DRTO (Figure 1). Two no-take areas managed by the FKNMS occur near DRTO: The Tortugas Ecological Reserve North (312.1 km2; TER North) and South (205.8 km2; TER South; Figure 1). The TER North is directly adjacent to DRTO and protects a coral reef area known as Sherwood Forest. While TER South is not part of the contiguous marine protected area complex, it protects Riley's Hump, a bank and deep-reef terrace that has high abundance and biodiversity (Dry Tortugas National Park, 2001).
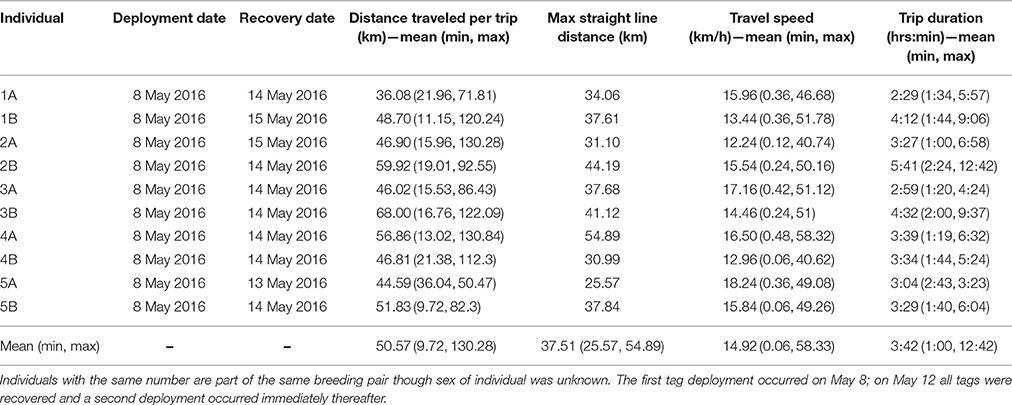
Table 1. Deployment and movement summary.
Tag Deployment
Brown noddies nest primarily in low shrubs; we captured individuals either by hand on their nests, or using a hand net. Altogether we marked and weighed five chick-rearing pairs (total of 10 birds) in close proximity to each other to facilitate simultaneous observation. Birds were marked with a combination of size number three butt-end aluminum bands (USGS Bird Banding Lab) and plastic color bands for easy visual distinction between mates, though sex of individual birds was not determined. Additionally, we attached Nanofix GPS (Pathtrack Ltd, West Yorkshire, UK) tags using waterproof Tesa tape (Tesa Tape Inc., Charlotte NC) to the back two tail feathers, 1–2 cm behind the uropygial or preening gland (Figure 2). Tags were 2.4 by 1.1 by 0.5 cm with a thin antenna extending 4.8 cmănd weighing 1.4 g waterproofed, approximately 1.16% of the average body weight of the tagged birds (157.8 g, range 138–170 g). Birds showed no sign of discomfort from the tags; no bill marks were observed on the tape or tags, nor were birds ever observed to make contact with tags (pecking at them, etc.) during our nearly continuous monitoring during daylight hours.
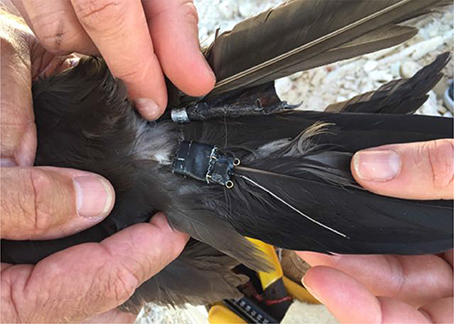
Figure 2. Nanofix GPS tag (Pathtrack Ltd, West Yorkshire, UK) attached to a brown noddy using Tesa tape (Tesa Tape Inc., Charlotte NC). Tags weighed 1.4 g fully waterproofed and were affixed to the back two tail feathers 1–2 cm behind the uropygial or preening gland. An aluminum butt-end band (USGS Bird Banding Lab) can also be seen the right leg above the GPS tag. Image credit: S. Maxwell.
We deployed tags in two rounds over the course of a week. During the first deployment, tags were programmed to transmit locations every 20 min and were deployed for ~4 days. When recovered after 4 days, we replaced the tags on the same birds, but we programmed the tags to transmit locations every 10 min and deployed the tags for ~2 days, resulting in ~6 days of continuous data between the two deployments. Total handling time for each deployment or recovery was ~5 min and never exceeded 10 min. We recovered all the tags successfully, and only one tag failed to record data, giving us a total sample size of 19 deployments for 10 birds. In addition to the GPS data, we visually recorded behavioral data of tagged individuals, including arrivals and departures from the colony; this occurred approximately every 15 min during daylight hours.
Track Analyses and Spatial Statistics
We determined basic movement parameters from tracking data including total distance traveled, straight line distance traveled for the longest track of each bird, travel speed, and arrival and departure times from nests and corresponding trip lengths. We conducted analyses using a combination of Matlab version 2013a (MathWorks Inc., Natick MA), ArcGIS version 10.3.1 (ESRI, Redlands CA) and R version 3.0.1 (R Core Team, 2003). Location intervals varied between the two deployments; as a result, tracks from the first deployment (20 min) were linearly interpolated to 10 min intervals using the “adehabitatLT” package in R (Calenge, 2006) so that that birds' locations occurred equally in time and the frequency of points did not bias subsequent analyses.
Home Range Analyses
To determine the area used by birds away from the colony, we conducted foraging home range analyses. We first removed points within 0.25 km of the colony so as not to bias analyses toward time at the colony (Gremillet et al., 2004). To determine if the dataset contained enough individuals to represent the majority of the home range (90% utilization distribution) for the entire population, we used custom tools in R to create a gridded utilization distribution home range (Maxwell et al., 2011), iteratively adding in individuals to see if home range size reached an asymptote (following, Soanes et al., 2013). We did this using 100 permutations for 1 through 10 tags, for a total of 1000 permutations. To visualize the overall home range for brown noddies, we used the kernel density functions in the “adehabitatHR” package (Calenge, 2006). We used the fixed kernel density (KD) estimation, applying custom parameters (number of grid intervals = 150, bandwidth = 0.015) (Silverman, 1986; Kernohan et al., 2001; Calenge, 2007), determining the 25, 50, and 95% utilization distribution (UD) across the entire population.
Residence Time
To determine areas where birds likely concentrated their foraging effort, we used residence time analysis provided in Barraquand and Benhamou (2008) (translated from Pascal to Matlab 2013a). Similar to first-passage time (Fauchald and Tveraa, 2003), residence time is a metric commonly used to classify foraging behavior in seabird tracking data by identifying regions of high use. It is a scale-dependent metric that imposes a virtual circle over each consecutive location, summing the time spent within the circle, both forward and backward along the track. The size of the virtual circle is user-defined and should be chosen with consideration of the biology and foraging behavior of the study species (Barraquand and Benhamou, 2008). The brown noddy is a small-bodied seabird and this study revealed relatively short foraging ranges (max distance from colony = 53.82 km; Table 1). Thus, we selected a relatively small radius (500 m) for our virtual circle, after first removing all locations within 5 km of the colony as birds are known to spend time there but not be foraging. The maximum number of steps allowed outside the virtual circle (see, Barraquand and Benhamou, 2008) was set to 24 steps (equivalent to 4 h). This represented the duration of an average foraging trip. Following Torres et al. (2011), we defined locations where birds had high-residence time as the top 25% quartile of all residence times; in our study this equated to between 25.5 and 137.9 min.
Departure and Maximum Range Headings
We determined both the heading at departure (measured as the angle from the colony to where the bird was first 5 km from the colony) and the heading to the maximum range of the foraging trip (measured as the angle from the colony to the location farthest from the colony) for each individual foraging trip. To visualize the relationship between trip heading and maximum distance traveled, we created rose plots in Matlab 2013a. We set the number of heading subdivisions (bins) to 10°. The length of each bin reflects the percentage of birds using that particular heading. Within each bin, colored subdivisions represent the magnitude of maximum range from the colony (color of subdivision) and the number of trips that fell into each subdivision of maximum range (length of subdivision).
Overlap with MPAs
We determined the number of locations per bird and the number of locations where birds had high-residence time per bird that fell within boundaries of (1) the Dry Tortugas National Park, (2) the Florida Keys National Marine Sanctuary, (3) no-take areas (a combination of DRTO and the two FKNMS Tortugas Ecological Reserves), and (4) unprotected waters; the number of locations is also equivalent to the amount of time as each location represented 10 min. To illustrate a more general picture of the overlap of the entire population with MPAs, we determined the percent of the total home range that fell into each of the four areas for both the core (50% UD) and total (95% UD) home range.
Influence of Environmental Features
A sharp drop off in the continental shelf, and the Loop Current, an extension of the Florida Current that later forms the Gulf Stream, both occur close to the nesting colony. During our study period, the Florida Current formed a distinct boundary near the shelf break with a marked change in sea surface temperature (SST) near the shelf break (see below). We determined the underlying SST as well as the distance to the 100 m shelf break for high- and low-residence time locations for each bird. To determine if locations where birds had high-residence time occurred closer to the shelf and in areas of higher SST than locations where birds had low-residence, we compared the metrics using a two-tailed Welch's t-test in R to account for unequal variances. Data was checked for normality, and bathymetry was square root transformed. Due to autocorrelation between points along the track increasing the likelihood of Type I error, we determined the effective sample size for distance to the shelf and SST for both high- and low-residence time locations by using the correlation coefficient (first order autocorrelation model) to adjust for sample size, resulting in a smaller sample size following Dawdy and Matalas (1964) and Young et al. (2015). Bathymetric data was downloaded from NOAA's National Center for Environmental Information 3 Arc-Second Coastal Relief Model Development (http://www.ngdc.noaa.gov/mgg/bathymetry/relief.html), modified to create contours by the Gulf of Mexico Coastal Ocean Observing System (http://gcoos.tamu.edu/). We used SST from the Visible and Infrared Imager/Radiometer Suite (VIIRS). We downloaded 4 km2 resolution 8-day composite SST (8-15 May 2016) from NOAA's Ocean Color website (NASA Goddard Space Flight Center, 2016; http://oceancolor.gsfc.nasa.gov/).
Results
Departures and arrivals occurred primarily during daylight hours and shortly before and after dusk and dawn. There were a greater number of departures from the colony earlier in the morning and a greater number of returns occurred in the late afternoon and early evening compared to other portions of the day (Figure 3). All birds consistently were on the colony during nighttime hours suggesting a largely diurnal foraging strategy. Mean travel speed across all birds was 14.92 km/h though speeds of 58.33 km/h were observed occasionally, usually when birds were returning to the colony (Table 1). Across all birds, the mean total trip distance traveled was 50.57 km over approximately 3.75 h, though we observed distances of 130.28 km and trip lengths of over 12 h.
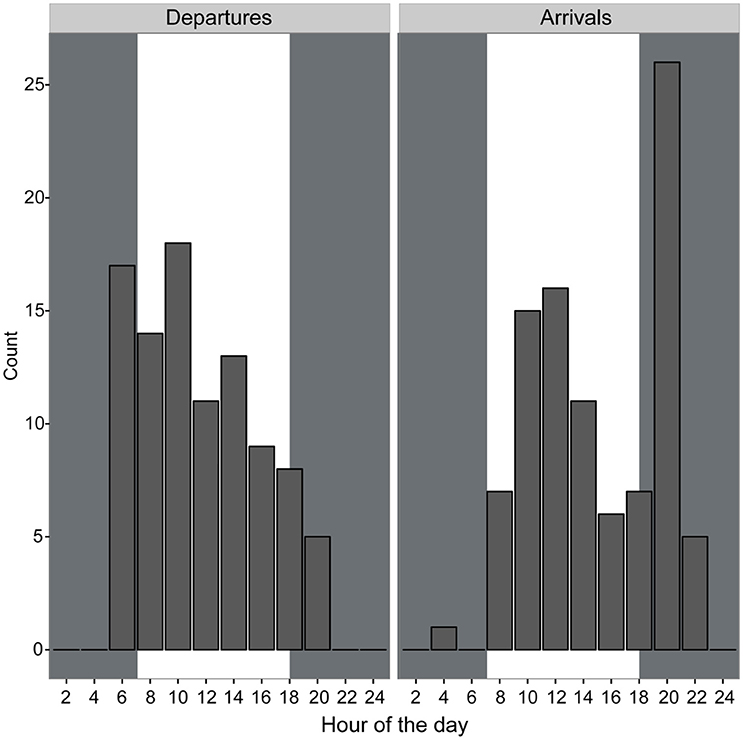
Figure 3. Departures and arrivals of brown noddies from the nests determined using GPS tracking data binned into 2-h intervals. Gray shaded areas indicate night; white shaded areas indicate daytime.
Mean straight line distance from the colony to the farthest point from the colony was 37.51 km and coincided with the area within approximately 5 km of the shelf break, and along the inner edge of the Loop Current (Figure 1). The use of this region is further supported by bird headings, in that birds' movements were directed toward this region (Figure 4). The majority of departures from the colony were to the south (Figure 4A). However, birds that traveled in a more southwesterly direction and directly to the shelf edge had the shortest average maximum ranges (19.50 km) compared to, for example, trips to the southeast (21.96 km) and trips to the west-southwest (29.98 km) (Figure 4B); at this heading, the shelf distance is at its closest (~30 km). This suggests that birds located foraging grounds in areas closer to the colony, as birds traveling directly southwest could reach the shelf by covering less distance. In this region, the continental shelf and high SST portions of the Loop Current are closest to the colony (Figure 1). Additionally, we found high-residence times throughout the entire area used by the birds, but high-residence locations were significantly closer to the shelf break than low-residence locations with a mean difference of 3.05 km [Figures 1, 5A; Welch's t-tests, p < 0.001, t(1446) = 6.91], and SST was significantly higher by a mean of 0.28°C for locations where birds had high-residence time [Figures 1, 5B; Welch's t-tests, p < 0.001, t(488) = −5.38].
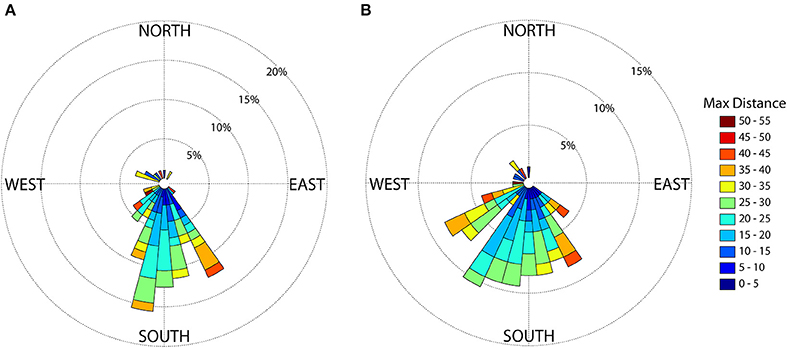
Figure 4. Brown noddy headings (A) at the approximate time of departure (5 km from the colony) and (B) from the colony to the maximum distance from the colony. The length of each 10 degree bin reflects the percentage of birds using that particular heading. Within each bin, colored subdivisions represent the maximum distance from the colony (in km) and the length of subdivisions represent the number of trips that fell into each subdivision of maximum distance from the colony.
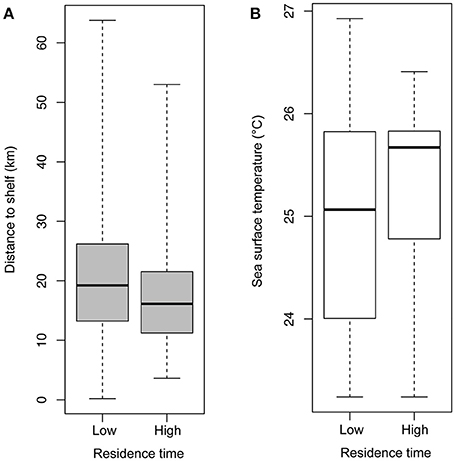
Figure 5. Box plots of (A) distance (km) to the 100 m shelf break for locations where birds had low- and high-residence time and (B) sea surface temperature (°C) for locations where birds had low- and high-residence time. Differences between both groups were significant, and data shown are untransformed.
Home range size reached an asymptote at ~6 individuals (Figure 6), and thus our sample size allowed for representation of the entire population during our specified study period. Birds were consistently found within the MPAs, with 91.3% of points found within one of the MPAs and 79.2% of locations within no-take areas (Table 2). Locations where birds had high-residence time were found within the MPAs only 64.7% of the time, with only 6.7% of locations found in no-take areas (Figure 1, Table 2). For home range analysis (kernel density analyses), 19.4% (63.0 km2) of the core home range (50% UD) was found within DRTO, 60.8% (197.6 km2) within the FLKNMS, 19.4% (63.0 km2) within no-take areas, and 19.9% (64.6 km2) outside of protected areas (Figure 7). At the 95% UD level, 9.2% (156.8 km2) was found within DRTO, 49.6% (847.9 km2) within the FLKNMS, 18.2% (311.2 km2) within no-take areas, and 41.2% (704.9 km2) outside of protected areas.
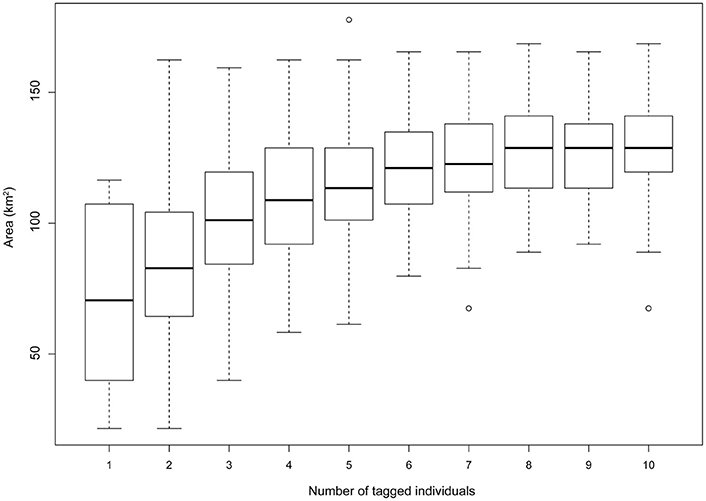
Figure 6. Home range size (km2) at the 90% UD contour as individuals are iteratively added to gridded UD home range calculations. 100 permutations were conducted across all potential number of individuals (1–10), for a total of 1000 permutations. An asymptote was reached after ~6 individuals indicating that our sample size of 10 individuals is likely representative of the larger population within our study period.
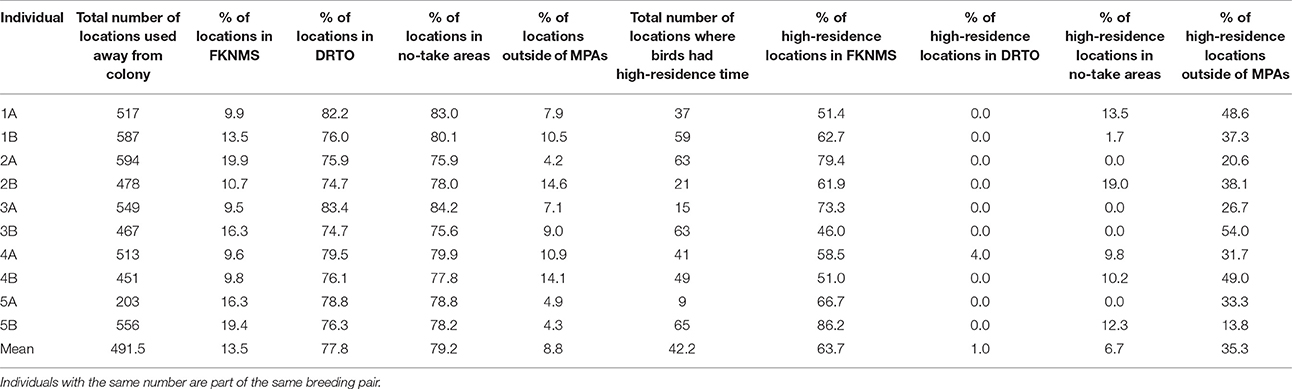
Table 2. Summary of use of the MPAs by individual for all locations recorded away from the colony and for locations where birds had high-residence time.
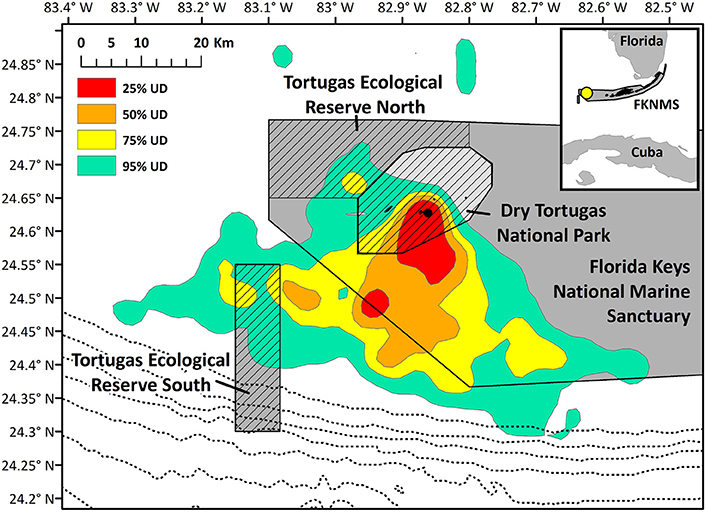
Figure 7. Kernel density home range of all noddy tracks. Hashed areas indicate no-take areas (Dry Tortugas National Park and the two Ecological Reserves), and the dotted line closest to the park indicates the 100 m contour, and depth contours grow deeper by 100 m moving east to west. The black point indicates the nesting colony on Bush Key.
Discussion
Use of Marine Protected Areas
Marine protected areas are a key tool for protection of biodiversity, habitats and species of importance (Roberts et al., 2002; Fox et al., 2012; Gormley et al., 2012; Klein et al., 2015). The only brown noddy colony in the continental US is found within one such complex of marine protected areas. These MPA boundaries encompass a large portion (between 60 and 90%) of the foraging range of the brown noddy during the chick-rearing period incorporated in our study. While birds are using the MPAs to a great extent, there are still opportunities to increase protections. Compared to all locations (91.2%), a smaller percentage (64.7%) of locations where birds had high-residence time—which indicate probable foraging areas—were found within the marine protected areas, and an even smaller percentage of locations where birds had high-residence time (6.7%) were found within no-take areas; thus large portions of likely important habitat are unprotected.
Potential Interactions with Commercial Fisheries
Commercial fisheries are permitted to operate beyond the boundaries of the DRTO and the Ecological Reserves of the FKNMS (including in the larger FKNMS), thereby overlapping with 20.8% of the total range of the brown noddy, and 93.3% of probable foraging areas (as indicated by locations where birds had high-residence time). Commercial fisheries in this region include shrimp trawling, trapping of spiny lobster and stone crab, and longline fishing, however our knowledge of fishery impacts on brown noddies in this region is limited. Noddies forage on a diversity of fish and squid species, including mackerels (Scombridae), halfbeaks (Hemiramphidae), and flying fish (Exocoetidae) (Hensley and Hensley, 1995). There are no reports of bycatch of brown noddies in fishing gear, but bycatch of species for which noddies forage is likely to be occurring, particularly with less discriminant fishing gear. Shrimp trawling in particular has high rates and diversity of bycatch; Nance et al. (1997) reports bycatch of mackerels elsewhere in the Gulf of Mexico along with a suite of other forage fish species, some of which are known to be prey of brown noddies. Cury et al. (2011) identify that an important management strategy includes protecting foraging resources; this is likely the most critical near to the colonies and during energetically costly times of the year such as chick-rearing.
Noddies have also been observed foraging on discards from commercial fisheries, particularly shrimp trawl fisheries (Oron Bass, personal observation). Hensley and Hensley (1995) reported the occurrence of three fish species (Lonchopisthus micrognathus, Bollmannia boqueronensis, and Diplectrum spp.) known as deep-water reef species in noddy diets. As noddies are unable to dive, and these species are never reported on the surface, they concluded the birds took these fish species from shrimp trawl discards as they are known bycatch species in this fishery. Thus, while MPAs in this region generally provide excellent coverage of brown noddy foraging areas, if protection of noddy foraging resources is a goal, managers should consider prohibiting fishing activities within additional parts of the MPAs. Prohibitions could be focused on particularly energetically important times of the year for noddies, such as breeding, and/or in regions where noddies focus foraging effort, such as the shelf break and Loop Current.
Influence of Environmental Features
Important areas for brown noddies included the region near the continental shelf and adjacent to the Loop Current. Locations where birds had high-residence time were found in significantly higher SST regions of the Loop Current (Figures 1, 5B). Additionally, brown noddies whose trips were directed to high SST regions of the Loop Current had shorter maximum trip distances (Figure 4), indicating a high likelihood of successful foraging in those areas. Diet studies of this species have previously suggested that the brown noddy likely uses the Loop Current region (Hensley and Hensley, 1995). Noddies fed primarily on species considered to be pelagic, and found in association with Sargassum, the dominant genus of seaweed that concentrates within the frontal region of the Loop Current during this time of year (Dooley, 1972). Sargassum flows from the Gulf of Mexico into the Gulf Stream via the Loop Current in the late spring and summer of each year, when noddies are breeding in the region (Gower and King, 2011). Other species have been shown to rely on the species that concentrate in Sargassum, particularly tunas such as albacore and dolphin fish (Coryphaena hippurus) [summarized in (Hensley and Hensley, 1995)]. This is of particular note as the brown noddy associates with large-bodied schooling fish such as tunas by way of “subsurface predator facilitated foraging” (Ashmole and Ashmole, 1967; Maxwell and Morgan, 2013). These larger fish species drive forage fish to the surface, making them available for noddies and a variety of other seabirds. This interaction is particularly critical to species such as the brown noddy that do not possess diving capabilities. Rather, they “patter” on the water's surface as they dip for prey near the water-air interface (Harrison et al., 1983). The frontal boundary provided by the current and the influence of the shelf break likely provide both an increase in productivity and entrainment of prey for both noddies and subsurface predators such as tuna that noddies feed in association with (Hensley and Hensley, 1995).
Application of Miniature Satellite Tags
In this study, we applied the currently smallest available tag (1.4 g) to track seabirds. Prior to this study, available tags were too large to deploy without potentially significant harm to flight capabilities. The development of smaller tracking devices that are also lower in cost, is allowing for a greater understanding and associated management of small-bodied bird populations. Prior to appropriate technological advances, monitoring of such species could only be done at-sea. This type of monitoring can be costly and also has severe limitations, such as the inability to distinguish individuals or understand movements and behaviors beyond the observed area. Pathtrack NanoFix GPS tags cost approximately USD 450, store up to 320 locations and can be reused (if tags are recovered), allowing for inexpensive monitoring through time. Through the use of miniature tags, we were able to reveal previously unknown important conservation and ecological traits of this species.
Conclusions
While this was a relatively short-term study, it provided extensive insights into the ecology and management of a relatively cryptic small-bodied seabird species. Our goal was to conduct a pilot study to determine movement parameters for a never-before-tagged species, to test the appropriateness of relatively new tag technology, and to apply these insights to conservation and management of brown noddies. Going forward, we aim to continue long-term monitoring of this species using satellite tracking across different breeding stages, as well as integrating stable isotopes and diet sampling to understand potential overlaps with fishing in the region and to monitor how diets may change as a result of changes in regional productivity. Of additional importance is understanding not just how this population uses the marine protected areas in the region, but how other species of concern which also support the ecological structure of the region (e.g., sea turtles, sharks, lobsters, fishes) use the park boundaries and zones (Hart et al., 2012, 2013). Future work will aim to interface with studies on other species to understand ecosystem level effectiveness of the marine protected areas in the region.
Author Contributions
All authors designed the study, drafted, and revised the manuscript. SM, MC, NS, and TD conducted the research. SM, MC, and NS conducted analyses. All authors gave final approval of the version to be published and agree to be accountable for all aspects of the work.
Funding
Funding was provided by Old Dominion University.
Conflict of Interest Statement
The authors declare that the research was conducted in the absence of any commercial or financial relationships that could be construed as a potential conflict of interest.
Acknowledgments
We gratefully acknowledge the National Park Service Dry Tortugas National Park staff, particularly Glen Simpson, Kayla Nimmo, Tree Gottshall, and the staff of the Yankee Freedom without whom this work would not have been possible. We are grateful to Sonny Bass and Ryan Huang for field assistance, Matthew Witt for assistance with remotely-sensed data, Stuart Pimm, Brenda and Scott Hutton for logistical support, Gary Bodin at Pathtrack Ltd for assistance with tag programming, and Rachael Orben, Beth Flint and the Pacific Seabird Group for tagging advice.
References
Anderson, D. J., Huyvaert, K. P., Wood, D. R., Gillikin, C. L., Frost, B. J., and Mouritsen, H. (2003). At-sea distribution of waved albatrosses and the Galapagos Marine Reserve. Biol. Conserv. 110, 367–373. doi: 10.1016/s0006-3207(02)00238-0
Ashmole, N., and Ashmole, M. (1967). Comparative feeding ecology of sea bird of a tropical oceanic island. Peabody Mus. Nat. Hist. Bull. 24, 1–131.
Barraquand, F., and Benhamou, S. (2008). Animal movements in heterogeneous landscapes: identifying profitable places and homogeneous movement bouts. Ecology 89, 3336–3348. doi: 10.1890/08-0162.1
BirdLife International (2016). Species Factsheet: Anous Stolidus. Available online at: http://www.birdlife.org
Burger, A., and Shaffer, S. A. (2008). Perspectives in Ornithology: application of tracking anddata-logging technology in research and conservation of seabirds. Auk 125, 253–264. doi: 10.1525/auk.2008.1408
Calenge, C. (2006). The package adehabitat for the R software: a tool for the analysis of space and habitat use by animals. Ecol. Modell. 197, 516–519. doi: 10.1016/j.ecolmodel.2006.03.017
Calenge, C. (2007). Exploring habitat selection by wildlife with adehabitat. J. Stat. Softw. 22, 1–19. doi: 10.18637/jss.v022.i06
Chardine, J. W., and Morris, R. D. (1996). “Brown noddy (Anous stolidus),” in The Birds of North America Online, ed A. Poole (Ithaca: Cornell Lab of Ornithology).
Chivers, L. S., Hatch, S. A., and Elliott, K. H. (2015). Accelerometry reveals an impact of short-term tagging on seabird activity budgets. Condor 118, 159–168. doi: 10.1650/CONDOR-15-66.1
Costa, D. P., Breed, G. A., and Robinson, P. W. (2012). New insights in pelagic migrations: implications for ecology and conservation. Annu. Rev. Ecol. Syst. 43, 73–96. doi: 10.1146/annurev-ecolsys-102710-145045
Cury, P. M., Boyd, I. L., Bonhommeau, S., Anker-Nilssen, T., Crawford, R. J. M., Furness, R. W., et al. (2011). Global seabird response to forage fish depletion-one-third for the birds. Science 334, 1703–1706. doi: 10.1126/science.1212928
Cuthbert, R., Hilton, G., Ryan, P., and Tuck, G. N. (2005). At-sea distribution of breeding Tristan albatrosses Diomedea dabbenena and potential interactions with pelagic longline fishing in the South Atlantic Ocean. Biol. Conserv. 121, 345–355. doi: 10.1016/j.biocon.2004.05.007
Dawdy, D. R., and Matalas, N. C. (1964). “Statistical and probability analysis of hydrologic data, part III: analysis of variance, covariance and time series,” in Handbook of Applied Hydrology, A Compendium of Water-Resources Technology, ed V. T. Chow (New York, NY: McGraw-Hill Book Company), 868–890.
Dooley, J. K. (1972). Fishes associated with the pelagic sargassum complex with a discussion of the sargassum community. Contrib. Mar. Sci. Univ. Texas 16, 1–32.
Dry Tortugas National Park (2001). General Management Plan Ammendment. (Homestead, FL: US National Park Service), 104.
Fauchald, P., and Tveraa, T. (2003). Using first-passage time in the analysis of area-restricted search and habitat selection. Ecology 84, 282–288. doi: 10.1890/0012-9658(2003)084[0282:UFPTIT]2.0.CO;2
Fischer, K. N., Suryan, R. M., Roby, D. D., and Balogh, G. R. (2009). Post-breeding season distribution of black-footed and Laysan albatrosses satellite-tagged in Alaska: inter-specific differences in spatial overlap with North Pacific fisheries. Biol. Conserv. 142, 751–760. doi: 10.1016/j.biocon.2008.12.007
Fox, H. E., Mascia, M. B., Basurto, X., Costa, A., Glew, L., Heinemann, D., et al. (2012). Reexamining the science of marine protected areas: linking knowledge to action. Cons. Lett. 5, 1–10. doi: 10.1111/j.1755-263X.2011.00207.x
Godley, B., Blumenthal, J., Broderick, A., Coyne, M., Godfrey, M., Hawkes, L., et al. (2008). Satellite tracking of sea turtles: where have we been and where do we go next? Endanger. Species Res. 4, 3–22. doi: 10.3354/esr00060
Gormley, A. M., Slooten, E., Dawson, S., Barker, R. J., Rayment, W., du Fresne, S., et al. (2012). First evidence that marine protected areas can work for marine mammals. J. Appl. Ecol. 49, 474–480. doi: 10.1111/j.1365-2664.2012.02121.x
Gower, J. F., and King, S. A. (2011). Distribution of floating Sargassum in the Gulf of Mexico and the Atlantic Ocean mapped using MERIS. Int. J. Remote Sens. 32, 1917–1929. doi: 10.1080/01431161003639660
Gremillet, D., Dell'Omo, G., Ryan, P. G., Peters, G., Ropert-Coudert, Y., and Weeks, S. J. (2004). Offshore diplomacy, or how seabirds mitigate intra-specific competition: a case study based on GPS tracking of Cape gannets from neighbouring colonies. Mar. Ecol. Prog. Ser. 268, 265–279. doi: 10.3354/meps268265
Hallworth, M. T., and Marra, P. P. (2015). Miniaturized GPS tags identify non-breeding territories of a small breeding migratory songbird. Sci. Rep. 5:11069. doi: 10.1038/srep11069
Harrison, C. S., and Stone-Burner, D. L. (1981). Radiotelemetry of the brown noddy in Hawaii. J. Wildl. Manag. 45, 1021–1025.
Harrison, C. S., Hida, T. S., and Seki, M. P. (1983). Hawaiian seabird feeding ecology. Wildl. Monogr. 85, 1–71.
Hart, K. M., Sartain, A. R., Fujisaki, I., Pratt, H. L., Morley, D., and Feeley, M. W. (2012). Home range, habitat use, and migrations of hawksbill turtles tracked from Dry Tortugas National Park, Florida, USA. Mar. Ecol. Prog. Ser. 457, 193–207. doi: 10.3354/meps09744
Hart, K. M., Zawada, D. G., Fujisaki, I., and Lidz, B. H. (2013). Habitat use of breeding green turtles Chelonia mydas tagged in Dry Tortugas National Park: making use of local and regional MPAs. Biol. Conserv. 161, 142–154. doi: 10.1016/j.biocon.2013.03.019
Hart, K., and Hyrenbach, K. D. (2010). Satellite telemetry of marine megavertebrates: the coming of age of an experimental science. Endanger. Species Res. 10, 9–20. doi: 10.3354/esr00238
Hays, G. C., Ferreira, L. C., Sequeira, A. M., Meekan, M. G., Duarte, C. M., Bailey, H., et al. (2016). Key questions in marine megafauna movement ecology. Trends Ecol. Evol. 31, 463–475. doi: 10.1016/j.tree.2016.02.015
Hazen, E. L., Maxwell, S. M., Bailey, H., Bograd, S. J., Hamann, M., Gaspar, P., et al. (2012). Ontogeny in marine tagging and tracking science: technologies and data gaps. Mar. Ecol. Prog. Ser. 457, 221–240. doi: 10.3354/meps09857
Hensley, V. I., and Hensley, D. A. (1995). Fishes eaten by sooty terns and brown noddies in the Dry Tortugas, Florida. Bull. Mar. Sci. 56, 813–821.
Hussey, N. E., Kessel, S. T., Aarestrup, K., Cooke, S. J., Cowley, P. D., Fisk, A. T., et al. (2015). Aquatic animal telemetry: a panoramic window into the underwater world. Science 348:1255642. doi: 10.1126/science.1255642
Hyrenbach, K. D., and Dotson, R. C. (2003). Assessing the susceptibility of female black-footed albatross (Phoebastria nigripes) to longline fisheries during their post-breeding dispersal: an integrated approach. Biol. Conserv. 112, 391–404. doi: 10.1016/s0006-3207(02)00337-3
Kernohan, B., Gitzen, R. A., and Millspaugh, J. (2001). “Analysis of animal space use and movements,” in Radio Tracking and Animal Populations, eds J. Millspaugh and J. Marzluff (San Diego, CA: Academic Press), 126–168.
Klein, C. J., Brown, C. J., Halpern, B. S., Segan, D. B., McGowan, J., Beger, M., et al. (2015). Shortfalls in the global protected area network at representing marine biodiversity. Sci. Rep. 5:17539. doi: 10.1038/srep17539
Lascelles, B. G., Taylor, P. R., Miller, M. G. R., Dias, M. P., Oppel, S., Torres, L., et al. (2016). Applying global criteria to tracking data to define important areas for marine conservation. Divers. Distrib. 22, 422–431. doi: 10.1111/ddi.12411
Maxwell, S. M., and Morgan, L. E. (2013). Facilitated foraging of seabirds on pelagic fishes: implications for management of pelagic marine protected areas. Mar. Ecol. Prog. Ser. 481, 289–303. doi: 10.3354/meps10255
Maxwell, S. M., Breed, G. A., Nickel, B. A., Makanga-Bahouna, J., Pemo-Makaya, E., Parnell, R. J., et al. (2011). Using satellite tracking to optimize protection of long-lived marine species: olive ridley sea turtle conservation in Central Africa. PLoS ONE 6:e19905. doi: 10.1371/journal.pone.0019905
Maxwell, S. M., Hazen, E. L., Bograd, S. J., Halpern, B. S., Breed, G. A., Nickel, B., et al. (2013). Cumulative human impacts on marine predators. Nat. Commun. 4, 2688. doi: 10.1038/ncomms3688
Nance, J., Scott-Denton, E., Martinez, E., Watson, J., Shah, A., and Foster, D. (1997). Bycatch in the Southeast Shrimp Trawl Fishery. Miami, FL: National Marine Fisheries Service; Southeast Fisheries Science Center.
NASA Goddard Space Flight Center (2016). VIIRS-NPP Cholorophyll-a Concentration, OCI Algorithm. Ocean Biology Processing Group.
R Core Team (2003). R: A Language and Environment for Statistical Computing. Vienna: R Foundation for Statistical Computing. Available online at: http://www.R-project.org/
Roberts, C. M., McClean, C. J., Veron, J. E., Hawkins, J. P., Allen, G. R., McAllister, D. E., et al. (2002). Marine biodiversity hotspots and conservation priorities for tropical reefs. Science 295, 1280–1284. doi: 10.1126/science.1067728
Schofield, G., Scott, R., Dimadi, A., Fossette, S., Katselidis, K. A., Koutsoubas, D., et al. (2013). Evidence-based marine protected area planning for a highly mobile endangered marine vertebrate. Biol. Conserv. 161, 101–109. doi: 10.1016/j.biocon.2013.03.004
Silverman, B. W. (1986). Density Estimation for Statistics and Data Analysis. Boca Raton, FL: CRC Press.
Soanes, L. M., Arnould, J. P. Y., Dodd, S. G., Sumner, M. D., and Green, J. A. (2013). How many seabirds do we need to track to define home-range area? J. Appl. Ecol. 50, 671–679. doi: 10.1111/1365-2664.12069
Soanes, L. M., Bright, J. A., Brodin, G., Mukhida, F., and Green, J. A. (2015). Tracking a small seabird: first records of foraging behaviour in the Sooty Tern Onychoprion fuscatus. Mar. Ornithol. 43, 235–239.
Surman, C. A., and Wooller, R. D. (2003). Comparative foraging ecology of five sympatric terns at a sub-tropical island in the eastern Indian Ocean. J. Zool. 259, 219–230. doi: 10.1017/S0952836902003047
Torres, L. G., Thompson, D. R., Bearhop, S., Votier, S., Taylor, G. A., Sagar, P. M., et al. (2011). White-capped albatrosses alter fine-scale foraging behavior patterns when associated with fishing vessels. Mar. Ecol. Prog. Ser. 428, 289–301. doi: 10.3354/meps09068
Trebilco, R., Gales, R., Baker, G. B., Terauds, A., and Sumner, M. D. (2008). At sea movement of Macquarie Island giant petrels: relationships with marine protected areas and regional fisheries management organisations. Biol. Conserv. 141, 2942–2958. doi: 10.1016/j.biocon.2008.07.027
Vandenabeele, S. P., Shepard, E. L., Grogan, A., and Wilson, R. P. (2012). When three per cent may not be three per cent; device-equipped seabirds experience variable flight constraints. Mar. Biol. 159, 1–14. doi: 10.1007/s00227-011-1784-6
Wolfe, C. A. (1989). Growth of the Brown Noddy (Anous srolidirs) in the Dry Tortugas (Florida). Master of Science, Florida Atlantic University.
Keywords: brown noddy, fisheries, GPS tracking, home range, loop current, residence time, spatial management, satellite tracking
Citation: Maxwell SM, Conners MG, Sisson NB and Dawson TM (2016) Potential Benefits and Shortcomings of Marine Protected Areas for Small Seabirds Revealed Using Miniature Tags. Front. Mar. Sci. 3:264. doi: 10.3389/fmars.2016.00264
Received: 03 September 2016; Accepted: 29 November 2016;
Published: 15 December 2016.
Edited by:
Ellen Hines, San Francisco State University, USAReviewed by:
Rochelle Diane Seitz, Virginia Institute of Marine Science, USAJohn A. Cigliano, Cedar Crest College, USA
Copyright © 2016 Maxwell, Conners, Sisson and Dawson. This is an open-access article distributed under the terms of the Creative Commons Attribution License (CC BY). The use, distribution or reproduction in other forums is permitted, provided the original author(s) or licensor are credited and that the original publication in this journal is cited, in accordance with accepted academic practice. No use, distribution or reproduction is permitted which does not comply with these terms.
*Correspondence: Sara M. Maxwell, smaxwell@odu.edu